Ultrasound-enhanced mass transfer during single-bubble diffusive growth
Abstract
Ultrasound is known to enhance surface bubble growth and removal in catalytic and microfluidic applications, yet the contributions of rectified diffusion and microstreaming phenomena towards mass transfer remain unclear. We quantify the effect of ultrasound on the diffusive growth of a single spherical CO2 bubble growing on a substrate in supersaturated water. The time dependent bubble size, shape, oscillation amplitude and microstreaming flow field are resolved. We show and explain how ultrasound can enhance the diffusive growth of surface bubbles by up to two orders of magnitude during volumetric resonance. The proximity of the wall forces the bubble to oscillate non-spherically, thereby generating vigorous streaming during resonance that results in convection-dominated growth.
I Introduction
Ultrasound application is a promising intensification technology with the ability to improve the energy efficiency of electrochemical reactions by promoting bubble detachment from the catalyst surface Li et al. (2009), accelerate liquid degassing through cavitation Kapustina (1965) or enhance mass transfer processes in gas–liquid micro-sono-reactors Dong et al. (2015). From a detrimental aspect, gas diffusion across ultrasound-driven microbubbles employed in biomedical acoustic therapies and diagnostics Coussios and Roy (2008) may substantially alter the bubble size O’Brien et al. (2013) or longevity Bader and Bollen (2018). Similarly, oscillating bubbles driving microfluidic applications Hashmi et al. (2012) or sonochemical reactions Fernandez Rivas et al. (2012) are generally surrounded by non-degassed liquids and unwanted mass transfer effects may become significant during continued ultrasonic operation Iida et al. (2007).
A gas bubble undergoing volume oscillations in a liquid–gas solution experiences a mass transfer enhancement that is believed to result from two phenomena. The first is rectified diffusion Eller and Flynn (1965), consequence of the asymmetries in the mass transfer rate across the bubble during the expansion and compression half-cycles, generally favoring growth. The second is acoustic microstreaming Elder (1959), a second-order (in driving amplitude) steady flow driven by non-spherical bubble oscillations Marmottant et al. (2006a). Microstreaming essentially renews the gas content of the liquid in contact with the bubble Church (1988).
The ultrasound-enhanced growth of gas bubbles attached to surfaces remains a poorly studied subject. Surface bubbles always oscillate non-spherically, unavoidably giving rise to microstreaming. Consequently, the classical theories of rectified diffusion Crum (1984); Fyrillas and Szeri (1994); Brenner et al. (2002) are no longer applicable, and the mass transfer process remains unclear. In this work, we conduct unprecedented experiments that quantify the effect of ultrasound on the diffusive growth of a single monocomponent surface bubble in supersaturated water. To fully capture the physics, we resolve both bubble dynamics and streaming flow field as the bubble overgrows its resonant size.
The diffusive growth rate of an unperturbed bubble is best quantified by the Jakob number for mass diffusion Szekely and Martins (1971); Prosperetti (2017), , where is the mass concentration of dissolved gas in the ambient liquid, the saturation mass concentration at the bubble surface, and the density of gas in the bubble. For small Laplace pressures, Ja can be assumed independent of the bubble size; if so, Ja strictly represents the product of the degree of supersaturation (, the driving force) and the dimensionless Henry solubility (, the growth-rate amplifier).
Previous experimental studies are mostly constrained to isolated air (multicomponent) bubbles in water under (close to) saturation conditions (, ) Eller (1969); Gould (1974); Crum (1980); Lee et al. (2005); Leong et al. (2010, 2011). Such bubbles slowly dissolve due to surface tension, unless sonicated above a certain threshold amplitude. Kapustina Kapustina (1973) exceptionally studied the growth of air bubbles on a needle in water notably supersaturated with air (, ). In contrast, our experiments are performed at larger . All studies Eller (1969); Gould (1974); Crum (1980); Lee et al. (2005); Leong et al. (2010, 2011); Kapustina (1973) coincide in that the appearance of shape oscillations is often accompanied by vigorous streaming and enhanced rates of mass transfer.
II Experimental set-up
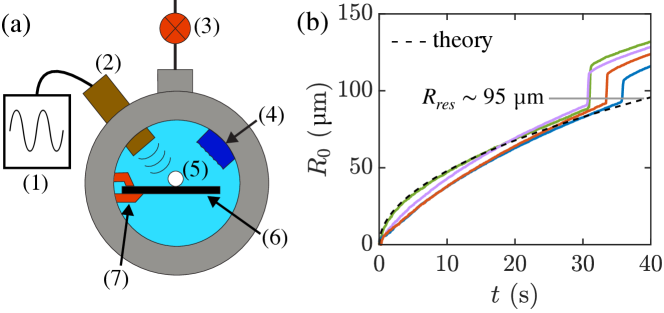
The experimental set-up is sketched in Fig. 1(a). A pressurized tank ( bar) is first filled with carbonated water saturated at the same pressure, which is subsequently lowered to bar. Consequently, the solution becomes supersaturated (, nominal ) and a single CO2 bubble spontaneously nucleates and grows from a hydrophobic cavity (20 m diameter) etched on an otherwise hydrophilic silicon substrate. The bubble keeps growing until detachment. Meanwhile, a transducer (Benthowave BII-7501/50) constantly generates ultrasound waves of frequency kHz. The pressure amplitude was kept constant throughout the lifetime of a given bubble but was varied (nominal values ranging 2–12 kPa) between experiments. Unfortunately, the exact driving amplitude transmitted to the bubble remained uncertain since it was uncontrollably weakened by a substantial number of parasitic bubbles that formed on the transducer surface, in addition to the likely formation of standing waves within the experimental tank.
III Growth dynamics
The bubble-growth process was captured by a high-speed camera (Photron SA-Z) at 1000 fps. As seen in Fig. 1(b), the ambient bubble radius (defined as the mean sphere-equivalent radius about which the bubble oscillates) grows by diffusion until it approaches the resonant size. The early growth dynamics are well predicted by the classical Epstein–Plesset theory for diffusive growth Epstein and Plesset (1950) despite some deviations which can be attributed to perturbations in the initial condition of the concentration field Peñas-López et al. (2017). Taking into account the presence of the substrate, the asymptotic solution reads Enríquez et al. (2014)
| (1) |
where m2/s is the mass diffusivity of CO2 in water. The effect of surface tension (crucial in equilibrated solutions) has been neglected by virtue of the relatively strong supersaturation. The value of used in Fig. 1(b) is smaller than the nominal value, consequence of the considerable degassing effect Kapustina (1965, 1973); Moreno Soto et al. (2017) of continuous ultrasonic operation.
During resonance, the growth rate deviates and strikingly increases by up to two orders of magnitude. Once the bubble outgrows resonance, it continues growing diffusively until detaching at m Moreno Soto et al. (2017). Immediate detachment during resonance was otherwise observed for higher acoustic amplitudes.
Ignoring the effect of surface tension, the natural frequency of a spherical surface bubble is given by Overvelde et al. (2010); Xi et al. (2014)
| (2) |
One may check that is precisely equal to the driving frequency when the bubble attains the resonant size of –95 m. Here, is the water density and is the polytropic exponent. The bubbles are expectedly adiabatic at resonance (), given that and Prosperetti (1977), where and denote the thermal diffusivities of the gas inside the bubble (CO2) and the surrounding liquid (water) respectively. Neglecting surface tension on is justified since when resonance occurs.
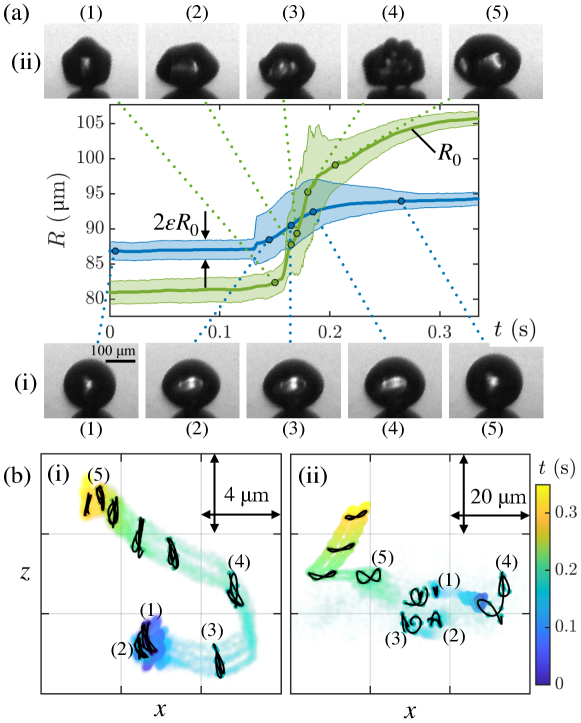
To obtain more insight into the bubble dynamics, we record the bubble oscillating at resonance at 200,000 fps (4 frames per oscillation cycle). Owing to the proximity of the wall, the volumetric oscillations of the bubble occur concurrently with translational oscillations of its center of mass Marmottant et al. (2006b). At low acoustic amplitudes or sufficiently far from resonance, perturbations are weak and follow the “Narcissus” effect Marmottant et al. (2006b): Translational oscillations occur mainly in the vertical direction perpendicular to the wall [Fig. 2(b), panel (i)]. The snapshots of bubble (i) in Fig. 2(a) evidence the oblate shape that the bubble assumes during the expansion half-cycle Lajoinie et al. (2018).
Stronger driving pressure amplitudes do not only increase the volumetric oscillation amplitudes, but also lead to a rich variety of surface modes [Fig. 2(a), bubble (ii)]. The latter occur only during resonance, since the threshold amplitude for shape instability is precisely minimal at the volumetric resonance size Versluis et al. (2010). Lamb’s classical expression Lamb (1895); Versluis et al. (2010) predicts the most unstable surface mode at m to be , in agreement with our experimental observations [snapshot (ii-1)]. Furthermore, the center of mass undergoes extensive translations, presumably in all directions Tho et al. (2007). It is seen that the center-of-mass oscillations [Fig. 2(b), panel (ii)], albeit heterogeneous in time, have a predominant horizontal component. A -shaped signature was commonly found.
The (dimensionless) volumetric oscillation amplitudes normalized by at the moment of maximum growth are , i.e., four times larger, at best, than those of the linear oscillations observed immediately before or after resonance (typically ), whereas the growth rates can easily differ by two orders of magnitude. It is evident from Fig. 2(a) that a larger and the onset of surface modes are clearly associated with a faster bubble growth rate (). However, these findings cannot be explained by rectified diffusion alone: Substituting these values of into a model adapted from Crum (1984) results in an underestimation of the order of magnitude of the observed maximum growth rate (see Supplemental Material). According to the model, the increment in the growth rate that rectification offers is small relative to the already large diffusive growth rate. Rectified diffusion therefore remains a non-critical and subdominant mechanism to both (i) the unperturbed diffusive mass transfer away from resonance, and (ii) the microstreaming-enhanced mass transfer during resonance. We stress that condition (i) applies by virtue of the strong level of supersaturation in the liquid: The rectified diffusion enhancement offered by the modest acoustic amplitudes applied is small compared to the fast diffusive growth. In contrast, in a gas-equilibrated solution (i.e., at a very low super- or under-saturation) the same amount of mass rectification would become critical and comparatively very significant. Note that the horizontal translations suffered by the bubble during resonance, while important, also remain a second order factor in the total mass transfer increase as compared to the effect of microstreaming.
IV Microstreaming
Microstreaming must therefore be the leading-order contributor to the magnitude of maximum during resonance. This hypothesis was verified in further experiments where 0.43 ml/l of neutrally buoyant 3-m polystyrene latex beads (Sigma-Aldrich) were added to the solution. The streaming flow field generated as the bubble grows through resonance was visualized by means of particle tracking velocimetry Bolaños-Jiménez et al. (2017); images were recorded at 1000 fps. The particle velocities measured during three distinct phases for a particular experiment (provided as a supplementary movie) are shown in Fig. 3. In each of the fifteen streaming experiments that were conducted, a qualitatively identical streaming behavior was observed.
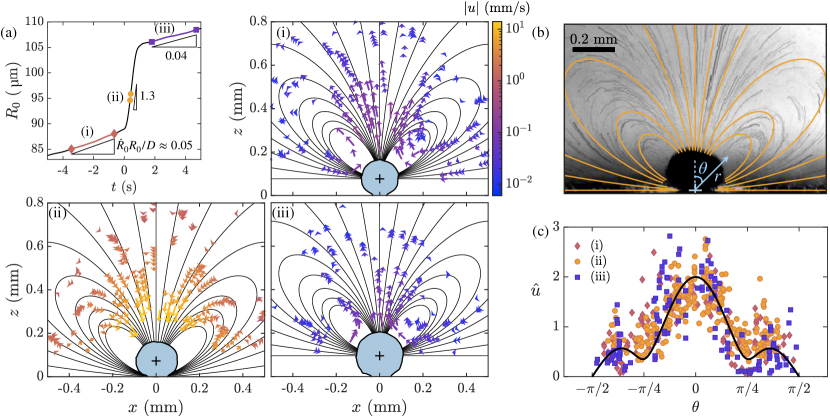
Immediately before resonance [phase (i)], the bubble undergoes weak volumetric and vertical translation oscillations [cf. Fig. 2, bubble (i)]. We observe weak ‘fountain mode’ streaming [Fig. 3(a), panel (i)], generically reported in similar microbubble streaming experiments Marmottant and Hilgenfeldt (2003); Marmottant et al. (2006a, b); Lajoinie et al. (2018); Elder (1959); Bolaños-Jiménez et al. (2017). The streaming velocity close to the bubble, , is approximately 0.2 mm/s and the streaming Reynolds number is , where is the kinematic viscosity of the liquid. The Péclet number based on remains fairly small at . During resonance [phase (ii)], the bubble undergoes strong volumetric, translational and surface oscillations [cf. Fig. 2, bubble (ii)]. Strikingly, the direction of streaming reverses (‘antifountain’ mode) [Fig. 3(a), panel (ii)]. The streaming velocities then escalate by two orders of magnitude ( mm/s, , ), and so does the growth rate. There is a second reversal in direction immediately after resonance and all the attributes prior to resonance are recovered [phase (iii)]. Weak fountain-mode streaming ( mm/s, , ) is observed once again.
The onset of surface mode activity is known to induce notably vigorous streaming Tho et al. (2007); Gould (1974), whereas a similar reversal from fountain to antifountain mode was first encountered by Elder (1959), which he attributed to the onset of higher-order surface modes triggered at sufficiently large acoustic amplitudes. Streaming patterns and direction are indeed dictated by the modes of microbubble oscillation Tho et al. (2007); Wang et al. (2013); Rallabandi et al. (2014); Cleve et al. (2019), which are frequency and amplitude dependent.
The particle pathlines sufficiently far from the bubble were found to be well described by the streamlines corresponding to the leading-order far-field (dipole-like) axisymmetric streamfunction proposed by Marmottant and Hilgenfeldt (2003),
| (3) |
where is the dimensionless source strength and , are the spherical coordinates defined in Fig. 3(b). The best agreement resulted after relocating the coordinate origin of the theoretical streamfunction on the bubble’s center of mass for the fountain mode [Fig. 3(a) panels (i, iii)], and on the bubble base for the antifountain mode [Fig. 3(a) panel (ii), Fig. 3(b)]. A likely explanation is the possible existence of a weak recirculation zone very close the wall Rallabandi et al. (2014) (here unobservable) that arises during fountain-mode streaming only [phases (i) and (iii)].
The source strength depends on the oscillation mode of the bubble and is a priori unknown. Typically is Marmottant and Hilgenfeldt (2003); Marmottant et al. (2006a, b), where represents some characteristic oscillation amplitude. However, may be estimated directly from the far-field velocities Bolaños-Jiménez et al. (2017). It follows that the velocity magnitude is a function of only when rescaled in the following manner:
| (4) |
We find that drastically increases from in phases (i, iii) to in phase (ii) [see Fig 3(c)], following the two order of magnitude increase in the values of . Note the sign reversal for the antifountain mode.
V Mass transfer mechanism
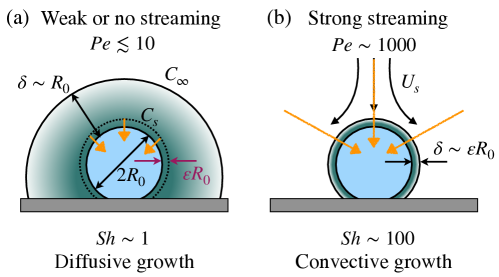
These results indicate that, during resonance, the microstreaming velocities become large enough to induce a transition from diffusion-dominated to convection-dominated growth. A physical explanation can be given in terms of the diffusion layer (see e.g. Tobias et al. (1952)), namely the characteristic thickness of the concentration boundary layer surrounding the bubble. It follows that scales as , where the bubble Sherwood number Enríquez et al. (2014); Moreno Soto et al. (2017) constitutes a measure of the mass transfer rate. Note that Sh, hence , can be computed independently without any knowledge of the streaming velocity. When there is weak or no streaming [Fig. 4(a)] we find diffusive growth, , i.e., . The bubble oscillations only perturb the boundary layer slightly. Strong streaming is responsible for the thinning of [Fig. 4(b)], resulting in steep interfacial concentration gradients, hence . The local mixing induced by the bubble oscillatory interface is now more relevant since . Nonetheless, to leading order, Sh must only depend on Pe provided that Pe is large. Naturally, amplifying the acoustic driving strengthens microstreaming: Pe and hence Sh increase.
The above explanation—only applicable when rectified diffusion is subdominant—calls for a quantitative relation between and Sh at the moment of maximum bubble growth. To obtain such a relation, the maximum streaming velocity surrounding the bubble, , was first extracted in a consistent manner from a set of ten different experiments. Direct tracking of particle velocities adjacent to the bubble surface during strong (antifountain) streaming proved unviable due to optical limitations. This was circumvented by extrapolating the particle velocities measured along the -axis as described in Fig. 5(a). The measured velocity profiles along the -axis were all well described by the theoretical expression Lajoinie et al. (2018)
| (5) |
where , and , defined in Eqs. (8)–(10) in Ref. Lajoinie et al. (2018), are dimensionless functions of and , where refers to the height of the bubble center. In the far-field limit (, Eq. (5) simplifies to [see Fig. 5(a)], consistent with Eq. (4) when , . Plotting Eq. (5) reveals that the maximum streaming velocity is related to the source strength through .
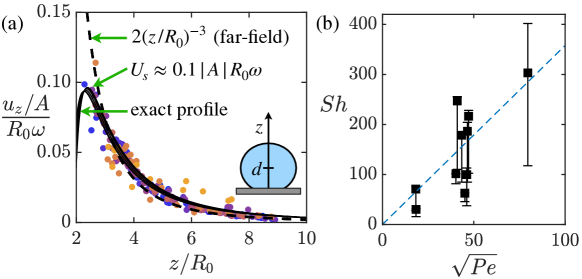
Our measurements [Fig. 5(b)] suggest that, at the moment of maximum growth (where Pe is large), mass transfer is consistent with the scaling law , where is a constant of order unity. This functional dependence was in fact theoretically derived by Kapustina and Statnikov (1968) and later Davidson (1971). It is no coincidence that the convective mass transfer of a freely rising bubble (see e.g. Clift et al. (1978); Takemura and Yabe (1998); Colombet et al. (2015)) follows this same relation.
VI Conclusions
In summary, ultrasound can easily enhance the growth of surface bubbles by two orders of magnitude during volumetric resonance. The underlying physical mechanism is as follows: The proximity of the wall forces the spherical bubble to oscillate non-spherically. Approaching resonance, the bubble undergoes small volumetric oscillations superimposed with translational oscillations perpendicular to the wall. The concomitant fountain-like streaming is weak and the bubble growth rate remains primarily driven by diffusion. During resonance, however, the onset of surface oscillations and larger translational oscillations lead to vigorous streaming, resulting in convective growth. Streaming is held majorly responsible for the mass transfer enhancement: Gas-rich liquid advected from the bulk disrupts the concentration boundary layer surrounding the bubble, greatly strengthening the concentration gradients therein. Our findings have direct impact on diverse applications concerning ultrasonic-driven spherical or quasi-spherical bubbles attached to a solid surface; namely, in microfluidic devices Hashmi et al. (2012), sonochemical reactors Fernandez Rivas et al. (2012), gas-evolving electrodes Zhao et al. (2019) or catalysts Lv et al. (2017), or even during heterogeneous cavitation Bremond et al. (2006) and pool nucleation boiling Dhir et al. (2007) of gas-containing vapor bubbles.
Acknowledgements.
This work was supported by the Netherlands Center for Multiscale Catalytic Energy Conversion (MCEC), an NWO Gravitation program funded by the Ministry of Education, Culture and Science of the government of the Netherlands.References
- Li et al. (2009) S.-D. Li, C.-C. Wang, and C.-Y. Chen, Electrochimica Acta 54, 3877 (2009).
- Kapustina (1965) O. A. Kapustina, Sov. Phys.-Acoust. 10, 376 (1965).
- Dong et al. (2015) Z. Dong, C. Yao, X. Zhang, J. Xu, G. Chen, Y. Zhao, and Q. Yuan, Lab on a Chip 15, 1145 (2015).
- Coussios and Roy (2008) C. C. Coussios and R. A. Roy, Annu. Rev. Fluid Mech. 40, 395 (2008).
- O’Brien et al. (2013) J.-P. O’Brien, E. Stride, and N. Ovenden, J. Acoust. Soc. Am. 134, 1416 (2013).
- Bader and Bollen (2018) K. B. Bader and V. Bollen, J. Acoust. Soc. Am. 143, EL481 (2018).
- Hashmi et al. (2012) A. Hashmi, G. Yu, M. Reilly-Collette, G. Heiman, and J. Xu, Lab on a Chip 12, 4216 (2012).
- Fernandez Rivas et al. (2012) D. Fernandez Rivas, P. Cintas, and H. J. G. E. Gardeniers, ChemComm 48, 10935 (2012).
- Iida et al. (2007) Y. Iida, T. Tuziuti, K. Yasui, A. Towata, and T. Kozuka, Ultrason. Sonochem. 14, 621 (2007).
- Eller and Flynn (1965) A. Eller and H. G. Flynn, J. Acoust. Soc. Am. 37, 493 (1965).
- Elder (1959) S. A. Elder, J. Acoust. Soc. Am. 31, 54 (1959).
- Marmottant et al. (2006a) P. Marmottant, J. P. Raven, H. J. G. E. Gardeniers, J. G. Bomer, and S. Hilgenfeldt, J. Fluid Mech. 568, 109 (2006a).
- Church (1988) C. C. Church, J. Acoust. Soc. Am. 84, 1758 (1988).
- Crum (1984) L. Crum, Ultrasonics 22, 215 (1984).
- Fyrillas and Szeri (1994) M. M. Fyrillas and A. J. Szeri, J. Fluid Mech. 277, 381 (1994).
- Brenner et al. (2002) M. P. Brenner, S. Hilgenfeldt, and D. Lohse, Rev. Mod. Phys. 74, 425 (2002).
- Szekely and Martins (1971) J. Szekely and G. P. Martins, Chem. Eng. Sci. 26, 147 (1971).
- Prosperetti (2017) A. Prosperetti, Annu. Rev. Fluid Mech. 49, 221 (2017).
- Eller (1969) A. I. Eller, J. Acoust. Soc. Am. 46, 1246 (1969).
- Gould (1974) R. K. Gould, J. Acoust. Soc. Am. 56, 1740 (1974).
- Crum (1980) L. A. Crum, J. Acoust. Soc. Am. 68, 203 (1980).
- Lee et al. (2005) J. Lee, S. Kentish, and M. Ashokkumar, J. Phys. Chem. B 109, 14595 (2005).
- Leong et al. (2010) T. Leong, S. Wu, S. Kentish, and M. Ashokkumar, J. Phys. Chem. C 114, 20141 (2010).
- Leong et al. (2011) T. Leong, J. Collis, R. Manasseh, A. Ooi, A. Novell, A. Bouakaz, M. Ashokkumar, and S. Kentish, J. Phys. Chem. C 115, 24310 (2011).
- Kapustina (1973) O. A. Kapustina, in Physical Principles of Ultrasonic Technology, Ultrasonic Technology, Vol. 1, edited by L. D. Rozenberg (Springer Science & Business Media, 1973) pp. 379–495.
- Epstein and Plesset (1950) P. S. Epstein and M. S. Plesset, J. Chem. Phys. 18, 1505 (1950).
- Peñas-López et al. (2017) P. Peñas-López, Á. M. Soto, M. A. Parrales, D. van der Meer, D. Lohse, and J. Rodríguez-Rodríguez, J. Fluid Mech. 820, 479 (2017).
- Enríquez et al. (2014) O. R. Enríquez, C. Sun, D. Lohse, A. Prosperetti, and D. van der Meer, J. Fluid Mech. 741, 1 (2014).
- Moreno Soto et al. (2017) Á. Moreno Soto, A. Prosperetti, D. van der Meer, and D. Lohse, J. Fluid Mech. 831, 474 (2017).
- Overvelde et al. (2010) M. Overvelde, H. J. Vos, N. de Jong, and M. Versluis, in Ultrasound contrast agents: Targeting and processing methods for theranostics, edited by G. Paradossi, P. Pellegretti, and A. Trucco (Springer-Verlag, 2010) Chap. 7, pp. 79–97.
- Xi et al. (2014) X. Xi, F. Cegla, R. Mettin, F. Holsteyns, and A. Lippert, J. Acoust. Soc. Am. 135, 1731 (2014).
- Prosperetti (1977) A. Prosperetti, J. Acoust. Soc. Am. 61, 17 (1977).
- Marmottant et al. (2006b) P. Marmottant, M. Versluis, N. De Jong, S. Hilgenfeldt, and D. Lohse, Exp. Fluids 41, 147 (2006b).
- Lajoinie et al. (2018) G. Lajoinie, Y. Luan, E. Gelderblom, B. Dollet, F. Mastik, H. Dewitte, I. Lentacker, N. de Jong, and M. Versluis, Commun. Phys. 1, 1 (2018).
- Versluis et al. (2010) M. Versluis, D. E. Goertz, P. Palanchon, I. L. Heitman, S. M. van der Meer, B. Dollet, N. de Jong, and D. Lohse, Phys. Rev. E 82, 026321 (2010).
- Lamb (1895) H. Lamb, Hydrodynamics (Cambridge University Press, 1895) p. 463.
- Tho et al. (2007) P. Tho, R. Manasseh, and A. Ooi, J. Fluid Mech. 576, 191 (2007).
- Bolaños-Jiménez et al. (2017) R. Bolaños-Jiménez, M. Rossi, D. F. Rivas, C. J. Kähler, and A. Marin, J. Fluid Mech. 820, 529 (2017).
- Marmottant and Hilgenfeldt (2003) P. Marmottant and S. Hilgenfeldt, Nature 423, 153 (2003).
- Wang et al. (2013) C. Wang, B. Rallabandi, and S. Hilgenfeldt, Physics of Fluids 25, 022002 (2013).
- Rallabandi et al. (2014) B. Rallabandi, C. Wang, and S. Hilgenfeldt, J. Fluid Mech. 739, 57 (2014).
- Cleve et al. (2019) S. Cleve, M. Guédra, C. Mauger, C. Inserra, and P. Blanc-Benon, J. Fluid Mech. 875, 597–621 (2019).
- Tobias et al. (1952) C. W. Tobias, M. Eisenberg, and C. R. Wilke, J. Electrochem. Soc. 99, 359C (1952).
- Kapustina and Statnikov (1968) O. A. Kapustina and Y. G. Statnikov, Sov. Phys.-Acoust. 831, 327 (1968).
- Davidson (1971) B. J. Davidson, J. Sound Vib. 17, 261 (1971).
- Clift et al. (1978) R. Clift, J. Grace, M. Weber, and M. Weber, Bubbles, Drops, and Particles (Academic Press, 1978).
- Takemura and Yabe (1998) F. Takemura and A. Yabe, Chem. Eng. Sci. 53, 2691 (1998).
- Colombet et al. (2015) D. Colombet, D. Legendre, F. Risso, A. Cockx, and P. Guiraud, J. Fluid Mech. 763, 254 (2015).
- Zhao et al. (2019) X. Zhao, H. Ren, and L. Luo, Langmuir 35, 5392 (2019).
- Lv et al. (2017) P. Lv, H. Le The, J. Eijkel, A. Van den Berg, X. Zhang, and D. Lohse, J. Phys. Chem. C 121, 20769 (2017).
- Bremond et al. (2006) N. Bremond, M. Arora, C.-D. Ohl, and D. Lohse, Phys. Rev. Lett. 96, 1 (2006).
- Dhir et al. (2007) V. K. Dhir, H. S. Abarajith, and D. Li, Heat Transfer Eng. 28, 608 (2007).