The Pristine Dwarf-Galaxy survey – III. Revealing the nature of the Milky Way globular cluster Sagittarius II
Abstract
We present a new spectroscopic study of the faint Milky Way satellite Sagittarius II. Using multi-object spectroscopy from the Fibre Large Array Multi Element Spectrograph, we supplement the dataset of Longeard et al. (2020) with 47 newly observed stars, 19 of which are identified as members of the satellite. These additional member stars are used to put tighter constraints on the dynamics and the metallicity properties of the system. We find a low velocity dispersion of km s-1, in agreement with the dispersion of Milky Way globular clusters of similar luminosity. We confirm the very metal-poor nature of the satellite ([Fe/H]) and find that the metallicity dispersion of Sgr II is not resolved, reaching only at the % confidence limit. No star with a metallicity below is confidently detected. Therefore, despite the unusually large size of the system (r pc), we conclude that Sgr II is an old and metal-poor globular cluster of the Milky Way.
keywords:
Local Group – galaxy: Dwarf – cluster: Globular – object: Sagittarius II1 Introduction
The faint and metal-poor satellites of massive galaxies are among the oldest structures of the Universe, whether they are dwarf galaxies or globular clusters (White & Rees 1978, Beasley et al. 2002, Mo, van den Bosch & White 2010). Because the faintest, low-mass galaxies are, in a CDM context, dominated by dark matter (DM), they can be the key to constraining the nature of the DM particle and more broadly the properties of our Universe (Klypin et al. 1999, Geringer-Sameth, Koushiappas & Walker 2015, Bullock & Boylan-Kolchin 2017, Nadler et al. 2019). The old age of the dwarf galaxies further implies that they have hosted Population III stars (Ishiyama et al. 2016), while their low mass and metallicity suggest that the pollution from successive supernovae is limited in these systems (Dekel & Silk 1986, Frebel & Norris 2015). As a consequence, they are unique laboratories to study and quantify the different evolutionary pathways of stellar formation (Roederer et al. 2016, Webster, Frebel & Bland-Hawthorn 2016, Ji et al. 2019).
On the other hand, globular clusters are usually not thought to be DM-dominated (Moore, 1996) and the faintest of them are often modelled as simpler systems with a single stellar population (Gratton et al. 2007, Carretta et al. 2009, Cohen et al. 2010, Willman & Strader 2012). They are important for various reasons. They give us insight in the mode of stellar formation in the early Universe and its similarities and differences with star formation today (Gieles et al. 2018,Gratton et al. 2019). The close link of their properties to those of their host galaxies has become clear over the years: for example, the number of clusters are related to the properties of their host galaxies (Brodie & Huchra 1991, Blakeslee 1997). They are thereby direct probes of their galaxy’ properties and therefore indirect probes for cosmology (Côté, West & Marzke 2002, Villaume et al. 2019, Riley & Strigari 2020). Old globular clusters are also witnesses of the build-up of massive galaxies halos, which are thought to have formed by disrupting and accreting faint stellar systems (Beasley et al. 2018, Pfeffer et al. 2018). They can also offer a unique insight into the observational validation of stellar population models (Chantereau, Charbonnel & Meynet, 2016).
The diversity of the properties of the MW faint satellites has been progressively unveiled over the past decades. For dwarf galaxies, it all started with Sculptor and Fornax, the very first dwarf spheroidal galaxies discovered (Shapley 1938a, Shapley 1938b) to the most recent discoveries (Willman et al. 2005, Zucker et al. 2006, Belokurov et al. 2006, Laevens et al. 2015, Drlica-Wagner et al. 2015, Kim & Jerjen 2015, Homma et al. 2016, Torrealba et al. 2018, Homma et al. 2019). Their observed diversity in size, luminosity and mass is not a surprise as it naturally arises in various simulations trying to reproduce our Local Universe (Springel et al. 2008, Vogelsberger et al. 2014, Schaye et al. (2015), Wheeler et al. 2019). For the Milky Way’s globular clusters, Harris (2010) has compiled the properties of 157 systems and summarized years of efforts of the community to characterize and understand them. That list will only grow longer in the future considering the recent discoveries of new clusters (Martin et al. 2016c, Koposov, Belokurov & Torrealba 2017, Mau et al. 2019), especially with the advent of the Legacy Survey of Space and Time (LSST) in the incoming years (Ivezić et al. 2008, Simon 2019)
As increasingly faint MW satellites are discovered, the difficulties in classifying them have grown. Systems fainter than mag are often challenging to classify as globular cluster or galaxy. This issue was notably addressed by Côté et al. (2002) and Gilmore et al. (2007) and is commonly known as the “valley of ambiguity”. Distinguishing faint satellite galaxies from globular clusters relies on two main diagnostics: (i) evidence for the presence of substantial amounts of dark matter, and (ii) the presence of a substantial dispersion in metallicity, a feature usually associated with recurrent star formation. This requires combining deep photometry with extensive spectroscopic campaigns. Dynamical evidence for an excess of mass over that of the stellar component, would then be attributed, in the standard cosmological model, to the presence of a massive DM halo (Willman & Strader, 2012) and would favour a dwarf galaxy scenario The first measurement of the velocity dispersion of a non-classical MW dwarf galaxy, undertaken by Kleyna et al. (2005), showed that Ursa Major I is indeed DM-dominated. This effort was repeated for most systems known at the time, enriching our knowledge of the MW satellites’ properties (Martin et al. 2007, Simon & Geha 2007a, Koposov et al. 2011, Simon et al. 2011, Martin et al. 2016b), an effort that would also rely on other tracers such as the metallicity and the metallicity dispersion of these faint satellites (Kirby et al. 2008, Koposov et al. 2015, Walker et al. 2016). However, in practice, the velocity and metallicity dispersions can be challenging to constrain due to the low number of member stars observed with spectroscopy for a significant fraction of the known faint MW satellites. This problem, that first arose with the study of the kinematics of Segue 2 (Kirby et al., 2013a) still limits our understanding of some of them. The examples over the last few years are numerous, with Draco II (Martin et al. 2016a, Longeard et al. 2018), Tucana III (Simon et al., 2017), Colomba I or Horologium II (Fritz et al., 2019) that are still not well understood, despite extensive studies with photometry and spectroscopy.
In that context, we present a new spectroscopic study of the faint MW satellite Sagittarius II (Sgr II) discovered by Laevens et al. (2015), and studied in depth by Longeard et al. (2020, L20). L20 used deep photometry, multi-object spectroscopy and the metallicity-sensitive, narrow-band photometry provided by the Pristine survey (Starkenburg et al., 2017) to refine the structural properties of Sgr II and infer its dynamical and metallicity properties for the first time. Its velocity dispersion ( km s-1) favoured the existence of a low-mass DM halo and therefore a dwarf galaxy scenario. The metallicity of the satellite was found to be in good agreement with the metallicity-luminosity relation of dwarf galaxies of Kirby et al. (2013b), while its metallicity dispersion was deemed small () but resolved. This last result, however, could be inflated by systematics, an underestimation of the individual uncertainties on the spectroscopic metallicities, or just by the small sample of six stars used to perform the metallicity analysis. If L20 marginally favour Sgr II to be a very low-mass galaxy, an independent study of the satellite presented in an American Astronomical Society meeting (Simon et al., 2019), yet to be published, unequivocally found that Sgr II is a globular cluster, based on an extremely low metallicity dispersion measurement from their own spectroscopic sample ( at the 95% confidence level). Furthermore, if the satellite was found to be physically compact by L20 (r pc), but still possibly within the realm of dwarf galaxies, an estimation of the heliocentric distance of the satellite based on the identification of five RR Lyrae stars potentially members of Sgr II (Vivas, Martínez-Vázquez & Walker, 2020, V20) would place the system closer than the estimate of L20 ( vs. mag, i.e. a difference of kpc). This would result in a slight overestimation of its physical size (r pc) and bring the system closer to the realm of old, metal-poor globular clusters. For the rest of this paper, the results of L20 will be used. In many ways, Sgr II is shrouded in mystery, and the following work will attempt to close the case on the nature of this faint and elusive satellite.
2 Data selection and acquisition
The spectroscopy used in this work is a combination of two datasets. The first data were observed with the DEep Imaging Multi-Object Spectrograph (DEIMOS, Faber et al. 2003), already detailed and analysed in L20. The second dataset is composed of new observations performed with the Fibre Large Array Multi Element Spectrograph (Pasquini et al., 2002, FLAMES) mounted on the Very Large Telescope (VLT). The GIRAFFE/HR21 grating, with a resolution of R , a central wavelength of and a bandwidth between 8484 and 9001 was used to resolve the Calcium II triplet infrared lines. These FLAMES observations were conducted during three different nights to attempt to detect binary stars: on the 22.06.16 (s of integration), the 21.07.16 (s) and the 30.07.16 (s).
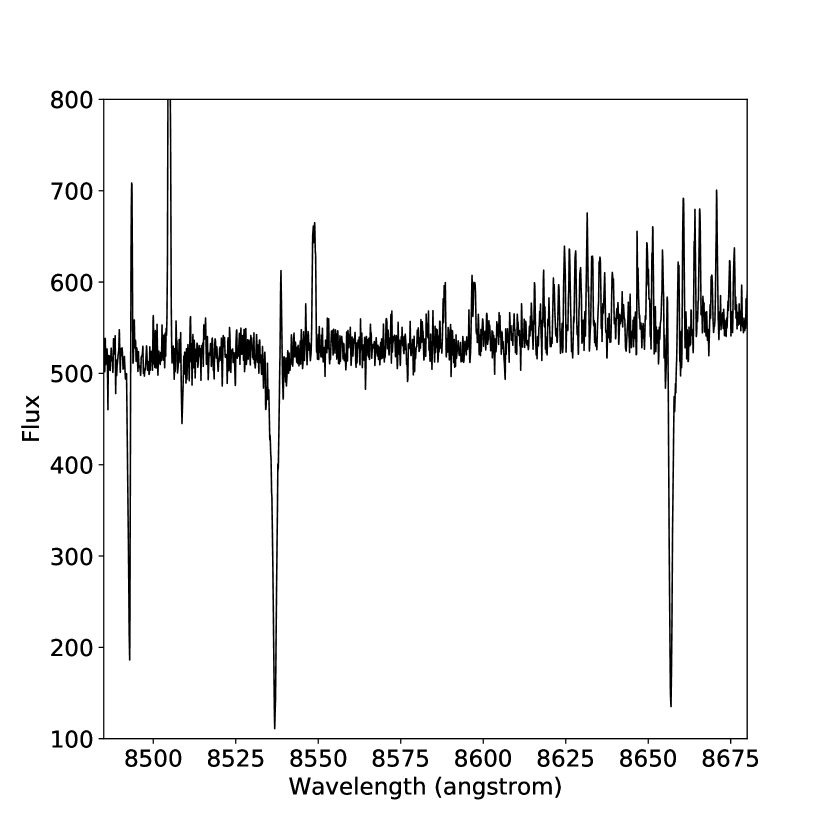
The data were reduced by the European Southern Observatory team using their pipeline specifically tailored to FLAMES data (Melo et al., 2009). The spectrum of a Sgr II member star is displayed in Figure 1 to illustrate the quality of the data. In order to infer the radial velocities, the equivalent widths and their respective uncertainties, the method already used in L20 was used and consists of determining the combination of Gaussian profiles that best fits a continuum composed of the Calcium II triplet lines at rest as the unique spectral features. It also includes a correction to account for the non-gaussianity of the wings’ lines. The typical uncertainty on the radial velocities for the FLAMES dataset is of the order of km s-1, and all the stars with signal-to-noise (S/N) ratio below 3 per resolution element are discarded from the sample. In the same fashion as in Simon & Geha (2007b) and L20, the systematic error on the velocities is determined from stars observed more than once in the FLAMES sample. The resulting systematics are a bias of km s-1 and a standard deviation of km s-1.
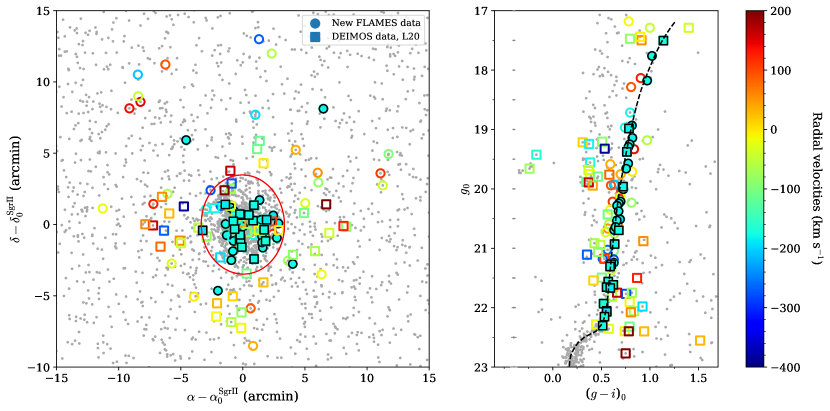
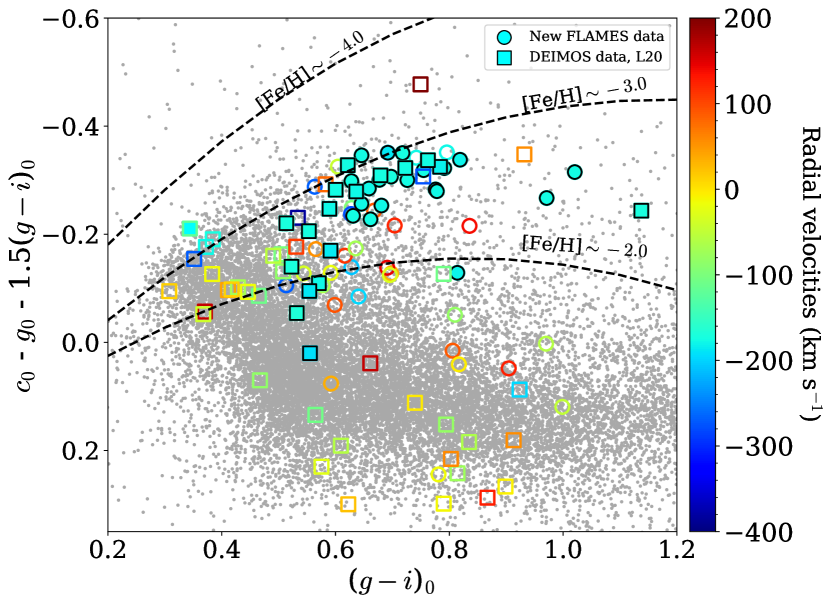
To build our list of FLAMES targets, we used the locations of stars in the colour-magnitude diagram (CMD) of Sgr II built from deep MegaCam photometry and shown in the right panel of Figure 2, along with their spatial distribution in the left panel. More importantly, this spectroscopic study benefits from the use of the narrow-band, metallicity-sensitive photometry provided by the Pristine survey (Starkenburg et al., 2017). All stars observed in Pristine have a photometric metallicity measurement, as illustrated in the colour-colour diagram shown in Figure 3. In this diagram, stars are distributed according to their metallicities, from the most metal-rich at the bottom of the plot, to the most metal-poor at the top, down to a metallicity of [Fe/H] . Using the prior knowledge that Sgr II is indeed a very metal-poor satellite ([Fe/H], L20), the target list was built so that the stars observed are confirmed to be very metal-poor according to the Pristine survey. In doing so, we increase the probability of finding new members (Youakim et al. 2017, Aguado et al. 2019). The DEIMOS spectroscopy supplementing this dataset consists only of the DEIMOS stars identified as non variables, non binaries and metal-poor according to Pristine ([Fe/H]) by L20.
In order to clean the FLAMES data, we check for the existence of binaries in the sample. For a given star, each measurement from the -th epoch is assumed to be reasonably well-described by a Gaussian distribution centered on the radial velocity measurement and a standard deviation corresponding to its uncertainty. Then, the probability that the measurement is discrepant from that of the same star at another epoch at the level is computed. This probability corresponds to the star being variable between epochs and . The same procedure is used to compute the probability that each velocity measurement of a given epoch is compatible with all the others within , i.e. the probability that it is not varying. If the product of the probabilities representing the hypothesis ”variable” is greater than the hypothesis ”non-variable”, then the star is considered a binary star and discarded from the main sample so that their variability does not affect the dynamical analysis of Sgr II. We find a total of 6 potential binaries in the sample, however, none have the right velocity to be a member of Sgr II.
The final spectroscopic sample consists of 113 stars, with 47 new stars observed with FLAMES as detailed in Table 1 with four stars out of those 47 in common with L20’s sample. As a consistency check, we compare the velocities obtained with FLAMES and DEIMOS for these four stars and find no statistical differences between the two samples.
3 Results
In this section, we constrain the systemic heliocentric velocity of Sgr II and its associated velocity dispersion.
3.1 Dynamical properties
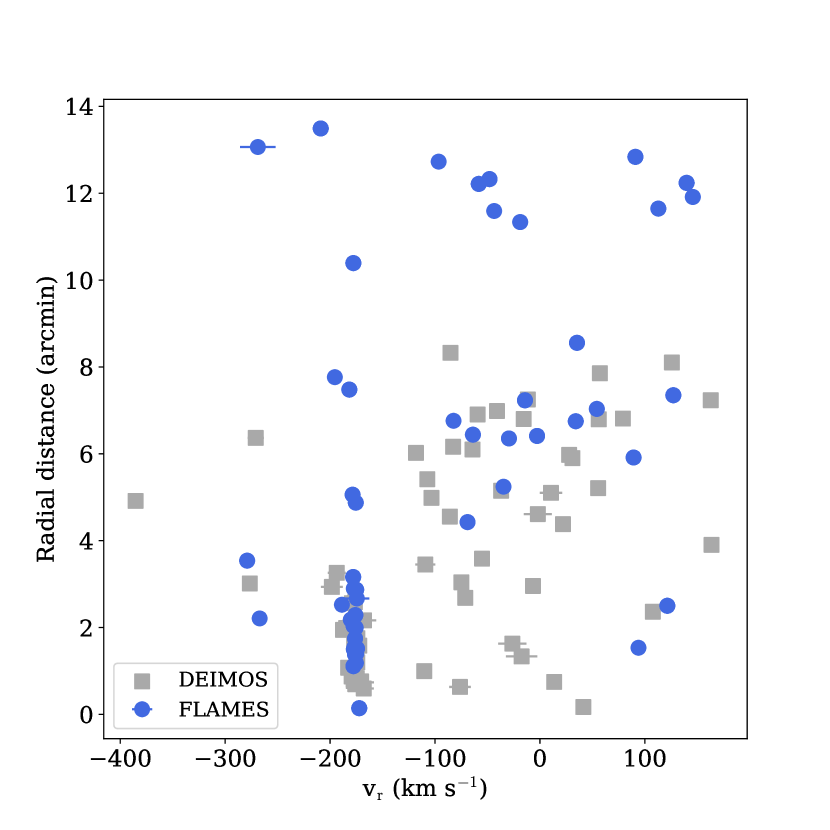
All stars in our spectroscopic sample with a heliocentric velocity are shown in Figure 4, along with a more detailed view. As already detailed in section 2, the final sample consists of all non-binary, non-HB stars compatible with Sgr II’s sequence in the CMD and that appear as very metal-poor using the CaHK photometry. Stars with mediocre CaHK photometry from the DEIMOS catalog are also included as their photometric metallicities are not reliable. Thanks to the photometry provided by the Pristine survey, the FLAMES data are already quite clean with only a few clear contaminants discrepant from the Sgr II population at around km s-1. When available, the proper motions provided by the Gaia Data Release 2 (Gaia Collaboration et al., 2018) are also used to filter out contaminants. This procedure allows us to get rid of one star with CMD and metallicity properties strongly compatible with Sgr II, but a proper motion unequivocally discrepant from that of the satellite (Massari & Helmi 2018, L20).
In order to derive the dynamical properties of Sgr II, the velocity distribution of our dataset and shown in Figure 4 is assumed to be the sum of two Gaussian distributions, one standing for Sgr II’s population and the other for the MW contamination. The favoured dynamical model is obtained through a Monte Carlo Markov Chain (Hastings, 1970, MCMC) algorithm.
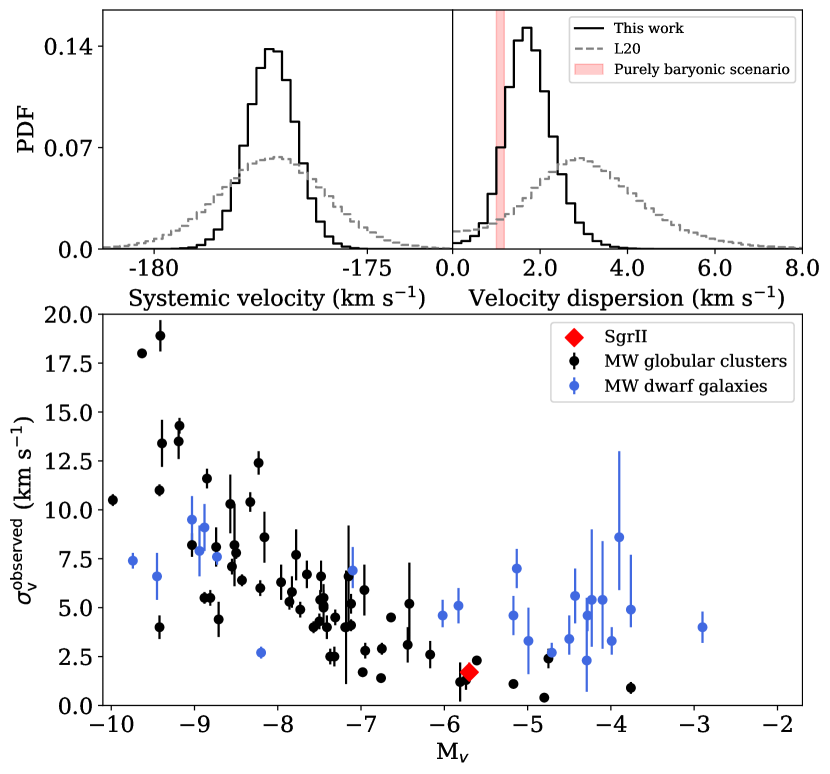
The Probability Distribution Functions (PDFs) of the systemic heliocentric velocity and the velocity dispersion of Sgr II are displayed in the top panels of Figure 5. The resulting systemic velocity is km s-1 and is perfectly compatible with the one of L20. The velocity dispersion found in this work is also compatible with L20 ( km s-1), but with much tighter constraints, it is measured to be km s-1. Using the formalism of Wolf et al. (2010) which assumes dynamical equilibrium and a flat velocity dispersion profile, this results into a mass-to-light (M/L) ratio of M⊙ L. Sgr II shows no sign of a velocity dispersion gradient as the determination of its dynamical properties by selecting stars inside and outside 1 arcminute yields no statistical difference. Furthermore, adding another contaminating population to the likelihood model does not change our results.
We classify as a member of Sgr II any star with line-of-sight velocity and proper motion membership probabilities (when available) above 50%. We identify member stars in the FLAMES data. 3 of them were already identified in the L20 dataset, leading to the identification of 19 new members. Combined with the spectroscopically confirmed members of L20, 43 stars are confirmed to belong to Sgr II, including binaries and horizontal branch (HB) stars. This underlines the importance of the Pristine photometry. To estimate the success rate of the FLAMES data in identifying new members, we do not simply take the fraction of confirmed members over the overall number of stars observed since the sample of Sgr II candidates identified before observation was not large enough to fill all the FLAMES fibers. Among the 47 new stars observed, only were considered as promising Sgr II candidates. Therefore, it yields a success rate of for the FLAMES data sample based on the Pristine selection. In comparison, the DEIMOS dataset of L20, solely based on a CMD-based selection, had a 20% success rate. The contrast is even more striking when considering that the DEIMOS selection focuses on the central region of the satellite and is therefore more likely to find Sgr II stars, while the FLAMES observations had a much wider field of view and aim to find stars located much further away than Sgr II’s centroid.
3.2 Metallicity properties
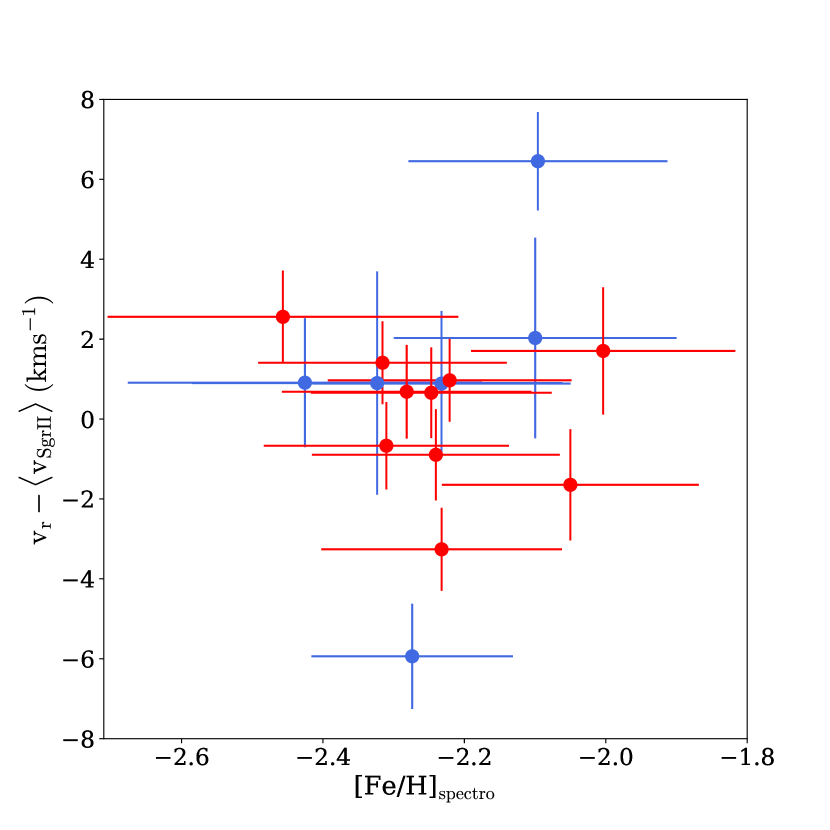
In the following section, the mean stellar metallicity of Sgr II and its metallicity dispersion are derived using our new FLAMES data. To do so, we select only non-binary, non-HB stars with a spectral signal-to-noise ratio greater than 12 and with (i.e. 1 mag below the HB of Sgr II). This yields a subsample of 17 stars to extract a measurement of the spectroscopic metallicity. This procedure is performed through the use of the empirical calibration of Starkenburg et al. (2010) that uses the equivalent widths (EWs) of the Calcium II triplet lines to deduce a measurement of the metallicity of a star. The uncertainties on the coefficients defining the polynomials to transform a set of EWs into a [Fe/H]spectro are folded in with the uncertainties on the EWs through a Monte Carlo procedure to obtain the final uncertainties on each individual spectroscopic metallicity measurement. We take the value of 8% reported by Starkenburg et al. (2010) to be the uncertainty on each coefficients. We note that these uncertainties do not include several systematics (due to, for instance, the continuum placement, or the detailed chemical abundance pattern of the star when transforming a Ca II measurement into [Fe/H]). Figure 6 shows the spectroscopic metallicities of the 17 stars and their uncertainties assuming each measurement can be modelled by a Gaussian centered on [Fe/H]spectro and with a standard deviation corresponding to . For stars observed more than once, a metallicity measurement is derived for each epoch and we verify that each epoch yields a metallicity compatible with the others. This procedure highlights two stars with discrepant metallicity measurements at different epochs. We decide to discard those stars for the rest of the analysis, however, including them has a very limited impact on the results. None of the 4 stars in common between the FLAMES and DEIMOS samples have a spectroscopic metallicity measurement.
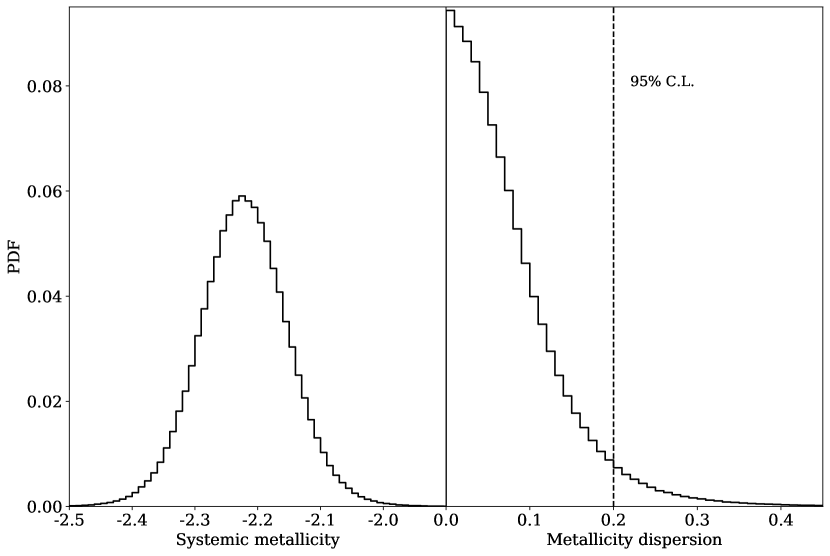
Since all 15 stars in the subsample are likely Sgr II members, their metallicity distribution is assumed to be only reflective of Sgr II population, which is therefore modelled with a Gaussian distribution weighted with the membership probability of each star according to L20. We find a spectroscopic systemic metallicity of [Fe/H], and an unresolved metallicity dispersion with at the 95% confidence limit. The PDFs corresponding to these results are shown in Figure 7. The metallicity dispersion is unresolved, and is constrained to be below 0.20 dex at the 95% confidence limit (C.L.).
4 Discussion
Throughout this paper, we analyse the dynamical and metallicity properties of the faint MW satellite Sgr II. To this end, we combine the Keck II/DEIMOS spectroscopic dataset of our previous analysis of the satellite with new VLT/FLAMES data. These FLAMES observations are the first ones to be carried out by selecting a priori the interesting candidates using the narrow-band, metallicity sensitive photometry of the Pristine survey for a faint satellite of the MW. The spectroscopic observations presented in this work are decisive as they double the overall sample of members stars known. Nine new stars are bright enough to estimate their spectroscopic metallicities with the empirical Calcium II triplet calibration of Starkenburg et al. (2010), while the sample of L20 only consists of 6 stars. Therefore, this study considerably enlarges the statistics available for the satellite and allows us to put much tighter constraints on the dynamical and metallicity properties of SgrII.
The systemic radial velocity of Sgr II is found to be km s-1. The velocity dispersion of km s-1 is well among the range observed for the MW globular clusters at the same luminosity, as shown in Figure 5. It translates into a M/L ratio of M⊙ L, thus suggesting that the dynamics of the satellite is not mainly driven by a DM halo. We identify 19 new members in the faint system, for a total of 43 confirmed spectroscopic Sgr II members. With a fraction of member identified over the entirety of the FLAMES sample of %, the a priori selection using Pristine performs three times better than the simple CMD-based selection of L20, despite a riskier observational strategy through the search for stars located beyond two half-light radii of the satellite. Four of these stars are identified, with the outermost one lying at rh. 15 out of the 43 members have good enough quality spectra to measure the EWs of their Calcium II triplet and measure their metallicity using the empirical calibration of Starkenburg et al. (2010). We find a systemic metallicity of and constrain the metallicity dispersion of the satellite to be less than at the % confidence limit.
The velocity dispersion as inferred by L20 is larger than the one found in the present analysis. Furthermore, L20’s metallicity analysis indicates that there are multiple stellar populations in the system, as the metallicity dispersion is resolved both with CaHK photometry and spectroscopy. This is not the case anymore in this work as the spectroscopic metallicity distribution of our dataset is well-described with only one stellar population despite the addition of 9 new stars with spectroscopic metallicites. Moreover, Figure 6 shows that no star with a metallicity below is confidently detected, a limit commonly attributed to the lowest metallicity achievable by globular clusters (Harris 2010 and references therein, Beasley et al. 2019). Therefore, we are able to conclude that Sgr II is a globular cluster.
Nonetheless, the satellite is still quite extended when compared to other MW globular clusters of the same luminosity. Within a range of one magnitude around Sgr II’s absolute magnitude, the largest MW cluster is Pal 5 (M), a fairly metal-poor system ([Fe/H] ) with a size of pc, while most of the others have a size below pc (Harris, 2010). Whether we consider the distance of L20 or Vivas, Martínez-Vázquez & Walker (2020), Sgr II is still at least 1.5 times more extended than Pal 5. Sgr II is a case in point of the ambiguity surrounding the faint MW satellites discovered in recent years, with a somewhat larger half-light radius than expected from GCs at that luminosity, a metallicity perfectly compatible with the luminosity-metallicity relation of dwarf galaxies (Kirby et al., 2013b), and velocity and metallicity dispersions challenging to resolve. Though we conclude that Sgr II is an old and metal-poor globular cluster, the system remains interesting in many aspects, from its possible association to the Sgr stream to an even deeper understanding of the unusually large cluster, which could build a bridge to the still exclusive definitions of clusters and galaxies of the MW.
Acknowledgments
We gratefully thank the CFHT staff for performing the observations in queue mode, for their reactivity in adapting the schedule, and for answering our questions during the data-reduction process.
NFM, RI, and NL gratefully acknowledge support from the French National Research Agency (ANR) funded project “Pristine” (ANR-18-CE31-0017) along with funding from CNRS/INSU through the Programme National Galaxies et Cosmologie and through the CNRS grant PICS07708. ES gratefully acknowledges funding by the Emmy Noether program from the Deutsche Forschungsgemeinschaft (DFG). This work has been published under the framework of the IdEx Unistra and benefits from a funding from the state managed by the French National Research Agency as part of the investments for the future program. The authors thank the International Space Science Institute, Berne, Switzerland for providing financial support and meeting facilities to the international team “Pristine”.
Based on observations collected at the European Southern Observatory under ESO programme(s) 099.B-0690(A).
Some of the data presented herein were obtained at the W. M. Keck Observatory, which is operated as a scientific partnership among the California Institute of Technology, the University of California and the National Aeronautics and Space Administration. The Observatory was made pos- sible by the generous financial support of the W. M. Keck Foundation. Furthermore, the authors wish to recognize and acknowledge the very significant cultural role and rever- ence that the summit of Maunakea has always had within the indigenous Hawaiian community. We are most fortunate to have the opportunity to conduct observations from this mountain.
Based on observations obtained at the Canada-France-Hawaii Telescope (CFHT) which is operated by the National Research Council of Canada, the Institut National des Sciences de l’Univers of the Centre National de la Recherche Scientifique of France, and the University of Hawaii.
This work has made use of data from the European Space Agency (ESA) mission Gaia (https://www.cosmos.esa.int/gaia), processed by the Gaia Data Processing and Analysis Consortium (DPAC, https://www.cosmos.esa.int/web/gaia/dpac/consortium). Funding for the DPAC has been provided by national institutions, in particular the institutions participating in the Gaia Multilateral Agreement.
| RA (deg) | DEC (deg) | (mas.yr-1) | (mas.yr-1) | S/N | [Fe/H]CaHK | [Fe/H] | Member | ||||
|---|---|---|---|---|---|---|---|---|---|---|---|
| 298.37718 | 21.98293 | 21.05 0.01 | 20.42 0.01 | 21.74 0.04 | -96.5 1.4 | 5.0 4.0 | -5.1 2.1 | 3.5 | 2.50 0.12 | — | N |
| 298.28281 | 21.92996 | 19.57 0.01 | 18.80 0.01 | 20.45 0.02 | -177.8 0.6 | -0.2 0.5 | -1.1 0.3 | 24.4 | 2.58 0.12 | -2.2 0.11 | Y |
| 298.24280 | 21.97804 | 19.75 0.01 | 19.05 0.01 | 20.67 0.02 | 34.1 2.4 | -1.9 2.7 | -1.9 1.3 | 12.7 | 1.90 0.12 | -1.5 0.21 | N |
| 298.20794 | 21.86545 | 19.18 0.01 | 18.21 0.01 | 20.64 0.02 | -58.3 0.5 | -0.6 0.2 | -1.0 0.1 | 48.9 | 1.25 0.12 | -1.26 0.16 | N |
| 298.18438 | 21.93702 | 19.93 0.01 | 19.29 0.01 | 20.80 0.02 | -195.5 3.3 | — — | — — | 6.3 | 1.72 0.12 | — | N |
| 298.18958 | 21.84866 | 21.18 0.01 | 20.66 0.01 | 21.84 0.04 | -268.8 16.9 | 1.7 0.2 | -2.0 0.1 | 3.1 | 2.01 0.12 | — | N |
| 298.05410 | 21.87831 | 18.29 0.01 | 17.48 0.01 | 19.51 0.01 | 91.0 0.3 | — — | — — | 79.8 | 1.34 0.12 | -1.43 0.16 | N |
| 298.08415 | 21.96661 | 18.93 0.01 | 18.12 0.01 | 20.03 0.01 | -181.7 0.4 | -12.8 0.7 | -18.6 0.4 | 60.6 | 1.99 0.12 | -1.8 0.13 | N |
| 298.00202 | 21.92952 | 19.33 0.01 | 18.50 0.01 | 20.37 0.02 | 139.8 0.4 | — — | — — | 31.3 | 2.28 0.12 | -2.12 0.11 | N |
| 298.01422 | 21.89008 | 19.93 0.01 | 19.30 0.01 | 20.73 0.02 | -208.9 1.0 | -4.7 0.2 | -6.0 0.1 | 16.4 | 2.00 0.12 | -2.24 0.09 | N |
| 298.01803 | 21.92193 | 20.17 0.01 | 19.47 0.01 | 21.06 0.03 | 145.7 0.9 | 4.2 1.2 | -6.5 0.9 | 14.6 | 1.95 0.12 | -1.13 0.22 | N |
| 298.36550 | 22.00547 | 20.22 0.01 | 19.60 0.01 | 20.98 0.02 | 112.9 2.1 | -0.6 0.6 | -1.4 0.4 | 15.3 | 2.10 0.12 | -2.36 0.12 | N |
| 298.36878 | 22.01959 | 21.36 0.01 | 20.76 0.01 | 21.95 0.04 | -43.6 3.0 | 4.8 3.1 | 2.9 1.8 | 3.6 | 3.11 0.12 | — | N |
| 298.27562 | 22.01614 | 20.23 0.01 | 19.42 0.01 | 21.40 0.03 | -82.3 2.8 | -0.6 1.3 | -11.3 0.8 | 4.1 | 1.58 0.12 | — | N |
| 298.27457 | 22.00481 | 20.67 0.01 | 20.10 0.01 | 21.34 0.03 | 54.2 1.5 | — — | — — | 10.1 | 2.23 0.12 | — | N |
| 298.23845 | 22.11143 | 20.69 0.01 | 20.06 0.01 | 21.40 0.03 | -175.5 0.9 | -0.6 1.3 | -0.0 0.8 | 10.8 | 2.41 0.12 | — | Y |
| 298.25661 | 22.0404 | 20.73 0.01 | 20.19 0.01 | 21.42 0.03 | -34.7 1.4 | 0.4 1.1 | 0.0 0.7 | 6.1 | 2.03 0.12 | — | N |
| 298.23141 | 22.10773 | 20.75 0.01 | 20.12 0.01 | 21.53 0.03 | -69.0 1.7 | -1.1 1.1 | -1.8 0.6 | 4.4 | 2.13 0.12 | — | N |
| 298.19512 | 22.09244 | 18.18 0.01 | 17.21 0.01 | 19.37 0.01 | -175.9 0.3 | -13.5 0.6 | -25.9 0.4 | 95.7 | 2.31 0.12 | -2.15 0.12 | Y |
| 298.18145 | 22.07735 | 18.72 0.01 | 17.92 0.01 | 19.56 0.01 | -177.7 0.8 | -7.7 1.3 | -9.1 0.7 | 18.3 | 2.97 0.12 | -2.18 0.11 | N |
| 298.11270 | 22.04758 | 18.97 0.01 | 18.23 0.01 | 19.74 0.01 | -178.0 0.9 | -1.3 1.1 | -8.7 0.6 | 11.9 | 2.91 0.12 | -2.13 0.18 | N |
| 298.19043 | 22.03676 | 19.14 0.01 | 18.32 0.01 | 20.03 0.01 | -180.2 0.3 | -1.7 1.5 | -1.9 0.9 | 53.5 | 2.87 0.12 | -2.23 0.11 | Y |
| 298.15270 | 22.08463 | 19.25 0.01 | 18.46 0.01 | 20.11 0.01 | -176.2 0.5 | 12.3 0.5 | -27.2 0.3 | 27.6 | 2.83 0.12 | -2.23 0.11 | Y |
| 298.15185 | 22.09654 | 19.29 0.01 | 18.52 0.01 | 20.18 0.01 | -177.6 0.4 | 6.8 3.3 | 0.1 2.1 | 29.0 | 2.56 0.12 | -2.25 0.12 | Y |
| 298.18099 | 22.20728 | 19.58 0.01 | 18.99 0.01 | 20.55 0.02 | 35.3 0.8 | — — | — — | 11.7 | 1.14 0.12 | — | N |
| 298.21784 | 22.06409 | 19.66 0.01 | 18.90 0.01 | 20.47 0.02 | -175.1 0.4 | -2.4 0.7 | -5.2 0.4 | 34.3 | 99.0 0.00 | -2.36 0.1 | Y |
| 298.16019 | 22.09027 | 19.94 0.01 | 19.34 0.01 | 20.77 0.02 | 93.9 2.8 | -0.3 0.8 | -1.3 0.4 | 3.6 | 1.70 0.12 | — | N |
| 298.19280 | 22.05979 | 19.99 0.01 | 19.28 0.01 | 20.72 0.02 | -174.3 0.6 | -0.8 0.3 | -1.0 0.1 | 22.6 | 3.07 0.12 | -2.3 0.11 | Y |
| 298.19388 | 22.07918 | 20.01 0.01 | 19.28 0.01 | 20.79 0.02 | -176.2 0.6 | -7.1 1.0 | -8.9 0.6 | 17.7 | 2.67 0.12 | -2.15 0.13 | Y |
| 298.20960 | 22.07638 | 20.03 0.01 | 19.33 0.01 | 20.87 0.02 | 121.4 1.3 | 0.0 0.5 | -0.4 0.3 | 22.5 | 2.26 0.12 | -1.78 0.13 | N |
| 298.16641 | 22.06769 | 20.21 0.01 | 19.51 0.01 | 20.95 0.02 | -172.2 1.5 | -3.2 0.6 | -4.5 0.3 | 10.8 | 2.73 0.12 | -2.72 0.1 | Y |
| 298.13014 | 22.14273 | 20.24 0.01 | 19.56 0.01 | 21.01 0.02 | -178.5 1.0 | — — | — — | 14.5 | 2.40 0.12 | -2.06 0.14 | Y |
| 298.14121 | 22.06475 | 20.28 0.01 | 19.62 0.01 | 21.05 0.02 | -175.2 1.2 | -14.8 1.5 | -20.4 0.8 | 15.1 | 99.0 0.00 | -1.89 0.16 | Y |
| 298.19401 | 22.08638 | 20.38 0.01 | 19.70 0.01 | 21.09 0.03 | -175.7 1.2 | -1.2 0.9 | -1.1 0.5 | 7.7 | 2.78 0.12 | -2.17 0.11 | Y |
| 298.21019 | 22.05475 | 20.51 0.01 | 19.82 0.01 | 21.20 0.03 | -188.7 5.8 | -1.5 0.5 | -0.8 0.3 | 3.8 | 3.06 0.12 | — | Y |
| 298.14290 | 22.07784 | 20.53 0.01 | 19.87 0.01 | 21.23 0.03 | -177.4 1.3 | -1.4 1.5 | -9.8 0.7 | 14.3 | 2.68 0.12 | — | Y |
| 298.17751 | 22.16337 | 20.60 0.01 | 19.93 0.01 | 21.36 0.03 | 89.3 0.8 | -7.3 0.4 | -10.1 0.2 | 13.4 | 2.38 0.12 | — | N |
| 298.21550 | 22.08104 | 20.65 0.01 | 20.00 0.01 | 21.36 0.03 | -177.4 1.0 | -1.4 1.0 | -1.2 0.6 | 12.1 | 2.60 0.12 | — | Y |
| 298.14837 | 22.04551 | 20.64 0.01 | 19.99 0.01 | 21.26 0.03 | -176.7 1.3 | 1.0 1.3 | 0.6 0.7 | 12.6 | 99.0 0.00 | — | Y |
| 298.13415 | 22.04367 | 21.03 0.01 | 20.46 0.01 | 21.58 0.04 | -267.1 2.5 | -1.0 1.5 | -2.2 0.9 | 5.3 | 2.99 0.12 | — | N |
| 298.11950 | 22.0253 | 21.19 0.01 | 20.56 0.01 | 21.89 0.05 | -279.0 2.8 | -2.0 2.4 | -7.7 1.4 | 6.7 | 2.44 0.12 | — | N |
| 298.14955 | 22.10703 | 21.24 0.01 | 20.62 0.01 | 21.89 0.05 | -174.5 11.9 | 4.8 3.1 | 2.9 1.8 | 3.4 | 2.69 0.12 | — | Y |
| 298.03665 | 22.04132 | 18.13 0.01 | 17.23 0.01 | 19.54 0.01 | 127.2 0.5 | 0.2 3.5 | -1.4 1.8 | 105.2 | 1.23 0.12 | -1.19 0.17 | N |
| 298.09544 | 22.14968 | 19.71 0.01 | 18.89 0.01 | 20.98 0.02 | -2.7 0.9 | 0.1 1.4 | -1.9 0.7 | 31.0 | 1.25 0.12 | -1.36 0.15 | N |
| 298.06312 | 22.11093 | 20.13 0.01 | 19.44 0.01 | 21.05 0.02 | -29.5 1.1 | -0.3 0.8 | -1.3 0.4 | 12.8 | 99.0 0.00 | -1.37 0.17 | N |
| 298.05710 | 22.02942 | 20.59 0.01 | 20.02 0.01 | 21.35 0.03 | -63.9 0.8 | 2.7 1.8 | 0.4 1.0 | 10.9 | 1.89 0.12 | — | N |
| 297.96338 | 22.04654 | 20.35 0.01 | 19.76 0.01 | 21.11 0.02 | -18.8 1.5 | — — | — — | 12.1 | 1.99 0.12 | -1.61 0.16 | N |
| 298.15344 | 22.04959 | 17.76 0.01 | 16.74 0.01 | 18.98 0.01 | -175.5 0.3 | -0.9 0.4 | -1.0 0.2 | 125.2 | 2.31 0.12 | -2.23 0.12 | Y |
| 298.28018 | 22.12346 | 17.18 0.01 | 16.40 0.01 | 18.60 0.01 | -14.2 0.4 | -0.3 1.3 | 0.8 0.8 | 131.5 | — | -1.19 0.18 | N |
| 298.01474 | 21.91537 | 17.29 0.01 | 16.29 0.01 | 18.90 0.01 | -48.0 0.4 | -4.0 1.7 | -8.8 1.0 | 131.5 | — | -1.23 0.18 | N |
References
- Aguado et al. (2019) Aguado D. S. et al., 2019, MNRAS, 2271
- Battaglia et al. (2008) Battaglia G., Irwin M., Tolstoy E., Hill V., Helmi A., Letarte B., Jablonka P., 2008, MNRAS, 383, 183
- Beasley et al. (2002) Beasley M. A., Baugh C. M., Forbes D. A., Sharples R. M., Frenk C. S., 2002, MNRAS, 333, 383
- Beasley et al. (2019) Beasley M. A., Leaman R., Gallart C., Larsen S. S., Battaglia G., Monelli M., Pedreros M. H., 2019, MNRAS, 487, 1986
- Beasley et al. (2018) Beasley M. A., Trujillo I., Leaman R., Montes M., 2018, Nature, 555, 483
- Belokurov et al. (2014) Belokurov V., Irwin M. J., Koposov S. E., Evans N. W., Gonzalez-Solares E., Metcalfe N., Shanks T., 2014, MNRAS, 441, 2124
- Belokurov et al. (2006) Belokurov V. et al., 2006, ApJ, 647, L111
- Blakeslee (1997) Blakeslee J. P., 1997, ApJ, 481, L59
- Brodie & Huchra (1991) Brodie J. P., Huchra J. P., 1991, ApJ, 379, 157
- Bullock & Boylan-Kolchin (2017) Bullock J. S., Boylan-Kolchin M., 2017, ARAA, 55, 343
- Carretta et al. (2009) Carretta E., Bragaglia A., Gratton R., D’Orazi V., Lucatello S., 2009, A&A, 508, 695
- Chantereau, Charbonnel & Meynet (2016) Chantereau W., Charbonnel C., Meynet G., 2016, A&A, 592, A111
- Cohen et al. (2010) Cohen J. G., Kirby E. N., Simon J. D., Geha M., 2010, ApJ, 725, 288
- Côté et al. (2002) Côté P., Djorgovski S. G., Meylan G., Castro S., McCarthy J. K., 2002, ApJ, 574, 783
- Côté, West & Marzke (2002) Côté P., West M. J., Marzke R. O., 2002, ApJ, 567, 853
- Dekel & Silk (1986) Dekel A., Silk J., 1986, ApJ, 303, 39
- Drlica-Wagner et al. (2015) Drlica-Wagner A. et al., 2015, ApJ, 813, 109
- Faber et al. (2003) Faber S. M. et al., 2003, 4841, 1657
- Frebel & Norris (2015) Frebel A., Norris J. E., 2015, ARAA, 53, 631
- Fritz et al. (2019) Fritz T. K., Carrera R., Battaglia G., Taibi S., 2019, A&A, 623, A129
- Gaia Collaboration et al. (2018) Gaia Collaboration, Brown A. G. A., Vallenari A., Prusti T., de Bruijne J. H. J., Babusiaux C., Bailer-Jones C. A. L., 2018, arXiv:1804.09365
- Geringer-Sameth, Koushiappas & Walker (2015) Geringer-Sameth A., Koushiappas S. M., Walker M., 2015, ApJ, 801, 74
- Gieles et al. (2018) Gieles M. et al., 2018, MNRAS, 478, 2461
- Gilmore et al. (2007) Gilmore G., Wilkinson M. I., Wyse R. F. G., Kleyna J. T., Koch A., Evans N. W., Grebel E. K., 2007, ApJ, 663, 948
- Gratton et al. (2019) Gratton R., Bragaglia A., Carretta E., D’Orazi V., Lucatello S., Sollima A., 2019, The Astronomy and Astrophysics Review, 27, 8
- Gratton et al. (2007) Gratton R. G. et al., 2007, A&A, 464, 953
- Harris (2010) Harris W. E., 2010, eprint arXiv:1012.3224
- Hastings (1970) Hastings W. K., 1970, Biometrika, 97
- Hernitschek et al. (2017) Hernitschek N. et al., 2017, ApJ, 850, 96
- Homma et al. (2019) Homma D. et al., 2019, PASJ, 71, 94
- Homma et al. (2016) —, 2016, ApJ, 832, 21
- Ibata et al. (2020) Ibata R., Bellazzini M., Thomas G., Malhan K., Martin N., Famaey B., Siebert A., 2020, arXiv e-prints, arXiv:2002.11121
- Innanen, Harris & Webbink (1983) Innanen K. A., Harris W. E., Webbink R. F., 1983, AJ, 88, 338
- Ishiyama et al. (2016) Ishiyama T., Sudo K., Yokoi S., Hasegawa K., Tominaga N., Susa H., 2016, ApJ, 826, 9
- Ivezić et al. (2008) Ivezić Ž. et al., 2008, ApJ, 684, 287
- Ji et al. (2019) Ji A. P., Simon J. D., Frebel A., Venn K. A., Hansen T. T., 2019, ApJ, 870, 83
- Kim & Jerjen (2015) Kim D., Jerjen H., 2015, ApJ, 799, 73
- Kirby et al. (2013a) Kirby E. N., Boylan-Kolchin M., Cohen J. G., Geha M., Bullock J. S., Kaplinghat M., 2013a, ApJ, 770, 16
- Kirby et al. (2013b) Kirby E. N., Cohen J. G., Guhathakurta P., Cheng L., Bullock J. S., Gallazzi A., 2013b, ApJ, 779, 102
- Kirby et al. (2008) Kirby E. N., Simon J. D., Geha M., Guhathakurta P., Frebel A., 2008, ApJ, 685, L43
- Kleyna et al. (2005) Kleyna J. T., Wilkinson M. I., Evans N. W., Gilmore G., 2005, ApJ, 630, L141
- Klypin et al. (1999) Klypin A., Kravtsov A. V., Valenzuela O., Prada F., 1999, ApJ, 522, 82
- Koposov et al. (2007) Koposov S. et al., 2007, ApJ, 669, 337
- Koposov, Belokurov & Torrealba (2017) Koposov S. E., Belokurov V., Torrealba G., 2017, MNRAS, 470, 2702
- Koposov et al. (2015) Koposov S. E. et al., 2015, ApJ, 811, 62
- Koposov et al. (2011) —, 2011, ApJ, 736, 146
- Laevens et al. (2015) Laevens B. P. M. et al., 2015, ApJ, 813, 44
- Law & Majewski (2010) Law D. R., Majewski S. R., 2010, ApJ, 714, 229
- Longeard et al. (2018) Longeard N. et al., 2018, MNRAS, 480, 2609
- Longeard et al. (2020) —, 2020, MNRAS, 491, 356
- Martin et al. (2016a) Martin N. F. et al., 2016a, MNRAS, 458, L59
- Martin et al. (2007) Martin N. F., Ibata R. A., Chapman S. C., Irwin M., Lewis G. F., 2007, MNRAS, 380, 281
- Martin et al. (2016b) Martin N. F. et al., 2016b, ApJ, 818, 40
- Martin et al. (2016c) —, 2016c, ApJ, 830, L10
- Massari & Helmi (2018) Massari D., Helmi A., 2018, A&A, 620, A155
- Mau et al. (2019) Mau S. et al., 2019, arXiv e-prints, arXiv:1912.03301
- Melo et al. (2009) Melo C., Primas F., Pasquini L., Patat F., Smoker J., 2009, The Messenger, 135, 17
- Mo, van den Bosch & White (2010) Mo H., van den Bosch F. C., White S., 2010, Galaxy Formation and Evolution
- Moore (1996) Moore B., 1996, ApJ, 461, L13
- Nadler et al. (2019) Nadler E. O., Gluscevic V., Boddy K. K., Wechsler R. H., 2019, ApJ, 878, L32
- Pasquini et al. (2002) Pasquini L. et al., 2002, The Messenger, 110, 1
- Pfeffer et al. (2018) Pfeffer J., Kruijssen J. M. D., Crain R. A., Bastian N., 2018, MNRAS, 475, 4309
- Riley & Strigari (2020) Riley A. H., Strigari L. E., 2020, arXiv e-prints, arXiv:2001.11564
- Roederer et al. (2016) Roederer I. U. et al., 2016, AJ, 151, 82
- Schaye et al. (2015) Schaye J. et al., 2015, MNRAS, 446, 521
- Shapley (1938a) Shapley H., 1938a, Harvard College Observatory Bulletin, 908, 1
- Shapley (1938b) —, 1938b, Nature, 142, 715
- Simon et al. (2019) Simon J., Fu S. W., Geha M., Kelson D. D., Alarcon Jara A. G., 2019, in American Astronomical Society Meeting Abstracts, Vol. 233, American Astronomical Society Meeting Abstracts #233, p. 449.04
- Simon (2019) Simon J. D., 2019, ARAA, 57, 375
- Simon & Geha (2007a) Simon J. D., Geha M., 2007a, ApJ, 670, 313
- Simon & Geha (2007b) —, 2007b, ApJ, 670, 313
- Simon et al. (2011) Simon J. D. et al., 2011, ApJ, 733, 46
- Simon et al. (2017) —, 2017, ApJ, 838, 11
- Springel et al. (2008) Springel V. et al., 2008, MNRAS, 391, 1685
- Starkenburg et al. (2010) Starkenburg E. et al., 2010, A&A, 513, A34
- Starkenburg et al. (2017) —, 2017, MNRAS, 471, 2587
- Torrealba et al. (2018) Torrealba G. et al., 2018, MNRAS, 475, 5085
- Villaume et al. (2019) Villaume A., Romanowsky A. J., Brodie J., Strader J., 2019, ApJ, 879, 45
- Vivas, Martínez-Vázquez & Walker (2020) Vivas A. K., Martínez-Vázquez C., Walker A., 2020, arXiv e-prints, arXiv:2001.01107
- Vogelsberger et al. (2014) Vogelsberger M. et al., 2014, MNRAS, 444, 1518
- Walker et al. (2016) Walker M. G. et al., 2016, ApJ, 819, 53
- Webster, Frebel & Bland-Hawthorn (2016) Webster D., Frebel A., Bland-Hawthorn J., 2016, ApJ, 818, 80
- Wheeler et al. (2019) Wheeler C. et al., 2019, MNRAS, 490, 4447
- White & Rees (1978) White S. D. M., Rees M. J., 1978, MNRAS, 183, 341
- Willman et al. (2005) Willman B. et al., 2005, ApJ, 626, L85
- Willman & Strader (2012) Willman B., Strader J., 2012, AJ, 144, 76
- Wolf et al. (2010) Wolf J., Martinez G. D., Bullock J. S., Kaplinghat M., Geha M., Muñoz R. R., Simon J. D., Avedo F. F., 2010, MNRAS, 406, 1220
- Youakim et al. (2017) Youakim K. et al., 2017, MNRAS, 472, 2963
- Zucker et al. (2006) Zucker D. B. et al., 2006, ApJ, 650, L41