Soft landing of metal clusters on graphite: a molecular dynamics study
Abstract
Structure and stability of 3 nm size Ag887, Au887 and Ti787 clusters deposited on graphite under soft landing conditions ( eV per atom) are studied by means of molecular dynamics simulations. Parameters for the cluster–surface interaction are derived from complementary ab initio calculations. We found that the shape of clusters on the surface is governed by their elemental composition and depends also on the initial cluster structure and landing conditions. At deposition energies below 0.1 eV/atom, the Ag887 cluster acquires an ellipsoidal shape, while Au887 and Ti787 clusters transform into oblate and prolate truncated spheroids, respectively, due to stronger adhesion to graphite. The clusters flatten over the surface and eventually disintegrate as the deposition energy increases. Simulation results reveal that Ag887 and Au887 fragment at about eV/atom whereas higher energy of about 3 eV/atom is required for the fragmentation of Ti787. The contact angle, contact radius and height of the clusters as functions of deposition energy are determined from fitting the positions of cluster surface atoms with a surface equation. The dependence of these parameters on internal energy of the clusters is also analyzed.
I Introduction
The interaction of atomic clusters and nanoparticles with surfaces has been a widely studied topic in cluster science over the past several decades Jensen_1999_RMP.71.1695 ; Meiwes-Broer_book ; ISACC_LatestAdv_2008 . The dynamics of metal clusters and carbon fullerenes deposited onto different surfaces (mainly, metal surfaces, graphite and silicon oxide) was explored both experimentally Bromann_1996_Science.274.956 ; Carroll_1996_JPCM.8.L617 ; Hillenkamp_2002_JCP.116.6764 ; Kaplan_2009_PRB.79.233405 and computationally by means of molecular dynamics (MD) simulations Cheng_1994_JPC.98.3527 ; Thaler_2014_JCP.140.044326 ; Bernstein_2016_JCP.145.044303 . The strong interest in the deposition of mass-selected clusters on surfaces has been motivated by both fundamental research and technological applications.
From a fundamental physics viewpoint, an important question is how structural, electronic, magnetic and optical properties of deposited clusters change with respect to free counterparts. A variety of phenomena emerge also when atomic clusters are brought in contact with a surface. Examples include fragmentation of clusters and implantation of cluster atoms into the substrate Pratontep_2003_PRL.90.055503 , penetration of energetic clusters through a substrate and surface sputtering Smith_1993_ProcRoyalSocA.441.495 ; Plant_2014_Nanoscale.6.1258 , irradiation-induced structural rearrangements of deposited clusters Wang_2012_PRL.108.245502 , cluster diffusion and aggregation into islands Bardotti_1995_PRL.74.4694 ; Alayan_2007_PRB.76.075424 , super-diffusion and Lévy flights Luedtke_1999_PRL.82.3835 , as well as the formation and fragmentation of fractal nanostructures Brechignac_2002_PRL.88.196103 ; Lando_2007_EPJD.43.151 ; Solovyov_2014_PSSB.251.609 .
From a technological viewpoint, an understanding of the cluster–surface interaction is crucial for the controllable production of novel materials such as thin films and nanostructured surfaces Palmer_2003_NatureMater.2.443 , supported nanocatalysts Vajda_2015_ACSCatal.5.7152 as well as nanoscale components for electronic devices ClusterBeamDeposition_book_2020 . If the process of cluster landing on a surface significantly modifies their shape and morphology, the major technical effort required to produce size-selected cluster beams is largely in vain. Stability of size-selected clusters on a surface is therefore a key goal of deposition studies.
Stability and electronic properties of small clusters deposited on solid surfaces were also studied theoretically within the framework of the liquid drop model Poenary_2007_EPL.79.63001 ; Poenaru_2008_EPJD.47.379 ; Semenikhina_2008_JETP.106.678 . Analytical relations were derived for the deformation-dependent surface and curvature energies of small NaN and ArN () clusters of different shapes (oblate and prolate spheroids, semi-spheroids and truncated ellipsoids) deposited on a solid surface. Sequences of “magic” numbers for spheroidal and semi-spheroidal clusters were determined for different values of the deformation parameter Poenaru_2008_EPJD.47.379 . These results demonstrated the important role of deformation and quantum effects in determining the stability of small atomic clusters on a substrate.
This paper reports a computational study of structure and stability of large (3 nm in diameter) silver, gold and titanium clusters, Ag887, Au887 and Ti787, deposited on graphite. To the best of our knowledge, a comparative analysis of the dynamics of clusters made of different elements and deposited at the same conditions has been lacking in the previous MD papers, each of which has focused on one type of atomic clusters. Other than that, an important question in MD simulations of cluster deposition concerns the choice of an interaction potential between the cluster and the substrate. Since the cluster–substrate interaction at soft-landing conditions is weak, the widely accepted approach is to describe this interaction using pairwise Lennard-Jones or Morse potentials. However, a literature review reveals that parameters of these potentials vary significantly across publications. Therefore, it is an open question how the parameters of metal–surface interatomic interactions would affect the stability of deposited clusters.
In this paper, we focused on the deposition energy range of eV per atom, which corresponds to the soft-landing regime utilized in numerous experiments (e.g., Refs. Brechignac_2002_PRL.88.196103 ; Lando_2007_EPJD.43.151 ; Solovyov_2014_PSSB.251.609 ; Couillard_2003_APL.82.2595 to name a few). Other phenomena that arise at more energetic collisions, e.g. cluster pinning or the formation of holes due to penetration of clusters through a substrate Pratontep_2003_PRL.90.055503 ; Smith_1993_ProcRoyalSocA.441.495 ; Plant_2014_Nanoscale.6.1258 , are beyond the scope of this study but can also be simulated using the computational approach described below in Sect. II.
Parameters for the interaction between metal atoms and graphite are obtained from complementary ab initio calculations employing the second-order Møller-Plesset (MP2) perturbation theory. We found that the shape of deposited clusters depends strongly on the element type. The positions of cluster surface atoms obtained from MD simulations are fitted with a surface equation. From this fit, the contact angle, contact radius and height of the clusters are determined as functions of deposition energy. The dependence of these parameters on the initial cluster structure and internal energy of the clusters is also analyzed. Pre-equilibration of clusters at elevated temperatures results in a significant decrease of the contact angle, although this trend is different for the silver, gold and titanium clusters. The shape of Ti787 is rather stable at cluster temperatures up to 900 K and deposition energies up to 0.25 eV/atom, whereas the shape of thermally excited Ag887 and Au887 clusters changes significantly even at low deposition energies.
II Computational methodology
The simulations were performed using MBN Explorer MBNExplorer_JCompChem_2012 – a software package for advanced multiscale modeling of complex molecular structure and dynamics. MBN Studio MBNStudio_paper_2019 , a dedicated graphical user interface for MBN Explorer, was used to construct the systems, prepare all necessary input files and analyze simulation outputs.
II.1 Metal clusters
As a first step, spherical clusters with the diameter of 3 nm were cut from ideal silver, gold and titanium crystals. The resulting structures contained = = 887 and = 787 atoms. Energy minimization calculations were conducted for the free clusters using the velocity quenching algorithm MBNExplorer_UsersGuide with the time step of 1 fs. Interatomic interactions were described using the many-body Gupta potential Gupta and the parameters were taken from Ref. Cleri_1993_PRB.48.22 .
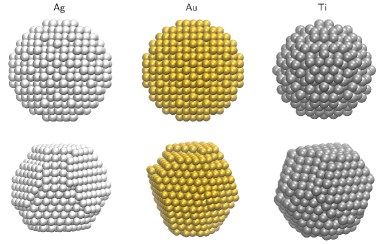
Energy-minimized structures were annealed by means of MD simulations following the computational protocol from Ref. Ellaby_2018_JPCM.30.155301 . The annealing procedure enabled sampling of the configuration space of the clusters at elevated temperatures, at which the cluster surface has undergone a phase transition but the core remained, at least partly, in the solid phase. This protocol was validated Ellaby_2018_JPCM.30.155301 by the comparison of annealed cluster geometries with the structures obtained from scanning transmission electron microscopy experiments. The clusters were heated up to 700 K for Au887, 800 K for Ag887 and 900 K for Ti787. These values are about K lower than the melting temperatures of the clusters which were determined through the analysis of caloric curves and root-mean-square displacement of all atoms. Each cluster was heated from 0 K up to the target temperature for 1 ns, then kept at this temperature for 2 ns and cooled down to 0 K over 1 ns, so that one annealing cycle was completed in 4 ns. Three subsequent cycles were performed for each cluster to get energetically favorable structures. Potential energy of each cluster decreased upon annealing by about eV/atom with respect to the initial values obtained from energy minimization. The annealed cluster structures contained several grains with different (mainly, fcc and hcp) crystal lattices. Final structures of the energy-minimized and annealed clusters are compared in Fig. 1.
II.2 Graphite substrate
The constructed graphite substrate contained 5 monolayers with the size of Å2. These dimensions were chosen to replicate the system with periodic boundary conditions. The substrate size was more than three times larger than the cluster size and significantly exceeded the range of interatomic interactions as described below. Thus, we ensured that there is no artificial interaction across the simulation box boundaries. Prior simulation of cluster deposition, the substrate was energy minimized using the velocity quenching algorithm. The many-body Brenner potential Brenner_1990_PRB.42.9458 was used to describe the interaction between covalently-bonded carbon atoms within each graphite layer whereas the Lennard-Jones potential was employed to account for the van der Waals interaction between the layers. The Lennard-Jones potential is implemented in MBN Explorer in the following form:
| (1) |
where is the depth of the potential energy well and is the equilibrium interatomic distance. Parameters for the carbon–carbon interaction (see Table 1) were taken from Ref. Geng_2009_JPCC.113.6390 . The Lennard-Jones potential was truncated at a cutoff distance of 10 Å that is about 3 times greater than the interplanar distance in graphite and an order of magnitude smaller than the size of the simulation box.
II.3 Metal–carbon interaction
The cluster–substrate interaction was also described by the Lennard-Jones potential using the cutoff distance of 10 Å. Several MD studies of noble and transition-metal clusters (Ag, Au, Pt, Cu, Ni) interacting with graphite and graphene were reported earlier, see e.g. Ryu_2010_JPCC.114.2022 ; Luedtke_1999_PRL.82.3835 ; Neek-Amal_2009_Nanotechnology.20.135602 . Parameters for the metal–carbon interaction were derived in these papers using empirical mixing rules:
| (2) |
where and are the parameters of metal–metal interactions Erkoc_2001_AnnuRevCompPhys.IX.1 . Other studies have shown Verkhovtsev_2014_EPJD.68.246 ; Galashev_2019_PhysLettA.383.252 that parameters for the pairwise interactions between metal atoms and carbon systems, such as fullerenes or carbon nanotubes, differ significantly from those derived using the mixing rules. Thus, a broad range of parameters for various metal–carbon systems can be found in literature, and the optimal choice of the parameters is not obvious.
| (eV) | (Å) | Ref. | ||
| C–C | 0.00286 | 3.89 | Geng_2009_JPCC.113.6390 | |
| Ag–C | 0.020 | 3.49 | this work (MP2) | |
| 0.029 | 3.32 | Ryu_2010_JPCC.114.2022 | ||
| 0.030 | 3.37 | Neek-Amal_2009_Nanotechnology.20.135602 | ||
| 0.009 | 3.45 | Galashev_2019_PhysLettA.383.252 (Morse) | ||
| Au–C | 0.044 | 3.49 | this work (MP2) | |
| 0.033 | 3.32 | Ryu_2010_JPCC.114.2022 | ||
| 0.013 | 3.36 | Luedtke_1999_PRL.82.3835 | ||
| Ti–C | 0.165 | 2.44 | this work (MP2) | |
| Ni–C | 0.023 | 3.20 | Ryu_2010_JPCC.114.2022 | |
| 0.345 | 2.03 | Verkhovtsev_2014_EPJD.68.246 (Morse) | ||
| 0.363 | 2.28 | Galashev_2019_PhysLettA.383.252 (Morse) |
To elaborate on this issue, we performed ab initio calculations of potential energy scans for Ag, Au and Ti atoms interacting with a benzene molecule, which can be considered as a smallest structural unit of a graphite layer. It is known (see, e.g., Refs. Obolensky_2007_IntJQuantChem.107.1335 ; Grimme_2011_WIRE.1.211 and references therein) that standard DFT methods do not account properly for long-range dispersion interactions and require additional empirical corrections. The importance of non-local correlation effects that govern dispersive interactions was particularly emphasized for the binding of atoms and small clusters of silver and gold on graphite Amft_2011_JPCM.23.395001 ; Jalkanen_2007_JPCA.111.12317 .
Since the dispersive interaction is naturally accounted for in wave function-based ab initio methods, a series of calculations employing the second-order Møller-Plesset (MP2) perturbation theory were performed. The Gaussian 09 software package g09 using a LanL2DZ basis set was employed. The metal atoms were placed in the hollow position on top of the benzene molecule and displaced along its main axis. The metal atom–benzene interaction energy was obtained from these scans and divided by the number of carbon atoms to determine the interaction energy per M–C pair of atoms. Since benzene is a highly symmetric molecule and the metal atoms were displaced along its main axis, all M–C bonds can be considered as equivalent. The evaluated parameters of the Lennard-Jones potential for Ag–C, Au–C and Ti–C are summarized in Table 1. Other values reported in literature Luedtke_1999_PRL.82.3835 ; Ryu_2010_JPCC.114.2022 ; Neek-Amal_2009_Nanotechnology.20.135602 ; Galashev_2019_PhysLettA.383.252 are also presented for completeness. Note that the parameters from Refs. Ryu_2010_JPCC.114.2022 ; Luedtke_1999_PRL.82.3835 ; Neek-Amal_2009_Nanotechnology.20.135602 were determined using the mixing rules (Eq. (2)) while the parameters from Refs. Verkhovtsev_2014_EPJD.68.246 ; Galashev_2019_PhysLettA.383.252 were derived on the basis of DFT calculations. To the best of our knowledge, there is no reference data available on the interaction between Ti and C atoms. Therefore, in Table 1 we provide also parameters taken from literature Ryu_2010_JPCC.114.2022 ; Verkhovtsev_2014_EPJD.68.246 ; Galashev_2019_PhysLettA.383.252 for the interaction between carbon and nickel, another open-shell transition metal.
Our MP2 calculations revealed that the metal–carbon interaction energy increases from silver to gold to titanium. The Au–C potential well depth is about two times larger than for the Ag–C interaction. This is in agreement with the results of earlier DFT calculations with dispersion corrections Amft_2011_JPCM.23.395001 which found that adsorption energy of a gold atom on graphite is about two times higher than for a silver atom. It was also found Amft_2011_JPCM.23.395001 that no charge redistribution occurs between the Ag atom and graphite, while the deposited Au atom receives a charge of approximately 0.1 from the carbon sheet. On this basis, it was concluded that the adsorption of silver on graphite is purely of van der Waals type whereas small hybridization in the density of states, i.e. a chemical contribution to the binding, occurs in the case of gold adsorbed on graphite. As it is indicated in Table 1, the Ti–C interaction is about eight times stronger than the Ag–C interaction. A recent DFT-based study of the titanium/graphite interface Chen_2020_JPCM.32.145001 reported the formation of chemical bonding between interfacial Ti and C atoms. It was found also that an interfacial Ti atom acquires a charge of about . Another DFT study of the adsorption of a titanium slab on graphene demonstrated that a hybridization occurs between atomic orbitals of carbon and titanium Hsu_2014_ACSNano.8.7704 .
II.4 Deposition of clusters on graphite
For MD simulations of cluster deposition, a simulation box of Å3 was used. Each cluster was placed in the center of the simulation box approximately 40 Å above the topmost graphite layer. The clusters were deposited with energies and 1.0 eV/atom at normal incidence to the graphite surface. To determine fragmentation threshold for the Ti787 cluster, higher deposition energies from 2.0 to 5.0 eV/atom were also considered.
To simulate the deposition of clusters and their rearrangement on the surface, 250-ps long MD simulations were performed for the microcanonical () ensemble of particles. The simulation time was chosen such that, after hitting the surface, the clusters would relax for at least 200 ps. Kinetic and potential energies of the system reached steady-state values within ps after the collision and remained practically constant until the end of each simulation. Integration of equations of motion was done using the velocity Verlet algorithm with the time step of 1 fs. We ensured that a variation of the total energy of the system did not exceed 0.01% with this time step. Two bottom graphite layers were fixed to avoid translational motion of the whole system after the collision. Test calculations were performed also for thicker graphite substrates containing 7 and 11 monolayers to check that the results obtained do not depend on substrate thickness.
As described in Section III, disintegration of the clusters and scattering of cluster fragments over the whole graphite sample were observed at deposition energies of 0.75 eV/atom and above. To ensure that the simulation box boundaries do not affect the results, a set of simulations was performed on a larger graphite substrate with the size of Å2. The total number of atoms in the systems thus varied from approx. 19,000 to 86,000.
III Results and discussion
We begin our analysis by considering deposition of the spherical Ag887, Au887 and Ti787 clusters cut from ideal bulk crystals. Then we discuss how alteration of the initial cluster structure due to annealing affects their shape upon deposition. Finally, we consider deposition of thermally excited clusters and compare the resulting shapes with the case of deposition at zero temperature.
For cluster sizes smaller than we considered in this study, quantum effects such as even-odd oscillations in cluster abundance spectra Katakuse_1985_IJMS.67.229 and the appearance of “magic” numbers associated with electron shell closure Haekkinen_2016_AdvPhysX.1.467 , become more prominent and play a crucial role in determining the shape of clusters on a surface Poenaru_2008_EPJD.47.379 . Such effects are particularly strong for the clusters containing atoms but shrink with increasing the cluster size up to Reinhard_ClusterDynamics .
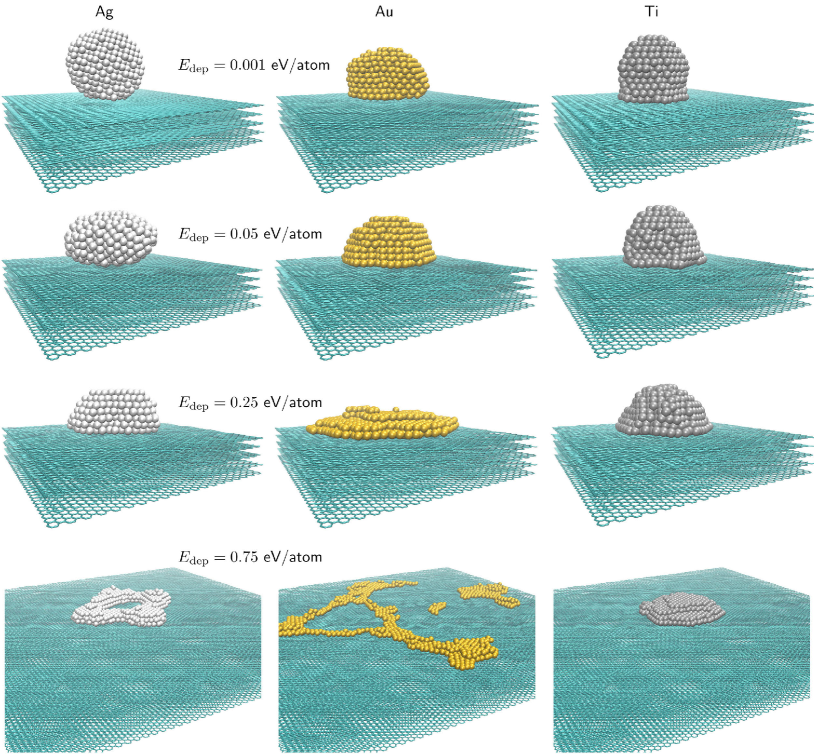
Figure 2 shows final snapshots of the spherical Ag887, Au887 and Ti787 clusters deposited on graphite at different deposition energies . The figure indicates clearly that the cluster geometry depends on the element type and that it changes significantly with an increase of deposition energy. At eV/atom (upper row) the Ag887 cluster retains its spherical shape, whereas the gold and titanium clusters are deformed due to stronger adhesion to the surface. The Au887 cluster has the shape of a truncated ellipsoid while Ti787 is a capped structure elongated in the direction normal to the substrate. At eV/atom (second row) the silver cluster acquires a slightly deformed quasi-ellipsoidal shape, while both gold and titanium clusters transform into truncated ellipsoids. All three clusters deposited at eV/atom (third row) transform into truncated ellipsoids with the gold cluster being the most flattened structure. Finally, at eV/atom (bottom row) topology of the silver and gold clusters changes after collision with the surface. The Ag887 cluster becomes a hollow structure that remains stable over the 250-ps long simulation. The Au887 cluster fragments into a large pretzel-like structure and several smaller islands that are scattered over the surface. In contrast, Ti787 remains intact but gradually becomes more and more flattened. Note that the simulations performed at eV/atom were conducted on a large graphite substrate of Å2.
Coordinates of cluster atoms, extracted from each MD trajectory, were used to parameterize the cluster shape and to evaluate a contact angle with the substrate. As follows from the simulated trajectories, each deposited cluster is, to a good approximation, radially symmetric with respect to its main axis. Thus, we introduced cylindrical coordinates and , where
| (3) |
with and being - and -projections of the center of mass of each cluster. The -axis lies in the graphite surface plane, whereas -axis is perpendicular to the surface and corresponds to the average position of the topmost graphite layer. Figure 3 shows by symbols () projections of all atoms in the Ag887, Au887 and Ti787 clusters deposited at 0.01 eV/atom. Figure 3(a) shows that at low values of the Ag887 cluster acquires the shape of a non-truncated ellipsoid which is slightly deformed from the side which is in contact with graphite. The initially spherical Au887 cluster transforms into a truncated oblate spheroid (Fig. 3(b)) while the Ti787 cluster has a well pronounced prolate shape, i.e. its height is larger than the contact radius (Fig. 3(c)). Interestingly, atoms in the titanium cluster arrange into layers oriented parallel to graphite planes, that is different from the atomic arrangement in the silver and gold clusters. This can be explained by a stronger interaction between titanium and carbon atoms as compared to the Ag–C and Au–C interactions.
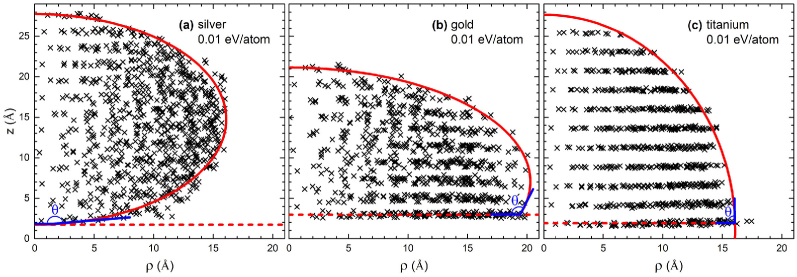
For each cluster we selected coordinates of atoms located on the surface and fitted the resulting profiles with the following surface equation Giovambattista_2007_JPCB.111.9581 ; Skvara_2018_MolSimul.44.190 :
| (4) |
where , , and are fitting parameters. This expression enables a description of different cluster shapes with a single fitting function without any geometrical assumptions on the cluster shape. From the least-squares fit of cluster profiles with Eq. (4) we determined the contact radius and height of each cluster as well as the contact angle with the substrate as functions of deposited energy. An inverse dependence is shown by solid red curves in Fig. 3.
The contact angle was evaluated by calculating the derivative of at the point which corresponds to the average position of the bottom-most atomic layer of the clusters, , see the dashed lines in Fig. 3. An expression for the contact angle is then given by Giovambattista_2007_JPCB.111.9581
| (5) |
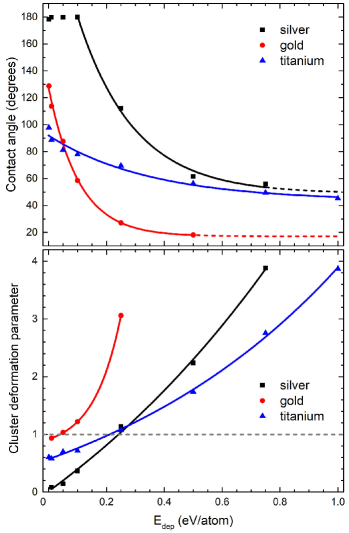
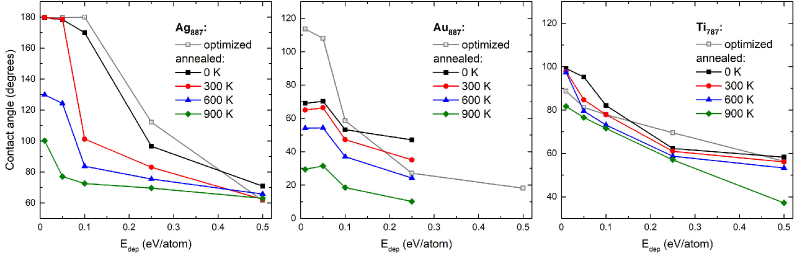
The contact angle for the optimized Ag887, Au887 and Ti787 clusters as a function of deposition energy is presented in the upper panel of Fig. 4. The calculated values of were averaged over three distinct cluster geometries sampled from the last 100 ps of each simulation. It was found that the deposited clusters acquire their equilibrium shapes shortly after reaching the surface (on the timescales of few tens of picoseconds) and a variation of in the remaining part of simulations does not exceed 10 degrees.
The figure shows that the contact angle for the Ag887 cluster (black squares) evolves differently with an increase of than for the gold and titanium clusters. The main distinction is that for Ag887 remains close to 180∘ at deposition energies up to 0.1 eV/atom. A further increase of up to 0.25 eV/atom leads to a rapid decrease of the angle by about 70 degrees whereas it converges to a value of about 60∘ at eV/atom. At higher deposition energies, the cluster fragments into several small islands and therefore the contact angle was not determined. A similar trend was observed for Au887 (red circles). In this case, the contact angle drops rapidly from approx. 130∘ at eV/atom down to 20∘ at eV/atom. In the latter case, the cluster is rearranged into two atomic layers which are distributed uniformly over large graphite area. Deposition at higher energies also leads to cluster fragmentation and the formation of smaller islands with the height of two atomic layers. For the Ti787 cluster (blue triangles), gradually decreases from 100∘ to 45∘ in the deposition energy range considered. This corresponds to the observations shown in Fig. 2 that the contact area for Ti787 increases gradually with . Interestingly, the contact angle for all three clusters considered decreases exponentially with ,
| (6) |
see solid curves in the upper panel of Fig. 4. The corresponding fitting parameters are summarized in Table 2.
| Ag887 | Au887 | Ti787 | |||
|---|---|---|---|---|---|
| (deg.) | 48.87 | 17.11 | 43.47 | ||
| (deg.) | 219.93 | 110.30 | 48.52 | ||
| (eV-1/atom) | 5.13 | 9.58 | 2.83 | ||
| -4.29 | 0.76 | -1.04 | |||
| 4.30 | 0.16 | 1.61 | |||
| (eV-1/atom) | 0.85 | 10.74 | 1.12 |
Additional MD simulations were conducted at higher deposition energies to determine the fragmentation threshold for Ti787. We found that the threshold deposition energy is between 2 and 3 eV per atom, which is about four times larger than the corresponding fragmentation thresholds for Ag887 and Au887. At eV/atom the titanium cluster is flattened over the graphite surface but remains intact, whereas at eV/atom the cluster transforms into a flat pretzel-like structure (similar to the Au887 cluster deposited at 0.75 eV/atom, see Fig. 2) with the maximal height of two atomic layers. Deposition of Ti787 at 4 eV/atom results in the formation of small titanium islands that are scattered over the whole simulated substrate. Note that the fragmentation thresholds should depend not only on elemental composition of the clusters but also on their size. However, we leave a detailed analysis of this dependence for further studies.
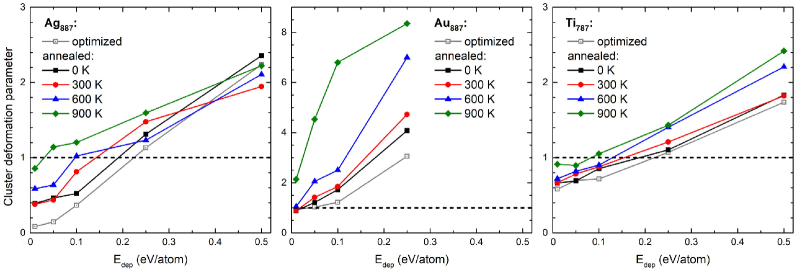
To complement this analysis, the lower panel of Fig. 4 shows the cluster deformation parameter , defined as a ratio of cluster contact radius (radius of the bottom-most atomic layer, see Fig. 3) to cluster height,
| (7) |
for the initially spherical Ag887, Au887 and Ti787 clusters deposited at different energies. The dependence of on also follows an exponential law,
| (8) |
see solid curves in the lower panel of Fig. 4. The corresponding fitting parameters are also listed in Table 2. The horizontal dashed line denotes the case when the contact radius is equal to the height, which corresponds to a perfect semi-spheroidal shape. The figure shows that the shape of Au887 is close to a semi-spheroid at low deposition energies (up to 0.05 eV/atom) while highly oblate truncated spheroids are formed in the course of deposition at higher energies. A similar trend is observed for the silver and titanium clusters but in this case the cluster shape is close to a semi-spheroid at eV/atom. Thus, by increasing the deposition energy the clusters evolve from an ellipsoid (in the case of silver) or a truncated prolate spheroid (in the case of titanium) to semi-spheroids to very flat structures with the contact radius exceeding the cluster height by the factor of four.
The above described analysis was carried out for the spherical clusters deposited at zero temperature. It is worth exploring how the shape of deposited clusters would change upon altering the initial cluster structure due to annealing. Results of this analysis are summarized in Figs. 5 and 6, which show how the contact angle and the deformation parameter evolve as functions of . Gray lines / open symbols correspond to the spherical cluster case described above in Fig. 4. Black lines / filled squared represent the results for the annealed clusters (see Fig. 1) at initial temperature of 0 K. The figures show that alteration of the cluster structure due to annealing have a moderate impact on the shape of Ag887 and Ti787 clusters in the deposition energy range considered, whereas annealing of Au887 results in a very different geometry even at low deposition energy. At eV/atom the annealed gold cluster wets the surface stronger than its spherical counterpart and the contact angle decreases from 130∘ down to 70∘. However, the variation of with is much smaller than for the spherical Au887 cluster so that at eV/atom the contact angle for the annealed Au887 is almost two times larger than for the spherical cluster. Deposition of the annealed cluster at higher energies results in its fragmentation. Figure 6 indicates that the annealed noble metal clusters are characterized by a larger deformation parameter as compared to the spherical clusters but annealing of the titanium Ti787 cluster has a minor impact on its shape after deposition.
Finally, let us analyze how pre-equilibration of the clusters at different temperatures affects their stability and shape upon deposition. Figures 5 and 6 show the contact angle (Eq. (5)) and the deformation parameter (Eq. (7)) of the clusters after they were given an initial temperature of 300 K, 600 K and 900 K. The latter value is just above the melting point of Ag887 and Au887 but about 100 degrees less than the melting temperature of Ti787. Therefore, the silver and gold clusters equilibrated at 900 K are deposited as liquid droplets while the titanium cluster has a molten surface but its core is still, at least partly, in the solid phase. As one may expect, deposition of the clusters at elevated temperature leads to a significant decrease of the contact angle and an increased contact area at low deposition energies. The contact angle for Ag887 saturates with an increase of at the value of about 60 degrees, independent on the cluster initial temperature. In contrast, the shape of Au887 depends strongly on the amount of internal energy stored in the cluster. While the profile of the dependence does not change when the initial temperature is increased from 0 K to 900 K, a decrease of the contact angle is evident.
The contact angle for the thermalized silver cluster deposited at energies below 0.1 eV/atom exceeds the corresponding values for the gold and titanium clusters. This result agrees with experimental observations that nanometer-size silver clusters deposited on graphite at eV/atom Brechignac_2002_PRL.88.196103 ; Lando_2007_EPJD.43.151 ; Solovyov_2014_PSSB.251.609 are highly mobile, which leads to the formation of fractal-like silver nanostructures.
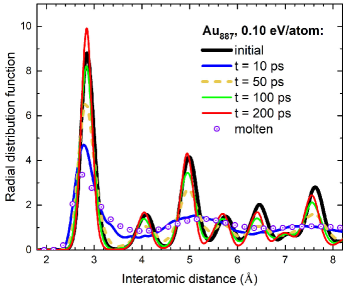
Further insights into the stability of clusters on the surface can be drawn from the analysis of radial distribution function (RDF). Figure 7 shows an exemplary RDF for the Au887 cluster, pre-equilibrated at 300 K prior deposition, at different time instances after the collision. Mechanical stress induced by the collision causes the formation of a liquid droplet within the first 10 ps after the collision (solid blue curve). Over the next 40 ps the droplet re-crystallizes into a solid structure whose RDF resembles the initial one (dashed yellow curve). This structure remains stable and practically does not change in the remaining part of the simulation.
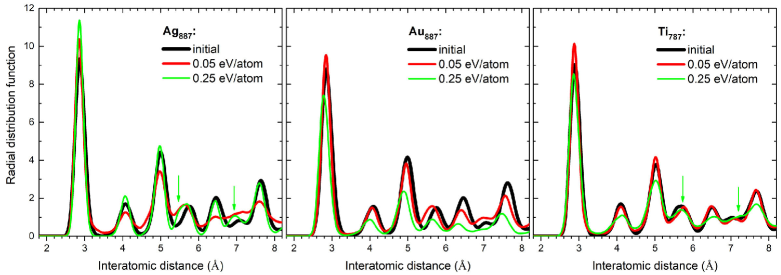
Further analysis reveals that the clusters undergo structural transformations induced by the collision. Figure 8 compares RDFs for the annealed Ag887, Au887 and Ti787 clusters deposited at 0.05 and 0.25 eV/atom. The RDFs are calculated at the end of each 250-ps long trajectory. Lattice structure of the gold cluster deposited at 0.25 eV/atom becomes compressed as compared to the initial structure (see middle panel). This is evident from that the fact that all the peaks in the RDF are strongly suppressed and uniformly shifted towards smaller interatomic distances. The silver cluster deposited at both 0.05 and 0.25 eV/atom maintains the short-range order (see left panel). However, at eV/atom the long-range order is lost as the peaks in the interatomic distance range of Å are merged into a broader and more uniform distribution. In this case, the cluster does not melt upon collision and then recrystallize (as it is shown in Fig. 7) but forms an amorphous-like structure without long-range order, which is stable on the simulation timescale of 250 ps. Amorphization of the Ag887 cluster deposited at 0.05 eV/atom can also be seen in Fig. 2. In contrast, lattice structure of the silver cluster deposited at eV/atom resembles, to a large extent, the initial lattice structure. The only important difference is the formation of a shoulder at the interatomic distance of about 5.5 Å and a shift of another peak centered at 7.1 Å to 6.9 Å (see green arrows). This is an indication of an increased ratio of hcp lattice packing in the deposited cluster structure. RDFs for the Ti787 cluster (right panel) illustrate the opposite phenomenon, namely a shift of the peaks centered at 5.5 Å and 6.9 Å towards larger interatomic distances, that is indicative for an increased ratio of fcc lattice in the final cluster structure.
IV Conclusion
The deposition of metal clusters made of three different elements – silver, gold and titanium – on a graphite substrate was studied by means of molecular dynamics simulations using the MBN Explorer and MBN Studio software packages. The clusters had the diameter of 3 nm and contained = = 887 and = 787 atoms. We focused on deposition energies in the range eV/atom, which corresponds to the soft-landing regime utilized in experiments. Parameters for the interaction between metal atoms and a carbon surface were determined from ab initio calculations employing the second-order Møller-Plesset (MP2) perturbation theory.
We found that the shape and stability of deposited clusters depends strongly on the element type. At low deposition energies, the Ag887 cluster has a quasi-ellipsoid shape while the gold and titanium clusters rearrange upon collision into truncated oblate and prolate spheroids. Both silver and gold clusters flatten over the surface and eventually disintegrate as the deposition energy increases up to eV/atom, while the titanium cluster fragments at about four times higher energy.
The positions of cluster surface atoms obtained from MD simulations were fitted with a surface equation. From this fit, the contact angle, contact radius and height of the clusters were determined as functions of deposition energy. We found that the contact angle for the noble metal and titanium clusters evolves differently with an increase of deposition energy. The contact angle for the silver cluster does not vary significantly at low deposition energies up to 0.1 eV/atom, while it rapidly decreases by about 70 degrees at higher energies. For the gold cluster, the angle drops rapidly from 130∘ down to 20∘ at eV/atom. The contact angle for the titanium cluster decreases gradually from 100∘ to 45∘ in the range of deposition energies considered.
We also analyzed how the initial structure (optimized vs. annealed geometries) and internal energy of the clusters affects the shape and stability of the deposited clusters. Pre-equilibration of clusters at elevated temperatures up to 900 K results in a significant decrease of the contact angle, although this trend is different for the silver, gold and titanium clusters. The shape of Ti787 is rather stable at cluster temperatures up to 900 K and at deposition energies up to 0.25 eV/atom, whereas the shape of thermally excited Ag887 and Au887 clusters changes significantly even at low deposition energies.
Acknowledgements
This work was supported in part by Deutsche Forschungsgemeinschaft (Project no. 415716638) and by the European Union’s Horizon 2020 research and innovation programme (the Radio-NP project within the H2020-MSCA-IF-2017 call, GA 794733 and the RADON project within the H2020-MSCA-RISE-2019 call, GA 872494). The possibility to perform calculations at the Goethe-HLR cluster of the Frankfurt Center for Scientific Computing and at the DeiC National HPC Center (University of Southern Denmark, Odense) is gratefully acknowledged.
References
- (1) P. Jensen, Growth of nanostructures by cluster deposition: Experiments and simple models, Rev. Mod. Phys. 71, 1695 (1999)
- (2) K.-H. Meiwes-Broer (ed.), Metal Clusters at Surfaces: Structure, Quantum Properties, Physical Chemistry (Springer Verlag, Berlin, Heidelberg, 2000)
- (3) J.-P. Connerade, A.V. Solov’yov (eds.), Latest Advances in Atomic Cluster Collisions: Structure and Dynamics from the Nuclear to the Biological Scale (Imperial College Press, 2008)
- (4) K. Bromann, C. Félix, H. Brune, W. Harbich, R. Monot, J. Buttet, K. Kern, Controlled deposition of size-selected silver nanoclusters, Science 274, 956 (1996)
- (5) S.J. Carroll, P. Weibel, B. von Issendorff, L. Kuipers, R.E. Palmer, The impact of size-selected Ag clusters on graphite: an STM study, J. Phys.: Condens. Matter 8, L617 (1996)
- (6) M. Hillenkamp, S.-S. Jester, M.M. Kappes, Probing surface properties with hyperthermal polyatomic ions: Scattering of C from highly oriented pyrolitic graphite, Au (111), and n-alkylthiol self-assembled monolayers, J. Chem. Phys. 116, 6764 (2002)
- (7) A. Kaplan, A. Bekkerman, B. Tsipinyuk, E. Kolodney, Transition from during- to post-collision multifragmentation in cluster surface impact, Phys. Rev. B 79, 233405 (2009)
- (8) H.-P. Cheng, U. Landman, Controlled deposition and classification of copper nanoclusters, J. Phys. Chem. 98, 3527 (1994)
- (9) Ph. Thaler, A. Volk, M. Ratschek, M. Koch, W.E. Ernst, Molecular dynamics simulation of the deposition process of cold Ag-clusters under different landing conditions, J. Chem. Phys. 140, 044326 (2014)
- (10) V. Bernstein, E. Kolodney, Postcollision multifragmentation in fullerene–surface impact: Microscopic insights via molecular dynamics simulations, J. Chem. Phys. 145, 044303 (2016)
- (11) S. Pratontep, P. Preece, C. Xirouchaki, R.E. Palmer, C.F. Sanz-Navarro, S.D. Kenny, R. Smith, Scaling relations for implantation of size-selected Au, Ag, and Si clusters into graphite, Phys. Rev. Lett. 90, 055503 (2003)
- (12) R. Smith, R.P. Webb, Energetic fullerene interactions with a graphite surface, Proc. R. Soc. Lond. A 441, 495 (1993)
- (13) S.R. Plant, L. Cao, F. Yin, Z.W. Wang, R.E. Palmer, Size-dependent propagation of Au nanoclusters through few-layer graphene, Nanoscale 6, 1258 (2014)
- (14) Z.W. Wang, R.E. Palmer, Determination of the ground-state atomic structures of size-selected Au nanoclusters by electron-beam-induced transformation, Phys. Rev. Lett. 108, 245502 (2012)
- (15) L. Bardotti, P. Jensen, A. Hoareau, M. Treilleux, B. Cabaud, Experimental observation of fast diffusion of large antimony clusters on graphite surfaces, Phys. Rev. Lett. 74, 4694 (1995)
- (16) R. Alayan, L. Arnaud, M. Broyer, E. Cottancin, J. Lermé, S. Marhaba, J.L. Vialle, M. Pellarin, Organization of size-selected platinum and indium clusters soft-landed on surfaces, Phys. Rev. B 76, 075424 (2007)
- (17) W.D. Luedtke, U. Landman, Slip diffusion and Lévy flights of an adsorbed gold nanocluster, Phys. Rev. Lett. 82, 3835 (1999)
- (18) C. Bréchignac, P. Cahuzac, F. Carlier, C. Colliex, J. Leroux, A. Masson, B. Yoon, U. Landman, Instability driven fragmentation of nanoscale fractal islands, Phys. Rev. Lett. 88, 196103 (2002)
- (19) A. Lando, N. Kébaïli, Ph. Cahuzac, C. Colliex, M. Couillard, A. Masson, M. Schmidt, C. Bréchignac, Chemically induced morphology change in cluster-based nanostructures, Eur. Phys. J. D 43, 151 (2007)
- (20) I.A. Solov’yov, A.V. Solov’yov, N. Kébaili, A. Masson, C. Bréchignac, Thermally induced morphological transition of silver fractals, Phys. Stat. Sol. B 251, 609 (2014)
- (21) R.E. Palmer, S. Pratontep, H.-G. Boyen, Nanostructured surfaces from size-selected clusters, Nature Mater. 2, 443 (2003)
- (22) S. Vajda, M.G. White, Catalysis applications of size-selected cluster deposition, ACS Catal. 5, 7152 (2015)
- (23) P. Milani, M. Sowwan (eds.), Cluster Beam Deposition of Functional Nanomaterials and Devices, Frontiers of Nanoscience, vol. 15 (Elsevier, 2020)
- (24) D.N. Poenaru, R.A. Gherghescu, A.V. Solov’yov, W. Greiner, Liquid-drop stability of a superdeformed prolate semi-spheroidal atomic cluster, EPL (Europhys Lett.) 79, 63001 (2007)
- (25) D.N. Poenaru, R.A. Gherghescu, I.H. Plonski, A.V. Solov’yov, W. Greiner, Macroscopic-microscopic theory of semi-spheroidal atomic cluster, Eur. Phys. J. D 47, 379 (2008)
- (26) V.V. Semenikhina, A.G. Lyalin, A.V. Solov’yov, W. Greiner, Droplet model of an atomic cluster at a solid surface, J. Exp. Theor. Phys. 106, 678 (2008)
- (27) M. Couillard, S. Pratontep, R.E. Palmer, Metastable ordered arrays of size-selected Ag clusters on graphite, Appl. Phys. Lett. 82, 2595 (2003)
- (28) I.A. Solov’yov, A.V. Yakubovich, P.V. Nikolaev, I. Volkovets, A.V. Solov’yov, MesoBioNano Explorer – a universal program for multiscale computer simulations of complex molecular structure and dynamics, J. Comput. Chem. 33, 2412 (2012)
- (29) G.B. Sushko, I.A. Solov’yov, A.V. Solov’yov, Modeling MesoBioNano systems with MBN Studio made easy, J. Mol. Graph. Model. 88, 247 (2019)
- (30) I.A. Solov’yov, G.B. Sushko, A.V. Solov’yov, MBN Explorer Users’ Guide, ver. 3.0 (MesoBioNano Science Publishing, Frankfurt am Main, 2017)
- (31) R.P. Gupta, Lattice relaxation at a metal surface, Phys. Rev. B 23, 6265 (1981)
- (32) F. Cleri, V. Rosato, Tight-binding potentials for transition metals and alloys, Phys. Rev. B 48, 22 (1993)
- (33) T. Ellaby, J. Aarons, A. Varambhia, L. Jones, P. Nellist, D. Ozkaya, M. Sarwar, D. Thompsett, C.-K. Skylaris, Ideal versus real: simulated annealing of experimentally derived and geometric platinum nanoparticles, J. Phys.: Condens. Matter 30, 155301 (2018)
- (34) D.W. Brenner, Empirical potential for hydrocarbons for use in simulating the chemical vapor deposition of diamond films, Phys. Rev. B 42, 9458 (1990)
- (35) J. Geng, I.A. Solov’yov, W. Zhou, A.V. Solov’yov, B.F.G. Johnson, Uncovering a solvent-controlled preferential growth of buckminsterfullerene (C60) nanowires, J. Phys. Chem. C 113, 6390 (2009)
- (36) J.H. Ryu, H.Y. Kim, D.H. Kim, D.H. Seo, H.M. Lee, Immobilization of Au nanoclusters supported on graphite: Molecular dynamics simulations, J. Phys. Chem. C 114, 2022 (2010)
- (37) M. Neek-Amal, R. Asgari, M.R. Rahimi Tabar, The formation of atomic nanoclusters on graphene sheets, Nanotechnology 20, 135602 (2009)
- (38) Ş. Erkoç, Empirical potential energy functions used in the simulations of materials properties, Annu. Rev. Comput. Phys. IX, 1 (2001)
- (39) A.V. Verkhovtsev, S. Schramm, A.V. Solov’yov, Molecular dynamics study of the stability of a carbon nanotube atop a catalytic nanoparticle, Eur. Phys. J. D 68, 246 (2014)
- (40) A.Y. Galashev, K.P. Katin, M.M. Maslov, Morse parameters for the interaction of metals with graphene and silicene, Phys. Lett. A 383, 252 (2019)
- (41) O.I. Obolensky, V.V. Semenikhina, A.V. Solov’yov, W. Greiner, Interplay of electrostatic and van der Waals forces in coronene dimer, Int. J. Quant. Chem. 107, 1335 (2007)
- (42) S. Grimme, Density functional theory with London dispersion corrections, WIREs Comput. Molec. Sci. 1, 211 (2011)
- (43) M. Amft, S. Lebègue, O. Eriksson, N.V. Skorodumova, Adsorption of Cu, Ag, and Au atoms on graphene including van der Waals interactions, J. Phys.: Condens. Matter 23, 395001 (2011)
- (44) J.-P. Jalkanen, M. Halonen, D. Fernández-Torre, K. Laasonen, L. Halonen, A computational study of the adsorption of small Ag and Au nanoclusters on graphite, J. Phys. Chem. A 111, 12317 (2007)
- (45) M.J. Frisch et al., Gaussian 09, Revision D.01, Gaussian, Inc., Wallingford CT, 2013.
- (46) L. Chen, J. Luo, Q. Wang, L. Xiong, H. Gong, First-principles study of cohesion strength and stability of titanium–carbon interfaces using vdW interaction, J. Phys.: Condens. Matter 32, 145001 (2020)
- (47) A.L. Hsu, R.J. Koch, M.T. Ong, W. Fang, M. Hofmann, K.K. Kim, T. Seyller, M.S. Dresselhaus, E.J. Reed, J. Kong, T. Palacios, Surface-induced hybridization between graphene and titanium, ACS Nano 8, 7704 (2014)
- (48) I. Katakuse, T. Ichihara, Y. Fujita, T. Matsuo, T. Sakurai, H. Matsuda, Mass distributions of copper, silver and gold clusters and electronic shell structure, Int. J. Mass Spectrom. Ion Processes 67, 229 (1985)
- (49) H. Häkkinen, Electronic shell structures in bare and protected metal nanoclusters, Adv. Phys. X, 1, 467 (2016)
- (50) P.-G. Reinhard, E. Suraud, Introduction to Cluster Dynamics (Wiley-VCH Verlag, Weinheim, 2004)
- (51) N. Giovambattista, P.G. Debenedetti, P.J. Rossky, Effect of surface polarity on water contact angle and interfacial hydration structure, J. Phys. Chem. B 111, 9581 (2007)
- (52) J. Škvára, J. Škvor, I. Nezbeda, Evaluation of the contact angle from molecular simulations, Molec. Simul. 44, 190 (2018)