GoGNN: Graph of Graphs Neural Network for Predicting
Structured Entity Interactions
Abstract
Entity interaction prediction is essential in many important applications such as chemistry, biology, material science, and medical science. The problem becomes quite challenging when each entity is represented by a complex structure, namely structured entity, because two types of graphs are involved: local graphs for structured entities and a global graph to capture the interactions between structured entities. We observe that existing works on structured entity interaction prediction cannot properly exploit the unique graph of graphs model. In this paper, we propose a Graph of Graphs Neural Network, namely GoGNN, which extracts the features in both structured entity graphs and the entity interaction graph in a hierarchical way. We also propose the dual-attention mechanism that enables the model to preserve the neighbor importance in both levels of graphs. Extensive experiments on real-world datasets show that GoGNN outperforms the state-of-the-art methods on two representative structured entity interaction prediction tasks: chemical-chemical interaction prediction and drug-drug interaction prediction. Our code is available at Github222https://github.com/Hanchen-Wang/GoGNN.
1 Introduction
Interactions between the structured entities like chemicals are the basis of many applications such as chemistry, biology, material science, medical science, and environmental science. For example, the knowledge of chemical interactions is a helpful guide for the toxicity prediction, new material design and pollutant removal Xu et al. (2019). In medical science, understanding the interaction between drugs is vital for drug discovery and side effect prediction which can save millions of lives every year Menche et al. (2015).
One immediate way to investigate the interactions between two structured entities is to conduct experiments for them in the laboratory or clinics. However, due to the enormous number of structured entities, it is infeasible in terms of both time and resource to examine all possible interactions. Thanks to the advances in the computational approaches for the structured entity interaction prediction, a variety of techniques have been proposed to predict the interactions among structured entities effectively and efficiently by utilizing the deep neural network or graph neural network (GNN) techniques such as DeepCCI Kwon and Yoon (2017) for chemical-chemical interaction prediction and DeepDDI Ryu et al. (2018) for drug-drug interaction prediction.
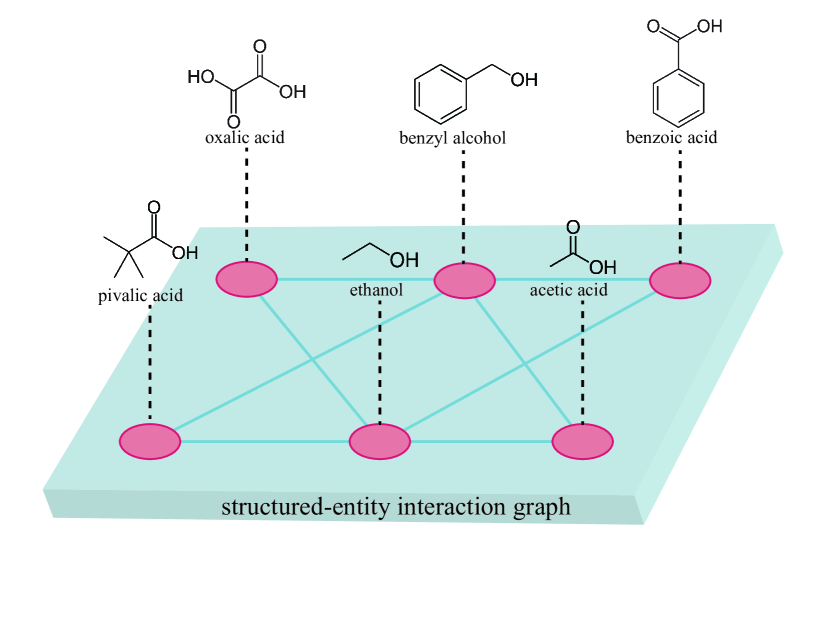
We observe that the interactions among structured entities can be naturally modeled by the graph-of-graphs (a.k.a network-of-networks) where each structured entity is a local graph, and the interactions of the entities form a global graph. In Figure 1, we take the chemical-chemical interactions as an example. Each chemical molecule is a structured entity and can be represented by a local graph (i.e., molecule graph) where nodes represent atoms and the bonds among the atoms are the edges. On the other hand, the interactions (edges) among the structured entities (nodes) form a global graph. However, the existing studies for structured entity interaction prediction do not make full use of the graph-of-graphs model and only consider partial information. For instance, MR-GNN Xu et al. (2019) only considers the local structure information of entities and their pairwise similarity; Decagon Zitnik et al. (2018) focuses on the interaction graph and only treats the structured entity as a simple node. Other works such as DeepCCI and DeepDDI even do not consider the graph structure information.
These limitations motivate us to develop a new approach to fully exploit the graph-of-graphs (GoG) model to predict the structured entity interactions. In particular, we propose a novel model called Graph of Graphs Neural Network(GoGNN). Our model builds a graph neural network with attention-based pooling over local graphs and attention-based neighbor aggregation on the global graph such that GoGNN is able to capture broader information that enhances the performance on the prediction. Furthermore, the GNNs on both levels of graphs play synergistic effects on improving the representativeness of GoGNN. The contributions of our model can be summarized as follows:
-
•
To the best of our knowledge, this is the first work to systematically apply the graph neural network on graph-of-graphs model, namely Graph of Graphs Neural Network (GoGNN), to the problem of structured entity interaction prediction.
-
•
The proposed GoGNN mines the features from both local entity graphs and global interaction graph hierarchically and synergistically. We design dual attention architecture to capture the significance of the substructures in the local graphs while preserving the importance of the interactions within the global graph.
-
•
The extensive experiments conducted on the real-life benchmark datasets show that GoGNN outperforms the state-of-the-art structured entity interaction prediction methods in two representative applications: chemical-chemical interaction prediction and drug-drug interaction prediction.
2 Related Work
In this section, we introduce the closely related works.
2.1 Structured Entities Interaction Prediction
In many real-life applications such as chemistry, biology, material science, and medical science, we need to understand the interactions between the structured entities. In recent years, a variety of techniques have been proposed for structured entity interaction prediction in some specific applications. In this paper, we focus on two representative applications: chemical-chemical interaction prediction and drug-drug interaction prediction.
Many computational methods have been proposed for these two applications. DeepCCI and DeepDDI Kwon and Yoon (2017); Ryu et al. (2018) utilize the conventional convolutional neural network and PCA on the chemical data. Some models are graph neural network-based. For example, Decagon Zitnik et al. (2018) performs the GCN on drug-protein interaction graph; MR-GNN Xu et al. (2019) proposes a model with dual graph-state LSTMs that extracts local features of molecule graphs, and MLRDA Chu et al. (2019) utilizes graph autoencoder with a novel loss function to predict the drug-drug interactions.
2.2 Graph Neural Networks
Node-level applications. Most GNNs are designed for node-level applications such as node classification and link prediction Kipf and Welling (2017); Veličković et al. (2017); Zhang and Chen (2018); Hamilton et al. (2017); Liu et al. (2019); Lian et al. (2020b, a). They rely on the node embedding techniques like skip-gram, autoencoder and neighbor aggregation methods like GCN, GraphSAGE, etc. These methods focus on the node relations within the graph and use the low-dimension representations to preserve the structural and attribute information.
Graph-level applications. Recently, some research works on GNNs are proposed for graph-level applications such as graph classificationZhang et al. (2018); Lee et al. (2018) and graph matchingLi et al. (2019b). These works learn the graph representations for each graph individually or pair-wisely without considering the interactions between the graphs.
2.3 Graph of Graphs
In most real-world systems, an individual network is one component within a much larger complex multi-level network. Applying the graph theory paradigm to these networks has led to the development of the concept of “Graph of Graphs” (also known as “Network of Networks”). D’Agostino and Scala (2014) introduces the theoretical research development Dong et al. (2013), applications Ni et al. (2014) and phenomenological model Rome et al. (2014) on the network of networks. These works enable us to understand and model the inter-dependent critical infrastructures. SEALLi et al. (2019a) proposed graph neural network in a hierarchical graph perspective for graph classification task. With significant differences between GoGNN and SEAL in tasks, loss functions and optimizers, GoGNN is the first work to develop graph neural network technique on graph of graphs for structured entity interaction prediction problem.
3 Preliminaries
3.1 Problem Definition
For ease of understanding of our techniques, in this paper, we focus on two representative applications of structured entities interaction prediction: chemical-chemical interaction (CCI) prediction and drug-drug interaction (DDI) prediction. In the CCI graph, there is only one type of interaction, and our goal is to estimate the reaction probability score of given chemical pair . As to DDI graph which has multiple types of interactions, we aim to estimate the occurrence probabilities of side effect type with the given triplet .
3.2 Input Graph of Graphs
Overall, the input interaction graph is regarded as graph-of-graphs as follows.
Molecule Graph. In both CCI and DDI prediction tasks, the local graphs are molecule graphs, each of which can be modeled as a heterogeneous graph with multiple types of nodes and edges. In particular, the molecule graph consists of atoms as nodes, and edges where denotes the bond between atoms and . Each atom (i.e., node) is encoded as a vector . For each bond (i.e., edge), we assign a weight to the corresponding edge depending on the type of the bond. For example, the bond between the carbon atoms in the ethylene molecule is a double bond. Therefore, the weight of the edge between the carbon atoms is set to .
Interaction Graph. The global interaction graph is formed by the molecule graphs and the interactions between them: , where denotes the node set of which consists of molecule graphs , and denotes the interaction edges between the molecule graphs. Note that, in CCI graph, there is only one type of interaction between two nodes. In DDI graph, there are multiple types of side effects caused by the combination of two drugs. An attribute vector is assigned for each edge based on the side effect type .
4 Graph of Graphs Neural Network
In this section, we introduce our Graph of Graphs Neural Network model.
4.1 Framework of GoGNN
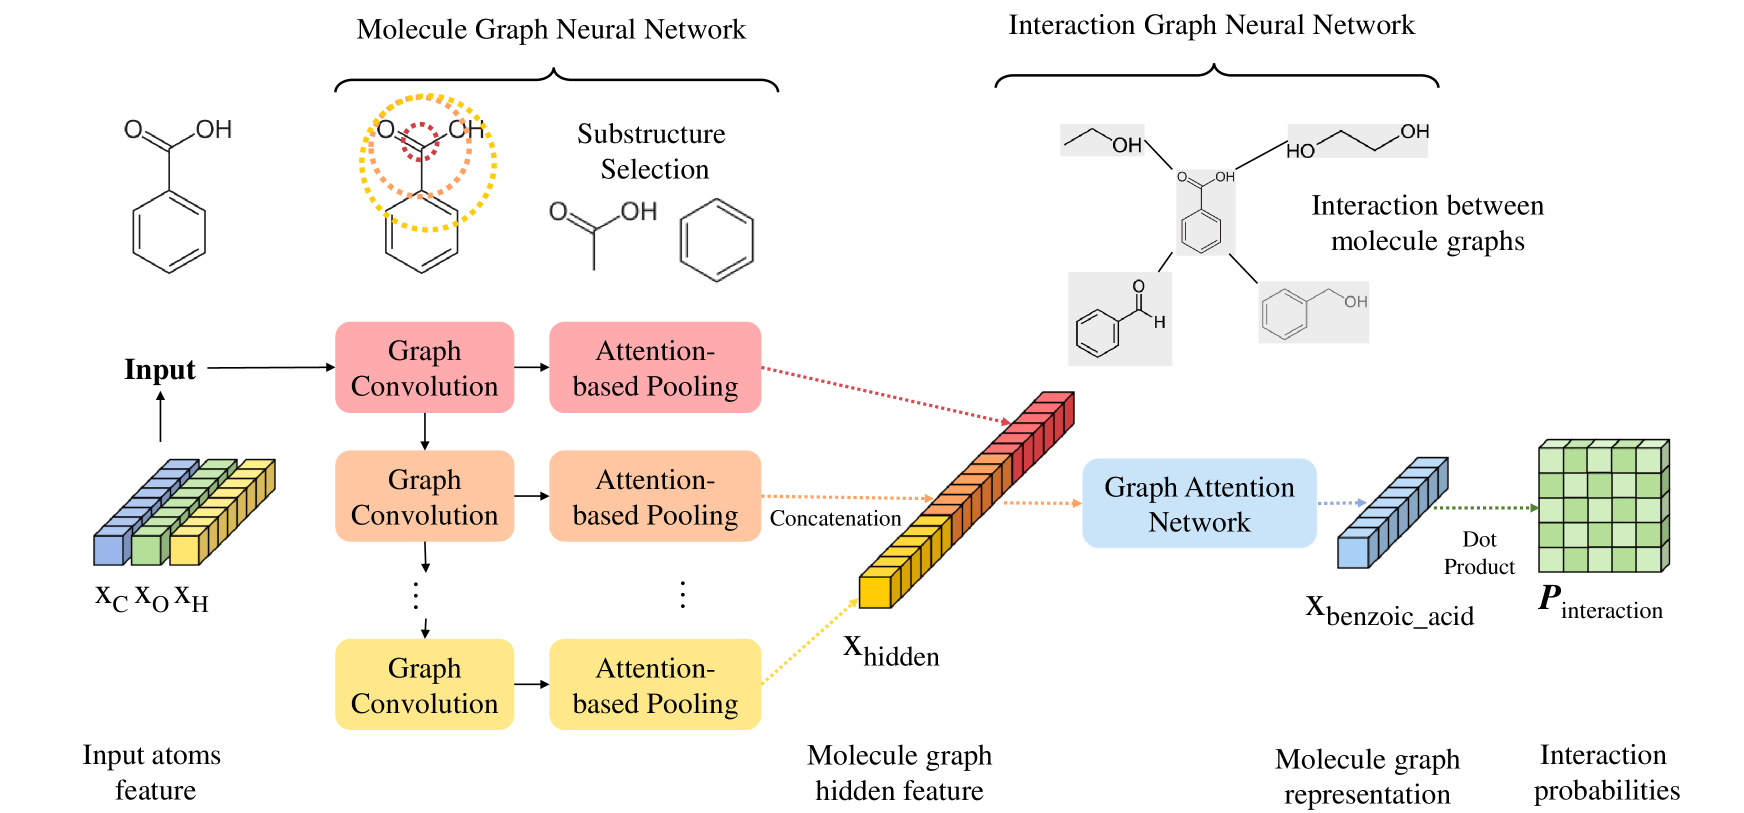
The framework of GoGNN is illustrated in Figure 2. GoGNN contains molecule graph neural network which takes the atom features as input and interaction graph neural network which produces the graph representation for the prediction task. The two parts of GoGNN play a synergistic effect on improving the performance. The hidden features learned by molecule-level GNN provide the interaction-level GNN a representative initial input. The feature aggregation on the interaction-level GNN promotes the ability of molecule-level GNN to find key substructure through back-propagation.
4.2 Molecule Graph Neural Network
In organic chemistry, functional groups (i.e., substructures) in molecules are responsible for the characteristic chemical reactions between these molecules. For example, the reaction between benzoic acid and ethanol in Figure 1 is the esterification between two functional groups -COOH in benzoic acid and -OH in ethanol.
The model could achieve better performance for prediction if the model can identify the functional groups in the molecules and represent the molecule with such functional groups. Therefore, we designed our molecule graph neural network with the combination of multi-resolution architecture Xu et al. (2019) which preserves the information of multi-hop substructures and attention-based graph pooling Lee et al. (2019); Gao and Ji (2019a) which selects the substructures to represent the molecules.
As proved in previous work Xu et al. (2018), one single general graph convolution layer can only aggregate the feature of the node and its immediate neighbors. To obtain features of the multi-scale substructure of the molecule graph, we apply multiple layers of graph convolution operations to the input graphs. The graph convolution operation at layer is summarized as follows
| (1) | ||||
where is the hidden feature matrix for molecule graph at layer, is the adjacency matrix with self-connection for molecule graph , is the diagonal degree matrix of and denotes the activation function.
Different from MR-GNN Xu et al. (2019) which uses dual graph-state LSTMs on the input of subgraph representations, GoGNN applies graph pooling for learning the graph representation that preserves the substructure information, in order to reduce the time and space complexity significantly. As shown in Figure 2, the self-attention graph pooling layer takes the output of each graph convolution layer as input to select the most representative substructures (functional groups) by learning the self-attention score for molecule graph with atoms at layer
| (2) |
where is the attention weight matrix for the pooling layer to obtain the self-attention score. In order to select the most representative substructure, the graph pooling layer calculates the attention score for each atom in the graph and finds the top- atoms with the highest attention scores. We set a hyperparameter pooling ratio to determine the number of nodes that are selected to represent the molecule graph
| (3) | ||||
where is the function that returns the indices of atoms with top attention scores as in Gao and Ji (2019b); is the mask vector determined by the attention score; denotes the column-wise product for masking; is the feature matrix of selected atoms in a molecule graph. Afterward, the readout layer, which contains mean and sum pooling, is applied on the embedding of selected atoms to produce the molecule graph hidden feature. After multiple graph convolutional and self-attention graph pooling layers, we got several graph hidden features. Once obtained, we concatenate the outputs of the graph pooling layers as the hidden feature vector for the molecule graph. Because the hierarchical graph pooling architecture is applied, the graph representation can preserve the multi-hop substructure information effectively. Hence, GoGNN can identify the function groups which play the key roles in molecule interactions and use these functional groups to represent the molecule graph.
4.3 Interaction Graph Neural Network
Most of existing CCI and DDI prediction models train the model with the input of pair of molecule graphs, but ignore the molecule interaction graph. However, the information of interaction graph is crucial for the interaction prediction because it enables the model to capture high-order interaction relationship and enhance the model’s ability to capture the representative molecular substructures synergistically.
We have the following observations that motivate us to perform graph neural network on the interaction graph: Firstly, the type of interaction is dependent on the type of involved molecules. As mentioned in Section 4.2, esterification is the reaction between -OH in alcohols and -COOH in carboxyl acids. The neighbor aggregation of GNN can gather the neighbor information that helps to summarize the types of chemicals that interact with the selected one. Secondly, it is necessary to assign importance score to the neighbors for molecules in the interaction graph, since the chemical interactions have different significance and frequency. For example, vitamin C has two main properties: reducibility and acidity. Therefore, vitamin C cannot be prescribed with oxidizing drugs like vitamin K1 and alkaline drugs like omeprazole. In an uncommon case, vitamin C reduces the therapeutic effect of inosine because of their complex physical and chemical reactions. Therefore, we apply the graph attention network in order to preserve the frequencies of the chemical reactions and reduce the influence of biased observation of the interaction graph. As for the DDI graph with edge attributes, an edge-aggregation graph neural network is applied.
Graph Attention Network. The attention-based graph neural network Veličković et al. (2017) is applied on the interaction graph without edge attributes. With the learned molecule hidden feature vector and interaction graph as input, molecule graph representations are calculated by the neighbor aggregation on the interaction graph as follows
| (4) |
where is the number of attention heads, is a nonlinearity function, is the weight matrix at attention head in layer and is the set of neighbor molecule graphs of in the interaction graph . Notation is the attention coefficient between and which is calculated by the following equation:
| (5) |
where is a learnable attention weight vector and is the concatenation operation.
Edge Aggregation Network. In DDI graph, each edge has an attribute vector which is determined by the side effect type of the drug combination . To capture the edge attributes Schlichtkrull et al. (2018), we propose an edge aggregation network that aggregates the neighbor information together with edge attribute:
| (6) |
where is the MLP layer with linear transformation matrix which transforms the edge attribute vector into a real number . In this way, GoGNN aggregates node’s neighbor information together with edge attributes. Different from Decagon Zitnik et al. (2018) which sets side-effect-specific parameters, GoGNN shares the parameters for all types of side effects in order to improve the robustness and generalization of the model.
4.4 GoGNN Model Training
We optimize the parameters with the task-specific loss functions.
Chemical Interaction Prediction. Since there is no edge attribute in the graph, we regard the chemical interaction prediction as a link prediction problem. The dot product of two graph representations is used as the link probability of two graphs:
| (7) |
where is the activation function such as sigmoid function that ensures . To encourage the model to assign higher probabilities to the observed edges than the random non-edges, we follow the previous study and estimate the model through negative sampling. For each positive edge pair (, ), a random negative edge (, ) is sampled by choosing a molecule graph randomly. We optimize the model using the following cross-entropy loss function
| (8) |
Drug Interaction Prediction. The drug-drug interaction prediction task is regarded as a multirelational link prediction problem. Inspired by the loss design in Zitnik et al. (2018), we train the parameters with the following cross-entropy loss function
| (9) |
| (10) |
| (11) |
where is the side-effect-specific weight for linear transformation of w.r.t. the side effect type . Given observed triplet , the negative sample is chosen by replacing with randomly selected graph according to sampling distribution Mikolov et al. (2013).
5 Experiment
In this section, we introduce the extensive experiment results that demonstrate the effectiveness and robustness of GoGNN.
5.1 Dataset
To test the performance of our model on chemical-chemical interaction and drug-drug interaction prediction tasks, following datasets are chosen for the experiments:
CCI. The CCI dataset333http://stitch.embl.de/download/chemical_chemical.links.detailed.v5.0.tsv.gz assigns a score from 0 to 999 to describe the interaction probability where a higher score indicates higher interaction probability. According to threshold score, we get two datasets with chemical interaction probability score over 900 and 950: CCI900 and CCI950. CCI900 has 14343 chemicals and 110078 chemical interaction edges, and CCI950 has 7606 chemicals and 34412 chemical interaction edges.
DDI. For the drug-drug interaction prediction problem, DDI dataset444https://www.pnas.org/content/suppl/2018/04/14/1803294115.DCSupplemental and the side effect dataset SE555http://snap.stanford.edu/decagon Zitnik et al. (2018) are used. The DDI dataset is proposed by DeepDDI Ryu et al. (2018) which contains 86 types of side effects, 1704 drugs and 191400 drug interaction edges. SE dataset is the integration of SIDER (Side Effect Resource), OFFSIDES and TWOSIDES database. To familiarize the comparison, we use the preprocessed data used by Decagon Zitnik et al. (2018). Therefore, the SE dataset contains 645 drugs, 964 types of side effects and 4651131 drug-drug interaction edges. A vector representation is assigned to each side effect type produced by pre-trained BERT model Devlin et al. (2018).
5.2 Baselines
The proposed GoGNN is compared with the following state-of-the-art models:
DeepCCI Kwon and Yoon (2017) is the CNN based model for predicting the interactions between the chemicals.
DeepDDI Ryu et al. (2018) is the model designs a feature called structural similarity profile(SSP) combined with traditional MLP for DDI prediction.
Decagon Zitnik et al. (2018) is a GCN model on the drug and protein interaction graphs to predict the polypharmacy side effects caused by drug combinations.
MR-GNN Xu et al. (2019) is an end-to-end graph neural network with multi-resolution architecture that produces interaction between pairs of chemical graphs.
MLRDA Chu et al. (2019) is the multitask, semi-supervised model for DDI prediction.
SEAL Li et al. (2019a) is the neural network on hierarchical graphs for graph classification.
We used the public code of the baselines and keep the settings of models the same as mentioned in the original papers. We reimplemented SEAL for CCI and DDI prediction.
Ablation Study
To investigate how the graph of graphs architecture and dual-attention mechanism improve the performance of the proposed model, we conduct the ablation study on the following variants of GoGNN:
GoGNN-M is the variant which only learns the representations for the molecule-level graphs without the graph convolution on the interaction graph. An MLP layer is applied with the input of molecule-level graph representations for the graph interaction prediction task.
GoGNN-I only conducts graph convolution operation on the chemical interaction graphs. The initial molecule representations are the sum pooling of the atom representations within the molecule.
GoGNN-noPool replaces the self-attention pooling on the molecule graph by the concatenation of conventional mean pooling and sum pooling.
GoGNN-noAttn replaces the attention-based neural network on the interaction graph by a conventional GCN.
5.3 CCI Prediction Results
Settings. Following the previous study, we divide the CCI datasets into training and testing set with ratio 9:1, and randomly choose 10% data for validation. The dimensions of molecule graph hidden feature, and the output molecule graph representation are set to 384, 256, respectively. We set the learning rate to 0.01 and the pooling ratio to 0.5. To evaluate the performance, we choose area under the ROC curve(AUC) and average precision score(AP) as metrics.
| CCI900 | CCI950 | |||
| AUC | AP | AUC | AP | |
| DeepCCI | 0.925 | 0.918 | 0.957 | 0.957 |
| DeepDDI | 0.891 | 0.886 | 0.916 | 0.915 |
| MR-GNN | 0.927 | 0.921 | 0.934 | 0.924 |
| MLRDA | 0.922 | 0.907 | 0.959 | 0.948 |
| SEAL | 0.894 | 0.886 | 0.941 | 0.937 |
| GoGNN | 0.937 | 0.932 | 0.963 | 0.962 |
| GoGNN-M | 0.914 | 0.909 | 0.938 | 0.931 |
| GoGNN-I | 0.921 | 0.898 | 0.929 | 0.912 |
| GoGNN-noPool | 0.931 | 0.930 | 0.958 | 0.954 |
| GoGNN-noAttn | 0.909 | 0.905 | 0.956 | 0.948 |
Results. As shown in Table 1, GoGNN outperforms all the other state-of-the-art baseline methods on the CCI prediction task. The improvement indicates that, compared with the methods that only train the parameters with pair-wise or individual chemical inputs, GoGNN can preserve more useful information on different scales by the feature extraction and aggregation through the graph of graphs. The dual-attention mechanism also helps the model to learn higher quality graph representations by identifying and preserving the importance of molecular substructures and chemical interactions.
5.4 DDI Prediction Results
Settings. To familiarize the comparison, we divide the DDI dataset for training, testing, validation with ratio 6:2:2, and divide the SE dataset with ratio 8:1:1. The dimensions of molecule graph hidden feature, and the output molecule graph representation are set to 384, 256, respectively. We set the learning rate to 0.001, pooling ratio . We choose AUC and average precision(AP) for evaluation.
| DDI | SE | |||
| AUC | AP | AUC | AP | |
| DeepCCI | 0.862 | 0.856 | 0.819 | 0.806 |
| DeepDDI | 0.915 | 0.912 | 0.827 | 0.809 |
| MR-GNN | 0.932 | 0.922 | ||
| MLRDA | 0.931 | 0.926 | ||
| Decagon | - | - | 0.872 | 0.832 |
| SEAL | 0.925 | 0.921 | N/A | N/A |
| GoGNN | 0.943 | 0.933 | 0.930 | 0.927 |
| GoGNN-M | 0.905 | 0.902 | 0.862 | 0.817 |
| GoGNN-I | 0.922 | 0.917 | 0.860 | 0.834 |
| GoGNN-noPool | 0.900 | 0.891 | 0.912 | 0.909 |
| GoGNN-noAttn | 0.925 | 0.921 | 0.897 | 0.883 |
-
*
indicates that the result is the output of the baselines after two weeks’ training.
-
-
DDI dataset has no protein data which is required by Decagon
Results. The experiment results for DDI prediction are listed in Table 2. The results show that compared with the baseline methods, GoGNN improves the performance with a significantly large margin. GoGNN improves the AUC and AP by 1.18% and 1.19% respectively on DDI dataset, and 6.65% and 11.42% respectively on the SE dataset. The improvement is attributed to the abundant information brought by the graph of graphs architecture and edge-filtered aggregation.
5.5 Ablation Experiments
The ablation experiment results on both tasks are shown in Table 1 and Table 2. The results prove that the graph of graphs architecture, attention-based pooling, attention-based and edge-filtered aggregation are all effective for the side effect prediction task. Among all the variants, GoGNN-M and GoGNN-I have the most significant performance gaps between GoGNN, which indicates that the view of graph of graphs contributes the most to helping the model to capture more structural information that improves the prediction accuracy.
5.6 Parameter Sensitivity Analysis
In this experiment, we test the impact of the hyper-parameters of GoGNN.
Settings. We conduct the parameter sensitivity experiment on the CCI950 dataset by changing the tested hyper-parameter while keeping other settings the same as mentioned in Section 5.3. We test the following hyper-parameters: the dimensions of the output representation and hidden feature, learning rate and pooling ratio.
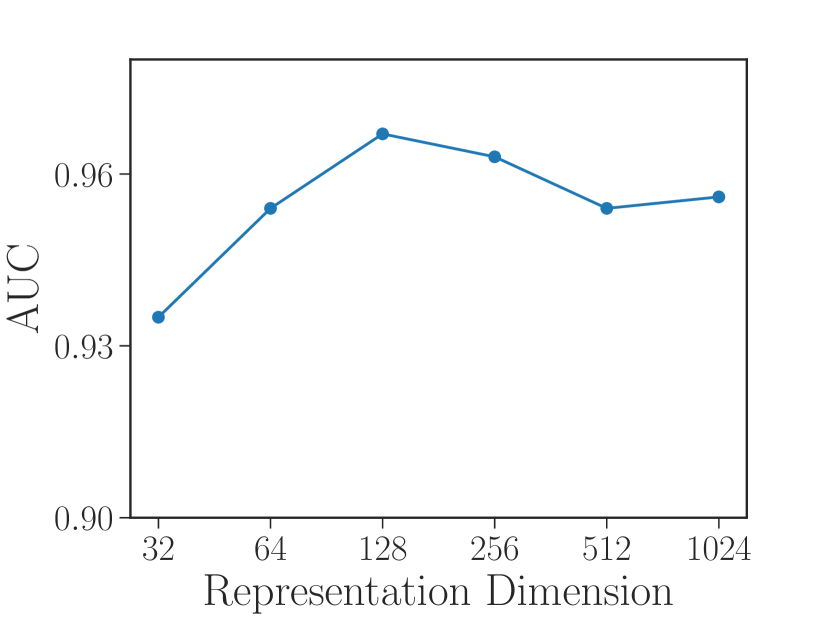
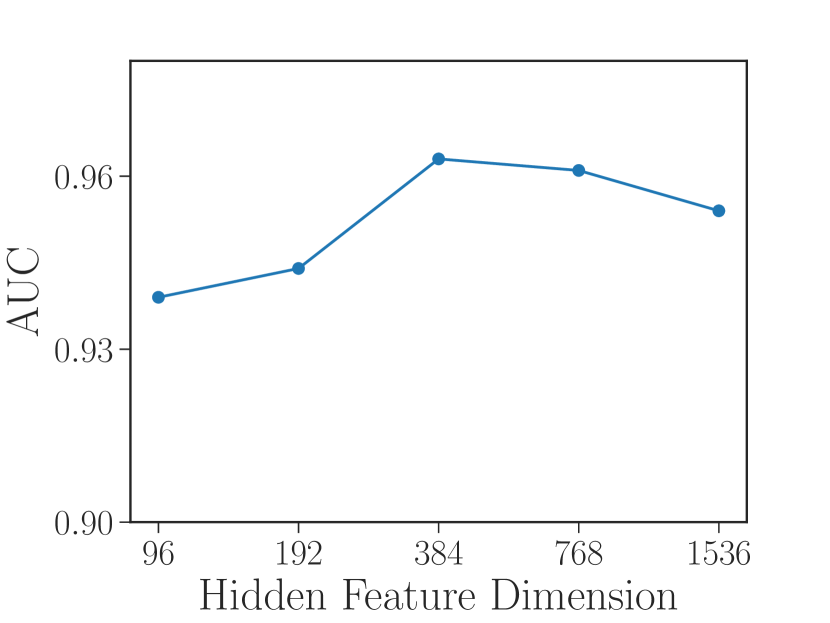
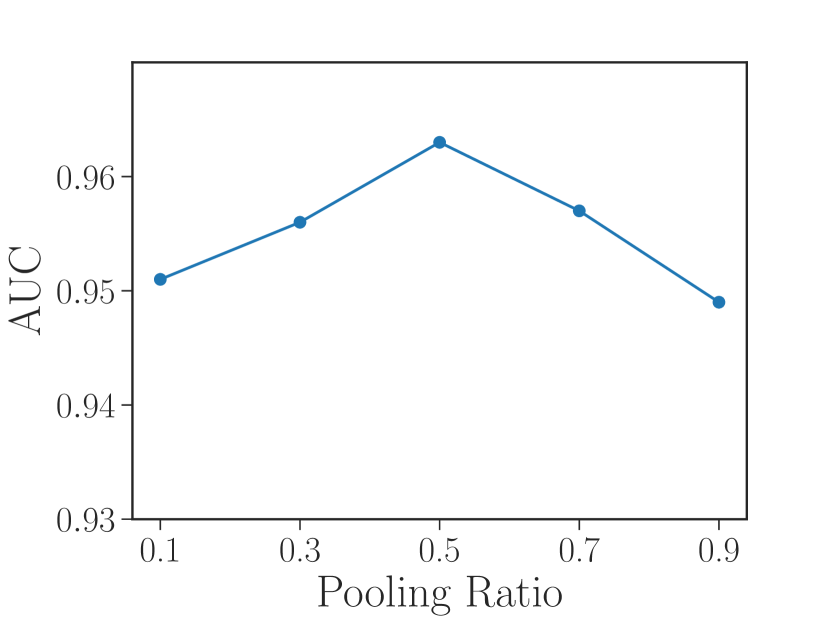
Results. As shown in Figure 3, overall, the impact of hyperparameter variation is insignificant. Figure 3(a) shows that GoGNN reaches the best performance with representation dimension 128. Figure 3(b) indicates that the salient point for the hidden feature size is 384. As for the learning rate and pooling ratio, the best point appears at and , respectively.
6 Conclusion
In this paper, we focus on structured entity interaction prediction. This prediction demands the model to capture the information of the structure of entities and the interactions between entities. However, the previous works represent the entities with insufficient information. To address this limitation, we propose a novel model GoGNN which leverages the dual-attention mechanism in the view of graph of graphs to capture the information from both entity graphs and entity interaction graph hierarchically. The experiments on real-life datasets demonstrate that our model could improve the performance on the chemical-chemical interaction prediction and drug-drug interaction prediction tasks. GoGNN can be naturally extended to the applications on other graph of graphs such as financial networks, electrical networks, etc. We leave the extension for future work.
References
- Chu et al. [2019] Xu Chu, Yang Lin, Yasha Wang, Leye Wang, Jiangtao Wang, and Jingyue Gao. Mlrda: a multi-task semi-supervised learning framework for drug-drug interaction prediction. In IJCAI, 2019.
- D’Agostino and Scala [2014] Gregorio D’Agostino and Antonio Scala. Networks of networks: the last frontier of complexity, volume 340. Springer, 2014.
- Devlin et al. [2018] Jacob Devlin, Ming-Wei Chang, Kenton Lee, and Kristina Toutanova. Bert: Pre-training of deep bidirectional transformers for language understanding. arXiv:1810.04805, 2018.
- Dong et al. [2013] Gaogao Dong, Jianxi Gao, Ruijin Du, Lixin Tian, H Eugene Stanley, and Shlomo Havlin. Robustness of network of networks under targeted attack. Physical Review E, 87(5):052804, 2013.
- Gao and Ji [2019a] Hongyang Gao and Shuiwang Ji. Graph u-nets. arXiv preprint arXiv:1905.05178, 2019.
- Gao and Ji [2019b] Hongyang Gao and Shuiwang Ji. Graph u-nets. In ICML 2019. PMLR, 2019.
- Hamilton et al. [2017] Will Hamilton, Zhitao Ying, and Jure Leskovec. Inductive representation learning on large graphs. In NIPS, pages 1024–1034, 2017.
- Kipf and Welling [2017] Thomas N. Kipf and Max Welling. Semi-supervised classification with graph convolutional networks. In ICLR 2017, 2017.
- Kwon and Yoon [2017] Sunyoung Kwon and Sungroh Yoon. Deepcci: End-to-end deep learning for chemical-chemical interaction prediction. In ACM BCB, 2017.
- Landrum [2013] Greg Landrum. Rdkit: A software suite for cheminformatics, computational chemistry, and predictive modeling, 2013.
- Lee et al. [2018] John Boaz Lee, Ryan Rossi, and Xiangnan Kong. Graph classification using structural attention. In SIGKDD, pages 1666–1674. ACM, 2018.
- Lee et al. [2019] Junhyun Lee, Inyeop Lee, and Jaewoo Kang. Self-attention graph pooling. arXiv preprint arXiv:1904.08082, 2019.
- Li et al. [2019a] Jia Li, Yu Rong, Hong Cheng, Helen Meng, Wen-bing Huang, and Junzhou Huang. Semi-supervised graph classification: A hierarchical graph perspective. In WWW 2019, 2019.
- Li et al. [2019b] Yujia Li, Chenjie Gu, Thomas Dullien, Oriol Vinyals, and Pushmeet Kohli. Graph matching networks for learning the similarity of graph structured objects. arXiv preprint arXiv:1904.12787, 2019.
- Lian et al. [2020a] Defu Lian, Qi Liu, and Enhong Chen. Personalized ranking with importance sampling. In WWW 2020, page 1093–1103, 2020.
- Lian et al. [2020b] Defu Lian, Haoyu Wang, Zheng Liu, Jianxun Lian, Enhong Chen, and Xing Xie. Lightrec: A memory and search-efficient recommender system. In WWW 2020, page 695–705, 2020.
- Liu et al. [2019] Ziqi Liu, Chaochao Chen, Longfei Li, Jun Zhou, Xiaolong Li, Le Song, and Yuan Qi. Geniepath: Graph neural networks with adaptive receptive paths. In AAAI, volume 33, pages 4424–4431, 2019.
- Menche et al. [2015] Jörg Menche, Amitabh Sharma, Maksim Kitsak, Susan Dina Ghiassian, Marc Vidal, Joseph Loscalzo, and Albert-László Barabási. Uncovering disease-disease relationships through the incomplete interactome. Science, 347(6224):1257601, 2015.
- Mikolov et al. [2013] Tomas Mikolov, Ilya Sutskever, Kai Chen, Greg S Corrado, and Jeff Dean. Distributed representations of words and phrases and their compositionality. In NIPS, pages 3111–3119, 2013.
- Ni et al. [2014] Jingchao Ni, Hanghang Tong, Wei Fan, and Xiang Zhang. Inside the atoms: ranking on a network of networks. In SIGKDD, pages 1356–1365, 2014.
- Rome et al. [2014] Erich Rome, Peter Langeslag, and Andrij Usov. Federated modelling and simulation for critical infrastructure protection. In Networks of networks: the last frontier of complexity, pages 225–253. Springer, 2014.
- Ryu et al. [2018] Jae Yong Ryu, Hyun Uk Kim, and Sang Yup Lee. Deep learning improves prediction of drug–drug and drug–food interactions. PNAS, 115(18):E4304–E4311, 2018.
- Schlichtkrull et al. [2018] Michael Schlichtkrull, Thomas N Kipf, Peter Bloem, Rianne Van Den Berg, Ivan Titov, and Max Welling. Modeling relational data with graph convolutional networks. In ESWC, 2018.
- Veličković et al. [2017] Petar Veličković, Guillem Cucurull, Arantxa Casanova, Adriana Romero, Pietro Lio, and Yoshua Bengio. Graph attention networks. arXiv preprint arXiv:1710.10903, 2017.
- Weininger et al. [1989] David Weininger, Arthur Weininger, and Joseph L Weininger. Smiles. 2. algorithm for generation of unique smiles notation. J CHEM INF COMP SCI, 29(2):97–101, 1989.
- Xu et al. [2018] Keyulu Xu, Weihua Hu, Jure Leskovec, and Stefanie Jegelka. How powerful are graph neural networks? arXiv preprint arXiv:1810.00826, 2018.
- Xu et al. [2019] Nuo Xu, Pinghui Wang, Long Chen, Jing Tao, and Junzhou Zhao. Mr-gnn: Multi-resolution and dual graph neural network for predicting structured entity interactions. arXiv:1905.09558, 2019.
- Zhang and Chen [2018] Muhan Zhang and Yixin Chen. Link prediction based on graph neural networks. In NIPS, pages 5165–5175, 2018.
- Zhang et al. [2018] Muhan Zhang, Zhicheng Cui, Marion Neumann, and Yixin Chen. An end-to-end deep learning architecture for graph classification. In AAAI, 2018.
- Zitnik et al. [2018] Marinka Zitnik, Monica Agrawal, and Jure Leskovec. Modeling polypharmacy side effects with graph convolutional networks. Bioinformatics, 34(13):i457–i466, 2018.