The Semi-forbidden CIII]1909Å Emission in the Rest-Ultraviolet Spectra of Green Pea Galaxies
Abstract
We used the Space Telescope Imaging Spectrograph (STIS) on the Hubble Space Telescope (HST) to observe the semi-forbidden CIII] 1907,1909Å doublet emission in Green Pea galaxies at . We detect CIII] emission in 7/10 galaxies with CIII] equivalent widths that range from 2-10Å , confirming that CIII] emission is almost ubiquitous in low-mass, low-metallicity (12+log(O/H) 8.4) galaxies which are characterized by strong optical [OIII] 5007Å emission. The composite UV spectrum shows evidence for the HeII 1640Å emission line and interstellar absorption features (eg; CIV 1548,1550Å , AlIII 1854,1862Å ). We do not detect the OIII] 1661,1666Å emission with 3- significance. The observed CIII] emission line strengths are consistent with the predictions from photoionization models which incorporate the effects of binary stellar evolution with young stellar ages Myrs, and high ionization parameters (log -2). The hard ionizing radiation from young massive stars, and high nebular temperatures at low-metallicities can account for the observed high equivalent widths of CIII] 1909Å and [OIII] 5007Å emission lines. Some of the star-forming galaxies at high redshift, and local blue compact dwarf galaxies show offsets from the EW(CIII]) versus EW([OIII]) model grids, indicating an additional contribution to the continuum emission from composite stellar populations, or different C/O abundances, nebular temperatures and electron densities than assumed in the photoionization models. The Green Pea galaxies do not show a significant correlation between the Ly and CIII] equivalent widths, and the observed scatter is likely due to the variations in the optical depth of Ly to the neutral gas. Green Pea galaxies are likely to be density-bounded, and we examined the dependence of CIII] emission on the Lyman continuum optical depth. The potential LyC leaker galaxies in our sample have high CIII] equivalent widths that can only be reproduced by starburst ages as young as 3 Myrs and harder ionizing spectra than the non-leakers. Among the galaxies with similar metallicities and ionization parameters, the CIII] equivalent width appears to be stronger for those with higher optical depth to LyC, as expected from the photoionization models. There are various factors that affect the CIII] emission line strengths and further investigation of a larger sample of CIII]-emitters is necessary to calibrate the dependence of CIII] emission on the escape of LyC radiation, and to enable application of the CIII] diagnostics to galaxies in the reionization epoch.
1 Introduction
The semi-forbidden [CIII]1907Å + CIII]1909Å doublet (hereafter, CIII]1909 or CIII]) is one of the strongest nebular emission line features observed in the rest-frame ultraviolet (rest-UV) spectrum of low-metallicity, 12+log(O/H) 8.4 () star-forming galaxies (SFGs) both locally (Garnett et al. 1995; Rigby et al. 2015; Berg et al. 2016, 2019; Senchyna et al. 2017, 2019) and at high redshifts (Fosbury et al. 2003, Erb et al. 2010, Bayliss et al. 2014; Stark et al. 2014, 2015a, 2017; Vanzella et al. 2016, de Barros et al. 2016, Maseda et al. 2017, Amoŕin et al. 2017; Laporte et al. 2017; Berg et al. 2018; Le Fèvre et al. 2019, Hutchison et al. 2019). The CIII] emission line is frequently observed in gravitationally-lensed SFGs at as the strongest line after Ly 1216Å emission. Since the Ly emission at is expected to be severely quenched by the increasingly neutral intergalactic medium (IGM), CIII] is emerging as an alternative redshift indicator for galaxies in the reionization era (Stark et al. 2015a, 2017; Ding et al. 2017). At , the rest-UV spectrum of galaxies is redshifted to the Near-InfraRed (NIR) wavelengths, and is accessible to the spectrographs on upcoming facilities (such as, the James Webb Space Telescope, and the 20m-class Extremely Large Telescopes), which will address the key goal of identifying the sources of reionization. In recent years, there has been considerable effort to develop spectral diagnostics involving the CIII] emission line and other UV spectral features (e.g., CIV1548, 1550Å , HeII 1640Å , OIII]1661, 1666Å ; hereafter, OIII]1663 or OIII]) that can be used to understand the nature of the reionizers, their hard ionizing continua, and the physical conditions in their interstellar media (Jaskot & Ravindranath 2016, hereafter JR16; Feltre et al. 2016; Gutkin et al. 2016; Nakajima et al. 2018a; Byler et al. 2018). The CIII] emission observed at high redshifts is mostly from strongly-lensed low-metallicity ( 0.5 ) , low-mass ( 1010 M⊙) galaxies with high specific star formation rates (SSFRs 2 Gyr-1), and their CIII] equivalent widths show a broad range EW(CIII]) 3-25Å (Fosbury et al. 2003, Erb et al. 2010, Bayliss et al. 2014; Stark et al. 2014; Vanzella et al. 2016, de Barros et al. 2016; Berg et al. 2018). The composite rest-frame UV spectra of Lyman-break galaxies at (Shapley et al. 2003), and of SFGs at (Steidel et al. 2016, Amorín et al. 2017) also reveal the CIII]1909 and OIII]1663 nebular lines at sub-solar metallicities.
In the local Universe (z0), the UV spectra of star-forming galaxies obtained with the Faint Object Spectrograph, and Goddard High Resolution Spectrograph on the Hubble Space Telescope (HST) revealed CIII]1909Å and OIII]1663Å in metal-poor Blue Compact Dwarfs (BCDs) and Wolf-Rayet galaxies (Garnett et al. 1995; Leitherer et al. 2011). These UV lines, although measured only in a small sample of low-metallicity galaxies, were used to determine C/O ratios and infer the elemental carbon abundances (Garnett et al. 1995). Based on the compilation of all the available CIII] equivalent width (EW) measurements for star-forming galaxies at low and high redshifts, Rigby et al. (2015) found that low-metallicity galaxies tend to have a stronger CIII] emission, and EW(CIII]) 5Å is only found in galaxies with . Only three galaxies in their compilation of 46 local SFGs showed EW(CIII]) 14Å , comparable to the strongest CIII] emitters at , and all three are Wolf-Rayet (WR) galaxies with high H equivalent widths. More recently, UV spectroscopy of BCDs (Berg et al. 2016, 2019), He II-emitters (Senchyna et al. 2017), and extremely metal-poor galaxies (Senchyna et al. 2019) with the HST/Cosmic Origins Spectrograph (COS), has increased the number of CIII] emission line measurements in the local Universe. Most of these SFGs have EW(CIII]) in the range of values seen for the galaxies, and only few of them with very low metallicities reach high EWs 12-14Å . The distribution of EW(CIII]) as a function of metallicity from these new studies also confirms that CIII] emission EWs 5Å only occurs at low-metallicities, with a clear transition occurring at 12+ log(O/H) 8.4 or (Senchyna et al. 2017, 2019).
The physical properties of the CIII]-emitters at inferred from the UV-optical spectra reveals that the ISM conditions in these low-metallicity SFGs are different from the high-metallicity SFGs, as evidenced by the presence of extreme optical emission lines with high EWs. Most of the CIII]-emitters for which optical spectra are available, show high EWs ( 1000Å ) for the [OIII]5007Å (hereafter, [OIII]5007 or [OIII]) emission line (Stark et al. 2014; Vanzella et al. 2016, Maseda et al. 2017), and would be identified as Extreme Emission Line Galaxies (EELGs; van der Wel et al. 2011) based on the contribution of the [OIII] emission to their broad-band colors. The star-forming galaxies at with strong UV-optical emission lines in their spectra, commonly show high ionization parameters (log -2), blue UV continuum slopes (), low dust content, and often show evidence for strong outflows (Steidel et al. 2014, Shapley et al. 2015, Maseda et al. 2014). The best fit photoionization models based on the photometric Spectral Energy Distributions (SEDs) suggest low metallicities and large EW([OIII] +H) ( 700Å) for the CIII] emitters at (Stark et al. 2015a, 2017). The contribution of strong nebular [OIII]5007+H to the Spitzer IRAC [3.6]-[4.5] colors is being increasingly used to identify galaxies (Smit et al. 2014, 2015; Roberts-Borsani et al. 2016; Stark et al. 2016), and their follow-up spectroscopy have revealed some of the strongest CIII] emitters with EW(CIII]) 20Å (Stark et al. 2017, Hutchison et al. 2019). Many of these high redshift sources are also Lyman Alpha Emitters (LAEs), and the EWs of the CIII] and Ly emission lines are found to be correlated (Shapley et al. 2003; Stark et al, 2014, 2015a; Rigby et al. 2015). LAEs are also actively star-forming with high SSFRs, low dust content, strong [OIII]5007Å emission, and their [OIII]5007Å /[OII]3727Å ratios (hereafter, O32) imply high ionization parameters (Nakajima & Ouchi 2014; Nakajima et al. 2016).
Although low metallicities and young stellar ages are favorable for CIII], the strength of the emission is determined by many other factors which are not yet fully understood. CIII] is a collisionally-excited emission line, and high nebular temperatures and densities are expected to enhance the emission due to the increased collisional rates. Photoionization codes are being used increasingly to try and understand the role of age, ionization parameter, metallicity, and dust on the emergent CIII] nebular line flux (JR16; Nakajima et al. 2018a). The models are able to reproduce the observed EW(CIII]) values including the very high values 10-15Å , but require extreme values of ionization parameter (logU -2), and very young stellar populations with ages 3 Myrs at . Only models that incorporate the effects of binary stellar evolution (Eldridge & Stanway 2009; Eldridge et al. 2017) are able to provide the hard ionizing continuum required to produce the strong CIII] emission with EW(CIII]) 10Å over long timescales ( 3 Myrs) as compared to the single-star models (JR16). The stellar population models including massive star binaries are also known to consistently account for the observed nebular emission line ratios in the rest-frame UV and optical spectra of galaxies (Steidel et al. 2016). Photoionization models predict that high optical depths, high C/O ratios, and the presence of shocks can enhance the CIII] emission for a given age, metallicity, and logU (JR16). In recent years, UV spectral diagnostics involving CIII], CIV, and He II have been identified (Feltre et al. 2016; Gutkin et al. 2016), that have the ability to distinguish between an ionizing continuum powered by star-forming galaxies versus Active Galactic Nuclei (AGNs). However, observations of low-metallicity galaxies that span the range of physical properties that determine the CIII] strengths are limited, offering few constraints to disentangle the effect of various model parameters on the emergent nebular line fluxes.
The Green Pea Galaxies (GPs) are among the closest low redshift analogs, to the low-mass, low-metallicity SFGs in the reionization era. The GPs at were originally identified in the Sloan Digital Sky Survey (SDSS) DR7 data, through a color selection based on the unusually strong [OIII]5007 emission (EW([OIII] 300Å ) in the -band (Cardamone et al. 2009). Their optical emission line spectra imply high star formation rates (SFRs 10 - 60 M⊙ yr-1), high specific SFRs (10-7 to 10-9 yr-1), low metallicities (), low extinction (), and the presence of hard ionizing spectra produced by very hot stars (Cardamone et al. 2009; Izotov et al. 2011, Amorín et al. 2012). GPs have high electron temperatures ( 15,000K) derived from the optical nebular lines, and the high O32 ratios suggest that they have high ionization parameters (Kewley & Dopita 2002; Jaskot & Oey 2013). The strong Balmer lines, and detection of the HeII 4686Å line indicate very young ages of 3-5 Myrs for the dominant stellar population (Jaskot & Oey 2013). Although the UV-optical spectra of GPs are dominated by the recently formed young stars, modeling their star formation history shows that they host an older population ( 1 Gyr), which contributes most of the stellar mass (Amorín et al. 2012). GPs have high EW([OIII]) ( 500-1000Å ), similar to the CIII] emitters at , and their O32 ratios, ionization parameters, metallicities, and sSFRs are more extreme than the normal, low- star-forming galaxies, but are comparable to LAEs at (Nakajima & Ouchi 2014). The GPs have low stellar masses (M 108 - 1010 M⊙), are UV-luminous (), and have compact sizes 5 kpc. In the HST images, some of the GPs appear as clumpy galaxies, with one or few bright super-star clusters that dominate the morphology, giving them a close resemblance to star-forming galaxies at (Izotov et al. 2018b, Henry et al. 2015).
The GPs are extremely valuable for exploring the nebular line diagnostics, because they are at low redshifts, , and the entire rest UV-optical spectra are accessible to determine their physical properties, ISM conditions, and escape fractions in much more detail than can be done for the high-redshift galaxies. The rest-UV spectra of GPs taken with the HST/COS covering the rest-wavelengths 950-1450Å show strong Ly emission with a variety of profile shapes and escape fractions, (Ly) = 0 - 98% (Jaskot & Oey 2014; Henry et al. 2015; Izotov et al. 2018a). Their Ly profiles are most often double-peaked, and the separation between the peaks is an indicator of the column density of neutral hydrogen and possible leakage of ionizing radiation (Verhamme et al. 2015, Verhamme et al. 2017). Direct measurements of the Lyman continuum (LyC) escape are only available for a handful of galaxies at low redshifts, and GPs have been the most promising candidates with high observed escape fractions, = 3% - 72% (Izotov et al. 2016a,b; Izotov et al. 2018a,b). Recently, Schaerer et al. (2018) reported the detection of intense CIII] 1909 emission with EW(CIII]) = 11.7 2.9Å in GP J1154+2443, a galaxy that has (Ly) = 98%, and is a confirmed Lyman continuum emitter with = 46%. In JR16, we presented various diagnostics involving the CIII] emission line, and offered specific predictions for the dependence of EW(CIII]) on the optical depth in GPs. Galaxies that have weaker EW(CIII]) than predicted for their O32 ratio are likely to be density-bounded or optically thin systems with a high fraction of Lyman continuum escape. Thus, EW (CIII]) can be an indicator of the optical depth, if the ionization parameter, age, and metallicity can be constrained using other emission lines in the spectra. According to the JR16 models with and age 10 Myr, for the GPs with O32 ratios , the CIII] EWs are Å at low optical depths, and EW (C III]) 6Å would require extremely young stellar ages, 2 Myrs. The photoionization models predict CIII] EWs for most of the GPs to be in the range of depending on the age of the starburst. Further, the models predict CIV 1549Å emission in GPs to be 50% of the CIII] emission and He II 1640Å 10% of CIII], although the latter may be affected by contributions from other sources, such as, a significant Wolf-Rayet population or shocks.
In this paper, we present new rest-UV spectroscopy of a sample of ten Green Pea Galaxies, and compare it with the JR16 photoionization model predictions to understand the conditions that give rise to the CIII] nebular emission and its dependence on metallicity () and ionization parameters (). Since optical emission line ratios from SDSS spectra offer independent constraints on the metallicity () and ionization parameter (), and the Ly lines offer information about the optical depth, these galaxies are excellent candidates to test the model predictions for CIII] emission. The details of observations and analysis are presented in section 2. The results on the correlations between CIII] emission and other UV-optical lines are presented in section 3, followed by the comparison with photoionization models in section 4. We discuss the results from GPs in the context of low-metallicity galaxies at high redshifts and implications for galaxies in the reionization era in section 5. Throughout this paper we assume 12+log(O/H) = 8.69 for Solar metallicity (Asplund et al. 2009).
2 HST/STIS Observations and Data Analysis
observations for the sample of GP galaxies were obtained with the Space Telescope Imaging Spectrograph (STIS) through the program GO-14134 (PI: Ravindranath), which was awarded 18 orbits. All the galaxies in our sample have archival /COS spectra covering the wavelengths that include the Ly emission. The STIS observations were designed to use the HST UV spectra to measure the CIII]1909Å line fluxes and equivalent widths, investigate the correlations between CIII] emission and Ly emission, and examine the behavior of CIII] emission relative to the rest-optical emission-line diagnostics derived from the SDSS spectra.
2.1 The Sample and Observations
We selected all the GP galaxies that had existing archival /COS spectra covering the wavelengths that include the Ly emission, from two previous HST GO programs that observed GPs. The sample consists of ten GPs (Table 1) at redshifts, , with low metallicities ( 0.4 Z⊙; Izotov et al. 2011), of which four are classified as “extreme” GP galaxies based on their high optical emission line ratios, with [OIII]4959,5007/[OII]3727 9 (Jaskot & Oey 2013). HST/COS G130M, G160M spectra are available in the archive for eight of the objects, covering the rest-wavelengths 950-1450Å from GO-12928 (PI: Henry), and two of the remaining galaxies have COS G160M spectra from GO-13293 (PI: Jaskot). The COS G160M spectra from both these programs provide Ly emission line detections with signal-to-noise (S/N) 10. The sample of GPs represent a range of physical properties with EW (Ly) , nebular oxygen abundances with 7.812+log(O/H)8.3 ( ), and stellar masses ( M⊙). The GPs have high UV surface-brightnesses ( 20 mag/arcsec-2) in the GALEX NUV images, and compact sizes ( 1 arcsec) which corresponds to physical sizes of 2.5-3.5 kiloparsecs for their redshifts.
| Name | R.A. | Dec. | Redshift | g | NUV | Exposure Times | |
|---|---|---|---|---|---|---|---|
| (J2000) | (J2000) | (AB mag) | (AB mag) | (s) | ( ) | ||
| J030321075923 | 03:03:21.41 | 07:59:23.2 | 0.165 | 19.4 | 19.6 | 4924 | 13452733 |
| J081552215623 | 08:15:52.00 | 21:56:23.6 | 0.141 | 20.1 | 20.1 | 7499 | 13742790 |
| J091113183108 | 09:11:13.34 | 18:31:08.1 | 0.262 | 19.5 | 19.8 | 4896 | 12422522 |
| J105330523752 | 10:53:30.82 | 52:37:52.8 | 0.253 | 18.8 | 19.2 | 2300 | 12512541 |
| J113303651341 | 11:33:03.79 | 65:13:41.3 | 0.241 | 20.1 | 19.7 | 5282 | 12632565 |
| J113722352426 | 11:37:22.14 | 35:24:26.6 | 0.194 | 18.9 | 19.3 | 2163 | 13132666 |
| J121903152608 | 12:19:03.98 | 15:26:08.5 | 0.196 | 19.5 | 19.3 | 1909 | 13112662 |
| J124423021540 | 12:44:23.37 | 02:15:40.4 | 0.239 | 19.2 | 19.9 | 4974 | 12652569 |
| J124834123402 | 12:48:34.63 | 12:34:02.9 | 0.263 | 19.9 | 19.9 | 4698 | 12412520 |
| J145735223201 | 14:57:35.13 | 22:32:01.7 | 0.149 | 19.4 | 19.9 | 4926 | 13642771 |
Note. — The coordinates, redshifts, and g magnitudes are from SDSS DR7, and the magnitudes are taken from . The last two columns provide the total exposure times for the /STIS observations, and the rest-frame UV wavelength coverage in the G230L grating for each galaxy based on its redshift.
The /STIS observations were carried out using the G230L grating that covers the wavelength range 1700-3200Å at a spectral resolution of R 300 - 600 across these wavelengths. The average dispersion with the G230L grating is 1.58Å per pixel, and the 2-pixel resolution element yields a 3.16Å wavelength resolution for the spectrum. STIS is equipped with the NUV-MAMA detector, with a pixel scale of 0.025 arcsecs/pixel (or 0.05 arcsecs per 2-pixel resolution element). The GP galaxies are barely resolved in SDSS images, with sizes 1 arcsec. We used the 52′′ 0.5′′ slit to optimize between slit loss and spectral resolution, resulting in R 500 over most of the wavelength range. The target acquisition images were taken using short exposures ( 100s) on the STIS CCD detector. The exposure times for the STIS NUV spectra were estimated based on the GALEX NUV flux for the continuum and using the predicted CIII]1909Å and [OIII]1663Å emission line fluxes from CLOUDY photoionization models (Ferland et al. 2013). The total exposure times varied from 2500s to 7500s based on the target brightness and predicted emission line fluxes.
2.2 Analysis
We retrieved STIS spectra from the MAST archive, which are pipeline-processed and calibrated using CALSTIS. The pipeline produces flux-calibrated, rectified two-dimensional spectroscopic images, and one-dimensional spectra of flux versus wavelength for each target. The default aperture used for spectral extraction in the pipeline is 11 pixels (0.275 arcsecs) along the cross-dispersion axis. However, some of the GPs are clearly more extended in the spatial direction based on the 2-dimensional spectroscopic image and the acquisition images. We re-processed the raw data files using updated reference files, and performed the spectral extraction using optimized extraction boxes. The standard extraction height of 11 pixels was used for the more compact GPs, and the spectra of the more extended sources were extracted using 21 pixels in the spatial direction. The extracted 1-D spectra were smoothed by 2 pixels in the wavelength direction to a final spectral resolution of 3.2Å per pixel. In the cases where there were multiple exposures from 2 or more orbits, the one-dimensional spectra from multi-orbit visits were combined using scombine in pyRAF. The final combined spectra have S/N 4 per pixel in the continuum at Å for all the GPs.
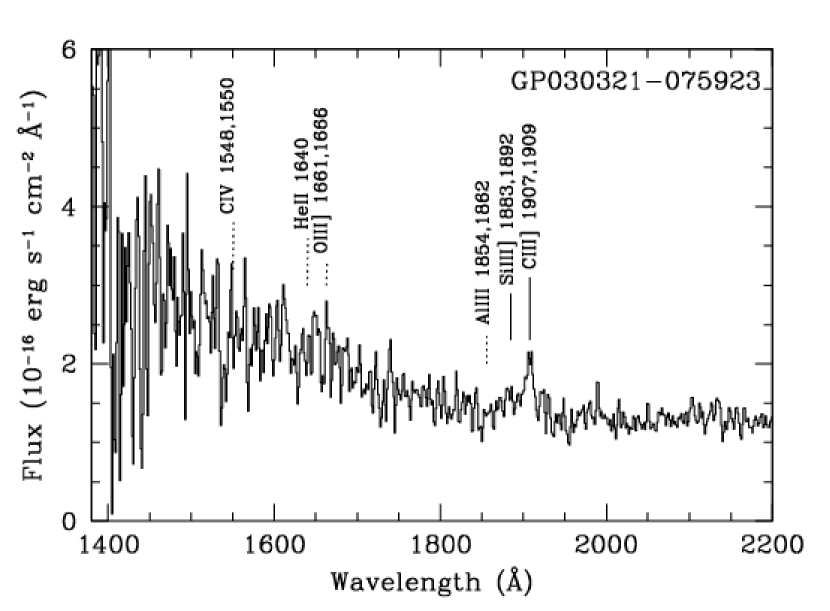
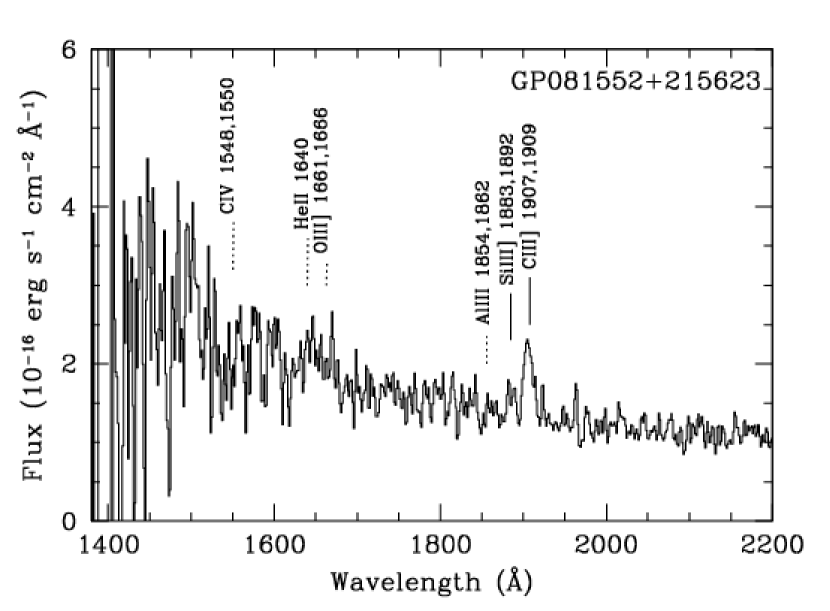
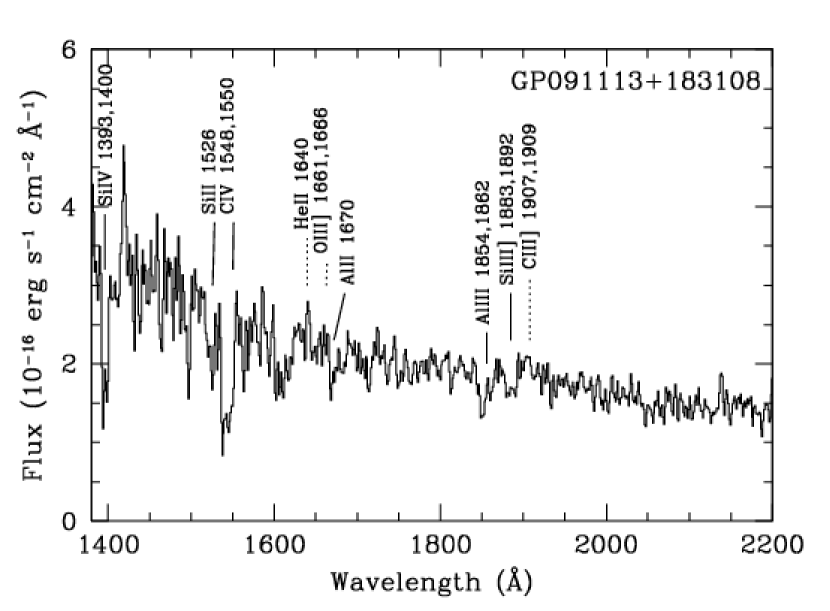
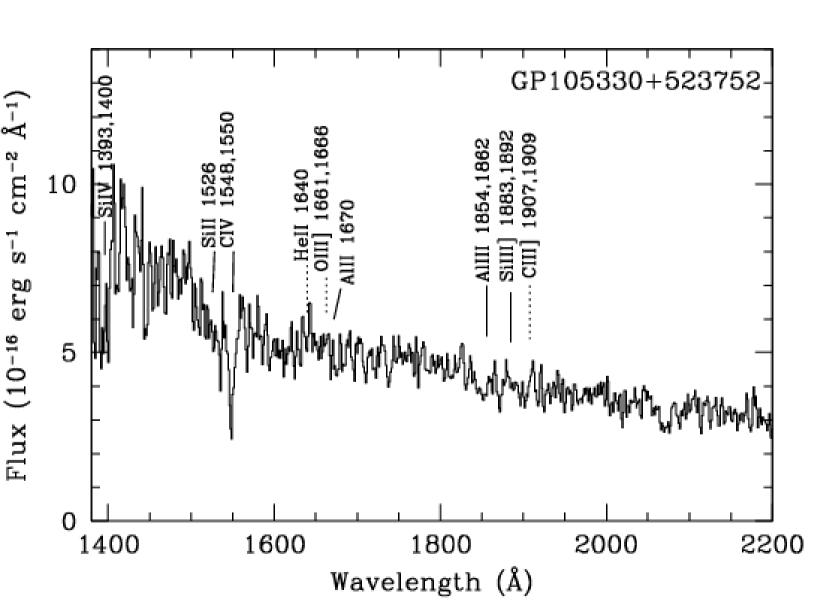
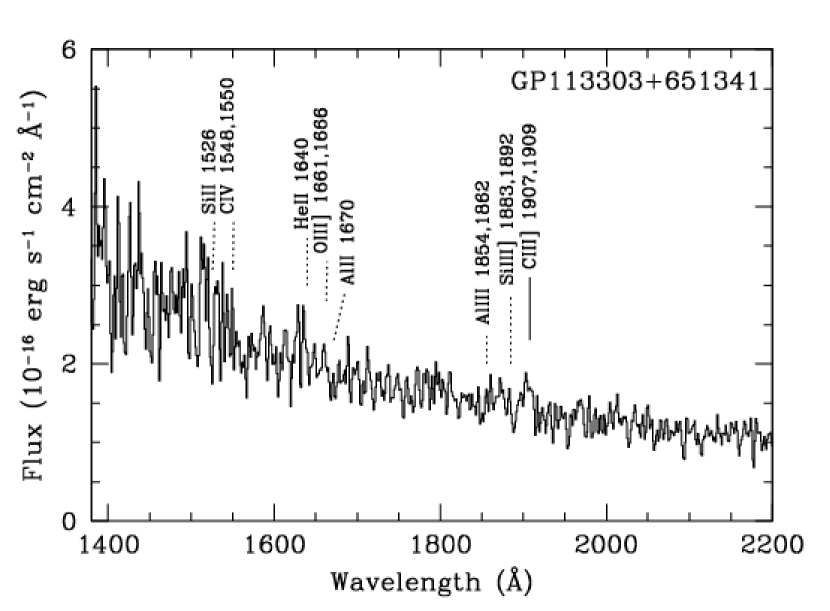
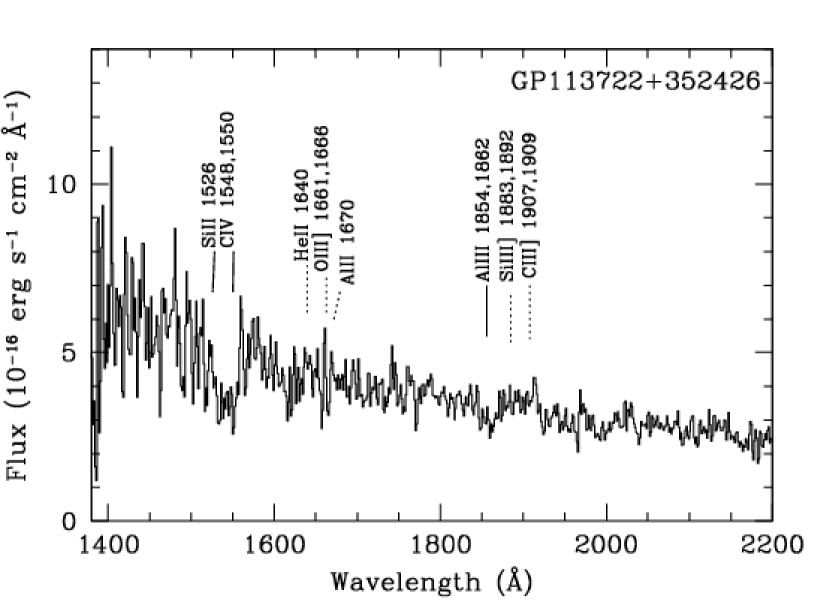
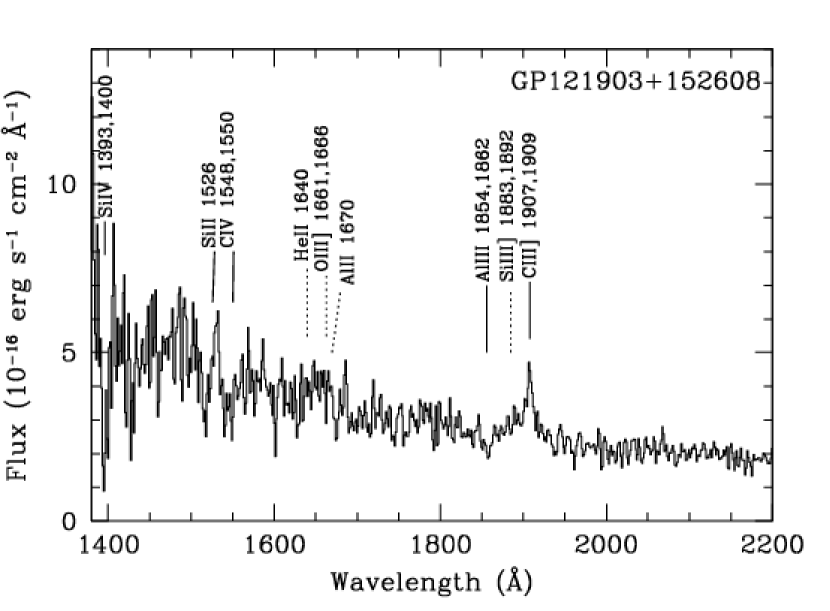
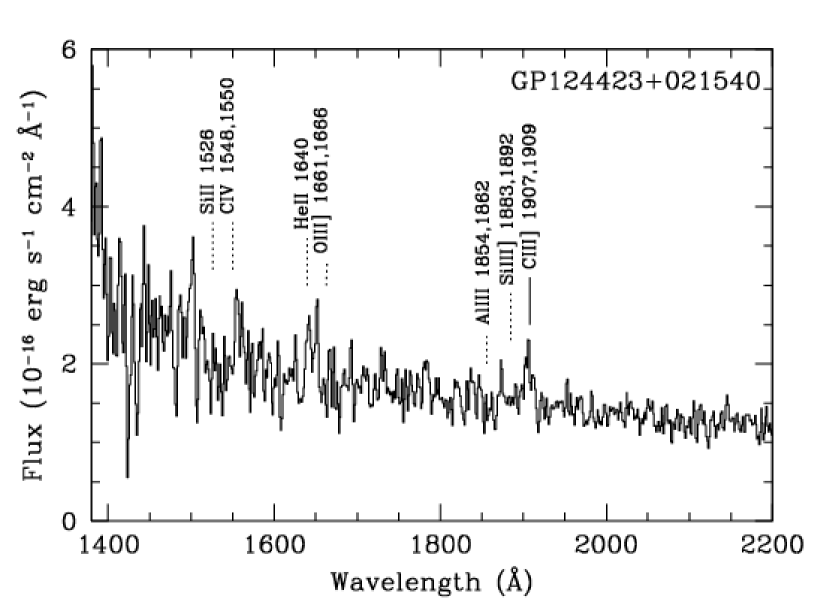
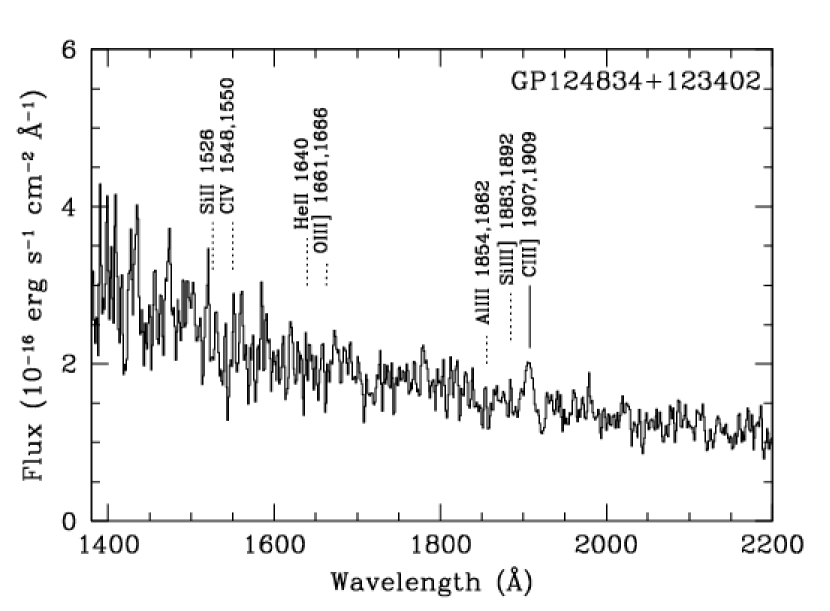
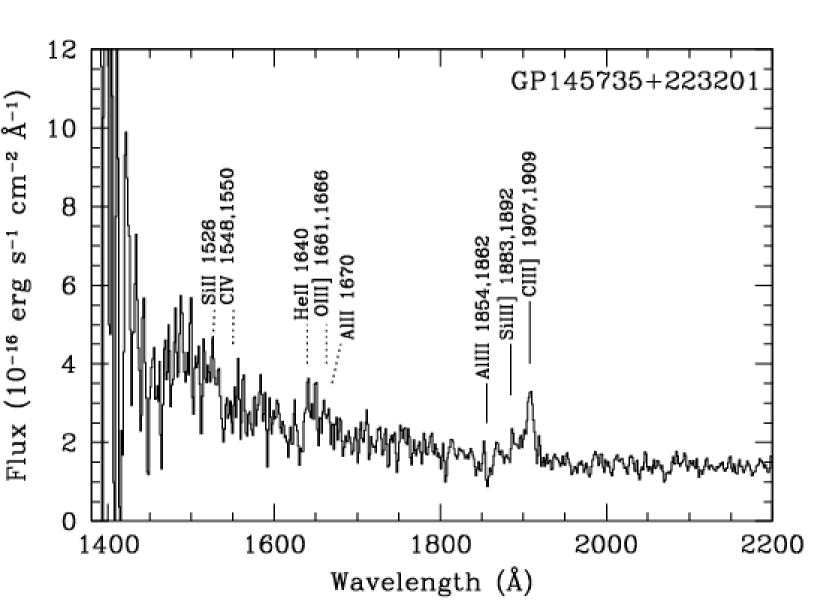
The HST/STIS spectra covering rest-UV wavelengths from 1400-2200Å for the sample are presented in Figure 1 and Figure 2. The CIII] emission line is detected with greater than 3- significance in 7 of the 10 GPs. We measured the fluxes and equivalent widths of the CIII] emission line using the splot task within the specred package in PyRAF. We used the HST/COS acquisition images to measure the extent of the UV continuum and to correct for the slit losses due to the 0.5′′ 0.525′′ aperture used for HST/STIS spectral extraction for the GPs. In most cases the UV continuum is compact and the extraction box includes % of the flux, except for two galaxies which have multiple UV-bright knots and only 62% of the flux is within the extraction box. There is a possibility that the nebular emission may be more extended than the continuum. We used the HST/ACS images taken in the narrow-band ramp filter tuned to [OIII]5007Å from HST-GO-13293 (PI: Jaskot) to measure the slit losses for 4 galaxies (J0303-0759, J0815+2156, J1219+1526, and J1457+2232) in our sample. The extent of the nebular emission and measured slit losses were found to be comparable to that measured from the UV continuum in all cases. The EW(CIII]) measurements were performed by using direct integration of the area under the line, and also by using the Gaussian profile fitting method. The measurements from the two methods are in close agreement and the average of the two is used for further analysis. The continuum flux () is assumed to be flat in the vicinity of the CIII] line. The noise in the continuum spectrum on either side of the emission line contributes to the uncertainty in the measured EWs. We include this in the errors by using repeated measurements with different continuum levels to determine the r.m.s uncertainty arising from the continuum noise.
We do not detect any measurable CIII] emission in 3 GPs, J0911+1831, J1053+5237, and J1137+3524, and provide upper limits on their CIII] fluxes in Table 2. These GPs with no CIII] emission line in their rest-UV spectrum have dominant interstellar (and possibly stellar) absorption features, in particular, Si IV 1393, 1402Å and C IV 1548, 1550Å . We detect strong CIV 1548,1550Å absorption lines with EW(C IV) = 0.3Å , 0.02Å , and 1.91 in J0911+1831, J1053+5237, and J1137+3524 respectively. In the case of J0911+1831 and J1053+5237, the spectra also show SiIV 1393, 1402Å absorption. GP1137+3524 has a lower redshift (z=0.194) and only a broad CIV absorption is detected. SiIV absorption cannot be identified for this galaxy because it falls in the low S/N blue end of the spectrum.
We do not detect the OIII]1663Å doublet in any of the GPs, although it is one of the most prominent nebular lines seen in the rest-UV spectra of low-metallicity galaxies. We provide 3- upper limits for the OIII]1663Å doublet in Table 2. The photoionization models from JR16 show a tight correlation between the [OIII]4363Å optical line emission and the OIII]1663Å emission, and this allows us to predict the expected OIII] fluxes. We estimate a value for the ionization parameter () using the O32 vs. C III] EW diagram from JR16. Then, keeping fixed, we interpolate the predicted OIII]1663/[OIII] 4363 ratios as a function of metallicity (), given the GPs’ calculated metallicities. The uncertainty in dominates over the uncertainty in our estimate, and the errors provided in Table 2 show the uncertainty in the predictions given the GPs’ metallicity uncertainties. The predicted OIII] 1663Å fluxes are below or close to the detection limits in most cases. In the LyC leaker GP galaxy, J1154+2443, Schaerer et al. (2018) detect OIII] 1663Å with EW = 5.82.9Å , which is 0.5 EW(CIII]). However, that galaxy has a much lower metallicity than our sample with 12+log(O/H) 7.65, closer to the metallicities of BCDs (Berg et al. 2016, 2019) that also show significant OIII]1663Å detections. There are 5 galaxies in our sample with , but even in such low-metallicity galaxies, the OIII] 1663Å can be weak with median EW 2.4Å (Senchyna et al. 2017).
We measured the fluxes and EWs of the Ly emission from their /COS FUV spectra, and the [OIII]4363Å , [OIII]5007Å , and H emission lines from the SDSS spectra for all of the GPs. The line fluxes were corrected for Milky Way extinction using the Fitzpatrick (1999) extinction law and the Schlafly & Finkbeiner (2011) dust map. The fluxes were corrected for internal reddening using the Balmer decrement derived from the observed H/H ratio and the Cardelli, Clayton, & Mathias (1989) reddening law, taking into account the variation of RV in the presence of intense UV radiation as outlined in Izotov et al. (2017). All of the GPs exhibit very low internal reddening with E(B-V) = 0.03 - 0.2. The extinction-corrected fluxes for rest-UV and rest-optical emission lines are provided in Table 2, and the EWs are presented in Table 3.
2.3 The Composite Rest-UV Spectrum
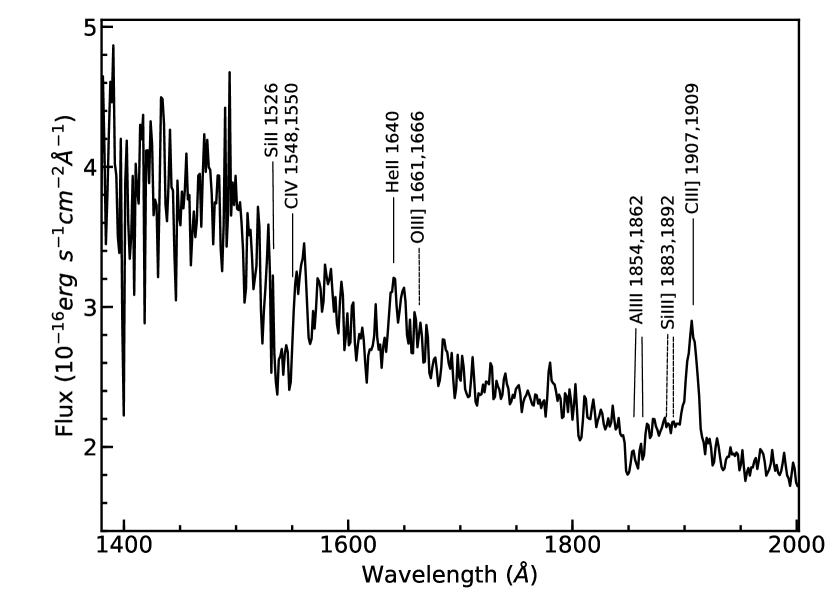
The stacked composite rest-UV spectrum of the GPs was created after applying a doppler correction to bring each individual spectrum to the rest-frame wavelengths using the redshifts inferred from the [OIII]5007Å emission line in the SDSS spectrum. Each GP spectrum was scaled to match the flux density between 2000-2100Å , which is redward of the CIII] doublet and is a continuum region that has high S/N and is free of absorption lines. The stacking was done using the scombine task in the PyRAF/Specred package, by averaging at each dispersion point after applying a 3-sigma clipping factor. The composite spectrum created from all 10 GPs is shown in Figure 3. The composite spectrum reveals weak spectral features, particularly the broad emission feature at the location of HeII 1640Å line. Only 3 GPs in the sample show weak He II emission feature in their individual spectra, with EW (HeII) = 0.770.05Å for J0815+2156, 2.320.02Å for J1244+0215, and 1.020.03Å for J1457+2232. The EW(He II) as measured in the composite spectrum is 20% of the CIII] emission flux. As noted in JR16, the photoionization models for GPs predict much weaker nebular HeII 1640Å , 10% of CIII]. However, it is known that the models tend to underpredict the HeII emission strengths, as evidenced also by the observed higher optical HeII 4686Å/H line ratios for GPs. Additional sources, such as Wolf-Rayet stars, shocks, or high-mass X-ray binaries have been invoked to explain the higher than predicted HeII strengths (Shirazi & Brinchmann 2012; Jaskot & Oey 2013). The composite spectrum also reveals stellar photospheric and interstellar absorption features, including SiII1526Å , CIV1548,1550Å , and AlIII1854,1862Å . The CIV absorption does not show the characteristic P-Cygni profile shape in the composite spectrum, because the stacking is performed using a small sample of 10 galaxies, of which only three have the strong CIV absorption feature and with widely different profile shapes.
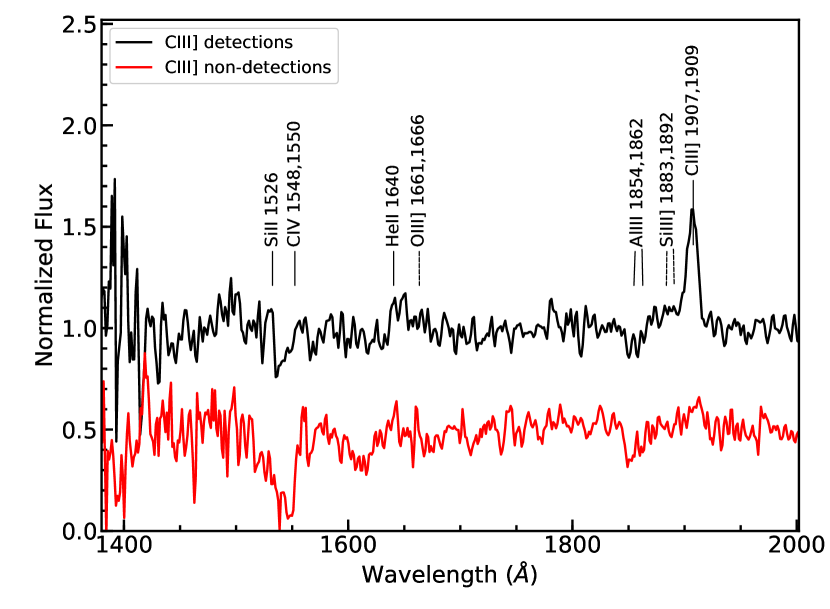
In Figure 3, the normalized composite spectrum is shown separately for the GPs with CIII] detections and non-detections. The interstellar absorption features are more prominent in the composite spectra of galaxies with CIII] non-detections compared to the stack of the entire sample. The CIV 1548,1550Å absorption profiles are stronger in the weak CIII]-emitters and those with non-detections. The very broad wing of the CIV feature in the composite spectrum is mainly contributed by the absorption profile of GP1137+3524 (Figure 1). The SiIV1393,1402Å interstellar absorption lines are also more easily identified in the composite for galaxies with CIII] non-detections. In the case of the CIII]-emitters, there may be many factors that make the absorption lines less prominent, such as interstellar emission filling in the absorption features, the stronger nebular continuum from the ionized gas, or a difference in the age of the stellar population. Notably, the HeII 1640Å emission feature is prominent in the stack created using only the CIII]-emitters, and is not present in the composite from the CIII] non-detections. The OIII]1663Å doublet remains undetected even in the stack created using only the CIII] detections.
3 Semi-Forbidden CIII] Emission in Green Pea Galaxies
The CIII] nebular emission line is clearly the most prominent spectral feature in the HST/STIS rest-UV 1400-2200Å spectra of the GPs. We detect CIII] emission in 7/10 GPs in our sample, and the measured EWs are provided in Table 3 along with upper limits for the three non-detections. The rest-frame CIII] EWs for the GPs span values from as low as 1.67Å to as high as 9.35Å , comparable to the strengths of CIII] emission seen in CIII] emitters at high redshifts (). When detected, the EW(CIII]) is 3Å in most cases and is consistent with the predictions for CIII] emission lines in GPs from the photoionization models of JR16. Based on the GPs’ metallicities, derived using the direct abundance method, and their observed [OIII] 5007Å , [OII] 3727Å , and [Ne III] 3869Å line strengths, these models predict C III] EWs in the range of 2-10Å , which is in close agreement with what we observe in the HST STIS spectrum. None of the GPs in our sample have the very high (15Å ) EWs seen in high redshifts (z 3-6) galaxies (Stark et al. 2017; Ding et al. 2017; de Barros et al. 2016). However, GPs with lower metallicities than this sample, such as, J1154+2443 from Schaerer et al. (2018), do show high EW(CIII]).
3.1 Frequency of CIII]-emitters
GP galaxies are, by definition, a class of strong [OIII] 5007Å emitters with EW([OIII]) 300Å . The frequency of CIII]-emitters ( 70%) we find among the GPs suggests that extreme emission-line galaxies selected by the presence of strong high ionization lines (e.g; [OIII]5007) are very likely to also be strong CIII]-emitters. It is interesting, therefore, to see how this fraction compares to star-forming galaxies selected using different criteria. In the sample of HeII emitters in the local Universe, CIII] doublet emission is detected in 7/10 galaxies, with EW(CIII]) Å (Senchyna et al. 2017). The HeII emitters span a wider range in metallicities (7.81 12+log(O/H) 8.48), particularly towards lower metallicities than our GP sample. Local blue compact dwarf galaxies with low-metallicities (7.2 12+log(O/H) 8.2) have a higher fraction of strong CIII]-emitters (Berg et al. 2016, 2019) with EW(CIII]) reaching as high as 15Å at the lowest metallicities.
| Name | Fλ(CIII]1909) | F(OIII]1666) | Iλ(CIII]1909) | I(OIII]1666) | Iλ([OIII]5007) | e | I(OIII]1666) |
|---|---|---|---|---|---|---|---|
| J030321075923 | 0.8490.09 | 0.714 | 1.9180.21 | 1.428 | 52.88 | 1.709 | 1.76 |
| J081552215623 | 1.6170.01 | 0.460 | 3.2100.01 | 0.853 | 42.45 | 1.456 | 1.08 |
| J091113183108 | 0.446† | 0.605 | 2.318† | 2.991 | 27.84 | 0.928 | 0.30 |
| J105330523752 | 0.987† | 2.505 | 2.262† | 5.579 | 43.77 | 0.849 | 0.35 |
| J113303651341 | 0.3680.08 | 0.556 | 0.8650.18 | 1.278 | 16.32 | 1.185 | 0.33 |
| J113722352426 | 0.856† | 1.479 | 1.666† | 2.791 | 65.06 | 0.898 | 0.61 |
| J121903152608 | 1.9920.01 | 1.141 | 3.0690.02 | 1.708 | 61.37 | 1.768 | 2.21 |
| J124423021540 | 0.6560.06 | 0.742 | 1.7940.18 | 1.971 | 76.83 | 1.013 | 0.91 |
| J124834123402 | 0.9980.09 | 0.727 | 2.4390.25 | 1.748 | 33.13 | 1.055 | 0.44 |
| J145735223201 | 2.0800.02 | 0.622 | 5.8460.06 | 1.605 | 95.61 | 1.400 | 2.34 |
Note. — The observed emission line fluxes (columns 2 and 3) and fluxes corrected for internal reddening and Milky Way extinction (columns 4, 5, and 6) in units of 10-15 erg/s/cm2. The 3- upper limits are indicated by the † symbol. The OIII]1666 fluxes are all upper limits (†) from /STIS spectra, and the expected fluxes (e) (column 8) are based on the OIII]1666/[OIII]4363 ratio (column 7) from CLOUDY models. The [OIII]4363 and [OIII]5007 fluxes are from the SDSS spectra.
At higher redshifts, CIII]-emitters have been identified in surveys of star-forming galaxies that employ a more broader range of selection criteria (e.g., UV luminosity or color selection). Using MUSE observations, Maseda et al. (2017) find 17 CIII]-emitters which represents only 3% of their photometric sample of star-forming galaxies between in the Hubble Deep Field South and Ultra Deep Field. The CIII] EWs of these galaxies are in the range of Å , similar to the GPs in most cases. However, a larger fraction (5 out of 17) among these high redshift star-forming galaxies are strong CIII]-emitters with EW(CIII]) 10Å , and 3 of them have EW(CIII]) 11.7Å which is the highest value observed for the GPs (Schaerer et al. 2018). Among the UV-selected star-forming population at in the VUDS survey (Le Fèvre et al. 2019), 24% of the SFGs have EW(CIII]) 3Å and of these 4% of have 10Å . While the number of known high redshift CIII]-emitters at is small, in almost all cases they have high EWs for CIII], and their broad-band colors suggest the presence of strong optical emission lines with EW([OIII]) 500Å (Stark et al. 2014; 2017). In summary, the frequency of CIII]-emitters among GPs and other low-metallicity galaxies with strong optical emission-lines is higher, compared to populations of star-forming galaxies selected based on UV luminosity or colors which likely span a wider range of metallicities.
3.2 CIII] and Lyman- Emission
Previous studies have highlighted the empirical relation between the CIII] and Ly emission line equivalent widths (Shapley et al. 2003; Stark et al. 2014, 2015a; Rigby et al. 2015; Nakajima et al. 2018a). Both CIII] and Ly emission lines are produced in the ionized gas and are powered by the ionizing radiation from the young, massive stars. Ly is a resonant line and is sensitive to neutral gas, while CIII] emission escapes freely. The relation between CIII] and Ly EWs is important in the context of the potential use of CIII] emission as a redshift indicator, and a tracer of the ionizing populations during the reionization epoch. At , the Ly photons are resonantly scattered by the neutral Hydrogen in the intergalactic medium (IGM), making the detection of Ly emission difficult (Tilvi et al. 2014; Konno et al. 2014; Mason et al. 2018). The CIII] emission from actively star-forming galaxies at these redshifts, however, is often strong and easily observable (Stark et al. 2015a, 2017; Ding et al. 2017, Hutchison et al. 2019) making it a useful diagnostic emission line at high redshifts.
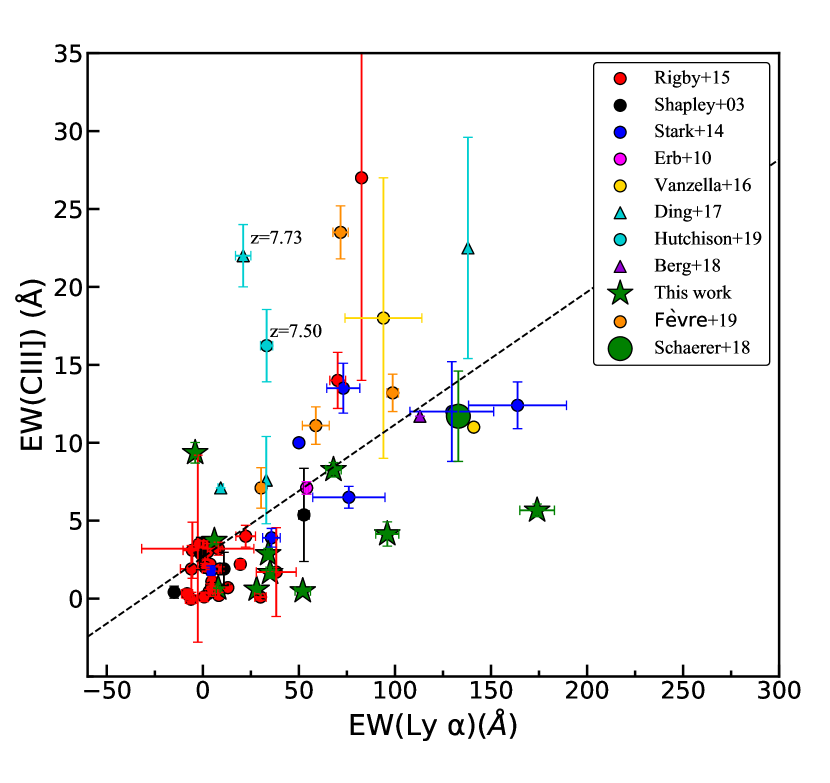
In Figure 4 (left), we present the observed relation between EW(CIII]) and EW(Ly) for the GPs along with other samples at low and high redshift from the literature. The GPs mostly lie along with the high redshift galaxies, with EW(CIII]) that spans the range Å and with EW(Ly) Å . The Pearson correlation coefficient suggests a strong linear relationship between EW(CIII]) and EW(Ly) for star-forming galaxies in Figure 4, with , and a low probability () that the two quantities are uncorrelated. However, there is no strong correlation that is evident within the GPs sample alone. By definition, the GPs selection isolates strong emission line galaxies, and the scatter in Ly EW among the GPs is likely driven by the variations in Ly optical depth due to the neutral gas. Star-forming galaxies that are non-GPs are not necessarily extreme emission line objects, and their weak Ly emission may indicate that the flux in the emission lines are intrinsically low. One of the two most deviant points in Figure 4 is J1457+2232 which has the highest EW(CIII]) among the GPs sample, but the measured EW(Ly) is weak or absent. Jaskot & Oey (2014) propose that the dominant broad absorption feature of the Ly profile in this galaxy implies the presence of a high column density of neutral gas along the line of sight, and the weak Ly emission probably escapes via scattering, perhaps in a bipolar outflow. J1219+1526, on the other hand, has the highest EW(Ly) = 1749Å among the GPs sample , and rest-frame EW(CIII]) = 5.660.48Å , which is lower than expected from the empirical EW(CIII])-EW(Ly) relation. There are various factors that can impact the CIII] line strengths and are discussed in detail in section 3.5.
| Name | Ly1216 | CIII]1909 | [OIII]4363 | [OIII]5007 | H6563 |
|---|---|---|---|---|---|
| (Å) | (Å) | (Å) | (Å) | (Å) | |
| J030321075923 | 61 | 3.720.24 | 11.40.5 | 82610 | 69712 |
| J081552215623 | 684 | 8.270.53 | 18.51.5 | 136529 | 89816 |
| J091113183108 | 524 | 0.49† | 2.30.5 | 2743 | 4227 |
| J105330523752 | 81 | 0.66† | 2.30.3 | 3503 | 4014 |
| J113303651341 | 352 | 1.660.44 | 5.00.6 | 3945 | 3056 |
| J113722352426 | 282 | 0.59† | 4.30.3 | 5824 | 5756 |
| J121903152608 | 1749 | 5.660.48 | 21.50.7 | 148816 | 126621 |
| J124423021540 | 342 | 2.870.44 | 8.00.4 | 98510 | 84111 |
| J124834123402 | 966 | 4.140.98 | 7.40.7 | 84212 | 74319 |
| J145735223201 | -41 | 9.350.76 | 19.30.7 | 143314 | 100014 |
Note. — The Ly equivalent widths are based on /COS measurements (Henry et al. 2015; Jaskot& Oey 2014), the CIII]1909 equivalent widths are measured from /STIS, and the equivalent widths of the optical emission lines are measured from SDSS spectra. The 1- upper limits are indicated by the † symbol.
Among the non-GP glaxies, the noticeably deviant points from the empirical correlation between EW(CIII]) and EW(Ly) are the highest redshift galaxies, EGS-zs8-1 at with high EW(CIII]) 222Å and weak EW(Ly) = 214Å (Stark et al. 2017), and z7-GND-42912 at with EW(CIII]) 16.232.32Å and EW(Ly) = 33.23.2Å (Hutchison et al. 2019). Both galaxies exhibits very red [3.6]-[4.5] color in the Spitzer infrared bands which results from the large rest-frame equivalent width of the [OIII]+H in the 4.5m band, a selection criterion that is comparable to the GP galaxies selection at low redshift. For EGS-zs8-1, Stark et al. (2017) find that the velocity offset of the Ly emission line, = 340 - 520 km/s, implies that the Ly profile is modulated by the presence of dense neutral gas close to the systemic redshift of the galaxy. The high column density of neutral gas is responsible for the observed low EW(Ly). The case of the GP galaxy J1457+2232 is similar, as the Ly profile shows a large velocity separation 750 km/s between the emission peaks, which suggests a high column density along the line of sight. EGS-zs8-1, z7-GND-42912, and J1457+2232 have higher EW(CIII]) than expected for their EW(Ly) from the EW(CIII]) EW(Ly) empirical relation. Such galaxies illustrate the utility of the CIII] emission line as an alternate diagnostic for the spectroscopic redshifts and ISM conditions, when Ly is absorbed by the neutral gas in the ISM and IGM.
3.3 CIII] and Rest-Optical Emission lines
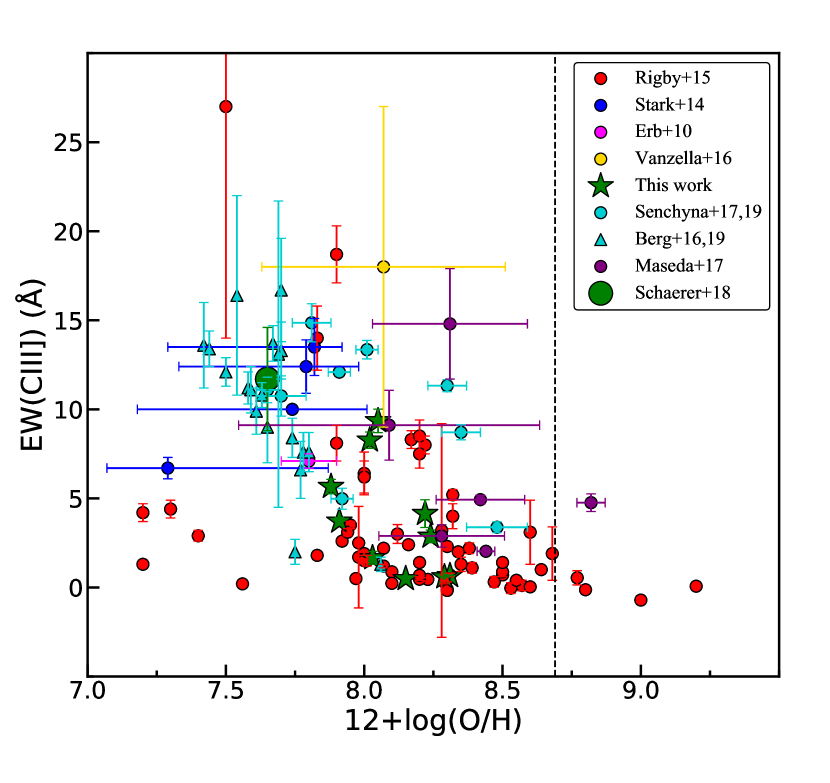
The SDSS spectra of GPs provide a suite of rest-frame optical emission lines, which are useful to derive electron temperatures (), and to estimate the gas-phase metallicities or nebular oxygen abundances (12+log(O/H)). The nebular abundances used in our analysis are based on the direct method using ([O III]) calculated from the [O III] line fluxes from SDSS spectra. In Figure 4 (right), we present EW(CIII]) versus metallicity for the GPs, along with various samples of CIII]-emitters at low and high redshifts from the literature (Rigby et al. 2015; Maseda et al. 2017; Senchyna et al. 2017, 2019; Berg et al. 2016, 2019; Stark et al. 2014; Vanzella et al. 2016; Nakajima et al. 2018b). Previous studies have highlighted the significant trend of increasing EW(CIII]) with decreasing metallicity, reaching values 5Å only at 12+log(O/H) 8.4 or 0.5 Z⊙ (Rigby et al. 2015; Maseda et al. 2017; Nakajima et al. 2018a; Senchyna et al. 2017). Using photoionization models it has been shown that low metallicities create ISM conditions that are necessary to produce significant CIII] emission (JR16; Gutkin et al. 2016; Feltre et al. 2016; Nakajima et al. 2018a; Byler et al. 2018). At low metallicities, stars have higher effective temperatures with weaker stellar winds, and their harder ionizing SED boosts the supply of C+ ionizing photons. Also, since the ionized nebulae predominantly cool via the forbidden emission of metal lines, the low metallicity nebulae tend to have higher favoring high collisional excitation rates and stronger CIII] emission. At a fixed C/O ratio or carbon abundance, the photoionization models require a metallicity threshold of Z 0.006 for the CIII] to be strong with EWs in excess of 3Å. The GP galaxies have metallicities 0.4 (or ), and their EW(CIII]) shows a large spread at a given metallicity, indicating that the CIII] emission is also influenced by other factors, such as, ionization parameter, age of the stellar population, and the C/O ratio (JR16, Nakajima et al. 2018a).
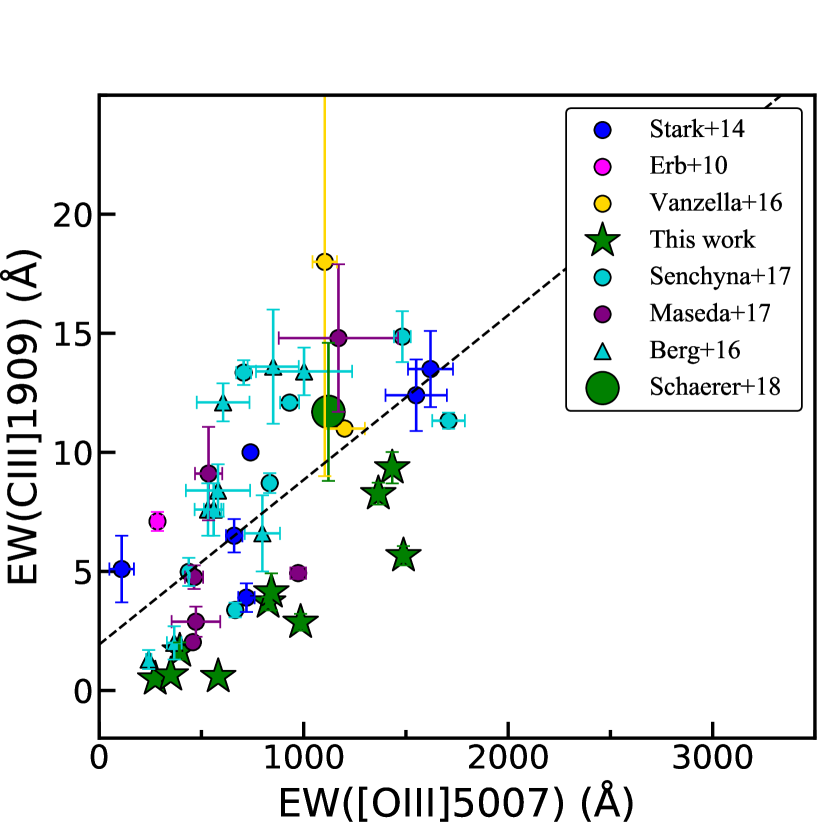
High nebular temperatures, high ionization parameters, and hard ionizing radiation from metal-poor, young stellar populations with ages 5 Myrs enhance the CIII] 1909Å emission. The same physical conditions that produce strong CIII] emission, also favor the emission of strong forbidden lines from collisionally-excited species in the optical wavelengths. The relation between EW(CIII]) and equivalent width of [OIII]5007Å (hereafter, EW([OIII])) provides insight into the frequency of CIII] emission among the [OIII]-emitters, and how the relative emission-line fluxes inform us about the ISM properties. In Figure 5, we show the empirical relation between EW(CIII]) and EW([OIII]) for the GPs along with other star-forming galaxies for which measurements are available in the literature. The sample presented in Figure 5 is inhomogeneous, in the sense that some of the measurements correspond to individual compact star-forming regions, while the others are integrated measures over the entire galaxies. Also, the apertures used for measuring the rest-UV and rest-optical fluxes are not matched in all cases. However, it is clear that there is a strong trend between the CIII] and [OIII] EWs. The EW(CIII])-EW([OIII]) relation is almost linear, since both CIII] and [OIII] are collisionally-excited lines which are favored by higher nebular temperatures and higher ionization parameters. The Spearman rank correlation statistic between EW(CIII]) and EW([OIII]) indicates a strong correlation with (), and the Pearson correlation statistic suggests a strong linear correlation with (). As seen from the photoionization models (JR16; Figure 8), the relation between the two EWs exhibits a large spread that reflects the range in ionization parameter, nebular temperature, and the dependence on metallicity. Extreme values of EW([OIII]) 2000Å, and EW(CIII]) 10Å require both high ionization parameters (log -2) and young stellar populations with ages less than 3 Myrs. The energy requirements for the excitation of these two emission lines are different, although similar physical conditions tend to favor them. Both emission lines require an ionizing spectrum that has high energy photons, since the ionization energy for C+2 is 24.4 eV and for O+2 is 35.1 eV. However, because of the temperature dependence of the collisional excitation rates, the CIII] emission exhibits a greater sensitivity to metallicity. This may also explain the offset of the GPs in our sample from the other low-redshift samples. The BCDs (Berg et al. 2016) and He II emitters (Senchyna et al. 2017) mostly have lower metallicities with 12+log(O/H) 8.0 for the strong CIII]-emitters. The location of the low-metallicity GP galaxy J1154+2443 (Schaerer et al. 2018) which lies along with BCDs and He II emitters in Figure 5, also seem to suggest that the offset for the GPs in this work may be due to their relatively higher metallicities.
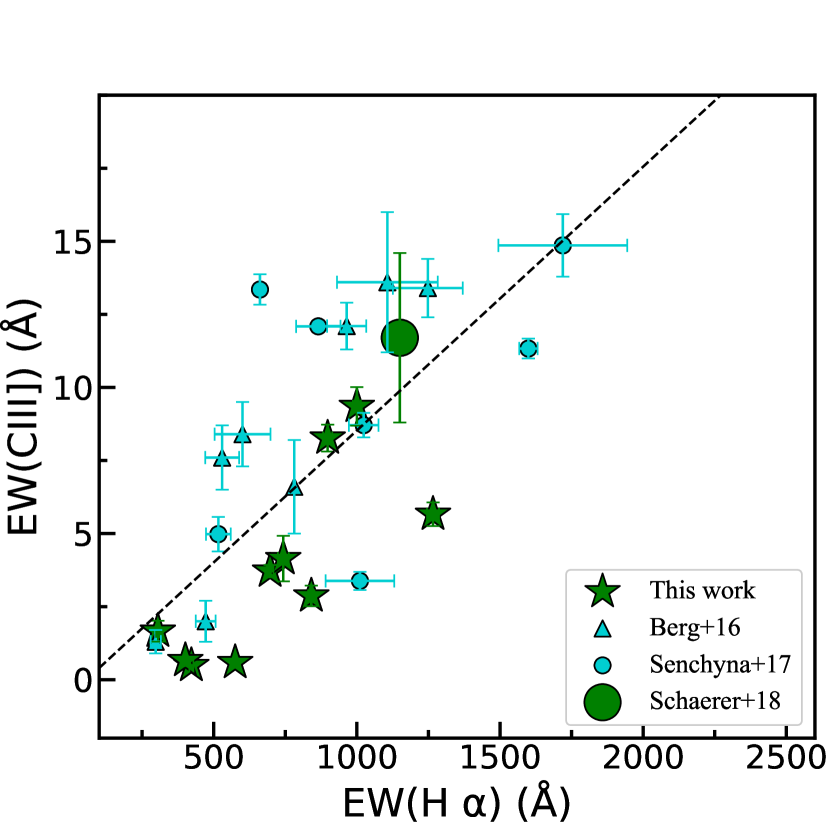
The EW(CIII]) also shows a trend with EW(H) as expected, because the nebular emission lines both depend on the amount of ionizing radiation. The Spearman rank correlation statistic between EW(CIII]) and EW(H) indicates a strong correlation with (), and the Pearson correlation statistic suggests a strong linear correlation with (). The EW(CIII]) versus EW(H) relation is tighter than the EW(CIII]) versus EW(Ly) relation (Figure 4) which is significantly modified by radiative transfer effects as the Ly is resonantly scattered. Even the GPs which show large deviations in the EW(CIII]) vs EW(Ly) relation, follow a tight correlation with EW(H). Since H is a well-calibrated SFR indicator (Kennicutt 1998), it is encouraging to consider the possibility of using the CIII] emission as a diagnostic for the ionizing flux and SFR at high-. CIII] emission depends on the ionization parameter and ionizing flux as does the H emission, but the dependence of CIII] on metallicity and density makes it a weaker diagnostic for SFR. However, when H emission is redshifted beyond the NIR wavelengths at , the CIII] emission may serve as a useful diagnostic for estimating the production rate of ionizing photons (Chevallard et al. 2018; Schaerer et al. 2018).
3.4 Estimate of the C/O ratios
The elemental carbon abundance is one of the parameters that influences the CIII] emission. Previous studies have used the CIII]1909Å and OIII]1663Å emission line doublets to derive the C/O ratios in star-forming galaxies (Garnett et al. 1995; Erb et al. 2010; Berg et al. 2016, 2019). Since we do not detect the OIII]1663Å doublet, we used the dust-corrected CIII] and optical [OIII] doublets to derive the C/O ratios. Following the equation in Izotov & Thuan (1999):
| (1) |
where and
| (2) |
The correction factor ICF(C/O) was derived from the CLOUDY photoionization models for log = -2 and -3. The measured C/O ratios are presented in Table 4, and the range of observed values are consistent with the C/O ratio = 0.20 assumed in the JR16 models. We also used the CIII] fluxes along with the OIII]1663Å upper limits from the /STIS spectra to compute the lower limits on the observed C/O using the equations from Erb et al. (2010). Taking advantage of the tight correlation between OIII]1663Å and [OIII]4363Å emission (JR16), we also used the observed [OIII]4363Å fluxes to get the predicted OIII]1663Å fluxes from the photoionization models. The C/O ratio derived based on the predicted OIII] fluxes and observed CIII] are also presented in Table 4. The C/O ratio measured using the observed [OIII] and predicted OIII] fluxes are consistent, and range from log(C/O) -0.6 to -1.1, similar to the range of C/O ratios found in high redshift galaxies (Amorín et al. 2017; Stark et al. 2014; Erb et al. 2010) and in local BCDs (Berg et al. 2016).
3.5 ISM Conditions and CIII] Detectability
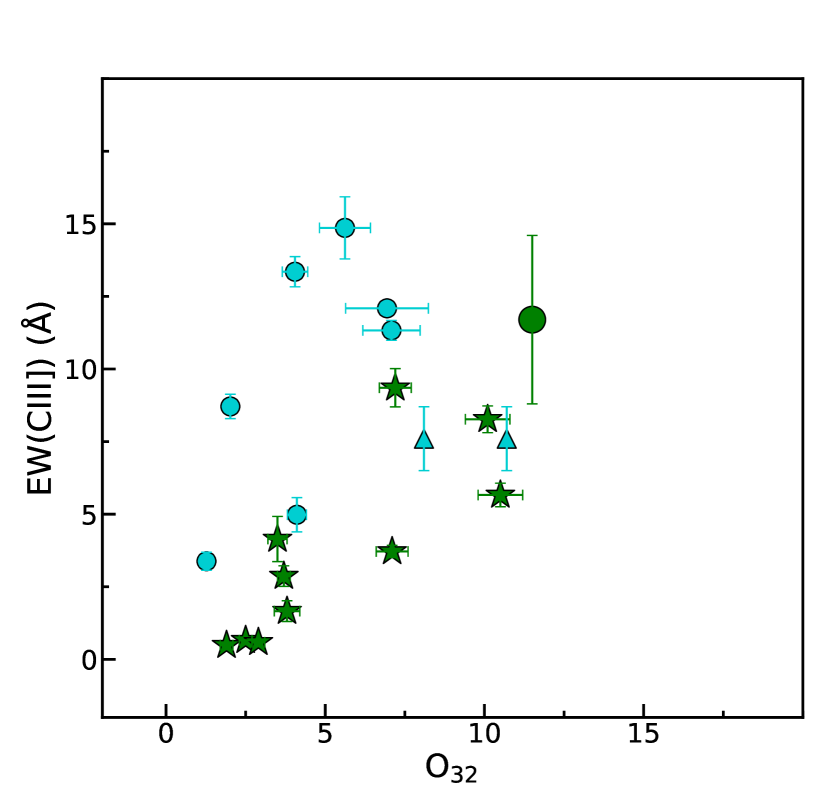
In this section, we examine how the ionization parameter, and optical depth of the ISM affect the detectability of CIII] emission. In Figure 6, we show the relation between EW(CIII]) and the O32 ratio. The [OIII] and [OII] lines originate from different ionization levels of oxygen, and hence the O32 ratio serves as a proxy for the ionization parameter. A high value for O32 indicates a high ionization parameter, and for star-forming galaxies this could imply that the nebular gas is powered by the ionizing radiation from massive stars of very young ages. Recent studies have suggested that O32 is a useful diagnostic of Lyman continuum leakage (Izotov et al. 2016a, 2018a; Jaskot & Oey 2013; Nakajima & Ouchi 2014). Star-forming galaxies at low redshifts () selected from the SDSS based on their high O32 5 are mostly found to be Ly emitters, with few exceptions (Jaskot et al. 2017; McKinney et al. 2019). In a sample of 11 GP galaxies with O32 5 targeted with /COS FUV spectroscopy to look for escaping ionizing radiation, all of them showed evidence for LyC leakage with escape fractions (fesc) in the range 2-72% (Izotov et al. 2016a,b; 2018a,b). In general, the fesc(LyC) is found to be higher for GPs with higher O32, although the relation between the two quantities shows considerable scatter (Izotov et al. 2016a, 2018a). High O32 has been proposed to be a diagnostic for density-bounded HII regions, which are potential LyC leaker candidates (Guseva et al. 2004; Jaskot & Oey 2013; Nakajima & Ouchi 2014; Izotov et al. 2018a). It is, therefore, interesting that EW(CIII]) also shows a positive trend with O32, and hence LyC leakers should be strong CIII]-emitters, because the high ionization parameter would favor CIII] emission. However, the observed strength of the CIII]-emission can be reduced due to other factors, such as the decrease in absorbed ionizing flux at low optical depth, the transition of C+2 to C+3 for log -2, and a low elemental carbon abundance. The EW(CIII]) versus O32 diagram shows a linear relation for the GPs when CIII] emission is detected, with CIII] strength increasing as the O32 ratio increases, and EW(CIII]) 3Å for O32 5. For similar O32 values, even the He II emitters that overlap with GPs in their metallicities have significantly higher EW(CIII]), which may be due to contributions from additional ionizing sources (such as, shocks or X-ray binaries).
| Name | O32 | 12+log(O/H) | log(C/O) | log(C/O)† | log(C/O)e | fesc(Ly) | Vsep(Ly) |
|---|---|---|---|---|---|---|---|
| (km/s) | |||||||
| J030321075923 | 7.10.5 | 7.91 | -1.247 (-1.002) | -1.014 (-0.769) | -1.105 (-0.859) | 0.05 | 460 |
| J081552215623 | 10.10.7 | 8.02 | -0.860 (-0.618) | -0.580 (-0.338) | -0.683 (-0.441) | 0.28 | 260 |
| J091113183108 | 1.90.2 | 8.15 | 0.17 | 370 | |||
| J105330523752 | 2.50.2 | 8.31 | 0.08 | 410 | |||
| J113303651341 | 3.80.4 | 8.03 | -0.994 (-0.751) | -1.329 (-1.087) | -0.742 (-0.499) | 0.31 | 330 |
| J113722352426 | 2.90.2 | 8.29 | 0.11 | 550 | |||
| J121903152608 | 10.50.7 | 7.88 | -1.134 (-0.888) | -0.882 (-0.636) | -0.994 (-0.748) | 0.58 | 270 |
| J124423021540 | 3.70.2 | 8.24 | -1.109 (-0.869) | -1.237 (-0.997) | -0.901 (-0.661) | 0.06 | 530 |
| J124834123402 | 3.50.3 | 8.22 | -0.665 (-0.423) | -1.041 (-0.799) | -0.442 (-0.199) | 0.42 | |
| J145735223201 | 7.20.5 | 8.05 | -0.950 (-0.707) | -0.592 (-0.349) | -0.756 (-0.513) | 0.01 | 750 |
Note. — The O32 and nebular oxygen abundances are based on the SDSS optical spectra. The log(C/O) is computed using the CIII]1909 line fluxes from /STIS and [OIII]5007 line fluxes from SDSS spectra. The log(C/O)† values are computed from the observed CIII]1909 line fluxes and upper limits for OIII]1663 line fluxes, using ICF from CLOUDY models for ionization parameter log = -2. The C/O abundances derived for the ICF corresponding to log = -3 are included in parentheses. The expected C/O abundances, log(C/O)e, are computed using the observed CIII]1909 fluxes and the OIII]1663 fluxes predicted based on the observed [OIII]4363 emission line in the SDSS spectrum. The fesc(Ly) are calculated from the /COS spectra as detailed in Jaskot et al. (2017), and velocity separation between the two peaks of the Ly emission line are from Jaskot & Oey (2014) and Henry et al. (2015).
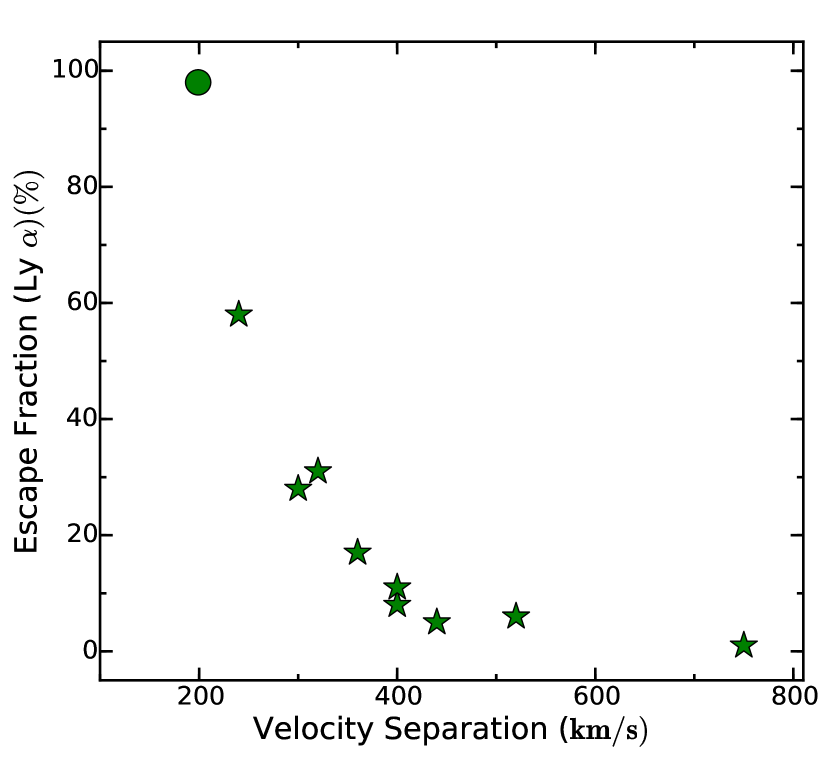
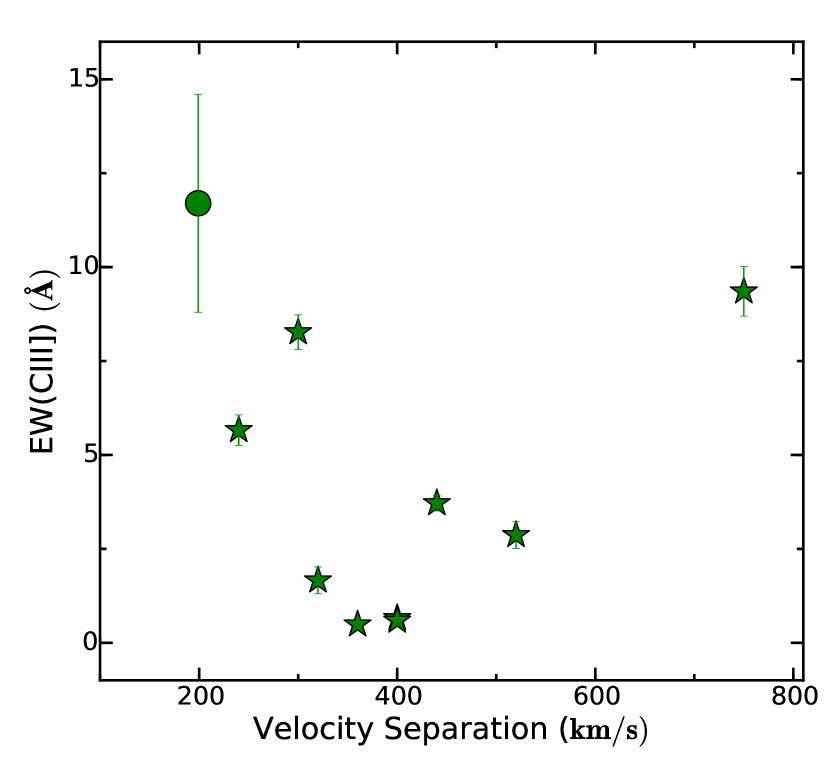
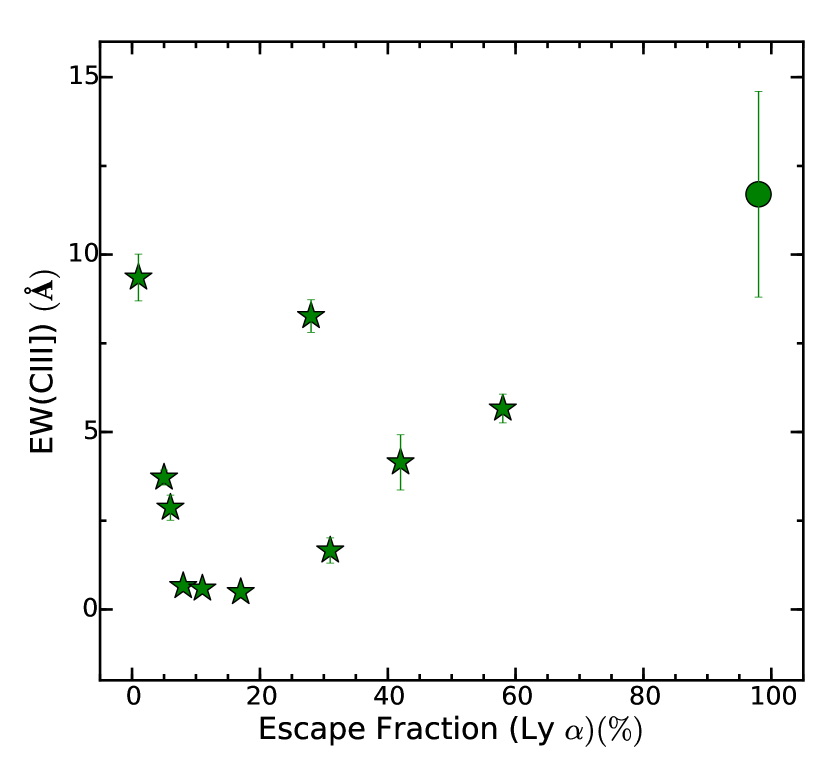
The velocity separation between the peaks of the double-peaked Ly emission profile shows a tight relation with the escape fraction of Ly and Lyman continuum emission (Izotov et al. 2018a; Verhamme et al. 2017; Verhamme et al. 2015; Henry et al 2015). According to the radiative transfer models from Verhamme et al. (2015), the velocity separation is strongly correlated with the neutral hydrogen column density. At low column densities, the Ly photons experience less scattering in the surrounding neutral medium, and are observed closer to the systemic velocity. The galaxies which have small separations ( 300 km s-1) have low column densities (NHI 1018 cm-2), while those with larger separations ( 600 km s-1) have higher column densities (NHI 1020 cm-2). We used the velocity separations of the Ly profile peaks measured from the /COS spectra for the GPs galaxies in our sample, to examine the ISM conditions that allow the detectability of the LyC escape. As shown in Figure 6, GPs with small velocity separations have higher escape fractions for Ly emission, and are also potential LyC leakers. Since the EW(CIII]) correlates with EW(Ly) for star-forming galaxies, we examine how the EW(CIII]) relates to velocity separation. There is no obvious correlation overall between EW(CIII]) and the peak velocity separation of Ly profile for the GP sample.
Among the sample of GPs in this work, J0815+2156 and J1219+1526 have small velocity separation and have high EW(CIII]). The narrow Ly profiles J0815+2156, and J1219+1526 indicate that the Ly radiation escapes more easily with less resonant scattering. Both of these GPs are suggested to be possible LyC leakage candidates by Jaskot & Oey (2014). Henry et al. (2015) also note that J1133+6513 and J1219+1526 are good candidates for LyC leakers based on the narrow velocity separations (see Table 3). J1219+1526 has a high Ly escape fraction (fesc = 58%), large EW(Ly) = 1749Å and EW(CIII]) = 5.70.48Å . J0815+2156 also has strong Ly emission (fesc = 28%), with EW(Ly) = 684Å and EW(CIII]) = 8.270.53Å . J1133+6513 has low equivalent widths, EW(Ly) = 352Å and EW(CIII]) = 1.670.44Å , even though the velocity separation of the Ly emission peaks is small (330 km s-1) and fesc = 31%. Henry et al. (2015) argue that the low EWs for Ly and H emission of this GP are consistent with higher LyC leakage, because the lack of any prominent IS absorption lines supports that the system is optically thin along the LOS. The small observed EW(CIII]) is also consistent with the high escape fraction of ionizing radiation in optically thin, density-bounded systems. However, the low C III] values can also be accommodated by models with high optical depth but older ages for the stellar population (JR16). J1133+6513 has a relatively high escape fraction, and the low EW(H) suggests a low intrinsic EW(Ly) before scattering, which may reflect an older age for the current starburst, or a continuous star formation history.
J0303-0759 and J1457+2232 have low EW(Ly) and the lowest Ly escape fractions (fesc 5% for Ly) among the GPs sample, but have high observed EW(CIII]). Their neutral column densities are likely high based on the large velocity separations, 460 km s-1 and 750 km s-1 for J0303-0759 and J1457+2232 respectively. While the velocity separation for GP0303-0759 is very similar to the range of velocities seen for the LyC leakers (Izotov et al. 2016a, 2018a), the escape fraction for Ly is low 5%, and it is likely that fesc(LyC) is also low. The high EWs of the optical emission lines ([OIII]4363, and H) along with the high O32 ratio suggest that the intrinsic EW(Ly) should be larger than observed for both of these GPs. Jaskot & Oey (2014) used the CII1334Å and SiII1260Å IS absorption lines to infer the optical depth and geometry of these systems. Both galaxies show strong IS absorption lines which confirm their high neutral column densities consistent with the observed weak Ly emission. Both J0303-0759 and J1457+2232 are good local analogs that emphasize the utility of the strong CIII]1909 emission in optically thick systems. J0815+2156, J1219+1526, and J1457+2232 have comparable O32 (indicating high log), low 12+log(O/H), large optical emission line EWs, and exhibit the highest EW(CIII]) among the GPs in our sample, while their Ly emission suggests low optical depths in J0815+2156 and J1219+1526, and a high optical depth in J1457+2232.
4 Comparing the CIII] Emission to Photoionization Model Predictions
In JR16, we used CLOUDY photoionization models (Ferland et al. 2013) to explore the CIII] EWs and line ratios as a function of starburst age, metallicity, and ionization parameter. The models also considered a range of C/O ratios, dust content, gas densities, nebular geometries and optical depths. One of the main conclusions was that only the Binary Population and Spectral Synthesis (BPASS; Eldridge & Stanway 2009; Eldridge et al. 2017) models that incorporate the effects of binary star interactions are able to reproduce the highest CIII] EWs ( 15-20Å ) found in high redshift galaxies, and sustain high EW(CIII]) values ( 5Å ) over longer timescales beyond 3 Myrs. The GPs offer a valuable test for the predictions from the photoionization models because the optical SDSS spectra are available for all galaxies in the sample and include many diagnostic optical emission lines that offer strong constraints on the metallicity, and ionization parameter. This allows to explore the CIII] EWs as a function of age, for the metallicities and ionization parameters determined from the optical emission lines.
4.1 Dependence on Metallicity and Ionization Parameter
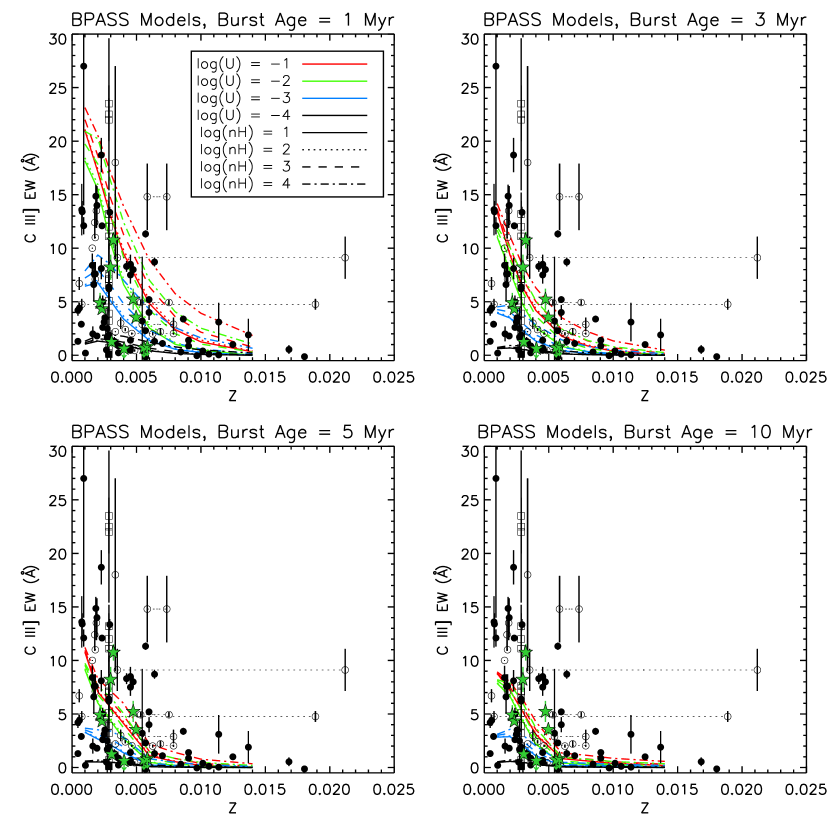
In Figure 7, we show the predicted EW(CIII]) as a function of metallicity for the instantaneous burst models with different burst ages (Figure 15 from JR16) along with the measured EWs for the GPs. The EW(CIII]) measurements from the literature for high- (Stark et al. 2014, de Barros et al. 2016, Vanzella et al. 2016, Erb et al 2010, Maseda et al. 2017, Le Fèvre et al. 2019), and low- galaxies (Rigby et al. 2015, Senchyna et al. 2017, Berg et al. 2016) are also shown. The BPASS models are able to fully reproduce the range of CIII] EWs observed for GPs, and for high CIII] EWs 5Å , the models require very young burst ages ( 3 Myrs) and high ionization parameters (logU -2) even at low metallicities. The older burst ages are not able to reproduce the high CIII] EWs 5Å even for high ionization parameter values (log -1) at the observed metallicities of the GPs. The BPASS models with the youngest ages 1-3 Myr are also required to accommodate the high EW(CIII]) values observed for the He II emitters and BCDs with lower metallicities ( 1/3 Z⊙), and for most of the CIII]-emitters at . The lower EW(CIII]) values can be accommodated by the models with log -2. Although the GPs in our sample only span a narrow range of metallicities, it is evident that their observed EWs follow the expected trend of EW(CIII]) with metallicity from the CLOUDY models. In addition to metallicity and ionization parameter, the C/O ratio also affects the observed EW(CIII]). The models presented in Figure 7 assume a fixed C/O = 0.2 which is consistent with the C/O values inferred for our GP sample (Section 3.4).
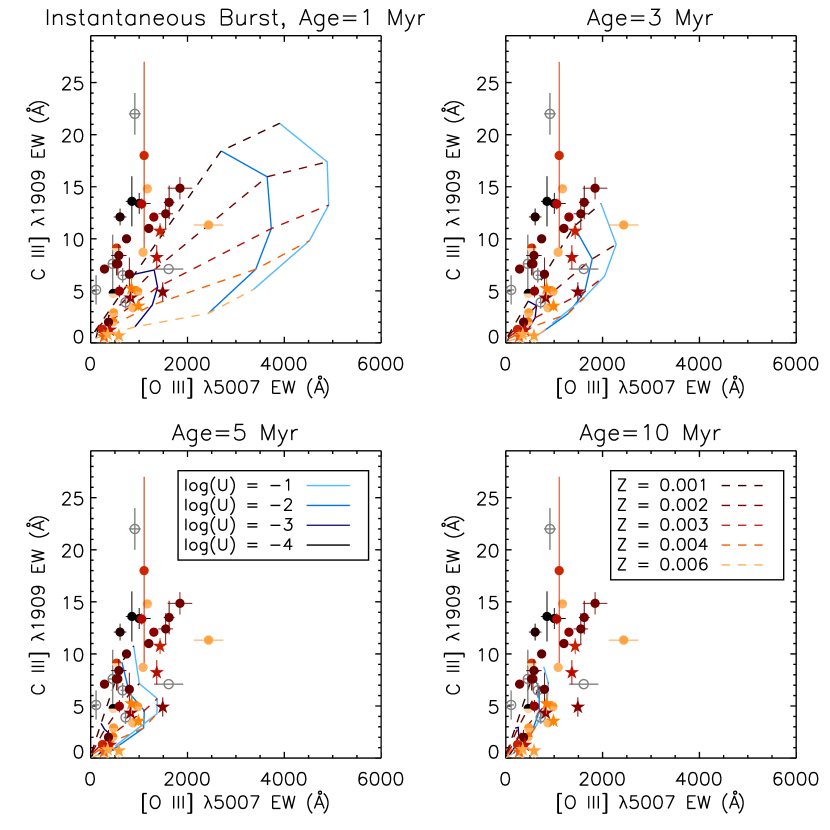
In Figure 8, the observed EWs of the collisionally-excited emission lines, CIII]1909Å and [OIII]5007Å presented in Figure 5 are compared to the predictions from the photoionization models (Figure 8 of JR16). Among the galaxies for which the EWs have been measured, the galaxies from Maseda et al. (2017) have metallicities that overlap with the GPs, and have comparable EW(CIII]) and EW([OIII]). The one exception is the galaxy UDF10-164 from Maseda et al. (2017), with high CIII] EW = 14.803.10Å , but lower [OIII] EW = 1170292Å compared to the predicted value 2000Å expected from the models for its metallicity (Z 0.004). In Figure 8, this galaxy lies along with the galaxies that have much lower metallicities (Z 0.003).
The observed EWs for low and high redshift non-GP galaxies are clearly offset from the photoionization model grids in the EW(CIII]) versus EW([OIII]) diagram. As noted in JR16, the EW([OIII]) is the likely source of the discrepancy, because the models do not include the redder continuum emission from an older population. So, the predicted [OIII] EWs is higher than what is observed, while the EW(CIII]) remains almost unaffected. However, this effect alone may not account for all the offsets seen for the measured EWs, in particular, for the galaxies that have higher EW(CIII]) than predicted by the models, and are only accommodated by models with the youngest ages ( 1-2 Myr) and highest ionization parameters. The He II emitters from Senchyna et al. (2017) have metallicities similar to the GPs, but possibly have additional source of nebular heating, such as, shocks or WR stars that can explain their higher EW(CIII]). The dwarf galaxies from Berg et al. (2016) have very low nebular oxygen abundances, with 12+log(O/H) 8.0, ranging from 1/5 Z⊙ to 1/20 Z⊙, which are lower than the average metallicities of the GPs sample in this study. In Figure 5 and 8, these dwarf galaxies have consistently higher EW(CIII]) and low EW([OIII]) than the models. On the SDSS images the dwarf galaxies show bright star-forming regions and diffuse continuum from the underlying galaxy, which may partly explain the observed EW([OIII]) being lower than the model predictions compared to the GPs. In addition, the dwarf galaxies show a range in C/O ratios ranging from 0.15 to 0.50 while the photoionization models use C/O=0.20. The low-metallicity GP, J1154+2443, shows a similar offset as the blue compact dwarf galaxies, which suggests that the physical conditions in the ionized gas may be different from the input model parameters. Berg et al. (2016) infer electron temperatures that are higher ( 15,200 - 19,600 K) for the BCDs, compared to the GPs ( 14100 - 15500 K; Jaskot & Oey 2013). For three of the dwarf galaxies, the ionization parameters derived from the UV spectra are log U consistent with the high ionization parameters required by the models to reproduce the higher EW(CIII]). The comparisons with model predictions in Figure 7 and 8 show that the observed range and trends of EW(CIII]) for GPs can be explained by a combination of stellar ages, metallicities, and ionization parameters. While older ages ( 3 Myrs) fail to reproduce the highest observed EWs, the younger ages can produce the observed range of EW(CIII]), with the highest EWs occuring for low and for high .
4.2 Dependence on Optical Depth
The high LyC escape fractions observed for GPs may indicate that these galaxies are density-bounded systems (Guseva et al. 2004; Jaskot & Oey 2013; Nakajima & Ouchi 2014; Izotov et al. 2018a). Galaxies with highly concentrated star formation as in the compact GPs, have high surface density of star formation, and the feedback from such systems can be very effective in clearing out pathways that allow the escape of LyC and Ly (Heckman et al. 2011; Verhamme et al. 2017). The high LyC escape fractions also have implications for the observed emission line ratios. The density-bounded nebulae are optically thin, and compared to the radiation-bounded nebulae, they have lower column densities of surrounding gas in the outer layers where the low ionization lines originate (Pellegrini et al. 2012; Jaskot & Oey 2013; Zackrisson et al. 2013). In JR16, we found that predicted CIII] EWs from the photoionization models are lower for density-bounded nebulae, and suggested that the CIII] could be a possible diagnostic for optical depth. The transition from radiation-bounded to density-bounded nebulae is equivalent to truncating the nebular gas at different outer radii within the Stromgren sphere. To characterize the effect of varying optical depth in the models, we followed Stasinska et al. (2015) and used the parameter which is the ratio of the total H produced inside the nebular radius to the total integrated H in a radiation-bounded Stromgren sphere. In this parametrization, =1 for optically thick radiation-bounded nebulae, and 1 for optically thin density-bounded nebulae. The photoionization models show that the CIII] flux declines with decreasing , and the effect is strongest for the models with the highest ionization parameters. For high values of , the CIII] originates at larger radii because the higher ionization CIV emission dominates in the inner regions of the nebulae closer to the ionizing source.
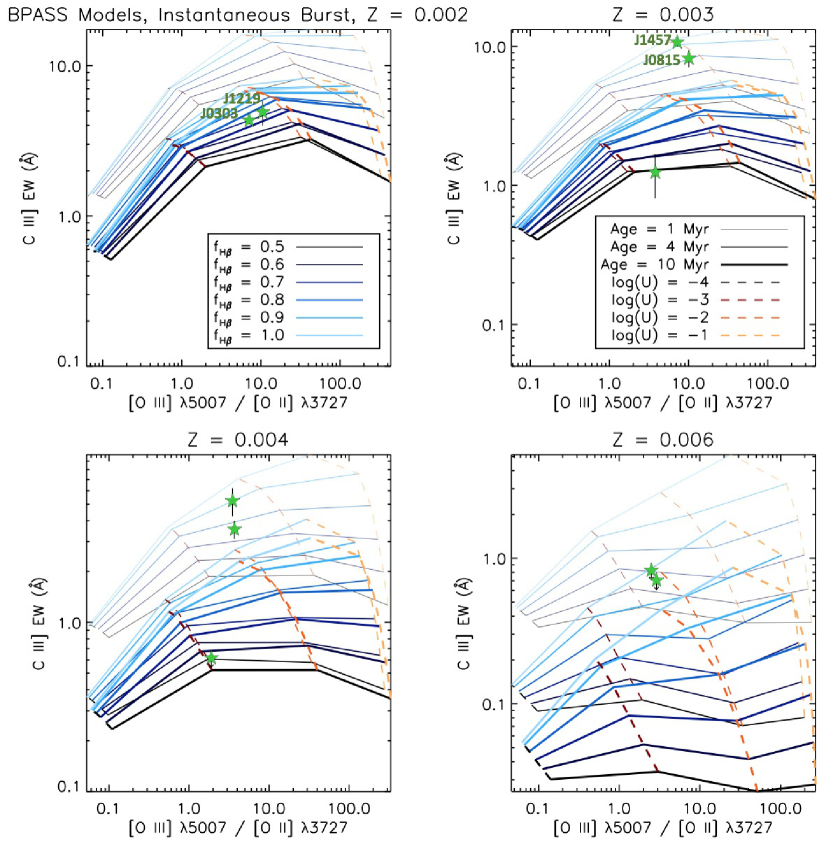
In Figure 9, the model grids for CIII] EWs versus O32 are shown as a function of age, ionization parameter, and optical depth for four different metallicities. At a given metallicity, the O32 ratio depends on the ionization parameters, but there is a weak dependence on optical depth. The CIII] EW also depends on both the ionization parameter , and the optical depth at a given metallicity. Since the O32 ratio serves as a proxy for , the JR16 models predict that galaxies with low EW(CIII]) for a given O32 tend to be optically thin with high escape fractions for LyC. Both age and metallicity also affect the scaling of CIII] EWs with optical depth. In each panel, we show the location of the GPs on the diagnostic grids corresponding to the metallicities derived from the optical spectra. The model grids in Figure 9 are based on an instantaneous burst scenario and assume a C/O ratio = 0.2.
J0815+2156 and J1219+1526 are GPs with similar O32 ratios 10 and are likely optically thin based on the velocity separation measured for the Ly profiles. Both galaxies also have high CIII] EWs, as expected given their high ionization parameters and low metallicites. These GPs, similar to J1154+2443 from Schaerer et al. (2018), are high EW(CIII]) galaxies which have high fesc(Ly) 25% and are expected to be optically thin to the LyC. The strong CIII] emission in all these GPs is primarily driven by the very young ages, low metallicity, and high ionization parameter which may be a common property among the LyC leakers, and the effect of optical depth () may be relatively small. Some of the LyC leaker candidates have such high CIII] EWs that can only be reproduced with starburst ages of only 1-2 Myrs, suggesting that the LyC leakers are very young, or have harder ionizing spectra than the non-leakers.
J0303-0759 and J1457+2232 also have low metallicities and comparable high O32 values 7.2, but their Ly profiles suggest they are optically thick with fesc(Ly) 0. Both J0303-0759 and J1457+2232 have high EW(CIII]) 3Å . Interestingly, the CIII] EWs of J0815+2156 and J1219+1526 are slightly lower than the optically thick galaxy J1457+2232, in spite of their high O32 values. It is plausible that there is a slight suppression of the CIII] EW due to the lower optical depth to LyC in J0815+2156 and J1219+1526, although the dominant factors that influence the CIII] strength appears to be the age and ionization parameter. J0303-0759, on the other hand has lower EW(CIII]) than the other three GPs, although it has low metallicity ( ) and high O32=7.1. The EWs of the optical nebular lines [OIII]5007Å and H are also relatively lower for this galaxy, which suggests a lower intrinsic ionizing flux and possibly an older burst age for the stellar population. For the remaining GPs in our sample, with low CIII] EW and low O32 5, the combined effects of an older average starburst age and higher metallicities influence the EW(CIII]), and do not offer sufficient constraints on the optical depth. Since EW(CIII]) depends on various factors, the model grids presented in Figure 9 only serves as a diagnostic for the effect of optical depth for CIII]-emitters with comparable ages, ionization parameters, and metallicities. The analysis of a larger sample is required to isolate the influence of LyC escape on the strength of the CIII] emission.
5 Discussion
5.1 Interpreting CIII] emission in low-metallicity, star-forming galaxies
The semi-forbidden CIII] nebular line is one of the most prominent emission features in the rest-UV spectra of low-metallicity, star-forming galaxies. CIII] emission appears to be ubiquitous in low-metallicity galaxies selected by various criteria, including the Lyman-break galaxies (Shapley et al. 2003, Steidel et al. 2016), Lyman-alpha emitters at (Vanzella et al. 2016, de Barros et al. 2016, Erb et al. 2010), gravitationally-lensed low-mass galaxies at z6 (Stark et al. 2017, Stark et al. 2015a), and UV luminosity-selected star forming galaxies at (Maseda et al. 2017, Le Fèvre et al. 2019). As discussed in the previous sections, the interpretation of the CIII] emission depends on various parameters, including metallicity, shape of the ionizing spectrum, starburst age, LyC optical depth, and dust extinction. The high fraction of CIII]-emitters among the local GPs (8/11 including J1154+2443) and the IRAC color-selected galaxies at high redshifts, shows that low-metallicity galaxies that are selected by their strong [OIII] emission line are likely to also show CIII] emission. The higher effective temperatures of low-metallicity ionized nebulae favor the collisionally-excited [OIII] and CIII] emission lines. In the presence of hard ionizing radiation with high ionization parameters (log -2) powered by very young ( 1 Myr) metal-poor massive stars (Figure 7), or a weak AGN (Le Fèvre et al. 2019), the CIII] emission can be very strong with EW(CIII]) 20Å . In the inner regions of such highly ionized nebulae, CIII] emission can be lowered by the transition to triply ionized carbon resulting in CIV emission. At metallicities , the CIV emission line has been observed in local star-forming dwarf galaxies (Senchyna et al. 2017; Berg et al. 2016). Strong CIV emission frequently detected in galaxies suggests that such hard ionizing SEDs may be common for star-forming galaxies in the reionization epoch (Stark et al. 2015b; Schmidt et al. 2017; Mainali et al. 2017).
The burst ages and star formation history can affect the observed emission line EWs. As shown in JR16, for an instantaneous burst, the high CIII] EWs 5Å at young ages 3 Myrs are primarily driven by the ionization parameter and metallicity. The same is true for EW(CIII]) 10Å and a continuous star formation history. In both star formation scenarios, for a given metallicity and ionization parameter the EW(CIII]) declines quickly with age initially due to the decrease in the production rate of high energy photons. However, in the case of continuous star formation an equilibrium is reached between the birth and death of massive stars beyond 20 Myrs, such that the CIII] nebular emission remains approximately constant with age and only the increasing non-ionizing UV continuum at 1909Å from the stellar population lowers the EW(CIII]). The EWs of the optical lines are lowered by the continuum from the current star formation, in addition to the contribution to the optical continuum from the underlying older stellar population. Therefore, when comparing the CIII] EWs against EW([OIII]) or EW(H), the contribution to the continuum from the older stellar component has to be considered, although the photoionization models used here do not include multiple stellar populations (Figures 5, 8). For the CIII]-emitters at , Stark et al. (2014) propose photoionization models with two-component stellar population, one young ( 3 Myrs) and an older stellar population to provide a better fit to their SEDs. Multi-component star formation histories with a recent burst ( 10 Myr) that powers the nebular emission and an older few 100 Myr stellar population that contributes to the UV-optical continuum have been proposed to consistently explain the observed UV spectra and IRAC (rest-optical) colors of galaxies (Stark et al. 2015a). The GPs and EELGs at lower redshifts also show evidence for multiple stellar populations. Amorín et al. (2012) find that the star formation history of GPs indicates the presence of an evolved stellar component with age between 108 yr and several Gyrs. For example, in the case of J1133+6513 with EW(CIII])=1.67Å and EW([OIII]) = 394Å , which is in common with our sample, they note that the presence of the broad Mg I 5167, 5173 absorption feature confirms the presence of old stars. The high EWs of the nebular lines, however, are powered by the ionizing continuum from the young stellar component, which may only be 20% of the total mass. The high SFR ( 4 - 60 M⊙/yr) and short mass doubling time of 1 Gyr, imply that the GPs are currently experiencing a powerful starburst phase which dominates their UV-optical continuum. Izotov et al. (2011) find that the GPs and similar luminous compact star-forming galaxies have Myoung/Mtotal 0.03 - 0.05 on average, for a galaxy with total stellar mass of Mtotal = 109 M⊙. Although there is a higher fraction of young stars in the lower mass galaxies, the range in the fraction of young stars for a given galaxy mass can be large based on their star formation histories. Among the GPs in this work, four of the galaxies (J0303-0759, J0815+2156, J1219+1526, and J1457+2232) have O32 5, low metallicity , and their large optical emission line EWs are consistent with a very young starburst ( 3Myrs). The lower CIII] and optical line EWs of the other GPs may result from older burst ages, lower ionization parameters, or high metallicities, and the effect of each individual parameter cannot be entirely disentangled using the present data.
The same physical conditions that produce strong intrinsic LyC and Ly emission also favor strong C III] emission at low metallicities. However, while LyC and Ly are absorbed or scattered by neutral gas, C III] can escape unimpeded. C III] is therefore a potentially useful probe for systems where LyC and Ly are suppressed due to a surrounding neutral ISM or IGM. For instance, J1457+2232 and J0303-0759 in our GP sample are optically thick with low escape fractions for Ly and possibly to LyC and have high EW(CIII]). Many GPs have lower optical depths, allowing the escape of the ioninzing continuum, and the LyC leakage can lower the observed EW(CIII]). At fixed age, metallicity, and ionization parameter, a lower EW (C III]) can be interpreted as arising from a star-forming region that is optically thin to the LyC. As discussed in section 4.2, the trends seen for the EW(CIII]) with optical depth for a subset of the current GPs sample appear to be consistent with this interpretation and should be revisited using a larger sample of CIII]-emitters.
The overall carbon abundances and dust content in the ionized nebular regions are also expected to influence the CIII] EWs. Since carbon acts as a coolant in ionized regions, the lower carbon abundance in the low metallicity galaxies results in higher nebular temperatures and increases the CIII] collisional excitation rates. As shown in JR16, the CIII] emission does not scale linearly with the C/O ratio, but the higher nebular temperatures at low C/O ratios can partially compensate for the lower carbon abundance and result in strong CIII] emission. The LyC emitting GP galaxy J1154+2443 with a high EW(CIII]) = 11.72.9Å , has low C/O 0.13 (Schaerer et al. 2018) compared to most GPs in our sample. The enhanced CIII] emission in this low-metallicity galaxy with 12+log(O/H) 7.6 is consistent with the JR16 models that predict strongest CIII] emission at because of the higher electron temperature even if there are fewer carbon atoms. The dust content in ionized nebulae also affects the emergent CIII] EWs, through its dependence on the dust extinction, and the role of photoelectric heating versus cooling via the forbidden lines. The photoelectric heating can enhance the CIII] emission, but as the dust content increases the extinction begins to be dominant and lowers the EW(CIII]). However, low-metallicity star-forming galaxies are relatively dust-poor systems. The GPs in our sample have very low nebular extinction, with E(B-V) = as inferred from the Balmer decrement.
5.2 Constraints on the ionizing sources and inputs to the Photoionization models
Although a large number of CIII] observations have become available in the recent years, the nature of the ionizing sources that provide the high ionization parameters to account for the CIII] emission strengths are not fully understood. The CIII] emission requires high energy photons ( 24.4 eV) which can be provided by young, massive stars in low metallicity SFGs, or by AGNs (Feltre et al 2016; Gutkin et al. 2016; Nakajima et al. 2018a). In the case of SFGs, the effects of binary stellar evolution have to be incorporated to successfully reproduce the high CIII] EWs measured in star-forming galaxies consistent with their ages (JR16, Nakajima et al. 2018a). The X-ray observations of GPs reported by Svoboda et al. (2019) show that some GPs have X-ray luminosities that are a factor of 6 higher than expected for star-forming galaxies, which may be attributed to a hidden AGN, Ultra-luminous X-ray sources, or a higher fraction of high-mass X-ray binaries. However, the optical emission line ratios of GPs are compatible with star-forming galaxies in the BPT diagram (Baldwin et al. 1981), and are inconsistent with an AGN contribution although some of extreme GPs can lie close to the maximum line for starburst (Jaskot & Oey, 2013). While the emission lines from GPs in our sample can be accommodated by models with ages 3 Myrs, and ionization parameter log -2, some of the strong CIII]-emitters in the literature require extremely young ages ( 1 Myr) and very high ionization parameters (log -1). The role of other exotic ionizing sources, such as very massive stars with masses 100 M⊙ (Smith et al. 2016), and contribution from low-luminosity AGNs ( Le Fèvre et al. 2019; Nakajima et al. 2018a) cannot be ruled out for the most extreme CIII] emitters.
The CIII] emission line in combination with other UV and optical emission lines forms an important diagnostic which helps to reveal the ionizing sources that are responsible for the nebular emission (Feltre et al. 2016; Byler et al. 2018). In addition to photoionization, the contribution of shocks can enhance the flux of CIII] emission, and low-ionization optical emission lines. Among the six GPs in Jaskot & Oey (2013), five of them showed HeII 4686 emission which may be produced by WR stars or shocks. The radiative shocks originating from SNe explosions can generate He II emission even without the WR stars, and are most efficient in dense, low-metallicity systems which are the characteristic of GPs (Guseva et al. 2000; Thuan & Izotov 2005). In order to understand the ionizing spectrum and optical depth effects, the contribution from shocks should be subtracted. Although GPs are young enough to host large numbers of ionizing O stars or WR stars, SNe and stellar winds from an ongoing or previous burst of star formation can reshape their ISM. In JR16, we showed that the presence of shock always contributes to an increase in the observed CIII] flux, and proposed a diagnostic involving CIII]/HeII versus C IV/ HeII to distinguish nebular emission from purely photoionized gas and shock-ionized gas. However, we only detect weak HeII 1640Å in the composite STIS spectrum from this study. Future spectroscopic observations of GPs with higher spectral resolution and high signal-to-noise to measure various shock diagnostics in the UV-optical wavelengths will be required to calibrate the shock diagnostics.
The UV spectra of GPs can constrain the input ISM parameters used in the photoionization models, such as C/O ratios and electron densities. The sample of 8 GPs with detectable CIII] emission (including J1154+2443 from Schaerer et al. 2018), show that the C/O ratios range from 0.08 to 0.35 and are similar to the other CIII]-emitters locally (Garnett et al. 1995; Berg et al. 2016, 2019; Senchyna et al. 2017), and at (Amorín et al. 2017; Stark et al. 2014, Erb et al. 2010, Shapley et al. 2003). The variation of CIII] emission over the same range of C/O ratios has been explored in JR16, and found to have a significant effect on the EW(CIII]). The electron densities, 100 cm-3, used in the photoionization models (JR16), are similar to that seen in typical HII regions. However, various measurements of electron densities from the [CIII]1906 + CIII]1908 doublet give values that are about two orders of magnitude higher than derived using optical diagnostics (e.g., [O II] or [S II] doublets) for galaxies at low and high redshifts (James et al. 2014, 2018; Bayliss et al. 2014; Berg et al. 2018). A possible reason for the different values is that the density-sensitive doublets in the optical are tracing the low density regions compared to the CIII] doublet which originates in higher density regions closer to the ionizing source (James et al. 2018; Berg et al. 2018). The existing /STIS observations of GPs do not resolve the CIII] doublet lines, and high resolution UV spectra of GPs would be required to constrain the electron densities used for the model predictions of CIII] emission.
5.3 CIII] Emission Diagnostics to Explore the Galaxies in the Reionization Epoch
One of the key goals of the James Webb Space Telescope (JWST) and upcoming large 20-m class ground-based telescopes is to reveal the physical properties of the galaxies responsible for the reionization of the Universe, and to quantify their contribution of ionizing photons. The relative contributions of star-forming galaxies and AGNs to the total ionizing budget for reionizing the Universe are still debated (Madau & Haardt 2015; Finkelstein 2016; Matsuoka et al. 2018; Hassan et al. 2018). The UV luminosity function from deep surveys suggest that star-forming galaxies are the primary agents for reionization (Finkelstein et al. 2016), but recent faint AGN surveys suggest that AGNs may have also contributed to the transition (Madau & Haardt 2015). The spectroscopic capabilities of the JWST instruments will play a critical role in identifying AGNs and starbursts in the reionization epoch. While the commonly employed optical nebular diagnostics of the BPT-diagram (Baldwin et al. 1981) will be redshifted to the mid-IR wavelengths at z 8, the bulk of the JWST spectroscopic data at NIR wavelengths obtained using NIRSpec and slitless spectroscopy with NIRISS and NIRCam will provide access to the rest-UV emission lines (eg; Lyman-, CIV, OIII], He II, and CIII]). For the gravitationally-lensed galaxies at , the NIRSpec IFU, NIRISS and NIRCam grism modes will provide spatially-resolved emission-line maps over physical scales of few tens to hundreds of parsecs.
The star-forming galaxies in the reionization epoch are compact, have high SSFRs and low-metallicities similar to the GPs and are likely to show strong CIII] and nebular UV emission lines. The young ages of the starbursts and low-metallicities of the ISM would favor high CIII] EWs (Figure 5, 8), making CIII] one of the most easily detected emission features in the NIR spectra of galaxies. Since the observability of Ly emission drops at due to the increased IGM absorption, the CIII] emission could be used as an alternate probe of the ionizing flux and SFR based on the empirical relation between CIII] and H emission lines (Figure 5). The CIII] emission line in combination with other nebular lines, such as, NV1240Å , CIV1548,1550Å , HeII1640Å , OIII]1661, 1666Å , and Si III]1883,1892Å , can be used to reveal the nature of the ionizing sources, and to derive the nebular abundances (Feltre et al. 2016; Gutkin et al. 2016, JR16; Nakajima et al. 2018a; Byler et al. 2018). The CIV/CIII] ratio that uses UV emission lines which originate from different ionization states of carbon can constrain the ionization parameter, similar to the O32 optical emission line ratio. The CIII] doublet lines and SiIII] doublet lines can both be used for deriving the electron densities (JR16, Gutkin et al. 2016; Byler et al. 2018), while the commonly used CIII]/OIII] can be used to determine the elemental carbon abundances (Berg et al. 2016, 2018; Garnett et al. 1995). Feltre et al. (2016) have shown using photoionization models that the AGNs and star-forming galaxies separate out well in the CIV/CIII] versus CIV/HeII, and CIII]/HeII versus CIV/HeII diagnostic diagrams. The HeII line serves as a key diagnostic for hard ionizing radiation with high energy photons ( 54.4 eV), since the enhanced HeII emission would lower the CIII]/HeII ratio. The models which include shock contribution can produce emission line ratios that overlaps with the AGNs in the CIII] /HeII versus CIV/HeII diagnostic diagram, but the pure photoionization models occupy an entirely different part of the diagram (JR16). As seen from the composite spectrum of CIII]-emitters among GPs, the HeII emission line can be strong (section 2.3) enough to be observable in the low-metallicity high redshift galaxies with JWST.
The semi-forbidden CIII] nebular emission doublet serves as an important diagnostic spectral line to infer the physical properties of reionizers. However, extensive calibration by applying the UV diagnostics to low-redshift galaxies is necessary for them to be used effectively to interpret sources in the reionization epoch. Currently, the number of galaxies in the low-metallicity regime with the required wavelength coverage to test the diagnostics based on rest-UV emission line ratios at is very sparse. Only in recent years have the rest-UV spectroscopic data become available for local analogs of the high- galaxies, which include GPs, BCDs, and EELGs at lower redshifts. In this work, we have explored the conditions that favor the CIII] emission and examined diagnostics involving the CIII] and optical emission lines for the GP galaxies. We have shown that the GPs with high O32 also have high EW(CIII]) because the high ionization parameters favor CIII] emission, but there is also a weak dependence on the optical depth to Lyman continuum (Figure 9). CIII] emission tends to be weaker for optically-thin density-bounded nebulae compared to radiation-bounded nebulae for similar values of the ionization parameter. If these trends are calibrated for a sample of confirmed LyC leaking GPs, the dependence of CIII] EW on the optical depths can be used to quantify the Lyman continuum escape from star-forming galaxies in the reionization epoch. Future work will require deep UV spectroscopy to detect the weaker UV spectral lines for a larger sample of GPs and other local analogs that extend these analyses to lower metallicities and a wide range of Ly emission profiles. Detailed calibrations of the rest-UV nebular diagnostics in combination with the commonly used optical emission line diagnostics is a crucial step to be able to characterize and interpret the spectroscopic observations of the sources of reionization obtained with JWST.
6 Summary
We have analyzed the HST/STIS NUV spectra for a sample of ten GP galaxies at redshifts 0.1, to explore the semi-forbidden CIII]1909Å nebular emission line in low metallicity star-forming galaxies with 7.812+log(O/H)8.4. We selected galaxies that have archival HST/COS FUV spectroscopic observations which includes the Ly emission. The UV spectra were used along with the optical spectra from SDSS to constrain the metallicity and ionization parameter, to examine the correlations between the UV and optical nebular lines, and to compare the CIII] emission properties with predictions from the photoionization models. We summarize the results below:
(1) CIII] emission is detected in 7/10 GP galaxies confirming that CIII] emission is almost ubiquitous in low-metallicity galaxies. The composite spectrum of the CIII]-emitters shows an emission feature at the location of HeII 1640. The composite spectrum of the CIII] non-emitters shows strong interstellar absorption lines, particularly CIV absorption with broad blue-shifted profile wing, likely from the presence of strong outflows.
(2) The observed CIII] EWs of GPs are in the range 2-10Å , consistent with the predictions from the photoionization models of JR16 which used constraints on model inputs (such as, metallicity and ionization parameter) from the optical SDSS spectra. The GPs have CIII] EWs that overlap with the range of values seen in star-forming galaxies, but do not reach the high EW(CIII]) values (15Å ) seen in some star-forming galaxies, local He II emitters and BCDs that have very low metallicities with 12+log(O/H) 7.5. At very low metallicities, the lack of metals that act as coolants can considerably enhance the CIII] emission even when the abundance of carbon atoms is low.
(3) Although the ensemble of star-forming galaxies appear to follow the empirical relation between EW(CIII]) and EW(Ly), the GPs do not seem to closely follow this relation. GPs are strong emission line galaxies by definition, and the observed trend in EW(CIII]) versus EW(Ly) diagram is primarily driven by the variation in the Ly optical depth. For non-GP galaxies, a weak Ly emission may indicate that the emission lines are intrinsically weak due to a weak ionizing spectrum. J1457+2232 has the strongest CIII] emission in our sample with EW(CIII]) = 9.350.76Å , but is offset from the EW(CIII]) versus EW(Ly) relation. This galaxy has a broad absorption in the Ly profile at the systemic velocity, and has profile peaks with large velocity separation, = 750 km/s indicating a high neutral gas column along the line of sight. At high redshift, EGS-zs8-1 at z=7.73 (Stark et al. 2017) is a galaxy in the reionization epoch with substantial neutral gas present at the Ly line center leading to a low EW(Ly) = 214Å , but has high EW(CIII]) = 222Å . Such examples highlight the utility of the CIII] emission as a key nebular diagnostic when Ly is attenuated by the ISM or IGM.
(4) CIII] emission does not show any obvious relation between velocity separation of the Ly profiles and escape fraction of the Ly. For a given flux of hard ionizing radiation powered by young massive stars of fixed low-metallicity, a narrow velocity separations for the Ly profile implies low neutral hydrogen column densities and high Ly escape fraction. In such optically thin systems, the intrinsic and observed EW(Ly) and EW(CIII]) will be high for a high ionizing flux. However, such systems are likely to have higher LyC leakage which may lower the observed EW(CIII]). In the case of optically thick systems the Ly profile has broad velocity separation and Ly emission may be weak with low EW(Ly) or even absent. The CIII] EW remains unaffected compared to the optically thin case.
(5) The CIII] emission in GPs correlates with the [OIII]5007Å , and H optical emission lines which are also powered by the ionization by massive stars with young ages The presence of strong CIII] and [OIII] emission confirms the presence of hard ionizing radiation required to produce the high-ionization nebular lines. The CIII] EW in GPs also correlates strongly with the O32 ratio, which is a proxy for the ionization parameter.
(6) The observed EW(CIII]) and EW([OIII]) values for the GP galaxies lie within the predictions from the model grids. However, most of the non-GP galaxies have higher EW(CIII]) for a given EW([OIII]). Unlike most of the GPs, and other EELGs which have very strong nebular lines with EW([OIII]) 800Å that dominate their spectrum, most of the star-forming galaxies selected using different criteria have a significant older stellar population that contributes to the continuum, which may explain the offset from the models. Other factors that can influence the CIII] and [OIII] EWs include the C/O ratios, nebular temperatures, and electron densities which are different compared to the GPs.
(7) We compared the properties of the CIII] emission for the GPs to the predictions from the JR16 photoionization models that use BPASS input SEDs and a grid of model parameters (eg; metallicities, ages, log, and optical depth). The observed range of EW(CIII]) are consistent with the model predictions, and require young stellar ages ( 3-5Myrs), high ionization parameters (log -2), and low-metallicities (Z 0.006).
(8) GPs are very likely to be LyC emitters, and the leakage of LyC radiation from the nebular region can reduce the CIII] emission. The JR16 models predict that for density-bounded regions with similar metallicities, ages, and O32 ratios, the EW(CIII]) will be lower when the optical depth to LyC is lower. At very young stellar ages ( 3 Myrs), high ionization parameters (log -2), and low metallicities (Z0.15Z⊙) the EW(CIII]) values are high ( 3Å ), mainly due to the high ionizing flux and high nebular temperatures, and the effect of optical depth is not the dominant factor. Four of the GPs in our sample with high O32 5 are found to have EW(CIII]) 3Å . J0815+2156 and J1219+1526 are two of the most promising candidates for LyC escape from our sample and much like the LyC leaking GP galaxy, J1154+2443 (Schaerer et al. 2018), they have high C III] EWs consistent with extremely young ages and high . These could be common properties of LyC-leaking GPs. Interestingly, J0815+2156 and J1219+1526 are candidate LyC emitters based on their Ly profiles and have lower EW(CIII]) than J1457+2232 which has lower O32 and comparable metallicity, but is likely optically thick to the LyC.
In this work, we have focused on the semi-forbidden CIII] and trends involving CIII] EWs and other UV-optical lines. Since CIII] is one of the strongest and predominant nebular emission lines that will be used to reveal the nature of ionizing sources at the reionization epoch, it is important to calibrate line ratios involving CIII] and other UV lines for a larger sample of galaxies with a broad range of nebular properties. Such calibrations based on low redshift samples where both the UV and the commonly-used optical diagnostics can be combined, will be crucial to interpret the spectra of galaxies that will be observed by JWST and future large telescopes.
References
- Amorín et al. (2012) Amorín, R., Pérez-Montero, E., Vilchez, J.M., Papaderos, P. 2012, ApJ, 749, 185
- Amorín et al. (2017) Amorín, R., Fontana, A., Pérez-Montero, E., Castellano, M., et al. 2017, Nature, 1, 52
- Asplund et al. (2009) Asplund, M., Grevesse, N., Sauval, A.J., & Scott, P. 2009, ARAA, 47, 481
- Baldwin et al. (1981) Baldwin, J.A., Phillips, M.M., & Terlevich, R. 1981, PASP, 93, 5
- Bayliss et al. (2014) Bayliss, M.B., Rigby, J.R., Sharon, K., Wuyts, E., Florian, M., Gladders, M. et al. 2014, ApJ, 790, 144
- Berg et al. (2016) Berg, D. A., Skillman, E. D., Henry, R.B.C., Erb, D.,K., Carigi, L. 2016, ApJ, 827, 126
- Berg et al. (2018) Berg, D. A., Erb, D. K., Auger, M.W., Pettini, M., Brammer, G. 2018, ApJ, 859, 164
- Berg et al. (2019) Berg, D. A., Erb, D. K., Henry, R.B.C., Skillman, E. D., McQuinn, K.B.W 2019, ApJ, 874, 93
- Byler et al. (2018) Byler, N., Dalcanton, J.J., Conroy, C., Johnson, B.D., Levesque, E.M., Berg, D. 2018, ApJ, 863, 14
- Cardamone et al. (2009) Cardamone, C., Schawinski, K., Sarzi, M., Bamford, S. P., Bennert, N., Urry, C.M., et al. 2009, MNRAS, 399, 1191
- Cardelli, Clayton, & Mathias (1989) Cardelli, J.A., Clayton, G.C., & Mathis, J.S. 1989, ApJ, 345, 245
- Chevallard et al. (2018) Chevallard, J., Charlot, S., Senchyna, P., Stark, D.P., Vidal-Garciá, A., Feltre, A. et al. 2018, MNRAS, 479, 3264
- de Barros et al. (2016) de Barros, S., Vanzella, E., Amoŕin, R., Castellano, M., Siana, B., et al. 2016, A&A, 585, 51
- Ding et al. (2017) Ding, J., Cai, Z., Fan, X., Stark, D.P., Bian, F., Jiang, L., McGreer, I.D., Robertson, B. E., Siana, B. 2017, ApJ, 838, 22
- Eldridge & Stanway (2009) Eldridge, J.J. & Stanway, E. 2009, MNRAS, 400, 1019
- Eldridge et al. (2017) Eldridge, J.J., Stanway, E.R., Xiao, L., McClelland, L.A.S., 2017, PASA, 34, 58
- Erb et al. (2010) Erb, D.K., Pettini, M., Shapley, A.E., Steidel, C.C, Law, D.R., Reddy, N.A. 2010, ApJ, 719, 1168
- Ferland et al. (2013) Ferland, G.J., Porter, R.L., van Hoof, P.A.M., Williams, R.J.R., Abel, N.P., 2013, RMxAA, 49, 137
- Feltre et al. (2016) Feltre, A., Charlot, S., & Gutkin, J. 2016, MNRAS, 456 3354
- Finkelstein (2016) Finkelstein, S.L. 2016, PASA, 33, 37
- Fitzpatrick (1999) Fitzpatrick, E.L. 1999, PASP, 111, 63
- Fosbury et al. (2003) Fosbury, R.A.E., Villar-Martín, M., Humphrey, A., Lombardi, M., Rosati, P. et al. 2003, ApJ, 596, 797
- Garnett et al. (1995) Garnett, D.R., Skillman, E.D., Dufour, R.J., Piembert, M., Torres-Piembert, S., et al. 1995, ApJ, 443, 64
- Guseva et al. (2000) Guseva, N.G., Izotov, Y. I., Thuan, T.X. 2000, ApJ, 531, 776
- Guseva et al. (2004) Guseva, N.G., Papaderos, P., Izotov, Y. I., Noeske, K. G., Fricke, K. J. 2004, A&A, 421.519
- Gutkin et al. (2016) Gutkin, J, Charlot, S., Bruzual, G 2016, MNRAS, 462, 1757
- Hassan et al. (2018) Hassan, S., Davé, R., Mitra, S., Finlator, K., et al. 2018, MNRAS, 473, 227
- Heckman et al. (2011) Heckman, T.M., Borthakur, S., Overzier, R., Kauffmann, G., Basu-Zych, A., et al. 2011, ApJ, 730, 5
- Henry et al. (2015) Henry, A., Scarlata, C., Martin, C. L., Erb, D. K. 2015, ApJ, 809, 19
- Hutchison et al. (2019) Hutchison, T.A., Papovich, C., Finkelstein, S. L., Dickinson, M.E., et al. 2019, ApJ, 879, 70
- Izotov & Thuan (1999) Izotov, Y. I., & Thuan, T.X. 1999, ApJ, 511, 639
- Izotov et al. (2011) Izotov, Y.I., Guseva, N. G., & Thuan, T. X., 2011, ApJ, 728, 161
- Izotov et al. (2016a) Izotov, Y. I., Schaerer, D., Thuan, T.X., Worseck. G., Guseva, N.G., Orlitová, I., Verhamme, A. 2016a, MNRAS, 461, 3683
- Izotov et al. (2016b) Izotov, Y. I., Orlitová, I., Schaerer, D., Thuan, T.X., Verhamme, A., Guseva, N.G., Worseck. G. 2016b, Nature, 529, 178
- Izotov et al. (2017) Izotov, Y. I., Schaerer, D., Guseva, N.G., Fricke, K.J., Henkel, C., Schaerer, D. 2017, MNRAS, 467, 4118
- Izotov et al. (2018a) Izotov, Y. I., Worseck, G., Schaerer, D., Guseva, N. G., Thuan, T. X., Fricke, K.J., Verhamme, A., Orlitová, I. 2018a, MNRAS, 478, 4851
- Izotov et al. (2018b) Izotov, Y. I., Schaerer, D., Worseck, G., Guseva, N. G., Thuan, T. X., Verhamme, A., Orlitová, I., Fricke, K.J. 2018b, MNRAS, 474, 4514
- James et al. (2014) James, B.L., Pettini, M., Christensen, L., Auger, M.W., Becker, G.D., et al. 2014, MNRAS, 440, 1794
- James et al. (2018) James, B.L., Auger, M., Pettini, M., Stark, D.P., Belokurov, V., Carniani, S. 2018, MNRAS, 476, 1726
- Jaskot & Oey (2013) Jaskot, A.E., & Oey, M.S. 2013, ApJ, 766, 91
- Jaskot & Oey (2014) Jaskot, A.E., & Oey, M.S. 2014, ApJ, 791, 19
- Jaskot & Ravindranath (2016) Jaskot, A.E., & Ravindranath, S. 2016, ApJ, 833, 136
- Jaskot et al. (2017) Jaskot, A.E., Oey, M.S., Scarlata, C., Dowd, T. 2017, ApJL, 851, 9
- Kennicutt (1998) Kennicutt, R.C., 1998, ARAA, 36, 189
- Kewley & Dopita (2002) Kewley, L.J. & Dopita, M. A. 2002, ApJS, 142, 35
- Konno et al. (2014) Konno, A., Ouchi, M., Ono, Y., Shimasaku, K., Shibuya, T., Furusawa, H., et al. 2014, ApJ, 797, 16
- Laporte et al. (2017) Laporte, N., Nakajima, K., Ellis, R.S., Zitrin, A., Stark, D.P., Mainali, R., Roberts-Borsani, G.W., 2017, ApJ, 851, 40
- Leitherer et al. (2011) Leitherer, C., Tremonti, C.A., Heckman, T.M., Calzetti, D. 2011, AJ, 141, 37
- Le Fèvre et al. (2019) Le Fèvre, O., Lemaux, B.C., Nakajima, K., Schaerer, D., Talia, M., Zamorani, G. et al. 2019, A&A, 625, 51
- Madau & Haardt (2015) Madau, P., & Haardt, F. 2015, ApJ, 813, 8
- Mainali et al. (2017) Mainali, R., Kollmeier, J.A., Stark, D.P., Simcoe, R.A., et al. 2017, ApJ, 836, 14
- Matsuoka et al. (2018) Matsuoka, Y., Strauss, M.A., Kashikawa, N., Onoue, M. et al. 2018, ApJ, 869, 150
- Mason et al. (2018) Mason, C. A., Treu, T., Dijkstra, M., Mesinger, A., Trent, M., et al. 2018, ApJ, 856, 2
- Maseda et al. (2014) Maseda, M.V., van der Wel, A., Rix, H.-W., da Cunha, E., Pacifici, C., et al. 2014, ApJ, 791, 17
- Maseda et al. (2017) Maseda, M.V., Brinchmann, J., Franx, M., Bacon, R., Bouwens, R.J., Schmidt, K. B., Boogard, L. A., et al. 2017, A&A, 608, 4
- McKinney et al. (2019) McKinney, J. H., Jaskot, A.E., Oey, M.S., Yun, M.S., Dowd, T., Lowenthal, J.D 2019, ApJ, 874, 52
- Nakajima & Ouchi (2014) Nakajima, K., & Ouchi, M. 2014, MNRAS, 442, 900
- Nakajima et al. (2016) Nakajima, K., Ellis, R. S., Iwata, I., Inoue, A.K., Kusakabe, H., et al. 2016, ApJ, 831, 9
- Nakajima et al. (2018a) Nakajima, K., Schaerer, D., Le Fèvre, O., Amoŕin, R., et al. 2018, A&A, 612, 94
- Nakajima et al. (2018b) Nakajima, K., Fletcher, T., Ellis, R. S., Robertson, B., Iwata, I. 2018, MNRAS, 477, 2098
- Pellegrini et al. (2012) Pellegrini, E.W., Oey, M.S., Winkler, P.F., Points, S.D., Smith, R.C., et al. 2012, ApJ, 755, 40
- Rigby et al. (2015) Rigby, J.R., Bayliss, M.B., Gladders, M.B., Sharon, K., et al. 2015, ApJ, 814, 6
- Roberts-Borsani et al. (2016) Roberts-Borsani, G.W., Bouwens, R. J., Oesch, P. A., Labbe, I., Smit, R. et al. 2016, ApJ, 823, 143
- Schaerer et al. (2018) Schaerer, D., Izotov, Y.I., Nakajima, K., Worseck, G., Chisholm, J., Verhamme, A. et al. 2018, A&A, 616, L14
- Schmidt et al. (2017) Schmidt, K.B., Huang, K.-H., Treu, T., Hoag, A., et al. 2017, ApJ, 839, 17
- Senchyna et al. (2017) Senchyna, P., Stark, D. P., Vidal-García, A., Chevallard, J., Charlot, S. 2017, MNRAS, 472, 2608
- Senchyna et al. (2019) Senchyna, P., Stark, D. P., Chevallard, J., Charlot, S., Vidal-García, A., 2019, MNRAS, 488, 3492
- Shapley et al. (2003) Shapley, A.E., Steidel, C.C., Pettini, M., & Adelberger, K.L. 2003, ApJ, 588, 65
- Shapley et al. (2015) Shapley, A.E., Reddy, N.A., Kriek, M., Freeman, W.R., Sanders, R.L., et al. 2015, ApJ, 801, 88
- Shirazi & Brinchmann (2012) Shirazi, M., & Brinchmann, J. 2012, MNRAS, 421, 1043
- Schlafly & Finkbeiner (2011) Schlafly, E.F., & Finkbeiner, D.P. 2011, ApJ, 737, 103
- Smit et al. (2014) Smit, R., Bouwens, R.J., Labbé, I., Zheng, W., Bradley, L., et al. 2014, ApJ, 784, 58
- Smit et al. (2015) Smit, R., Bouwens, R.J., Franx, M., Oesch, P.A., Ashby, M.L.N, et al. 2015, ApJ, 801, 122
- Smith et al. (2017) Smith, L., Crowther, P.A., Calzetti, D., & Sidoli, F. 2016, ApJ, 823, 38
- Stark et al. (2017) Stark, D.P., Ellis, R.S., Charlot, S., Chevallard, J., et al. 2017, MNRAS, 464, 469
- Stark (2016) Stark, D.P. 2016, ARAA, 54, 761
- Stark et al. (2015a) Stark, D.P., Richard, J., Charlot, S., Clément, B., Ellis.R., Siana, B., et al. 2015, MNRAS, 450, 1846
- Stark et al. (2015b) Stark, D.P., Walth, G., Charlot, S., Clément, B., Feltre, A., et al. 2015, MNRAS, 454, 1393
- Stark et al. (2014) Stark, D.P., Richard, J., Siana, B., Charlot, S., Freeman, W.R., Gutkin, J., et al. 2014, MNRAS, 445, 3200
- Stasinska et al. (2015) Stasinska, G., Izotov, Y., Morisset, C., & Guseva, N. 2015, A&A, 576, 83
- Steidel et al. (2014) Steidel, C.C., Rudie, G.C., Strom, A.L., Pettini, M., Reddy, N.A., et al. 2014, ApJ, 795, 165
- Steidel et al. (2016) Steidel, C.C., Strom, A.L., Pettini, M., Rudie, G. C., Reddy, N.A., Trainor, R.F. 2016, ApJ, 826, 159
- Svoboda et al. (2019) Svoboda, J., Douna, V., Orlitova, I., & Ehle, M. 2019, ApJ, 880, 144
- Thuan & Izotov (2005) Thuan, T.X., & Izotov, Y.I. 2005, ApJS, 161, 240
- Tilvi et al. (2014) Tilvi, V., Papovich, C., Finkelstein, S.L., Long, J., Song, M. et al. 2014, ApJ, 794, 5
- van der Wel et al. (2011) van der Wel, A., Straughn, A.N., Rix, H.-W., Finkelstein, S.L., Koekemoer, A.M., Weiner, B.J., et al. 2011, ApJ, 742, 111
- Vanzella et al. (2016) Vanzella, E., de Barros, S., Cupani, G., Karman, W., Gronke, M., Balestra, I. et al. 2016, ApJ, 821, 27
- Verhamme et al. (2015) Verhamme, A., Orlitová, I., Schaerer, D., Hayes, M. 2015, A&A, 578, 7
- Verhamme et al. (2017) Verhamme, A., Orlitová, I., Schaerer, D., Izotov, Y., Worseck, G., Thuan, T.X., Guseva, N. 2017, A&A, 597, 13
- Zackrisson et al. (2013) Zackrisson, E., Inoue, A. K., & Jenson, H. 2013, MNRAS, 777, 39