Computational Investigation of Copper Phosphides as Conversion Anodes for Lithium-Ion Batteries
Abstract
Using first principles structure searching with density-functional theory (DFT) we identify a novel phase of Cu2P and two low-lying metastable structures, an –Cu3P phase, and a –Cu3P11 phase. The computed pair distribution function of the novel –Cu3P11 phase shows its structural similarity to the experimentally identified –Cu2P7 phase. The relative stability of all Cu–P phases at finite temperatures is determined by calculating the Gibbs free energy using vibrational effects from phonon modes at 0 K. From this, a finite-temperature convex hull is created, on which –Cu2P is dynamically stable and the Cu3-xP () defect phase –Cu8P3 remains metastable (within 20 meV/atom of the convex hull) across a temperature range from 0 K to 600 K. Both CuP2 and Cu3P exhibit theoretical gravimetric capacities higher than contemporary graphite anodes for Li-ion batteries; the predicted Cu2P phase has a theoretical gravimetric capacity of 508 mAh/g as a Li-ion battery electrode, greater than both Cu3P (363 mAh/g) and graphite (372 mAh/g). Cu2P is also predicted to be both non-magnetic and metallic, which should promote efficient electron transfer in the anode. Cu2P’s favorable properties as a metallic, high-capacity material suggest its use as a future conversion anode for Li-ion batteries; with a volume expansion of 99 % during complete cycling, Cu2P anodes could be more durable than other conversion anodes in the Cu–P system with volume expansions greater than 150 %. The structures and figures presented in this paper, and the code used to generate them, can be interactively explored online using Binder.
1 Introduction
Graphite is the most commonly employed lithium-ion battery (LIB) anode, but is inherently limited by a maximum theoretical capacity of 372 mAh/g upon formation of LiC6. Phosphorus (black or red) has a significantly higher theoretical capacity of 2596 mAh/g due to the formation of Li3P; however it suffers from capacity deterioration, primarily caused by deleterious volume expansion that occurs upon charging, which constrains the capacity to 350–500 mAh/g in a limited voltage window 1. In addition, P and its lithiated phases have limited electrical conductivity, requiring dopants and additives to improve performance. By adding transition metals to P, through nanostructuring or synthesis, both electrical conductivity and stability during cycling can be enhanced 2.
Transition metal phosphides (TMP) provide a large design space in which to engineer such high-capacity, conversion anodes for LIBs 3. High-throughput computational screening has previously identified TMPs with high capacities for LIB electrodes including TiP, Co2P, Mn2P and others 4. As conversion anodes for LIBs, TMPs offer both added gravimetric capacity (ranging from 500 to 2000 mAh/g 4) and stability against volume expansion over several battery cycles 5. In addition to bulk or powdered TMPs being used as LIB conversion anodes 6, nanostructured TMPs can often display improved electrochemical cycling performance 7. Despite these efforts, TMPs have yet to be widely adopted as conversion anodes, given the large volume expansion (between 150 % to 300 % 4) exhibited by anodes with high P content, which limits their cyclability. Despite this drawback in volume expansion, TMPs show higher average voltages than graphite, which has an average voltage of 0.1 V. For example, CoP has an average voltage of 0.67 V, the ternary metal phosphide LiFeP has an average voltage of 0.4 V, and MnP has an average voltage of 0.62 V 4. Higher average voltages give the metal phosphides improved safety while sacrificing energy density, making them an ideal choice for large-scale and long-term energy storage.
Several previously studied TMP anodes include FePx=1,2,4 8, Fe2P nanoparticles 9, Ni2P 10, CuP2 11, 12, and Cu3P 13, 14, among others. Of the TMPs tested as conversion anodes, the copper phosphides (specifically CuP2 and Cu3P) have shown promise for their cyclability and capacity. The copper phosphides offer additional benefits to the other TMPs, as Cu is already used as a common current collector, providing further cycling capability and resistance to degradation 15. Cu3P prepared by high temperature synthesis had a first-cycle capacity of 527 mAh/g 13, and a porous Cu3P anode synthesized by facile chemical corrosion exhibited a capacity between 360–380 mAh/g over 70 cycles 16. The capacity of high temperature synthesized Cu3P exceeds that of graphite, and the cyclability of porous Cu3P is improved relative to other Cu3P anodes 13, 17. CuP2 on the other hand, delivers a higher initial capacity of 815 mAh/g, but can only be cycled stably 10 times before the capacity fades to 360 mAh/g12. The main factor in this degradation is the high concentration of P in the CuP2 which, while enabling high capacity, also contributes to the structural instability of CuP2 during cycling as the lithium-rich Li3P phase forms. To optimize the trade-off between stability and capacity, it would be beneficial to discover a compound with higher P content than Cu3P to offer higher capacity, and with a Cu content higher than CuP2 to aid in cyclability.
By performing crystal structure prediction, combining both ab initio random structure searching (AIRSS) and a genetic algorithm (GA), in addition to structural prototyping with known crystal structures of related chemistries 18, 19, 20, we produced the compositional phase diagram of the copper phosphide system. We describe this approach to structure prediction and the application of open source Python packages matador (v0.9) 21, for high-throughput first principles calculations, and ilustrado (v0.3) 22, for computational structure prediction with GAs. Crystal structure prediction for battery anodes is a well-tested method 23, used for identifying both novel anode materials 4, and unknown phases which form during battery cycling 24, 25. AIRSS has been used previously to search for additional phases of Li–P and Na–P which form during battery cycling 26. The GA was also employed to search for new phases of Na–P, which were confirmed experimentally through solid-state nuclear magnetic resonance (NMR) spectroscopy 27. As applied here to Cu–P, these methods predict a novel metallic –Cu2P phase at 0 K, within the target composition range of Cu1<x<3P, for a high-capacity, low volume expansion conversion anode; we compare its electronic structure to other TMPs to show a similarity to -Rh2P and -Ir2P. Two other phases, –Cu3P11 and –Cu3P are identified as metastable, both bearing structural similarity to known copper phosphides. We calculate the convex hull of Cu–P at temperatures up to 600 K, confirming the dynamic and chemical stability of Cu2P across this temperature range. A ground-state voltage profile from density-functional theory (DFT), shows that –Cu2P undergoes the same lithiation process as –Cu3P; however –Cu2P has a higher capacity of 508 mAh/g, with an average voltage of 0.86 V versus Li/Li+ (compared to 0.91 V for –Cu3P).
2 Methods
To search for novel copper phosphides, we first performed structural relaxations of the 13 structures from the Inorganic Crystal Structure Database (ICSD) 28 of CuxP (). The Python package matador 21 was used to query 1053 prototype binary structures from the Open Quantum Materials Database (OQMD) 19 with chemical compositions containing a pnictogen and a transition metal from the first two rows, namely {Ti, V, Cr, Mn, Fe, Co, Ni, Cu, Zn, Zr, Nb, Mo, Tc, Ru, Rh, Pd, Ag, Cd}–{P, As, Sb}; each composition was then transmuted to the corresponding stoichiometry of Cu–P, yielding 909 unique structures after geometry optimization. In order to extend this search beyond existing prototypes, two additional structure prediction steps were performed, namely AIRSS 29 and an evolutionary search with the GA implemented in the ilustrado22 package.
When performing AIRSS, one proceeds by generating random “sensible” (symmetry, density and atomic separation constrained) trial cells and then geometry optimizing them to their corresponding local minima. All relaxations can be performed concurrently, with no interdependence between calculations. New trial structures are generated until the ground state of each stoichiometry (within the constraints of the search) has been found multiple times.
We initially performed an exploratory AIRSS search consisting of around 5000 trial structures, with constraints on cell size, stoichiometry, and number of atoms in the cell. In this initial search, the total number of atoms in the cell was constrained to be 40, and the total number of formula units was randomized between 1 and 4, while still keeping the total number of atoms below 40. The number of atoms of Cu and P were randomized between 1 and 9 in each cell, and the cell volume () was constrained based on the total number of atoms in the cell () to be , based on the average densities of Cu–P phases within the ICSD.
Structures from the searching and enumeration procedures were then used, with fitness weighted according to their distance from the convex hull, as the initial configurations for a GA implemented in the Python package ilustrado 22. The ilustrado package uses a simple cut-and-splice crossover operation, supplemented by mutation operators (random noise, atomic permutations, vacancies and adatoms) 30. To avoid stagnation, each trial structure was filtered for similarity (via pair distribution function overlap) against existing structures in the population. Three independent GA runs were performed with 10 generations each, yielding a further 1049 relaxed structures. Finally, a directed AIRSS search of CuxPy where , was performed to create a final set of ~20,000 structures within the Cu–P chemical space. In all cases, to constrain the search to physically reasonable structures, a minimum atomic separation of 1.5 Å was enforced and the maximum number of atoms in the cell was constrained to 10 for the initial ~10,000 AIRSS searches and 40 atoms per cell for the final ~3,000 trials.
All calculations were performed using CASTEP (v18.1 and v19.1), the plane wave pseudopotential DFT package 31. To maximize computational efficiency, the initial calculations were performed with loose convergence criteria that ensured formation energies converged to 10 meV/atom. The Perdew-Burke-Ernzerhof (PBE) exchange-correlation functional was used 32 with Vanderbilt ultrasoft pseudopotentials 33 that required a plane wave kinetic energy cutoff of 300 eV to converge energies to within 10 meV/atom. The Brillouin zone (BZ) was sampled with a Monkhorst-Pack grid -point spacing finer than Å-1; the grid was frequently recomputed to accommodate any changes in cell shape and size during relaxation. Each structure was geometry optimized at this accuracy to a force tolerance of 0.05 eV/Å. The structures with a formation energy within 50 meV of the convex hull were then further optimized once more using CASTEP’s on-the-fly (OTF) “C18” library of ultrasoft pseudopotentials111OTF pseduopotential strings are Cu: 3—2.2—2.0—1.0—10—12—13—40:41:32(qc=6), P: 3—1.8—4—4—5—30:31:32, Li: 1—1.0—14—16—18—10U:20(qc=7) with a finer -point sampling of 2 Å-1 and plane wave kinetic energy cutoff of 500 eV, which yielded formation energies converged to within 2.5 meV/atom. In order to predict the voltage profiles with the same convergence criteria (formation energies within 2.5 meV/atom), the relaxation of known Li–P structures required a higher plane wave cutoff of 700 eV. Therefore, to compare ternary phases of Cu–Li–P in the voltage profile, all Cu–Li–P phases were re-optimized at a plane wave kinetic energy cutoff of 700 eV.
To identify stable structures from this search, a convex hull of the copper phosphides was created. The formation energy of each structure CuxPy was calculated using,
| (1) |
where Cu is the DFT total energy of the –Cu structure, and P is the energy of -P (black phosphorus). Black phosphorus was used as the P chemical potential instead of the lower energy polymorph red phosphorus; as has been previously discussed in Mayo et al. 26, black phosphorus is commonly used when making electrochemical cells 34.
Electrochemical voltage profiles for Li insertion into the stable Cu–P phases were calculated from the computed formation energies from ternary convex hull of Cu–Li–P. In order to calculate the voltage profiles shown in the section on Cu2P as a Li-ion battery conversion anode, the voltage, , between two tie-lines in the ternary convex hull with compositions LiCunP and LiCunP was calculated using,
| (2) |
as stated by Urban et al. 35. In equation 2, and are the ground state energies of two phases on along the reaction pathway of the ternary convex hull, in which and are the relative amounts of Li in the starting and ending products at each point in the pathway.
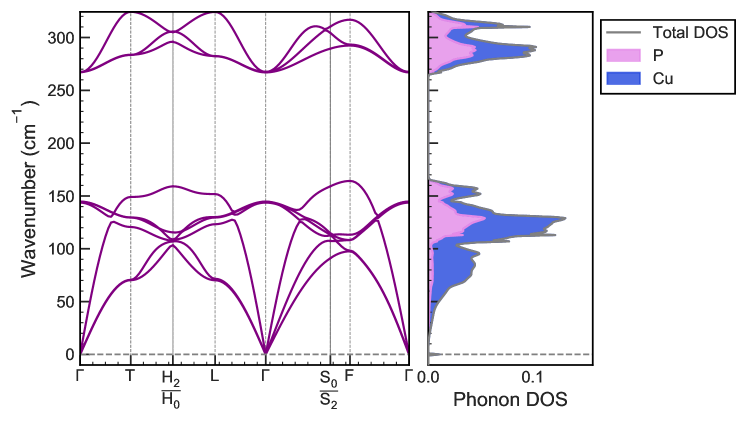
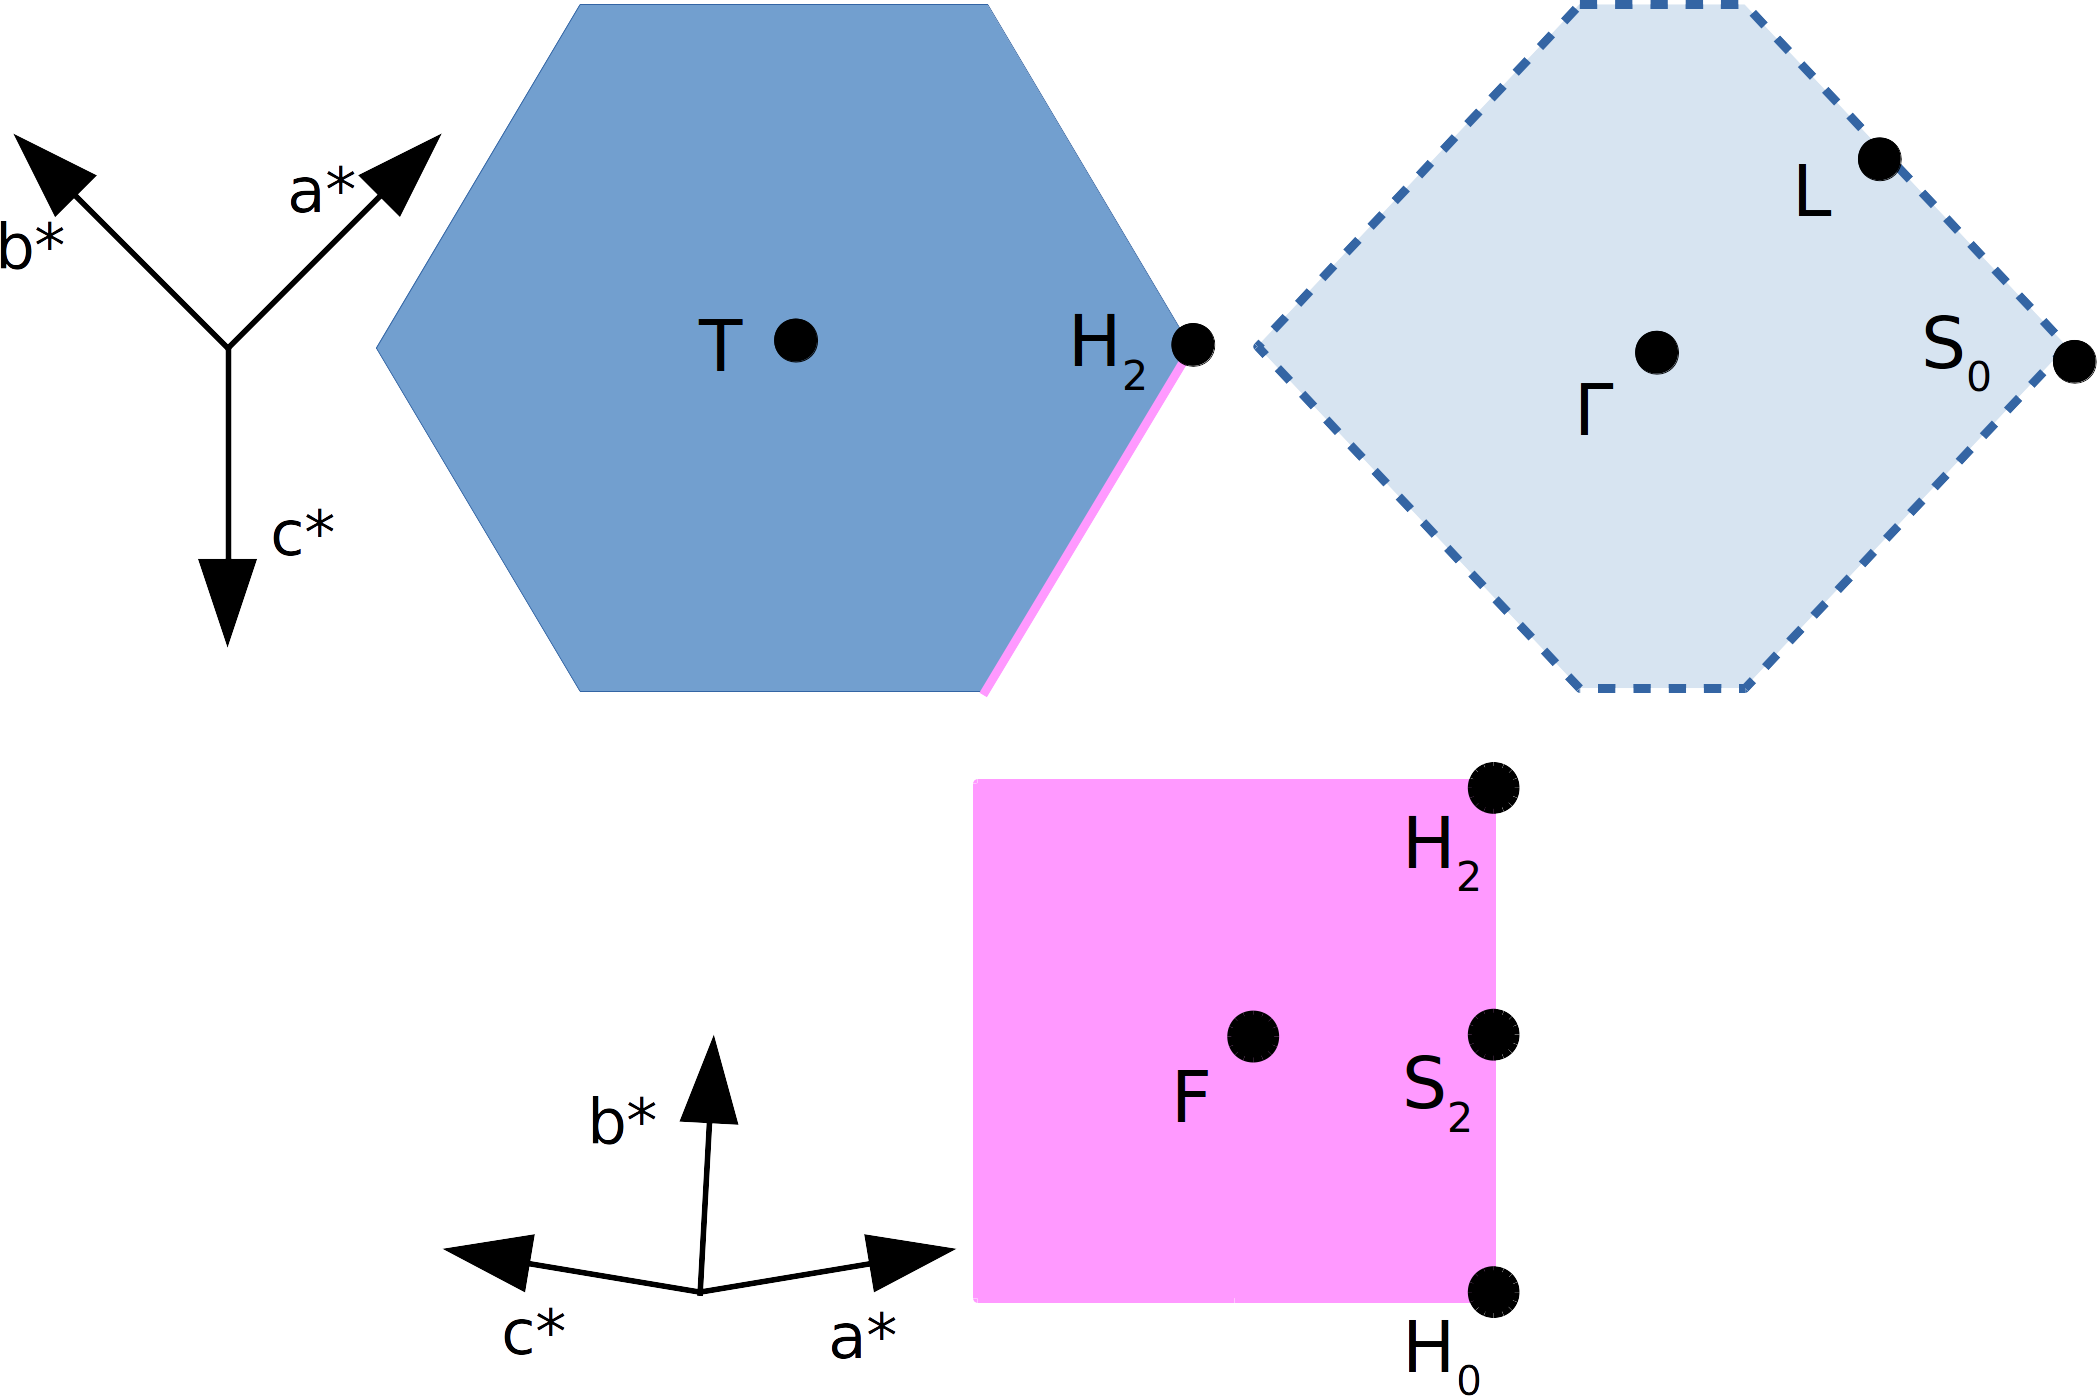
All phonon calculations were performed under the harmonic approximation with the PBE -functional in a supercell (corresponding to a phonon -point spacing of 2 0.046 Å-1 for -Cu2P) using the finite displacement method implemented in the CASTEP code. The dynamical matrix was then Fourier interpolated onto the BZ path provided by the SeeK-path Python package 36, 37 to compute the phonon dispersion, and onto a fine Monkhorst-Pack grid to compute the phonon density of states.
The band structure for Cu2P was calculated using the higher accuracy parameters and pseudopotentials mentioned previously, and the electronic density of states was integrated and projected onto atomic orbitals using the OptaDOS code 38, 39. Vibrational properties of all stable phases were computed using the finite displacement method, with an added many-body dispersion correction (MBD denoted MBD* in CASTEP v19.0) 40 to account for inter-layer interactions in black phosphorus.
The open source Python package matador (v0.9) 21 was used to run the CASTEP calculations, perform the analysis and create the plots found in this article. All of this analysis, as well as the underlying source code and data, can be explored interactively using Binder and found on Github harpaf13/data.copper-phosphides. The input and output files associated with our calculations have been deposited into the Cambridge Repository at https://doi.org/10.17863/CAM.52272.
3 Results
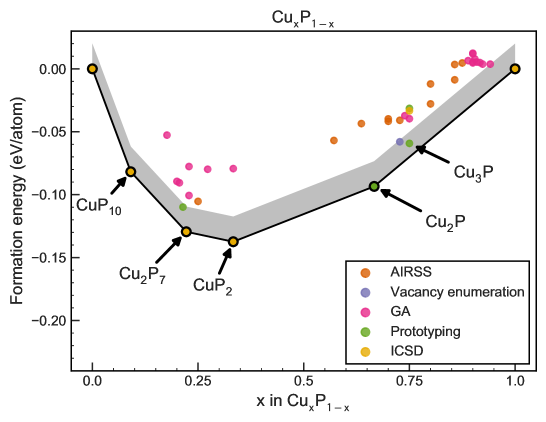
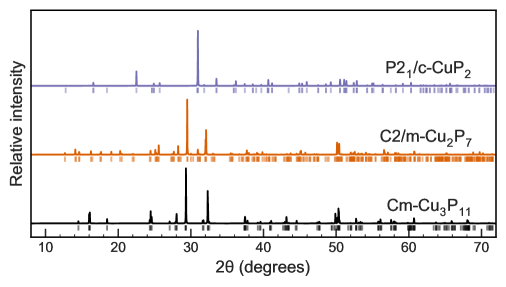
From the search of ~20,000 trial structures, there are 42 unique phases within 50 meV/atom of the convex hull. Previous computational structure searches have used a distance above the hull of 25 meV/atom 41, and given the accuracy of PBE 42, we chose to increase this cutoff to 50 meV/atom. Furthermore the experimentally verified –Cu3P structure43 is 37 meV/atom above the convex hull tie-line, further justifying this cut-off. Uniqueness was determined by computing pairwise overlap integrals of the pair distribution functions of phases at each stoichiometry using matador. The set of 42 unique phases contains four experimentally reported copper phosphides from the ICSD; –CuP10 synthesized by a mineralization reaction 44, –Cu2P7 45, –CuP2 45 and –Cu3P 46, 43 from high temperature sintering.
Oloffson’s experiments on single crystal –Cu3P synthesized at high temperature, and subsequent work by deTrizio et al. 47, show that Cu3P has several defects 43 with a range of stoichiometries between Cu2.6P and Cu2.8P. DFT studies of the Cu vacancies indicate that Cu3P is substoichiometric 47 and to search this substoichiometric space, unit cells of –Cu18P6 were enumerated with 1, 2, and 3 Cu vacancies, resulting in 76 Cu3-xP structures. The lowest energy defect was a –Cu8P3 (Cu2.67P) phase 26 meV/atom above the convex hull tie-line, denoted as Vacancy enumeration in Figure 1.
The convex hull of Cu–P, with points colored by the provenance of each structure, is presented in Figure 1; the experimentally identified phases, and a new –Cu2P phase, all lie on the convex hull tie-line and are each labeled with an arrow.
| 11footnotetext: Light gray indicates experimentally confirmed phases 11footnotetext: Dark gray indicates new phases with 20 meV/atom | ||||
| \rowcolorgray!20 Formula | On | Spacegroup | Provenance | |
| \rowcolorgray!20 | Tie-line | (meV/atom) | ||
| \rowcolorgray!20 Cu | - | ICSD 43493222Experimental lattice parameter for Cu from 48 | ||
| CuP | 31 | AIRSS | ||
| CuP | 28 | AIRSS | ||
| CuP | 44 | AIRSS | ||
| \rowcolorgray!50 CuP | 11 | Prototype 64715333Prototype structure is –Cu3As49 | ||
| CuP | 30 | GA | ||
| \rowcolorgray!20 CuP | 37 | ICSD 15056444Structure from single crystal diffractometry 43 | ||
| CuP | 39 | Prototype 23560555Prototype structure –Cr3P by single crystal X-ray diffraction50 | ||
| CuP | 40 | GA | ||
| CuP | 26 | AIRSS | ||
| CuP | 36 | AIRSS | ||
| CuP | 39 | AIRSS | ||
| CuP | 42 | AIRSS | ||
| CuP | 44 | AIRSS | ||
| \rowcolorgray!50 CuP | - | Prototype 38356666Prototype structure –Rh2P by X-ray diffraction51 | ||
| CuP | 49 | AIRSS | ||
| \rowcolorgray!20 CuP | - | ICSD 35282777Structure from X-ray diffraction 45 | ||
| CuP | 26 | AIRSS | ||
| CuP | 29 | GA | ||
| CuP | 43 | GA | ||
| \rowcolorgray!20 CuP | - | ICSD 35281888Structure from X-ray diffraction 45 | ||
| \rowcolorgray!50 CuP | 17 | Prototype 26563999Prototype structure –Ag3P11 by single crystal X-ray diffraction 52 | ||
| CuP | 33 | GA | ||
| CuP | 32 | GA | ||
| \rowcolorgray!20 CuP | - | ICSD 418805101010Structure from single crystal X-ray diffraction 44 | ||
| \rowcolorgray!20 P | - | ICSD 150873111111Black phosphorus structure from powder X-ray diffraction53 |
Details of the 24 structures which are both negative in formation energy relative to Cu and P, and are within 50 meV/atom of the convex hull are given in Table 1. Phases on the convex hull tie-line in Figure 1 are indicated with in Table 1 and phases which are experimentally confirmed are highlighted in light gray. Phases not reported previously, within 20 meV/atom of the convex hull tie-line, are highlighted in dark gray in Table 1. The provenance of each phase is given in the last column of Table 1. Phases from the ICSD are denoted with their ICSD Collection Code as “ICSD #” . Phases which were found by swapping the elements of a prototype ICSD structure are denoted by the ICSD structure of the prototype used as “Prototype #”.
Of the 24 binary structures in Table 1, 9 were discovered by AIRSS, 6 by the GA, 4 from structural prototyping, and 4 were previously known Cu–P structures from the ICSD. Of particular interest are three new phases, highlighted in dark gray in Table 1, –Cu2P, –Cu3P and –Cu3P11 which are all within 20 meV/atom of the convex hull and will be discussed further in the following sections.
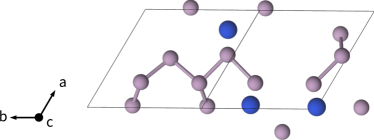
3.1 Phosphorus rich phase –Cu3P11
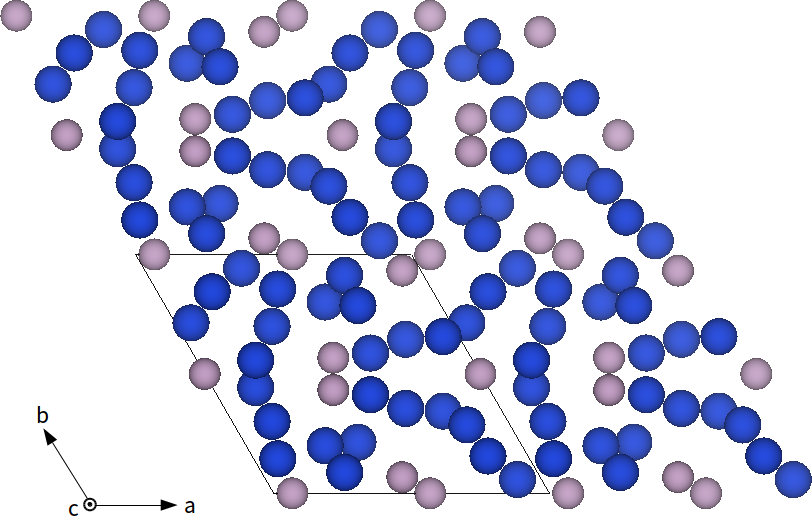
–Cu3P11 is a new structure which was found by relaxing the prototype Ag3P11 (ICSD 26563); it is 17 meV/atom from the hull tie-line, and has structural similarity to the ICSD structure –Cu2P7 (ICSD 35281)45 as shown in Figure 2. Both of these structures have repeating chains of P atoms, as seen in the supercells in Figure 2, in which alternating patterns of Cu or Cu–P are connected to a zig-zag chain of P atoms. All known phases in the P-rich (CuxP where ) region of the convex hull, namely –Cu2P7 (ICSD 35281) 45, –CuP2 (ICSD 35281) 45, and –CuP10 (ICSD 418805), 44 have long chains of P atoms, similar to the layered -P (ICSD 2927354, red P).
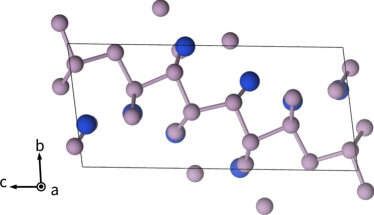
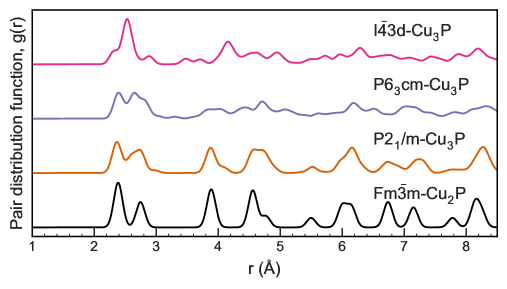
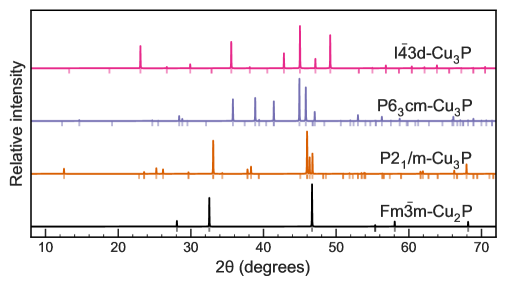
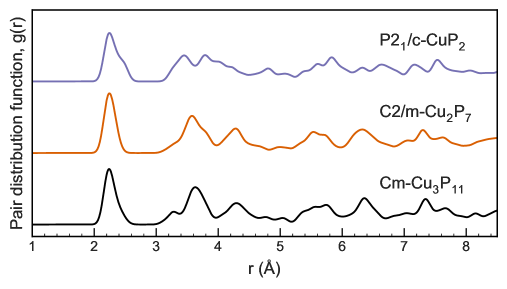
In the P-rich region, 5 new phases were identified within 50 meV/atom of the convex hull: –CuP3, –Cu8P27, –Cu3P11, –Cu7P27 and –CuP4. Using the GA it was possible to include structures with stoichiometries of P up to 27 atoms in the unit cell, and thus found structural variations on Cu2P7 such as Cu3P11. To compare the new metastable –Cu3P11 structure with other P-rich structures, the pair distribution functions (PDF) and calculated powder x-ray diffraction (PXRD) peaks of CuP2, Cu2P7 and Cu3P11 were calculated and are compared in Figure 3b. In all three cases, the initial sharp peak in the PDF between 2.20 and 2.24 Å shows, unsurprisingly, the same Cu–P and P–P distance shared by all three structures. The peaks at radii above 3 Å show the longer range similarity between Cu3P11 and Cu2P7 which is not shared by CuP2. Comparing the PXRD patterns of –Cu2P7 and –Cu3P11 show that –Cu3P11 is distinguished by a peak at a 2 value of 16∘, where –Cu2P7 has an indistinguishable peak at this point. Given the shared symmetry operations between and we expect to see peaks at the same 2 values, but the intensities will vary between the structures. We deduce that these three phases could be verified using experimental PXRD, by using the peaks at 2 to distinguish between the phases.
.
3.2 Cu3-xP phases ()
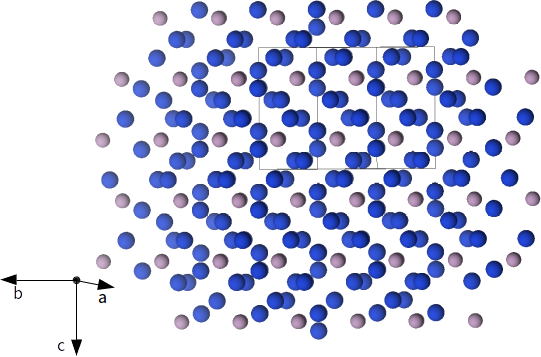
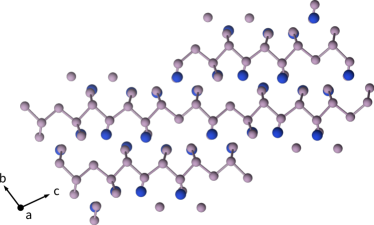
Within the stoichiometry range Cu3-xP (), 4 unique Cu3P phases, Cu17P6, Cu8P3, Cu7P3 and Cu2P were found. Of these, –Cu3P was the only phase previously experimentally determined, and had a formation energy 37 meV/atom above the convex hull tie-line. Olofsson identified the stoichiometry of –Cu3P at 975 K to be between Cu2.867P and Cu2.755P due to Cu vacancies within the unit cell of –Cu18P6 (shown in Figure S1) 43. A study on low-temperature phases of Cu3-xP proposes phases from Cu2.3P to Cu2.9P 55. The lowest energy Cu3-xP () phases identified in Table 1, –Cu17P6 (Cu), –Cu8P3 (Cu), and –Cu7P3 (Cu) are all defect structures of –Cu3P with 1, 2, and 4 Cu vacancies respectively from the –Cu18P6 unit cell of Cu3P. Of these three –Cu3P defect structures, –Cu8P3 (Cu) has the smallest distance from the hull ( meV/atom). This corroborates previous DFT calculations suggesting Cu3P has two Cu vacancies 47.
In addition to the ICSD phase of –Cu3P ( meV/atom), two other Cu3P phases were found which are closer to the convex hull tie line than –Cu3P; these are the –Cu3P ( meV/atom) and –Cu3P phase ( meV/atom). The –Cu3P phase is structurally related to the –Cu2P ( meV/atom) phase (discussed in the following section). These two phases are shown in Figure 4, in which the –Cu3P can be described as a stacking of the –Cu2P phase. While the –Cu2P phase has not been observed experimentally, it is likely that the two phases could be distinguished, given their distinct PDF and PXRD patterns shown in Figure S2. The PXRD pattern for –Cu3P has additional low intensity peaks to the right of the 46∘ peaks, and is distinct from the other low-energy phases of Cu3P as shown in Figure S2, which would further distinguish this phase in experiment.
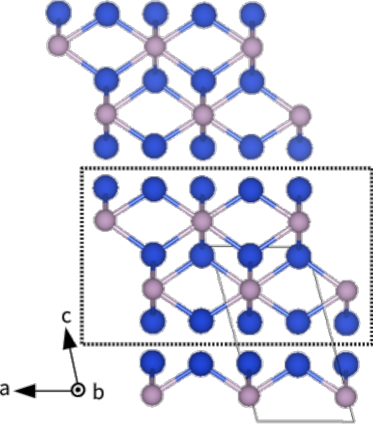
The lowest energy Cu3P phase is an phase 11 meV/atom above the tie-line, which was identified by relaxing the prototype –Cu3As structure (ICSD 64715 49, 57). The –Cu3P structure is the highest symmetry Cu3P phase, and is the only cubic phase in the set of low-energy Cu3P structures. –Cu3P contains 8 formula units in the primitive unit cell, and has 9-fold coordinated P atoms whereas –Cu3P has 8-fold coordinated P atoms. The resulting crystal structures, shown in Figure S1, show two different long range orderings of the Cu sub-network. –Cu3P has only one, 8-fold coordinated, P site which results in continuous zig-zag chains of Cu atoms surrounding the P, which are at the peaks of the buckles in the zig-zag. In –Cu3P, there are two 9-fold coordinated sites; one site at the center of the surrounding Cu (seen in Figure S1) and one at the edges, which together form a hexagonal Cu cage surrounding the P atom in the center. While both phases have high-coordinated P atoms, the –Cu3P shows a network of Cu atoms surrounding a central P atom, where –Cu3P contains infinite Cu chains in the direction.
Another trigonal phase, –Cu3P (ICSD 1684149, meV/atom) has the same structure as –Cu3As (ICSD 16840 49), however it is 82 meV/atom above the convex hull tie-line. To the best of our knowledge, there are no reports of an –Cu3P phase, either experimentally or in a computational database. The PDF and PXRD patterns of –Cu3P given in Figure S2, show no relation to any other Cu3P phase, or the –Cu2P phase, thus, if energetically stable, it could be identified using PXRD in experiment.
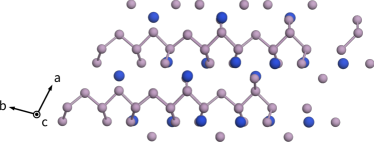
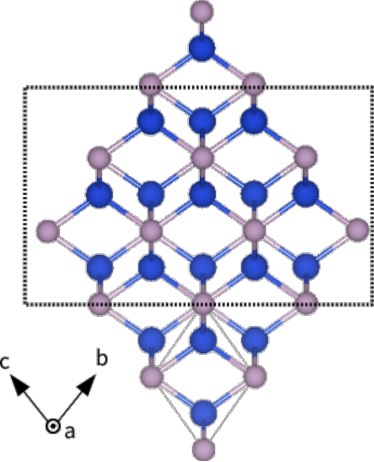
3.3 –Cu2P
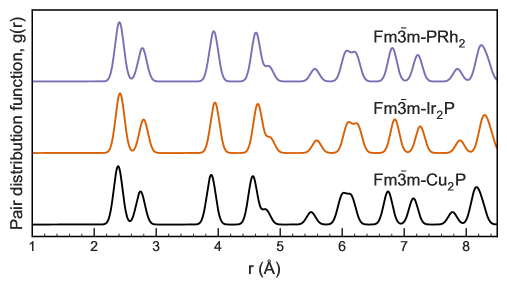
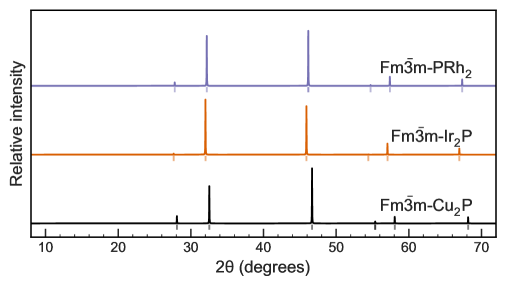
The –Cu2P phase was found from the prototype -Ir2P (ICSD 640898) 58. Comparing the Cu2P phase to both Ir2P and Rh2P using PDFs in Figure S3 shows that the PDFs are identical between all three structures, and the PXRD plot of Cu2P has the same peaks, all shifted to slightly higher values of 2 due to structural relaxations in the geometry optimization of Cu2P.
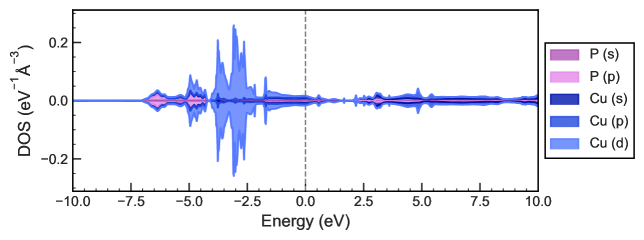
Previously, a 2D structure of Cu2P was predicted theoretically as a buckled non-magnetic material 56, in which the magnetism expected was inhibited by the buckled layers. The buckled layers from the 2D phase are also present in the bulk –Cu2P, and the non-magnetic nature was confirmed in the bulk phase by the lack of spin-polarization in the density of states shown in Figure S4. The bulk –Cu2P structure described above has the same structural motifs as the 2D hexagonal phase found by Yang et al.56, and has the same electronic properties.
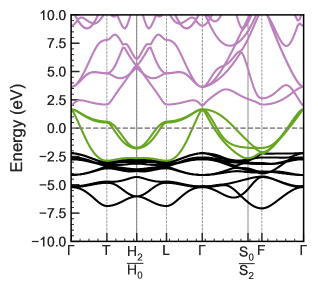
–Cu2P lies on the convex hull tie-line, and is energetically more stable than both the experimentally confirmed phase of –Cu3P, and its defect structure –Cu8P3. Figure 5 shows the phonon dispersion for the –Cu2P computed as mentioned in the Methods section. No imaginary phonon frequencies were present in the dynamical matrix (interpolated or otherwise), indicating that –Cu2P is dynamically stable.
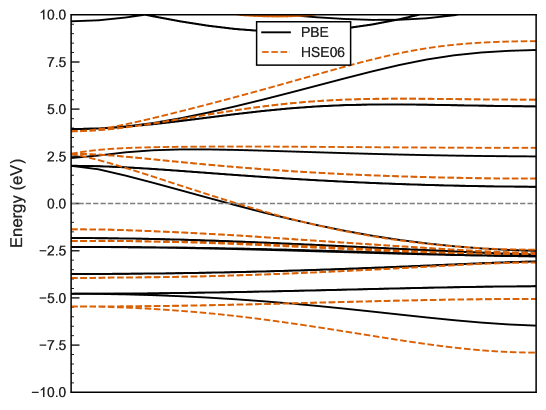
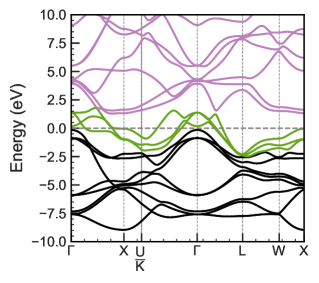
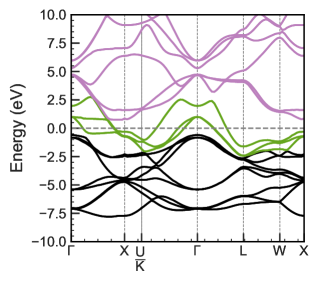
The electronic structure of –Cu2P is related to the electronic structure of other TMPs, suggesting it belongs to the same class of materials as -Ir2P and Rh2P. Of the TMPs in the Materials Project database 59, 21 are insulating, and 68 are metallic with a high density of transition metal -bands below the Fermi level. Figure 6 shows the electronic band structure and density of states of –Cu2P projected by species along the high-symmetry path from SeeK-path used previously, and the density of states projected by angular momentum channel on a fine Monkhorst-Pack grid. The band structure shows that Cu2P is a metal with P and Cu bands touching at the point ~2.0 eV above the Fermi level. In addition there is a characteristic high density of flat bands localized on the Cu ions that exhibit -character around 2.5 eV below the Fermi level. Calculating this band structure using the HSE06 functional (shown in Figure S5), a hybrid functional designed to correct for band gap underestimation, the gap at between the Cu and P bands is closed.
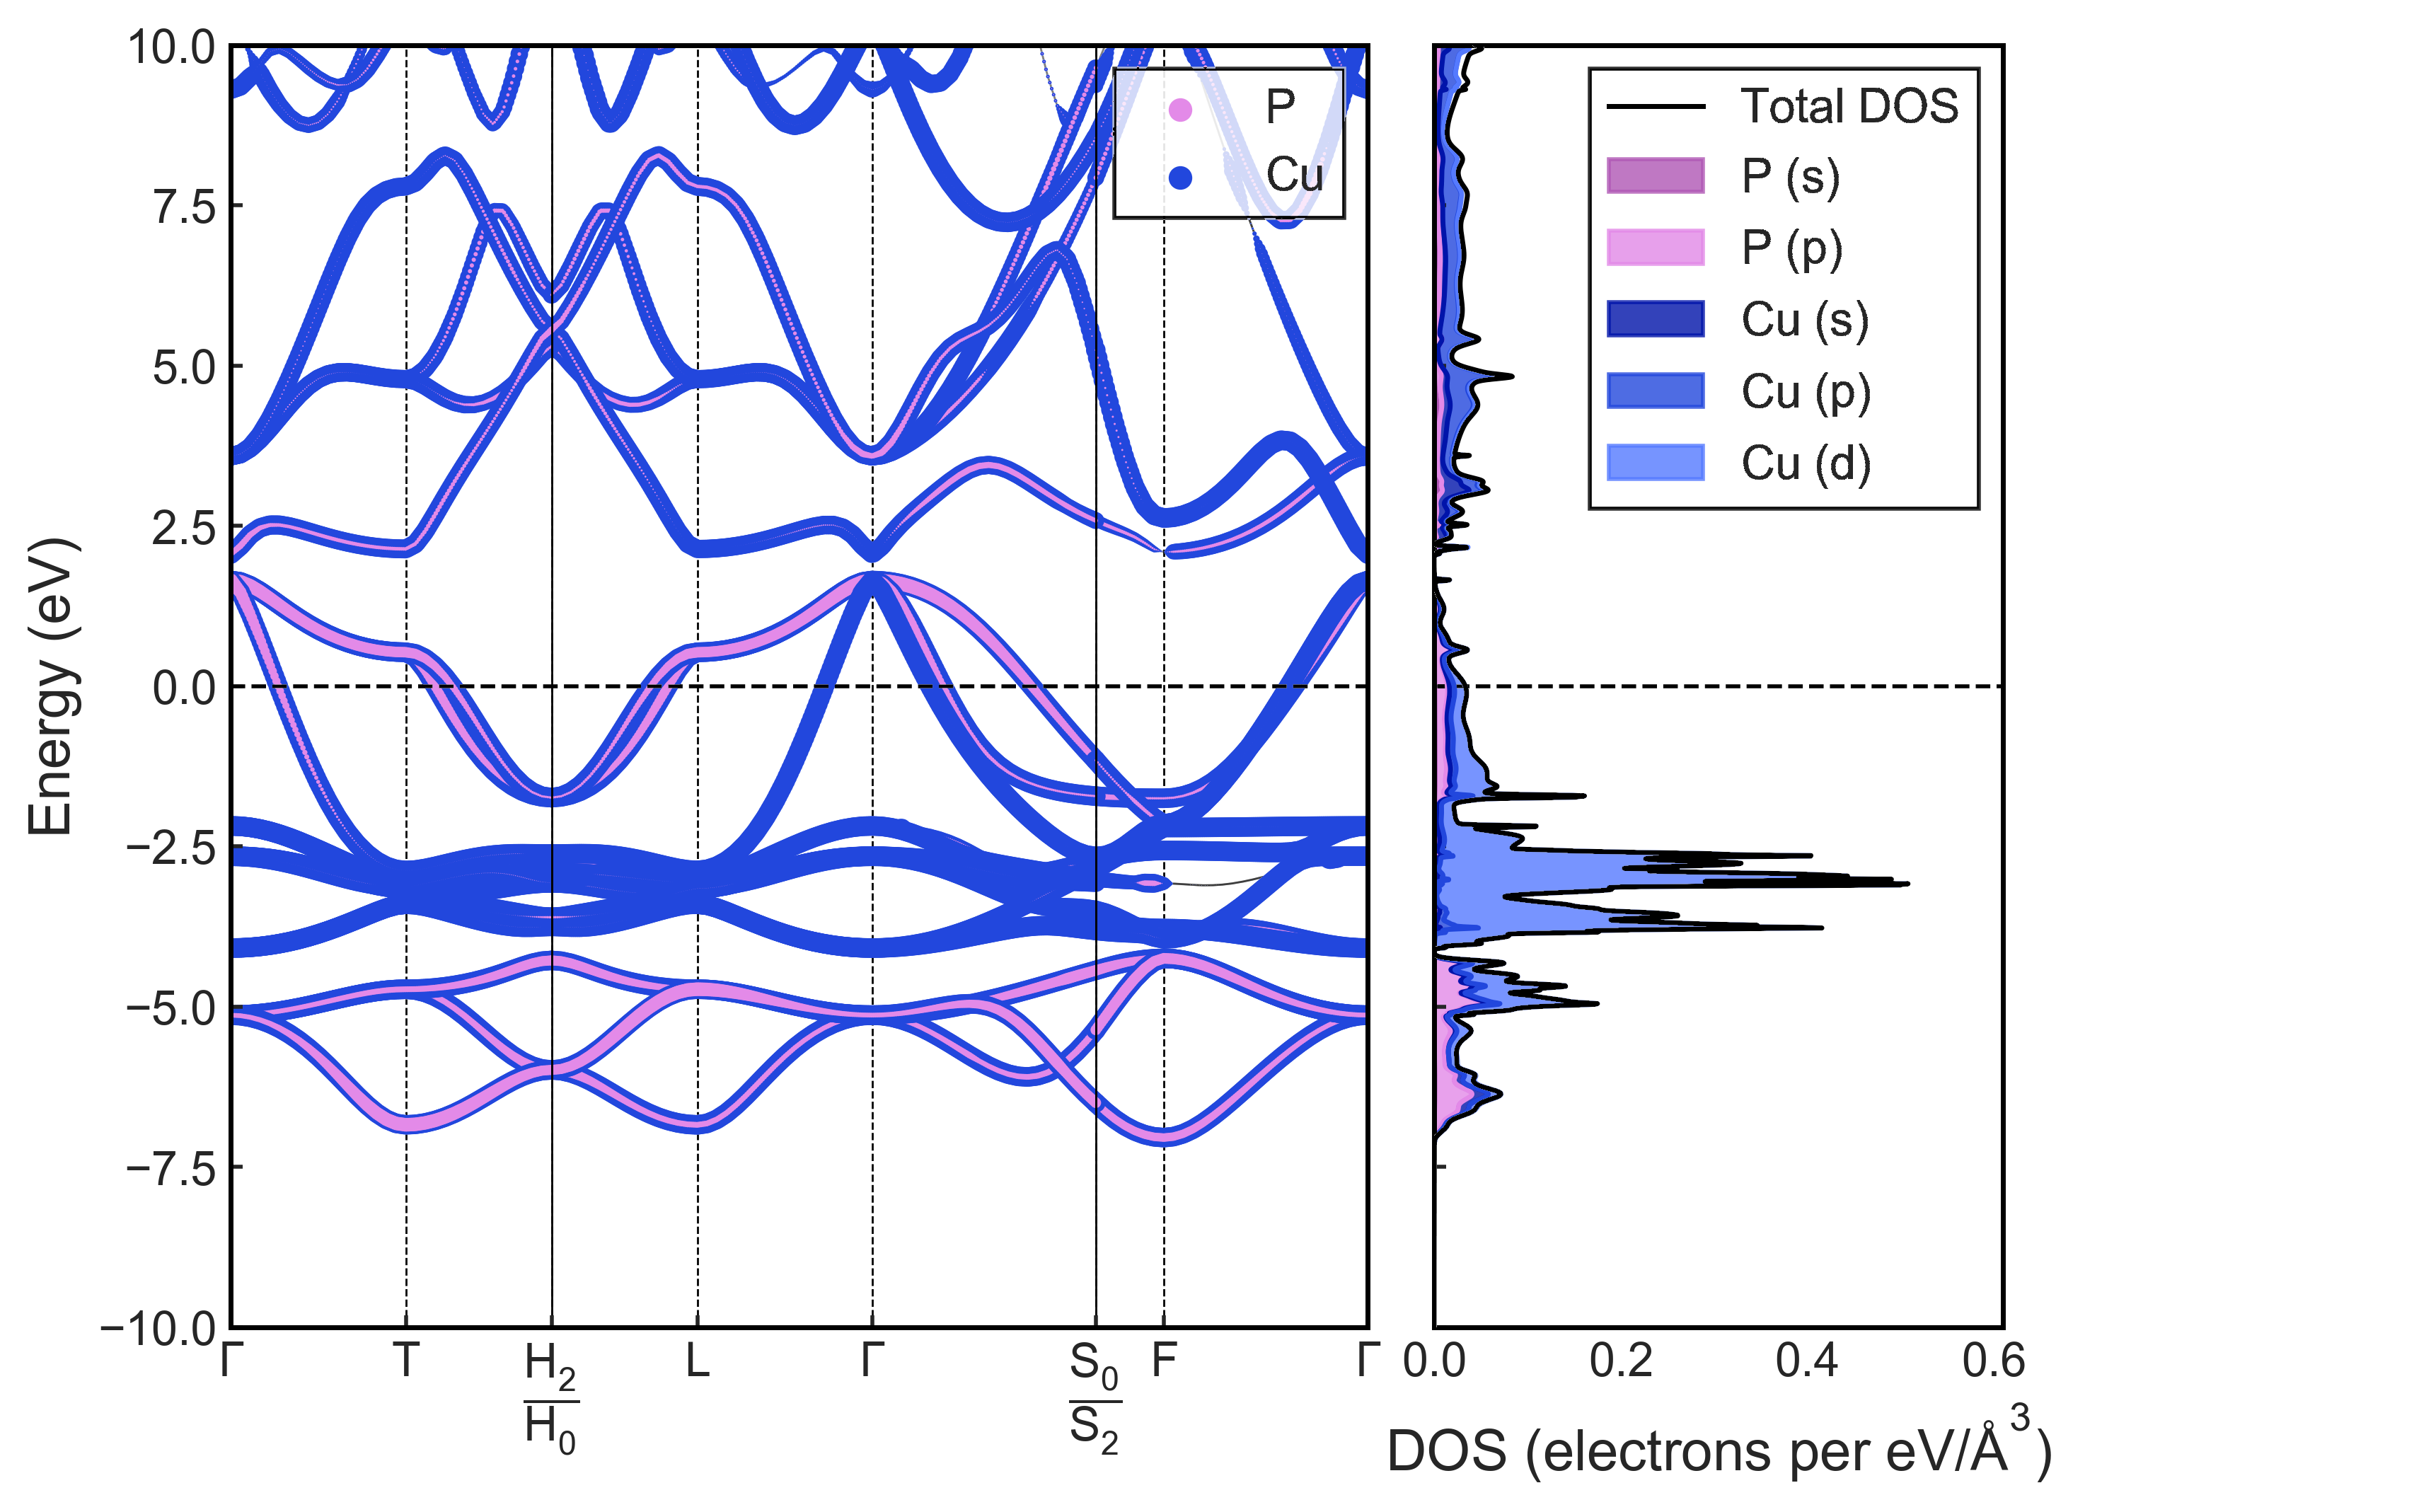
Many M2P phases (where M is a transition metal) have a structure similar to -Ni2P60 and Fe2P 61, 62 in which the metal atoms sit in a cage of 3-fold coordinated P and 4-fold coordinated metal atoms. –Cu2P is most similar to the other TMPs, as it was derived from a the prototype structure -Ir2P, and has 4-fold coordinated Cu with 8-fold coordinated P. The Cu2P band structure in Figure 6 is also similar to those of Ir2P and Rh2P. In Rh2P there is a directionally opened gap 1 eV above the Fermi level at the point, not present in Cu2P or Ir2P (Cu2P, Ir2P and Rh2P band structures calculated with spin-orbit coupling are given in Figure S6, the gapped region is outlined in black dashed line). Both of these structures exhibit spin-orbit coupling due to their heavy metal ions, while Cu has negligible spin-orbit coupling effects. The Rh2P and Ir2P band structures are calculated including spin-orbit coupling.
3.4 Finite-Temperature Phase Stability
The temperature-dependent convex hull was constructed by calculating the finite-temperature Gibbs free energies by including vibrational effects at the harmonic level 63 of several related structures on or near the convex hull from Figure 1. All structures within 20 meV/atom of the hull at 0 K were included in the finite-temperature hull; these were –Cu2P, –Cu3P, –Cu8P3 (the structure with 2 Cu vacancies from –Cu3P discussed previously), CuP2, CuP10, Cu2P7, and Cu3P11.
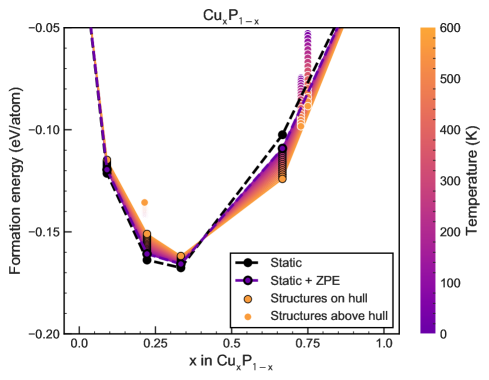

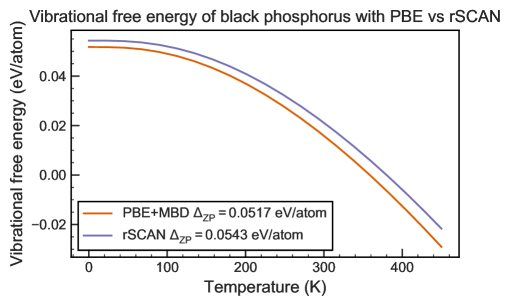
The chemical potentials for this binary convex hull were -P (black phosphorus) and –Cu. Previously, Mayo et al. noted that the inclusion of semi-empirical dispersion corrections for black phosphorus changed the energetics of the convex hull 26, and therefore it is not possible to combine optimized structures with and without dispersion corrections on the same convex hull. However, in order to obtain non-imaginary phonon frequencies of -P, it is necessary to account for dispersion. To account for this the many-body dispersion correction (MBD) was applied during the geometry optimization and phonon calculation 40. Using PBE the distance between P chains in black phosphorus is 3.95 Å. By applying this correction, the P–P chain distance was reduced to 3.58 Å. In order to include the MBD black phosphorus on the convex hull in Figure 7a, we calculated the free energy of black phosphorus , at a given temperature as,
| (3) |
where is the enthalpy without the dispersion correction, and is the free energy contribution at temperature with the MBD dispersion correction, which includes the zero-point energy. In this way the energies of black phosphorus were referenced to the ground-state energy without dispersion. The SCAN functional accurately describes the phonon modes of black phosphorus without any added dispersion corrections (i.e. no imaginary modes are observed) and therefore is used as a comparison to the MBD corrected PBE functional in Figure S7. Figure S7 shows that for any temperature , both and are on the same scale, only the zero-point energy is shifted (by 2.6 meV/atom) for the PBE+MBD calculation. Therefore, we expect the results of the PBE+MBD free energies to be comparable with non-dispersion corrected PBE free energies.
Using the MBD correction on black phosphorus in addition to the phonon modes of the previously mentioned phases of Cu–P, the hull in Figure 7a was constructed up to 600 K, above which no changes to stabilities are observed. A maximum value of 600 K was chosen so as not to approach the melting point of any phases, as the known phases of Cu–P typically have melt between 800 and 1200 K. Furthermore, the harmonic approximation is a limited approach, and at higher temperatures, anharmonicity should be accounted for. –Cu2P remains on the hull at 600 K, suggesting it could be synthesized at high temperature. The convex hull is confirmation that the –Cu8P3 phase formed from two Cu vacancies in –Cu3P is the more stable phase at room temperature, as at 300 K, –Cu8P3 is within 10 meV/atom of the convex hull as shown in Figure 7b. In addition, the destabilization of –Cu3P at high temperatures, shown in Figure 7b suggests that this phase is not experimentally realizable, and provides an explanation as to why it has not yet been experimentally synthesized. We can clearly see that –Cu3P is stabilized at higher temperatures, as shown in Figure 7b, in which it is within 10 meV/atom of the convex hull at temperatures higher than 450 K.
Previous work on the Cu3-xP phases of –Cu3P 47 confirms that the formation of two vacancies in Cu3P is energetically stabilizing. By enumerating all of the possible structures with two Cu vacancies using the vacancy enumeration procedure described in the Methods Section, we have determined that the –Cu8P3 phase with two Cu vacancies in the 6 Wyckoff positions is the lowest energy vacancy phase. Given the large number of ways to introduce these vacancies into the structure, configurational entropy will further stabilize this phase at high temperatures. To fully understand the nature of vacancy formation in –Cu3P a full cluster expansion could be performed, which is beyond the scope of this paper.
3.5 Cu2P as a Li-ion battery conversion anode
–Cu2P was computationally predicted to be energetically stable as both a 2D material 56 and now in this article as a bulk phase. The previous sections predict the stability of –Cu2P at temperatures up to 600 K, and characterize it as a metal with dispersive bands and delocalized conduction states at the Fermi level. An intuitive choice of application for Cu2P lies in conversion anodes for Li-ion batteries, where previously both CuP2 and Cu3P were used as anodes with gravimetric capacities between 300 and 800 mAh/g 11, 12, 14, 13.
The crystal structure of –Cu3P has a theoretical capacity of 363 mAh/g and experimentally has exhibited a range of capacities based upon the preparation method used 13. The powdered Cu3P anodes prepared by Bichat et al13 ranged in initial capacity from 272 mAh/g using high-temperature synthesis in a silica tube to 527 mAh/g using low-temperature solvothermal synthesis respectively. In the solvothermal route, the Cu3P powders were prepared with copper chloride, water, and NH4OH with white phosphorus, which could have resulted copper oxide impurities leading to the initial capacity which is above the theoretical capacity of crystalline Cu3P. Cu3P powder synthesized by a solid-state reaction with red P in an ethanol suspension and Cu foil, the initial capacity of Cu3P was 415 mAh/g 14. Energy dispersive X-ray analysis showed that the stoichiometry was close to Cu3P (though not exact) suggesting that this initial structure could have been within the stoichiometric range of Cu3-xP in order to achieve that initial capacity, in addition to the added capacity from likely oxide impurities.
In contrast, Cu2P has a theoretical capacity of 509 mAh/g, which is above that of graphite at 372 mAh/g. The metallic nature of Cu2P further enhances its use as a Li-ion battery anode, enabling fast electronic transfer through the electrode of the battery. In fact, Cu is already widely used as a current collector in contemporary Li-ion batteries, and previous studies on Cu3P nanorods suggest that Cu–P anodes create a synergistic chemical interface with the Cu-current collector which promotes cyclability 15. Furthermore, because of its comparatively lower P content, volume changes during cycling are reduced, and therefore the degradation is likely to be less severe 12.
The volume expansion for a conversion anode, with an overall conversion reaction
| (4) |
is calculated as,
| (5) |
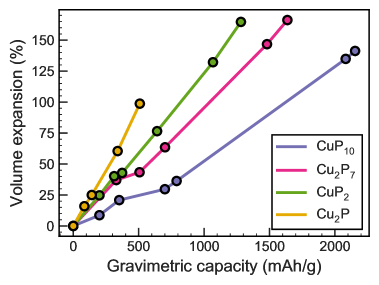
where is the volume per formula unit of each phase in the conversion reaction. Using this equation, the volume expansion of –Cu2P is 99 %. This is comparable to the calculated volume expansion of –Cu3P, which is 86 %, and far superior to the volume expansion of CuP2, which is 165 %. The volume expansion for each binary Cu–P phase is shown in Figure S8, confirming that Cu2P has the lowest volume expansion of the four stable phases on the convex hull. Experimental reports on cycling of ball-milled CuP2 12 suggest that volume expansion occurs, as after cycling for 10 cycles, the capacity is reduced by 50 %, although they give no estimate of the level of volume expansion in the cell. The expansion is partially mitigated through the use of nanostructuring 11, which allows cycling for 200 cycles. However, there is still capacity fading in this case, which reiterates the need for a high capacity conversion anode with low volume expansion, so as to reduce the need for nanostructuring or other post-processing techniques to mitigate volume expansion. As both Cu3P and Cu2P have lower predicted volume expansions, and synthesized Cu3P shows no evidence of deleterious volume expansion 13, it is likely that Cu2P would also have minimal volume expansion in experiment.
Using the convex hull constructed in Figure 1 and the structures on the ternary hull of Cu–Li–P, a voltage profile was constructed from the DFT ground-state energies for both –Cu2P and –Cu3P. All of the known ternary structures were included in this hull: –Cu2LiP, –Cu2LiP2, –Cu4Li5P6 and –CuLi2P, as well as the binary Li–P structures -Li3P, -LiP, -Li3P7 and -LiP7. A plane wave kinetic energy cutoff of 700 eV was used, and all structures on the hull were re-relaxed at this higher cutoff. The ternary hull is shown in Figure S9, in which the pathways from Cu–P to Li are also shown, to depict how the voltage profiles for these Cu–P phases were calculated. The hull is shaded with a colormap to show the relative formation energy of phases on the hull, indicating that the Li–P phases have larger formation energies (and thus create a deeper convex hull) than the Cu–P phases.
Although Cu–Li phases are predicted to be stable under the approximation of PBE, the formation energy of the predicted Cu3Li phase is only 26 meV/atom in the OQMD database 19, 64 and no phases of Cu–Li are predicted at finite temperature in experiment 65. Furthermore, Cu is used as a current collector in Li ion batteries specifically for its properties in resisting Li intercalation, and dead Li is found during cycling rather than Cu–Li phases 66. Therefore, no Cu–Li compounds were included in the convex hull.
There are three ternary compounds on the Cu–Li–P hull in Figure S9; these are –Cu2LiP2, –Cu4Li5P6 and –CuLi2P. Experiments suggest that a hexagonal LiCu2P phase forms 67 during cycling, however the –Cu2LiP (ICSD 659706) 46 phase of this structure is 39 meV/atom above the hull at a plane wave cutoff of 700 eV.
From this ternary hull, shown in Figure S9, the voltage profile shown in Figure 8 was constructed. This hull is calculated as usual, without incorporating vibrational effects at 0 K. As the –Cu2LiP phase suggested in experiment 67, 46 is 39 meV/atom above the convex hull, it cannot be in the voltage profile calculated in Figure 8. The 0 K voltage profile includes the –Cu2LiP2 phase, which has been previously synthesized through a solid state reaction 68 and is a high Tc pnictide superconductor 69. The –Cu2LiP2 phase has not, to our knowledge, been identified during cycling in Li-ion batteries previously.
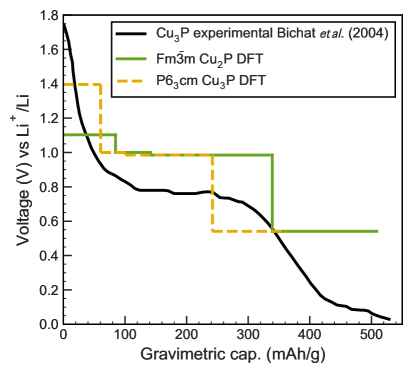
Both Cu2P and Cu3P have the same overall reaction mechanism given by Equation 4, and the stable phases during the reaction from charging Cu3P are given in Table 3.5. These reactions show Cu2P operates in a narrower voltage window than Cu3P and has a higher predicted gravimetric capacity. The predicted structures forming at each capacity and voltage are given in the 4th column of Table 3.5. Though –Cu2P undergoes the same lithiation process as –Cu3P, –Cu2P has a higher capacity of 508 mAh/g, and a higher average voltage of 0.86 V versus Li/Li+, while –Cu3P has a capacity of 363 mAh/g and average voltage of 0.91 V.
Each plateau in the ground-state voltage profile in Figure 8 represents a three phase region of the ternary hull in which phases of Cu–Li–P are stable. Here, Cu3P was ‘stabilized’ on the ternary hull by artificially excluding the CuP2–Cu2P7 and Cu2P phases. This is an approximation of a convex hull in which Cu3P is on the tie-line which does not effect the formation energy (and thus predicted voltages) of the other phases. The experimental voltage curve shown in Figure 8 from 67 exhibits a similar trend in phase transitions along the cycle as the theoretical curve for Cu3P.
| Reaction | Gravimetric Capacity | Voltage (V) | Reaction Pathway |
| Stage | (mAh/g) | ||
| \rowcolorgray!30 Cu2P + 3 Li Li3P + 2 Cu | |||
| I | 85 | 1.10 | Cu2LiP2 + Cu |
| II | 141 | 1.00 | Cu4Li5P6 + Cu |
| III | 338 | 0.98 | CuLi2P + Cu |
| IV | 509 | 0.54 | Li3P + 2 Cu |
| \rowcolorgray!30 Cu3P + 3 Li Li3P + 3 Cu | |||
| I | 60 | 1.53 | Cu2LiP2 + 2 Cu |
| II | 101 | 1.00 | Cu4Li5P6 + Cu |
| III | 242 | 0.98 | CuLi2P + 2 Cu |
| IV | 363 | 0.54 | Li3P + 3 Cu |
4 Conclusion
Using 4 different computational crystal structure searching techniques on the copper phosphides, several structures which lie close to the convex hull (within 20 meV/atom) were predicted, including –Cu3P11, –Cu3P, and –Cu2P; the experimentally characterized –CuP10, –Cu2P7 and –CuP2 were all on the convex hull tie-line. By calculating the phonon dispersion curves of all structures within 20 meV/atom of the Cu–P convex hull, we constructed a temperature dependent convex hull which predicted –Cu2P to be stable up to 600 K, while –Cu3P was destabilized with increasing temperature. We have also shown that the –Cu8P3 phase formed from two Cu vacancies at the 6c Wyckoff positions of –Cu3P is stabilized with increasing temperature, and is within 10 meV/atom of the convex hull above 300 K. Experimental diffractometry on single-crystals of Cu3P suggests that the phase has a range of stoichiometries between Cu2.6P and Cu2.8P 43, 47, and Cu8P3 (or Cu2.67P equivalently) is within these bounds.
In addition to confirming the stability of –Cu8P3, we also confirmed that –Cu3P11 remains metastable up to high temperatures as shown in the temperature dependent hull in Figure 7. While Cu3P11 is unlikely to be used as a Li-ion battery anode, given its high P content, and therefore susceptibility to volume expansion, it could be a novel phase to consider within the Cu–P phase diagram. CuP10 was identified experimentally by preparing Cu2P7 in excess P 70; given the structural similarity between –Cu3P11 and –Cu2P7 shown in Figure 2, it is possible that –Cu3P11 is also formed in excess P. Using the PXRD patterns presented in Figure 3b, it may be possible to distinguish the –Cu3P11 phase from –Cu2P7 experimentally, from the change in peak intensity at 16∘, and peak differences at 2 values , however further experimental analysis is likely required given the low intensity of this peak.
Finally, –Cu2P is the only phase identified through crystal structure prediction which was found on the hull at 0 K, and which remained on the convex hull at finite temperature, strongly suggesting it is possible to synthesize Cu2P experimentally. Furthermore, its synthesis could provide a novel conversion anode, with favorable properties for Li-ion batteries. Hybrid functional calculations of the electronic properties of Cu2P predict it to be isostructural and qualitatively similar electronically to both Rh2P and Ir2P, which are also metals with dispersive bands at the Fermi level. This was confirmed using spin-polarized calculations, both with vector and scalar spin treatments, hybrid functional calculations using the HSE06 functional, and finally a projected band structure and density of states using PBE. This confirmation of the metallic nature of Cu2P using a wide range of functionals and spin treatments suggests that this could be a better choice for anode than Li–P which are insulators with wide band gaps. Furthermore, the presence of such dispersive bands, suggest high electron mobility within the anode, which would mitigate fast charge transfer between the Cu current collector and Li-ions. Finally, given its higher capacity (509 mAh/g) compared to Cu3P, Cu2P has potential as an experimentally realizable conversion anode which has a capacity that is competitive with graphite, conductive to promote electronic transfer within the anode, and less vulnerability to degradation compared to high P content conversion anodes due to reduced levels of cyclic volume changes.
5 Acknowledgments
The authors would like to thank Bartomeu Monserrat for his discussions on electronic structure, and Matthew Cliffe for his discussions on PXRD. We would also like to thank Can Koçer for looking over the manuscript text. AFH acknowledges the financial support of the Gates Cambridge Trust and the Winton Programme for the Physics of Sustainability, University of Cambridge, UK. MLE acknowledges the Engineering and Physical Sciences Research Council (EPSRC) Centre for Doctoral Training in Computational Methods for Materials Science, UK, for funding (EP/L015552/1). AJM acknowledges funding from EPSRC (EP/P003532/1). The authors acknowledge networking support via the EPSRC Collaborative Computational Projects, CCP9 (EP/M022595/1) and CCP-NC (EP/T026642/1). This work was performed using resources provided by the Cambridge Service for Data Driven Discovery (CSD3) operated by the University of Cambridge Research Computing Service (www.csd3.cam.ac.uk), provided by Dell EMC and Intel using Tier-2 funding from the Engineering and Physical Sciences Research Council (capital grant EP/P020259/1), and DiRAC funding from the Science and Technology Facilities Council (www.dirac.ac.uk).
6 Supporting Information Description
The Supporting Information document contains details of the simulation of powder X-ray diffraction patterns and pair distribution functions, as well as the electronic band structure calculations using spin-orbit coupling. It contains all Supporting Information Figures referenced in the main text. All data is deposited at https://doi.org/10.17863/CAM.52272 in the Cambridge Repository. All analysis is on Github at harpaf13/data.copper-phosphides and Binder.
References
- Ramireddy et al. 2015 Ramireddy, T.; Xing, T.; Rahman, M. M.; Chen, Y.; Dutercq, Q.; Gunzelmann, D.; Glushenkov, A. M. Journal of Materials Chemistry A 2015, 3, 5572–5584
- Bhatt and Lee 2019 Bhatt, M. D.; Lee, J. Y. International Journal of Hydrogen Energy 2019, 44, 10852 – 10905
- Tarascon and Armand 2001 Tarascon, J.-M.; Armand, M. Nature 2001, 414, 359–367
- Kirklin et al. 2013 Kirklin, S.; Meredig, B.; Wolverton, C. Advanced Energy Materials 2013, 3, 252–262
- Sun et al. 2016 Sun, M.; Liu, H.; Qu, J.; Li, J. Advanced Energy Materials 2016, 6, 1600087
- Feng and Xue 2017 Feng, L.; Xue, H. Chem. Electro. Chem. 2017, 4, 20–34
- Lu et al. 2018 Lu, Y.; Yu, L.; Lou, X. W. D. Chem 2018, 4, 972 – 996
- Boyanov et al. 2006 Boyanov, S.; Bernardi, J.; Gillot, F.; Dupont, L.; Womes, M.; Tarascon, J.-M.; Monconduit, L.; Doublet, M.-L. Chemistry of Materials 2006, 18, 3531–3538
- Zhang et al. 2015 Zhang, Y.; Zhang, H.; Feng, Y.; Liu, L.; Wang, Y. ACS Applied Materials & Interfaces 2015, 7, 26684–26690
- Lu et al. 2012 Lu, Y.; Wang, X.; Mai, Y.; Xiang, J.; Zhang, H.; Li, L.; Gu, C.; Tu, J.; Mao, S. X. The Journal of Physical Chemistry C 2012, 116, 22217–22225
- Kim and Manthiram 2017 Kim, S.-O.; Manthiram, A. ACS Applied Materials & Interfaces 2017, 9, 16221–16227
- Wang et al. 2003 Wang, K.; Yang, J.; Xie, J.; Wang, B.; Wen, Z. Electrochemistry Communications 2003, 5, 480 – 483
- Bichat et al. 2004 Bichat, M.-P.; Politova, T.; Pfeiffer, H.; Tancret, F.; Monconduit, L.; Pascal, J.-L.; Brousse, T.; Favier, F. Journal of Power Sources 2004, 136, 80 – 87
- Pfeiffer et al. 2004 Pfeiffer, H.; Tancret, F.; Bichat, M.-P.; Monconduit, L.; Favier, F.; Brousse, T. Electrochemistry Communications 2004, 6, 263 – 267
- Villevieille et al. 2008 Villevieille, C.; Robert, F.; Taberna, P. L.; Bazin, L.; Simon, P.; Monconduit, L. Journal of Materials Chemistry 2008, 18, 5956–5960
- Ni et al. 2014 Ni, S.; Ma, J.; Lv, X.; Yang, X.; Zhang, L. Journal of Materials Chemistry A 2014, 2, 20506–20509
- Chandrasekar and Mitra 2013 Chandrasekar, M.; Mitra, S. Electrochimica Acta 2013, 92, 47–54
- Curtarolo et al. 2012 Curtarolo, S.; Setyawan, W.; Hart, G. L.; Jahnatek, M.; Chepulskii, R. V.; Taylor, R. H.; Wang, S.; Xue, J.; Yang, K.; Levy, O.; Mehl, M. J.; Stokes, H. T.; Demchenko, D. O.; Morgan, D. Computational Materials Science 2012, 58, 218 – 226
- Saal et al. 2013 Saal, J. E.; Kirklin, S.; Aykol, M.; Meredig, B.; Wolverton, C. JOM 2013, 65, 1501–1509
- Hautier et al. 2011 Hautier, G.; Fischer, C.; Ehrlacher, V.; Jain, A.; Ceder, G. Inorganic Chemistry 2011, 50, 656–663
- Evans 2016 Evans, M. GitHub 2016, https://github.com/ml-evs/matador/releases/tag/0.9 (accessed May 11, 2020)
- Evans 2017 Evans, M. GitHub 2017, https://github.com/ml-evs/ilustrado/releases/tag/0.3b (accessed May 11, 2020)
- Harper et al. 2019 Harper, A. F.; Evans, M. L.; Darby, J. P.; Karasulu, B.; Koçer, C. P.; Nelson, J. R.; Morris, A. J. Johnson Matthey Technology Review 2019, 64, 103–118
- See et al. 2014 others,, et al. Journal of the American Chemical Society 2014, 136, 16368–16377
- Mayo and Morris 2017 Mayo, M.; Morris, A. J. Chemistry of Materials 2017, 29, 5787–5795
- Mayo et al. 2016 Mayo, M.; Griffith, K. J.; Pickard, C. J.; Morris, A. J. Chemistry of Materials 2016, 28, 2011–2021
- Marbella et al. 2018 Marbella, L. E.; Evans, M. L.; Groh, M. F.; Nelson, J.; Griffith, K. J.; Morris, A. J.; Grey, C. P. Journal of the American Chemical Society 2018, 140, 7994–8004
- Hellenbrandt 2004 Hellenbrandt, M. Crystallography Reviews 2004, 10, 17–22
- Pickard and Needs 2011 Pickard, C. J.; Needs, R. Journal of Physics: Condensed Matter 2011, 23, 053201
- Deaven and Ho 1995 Deaven, D. M.; Ho, K. M. Physical Review Letters 1995, 75, 288–291
- Clark et al. 2005 Clark, S. J.; Segall, M. D.; Pickard, C. J.; Hasnip, P. J.; Probert, M. I.; Refson, K.; Payne, M. C. Zeitschrift für Kristallographie-Crystalline Materials 2005, 220, 567–570
- Perdew et al. 1996 Perdew, J. P.; Burke, K.; Ernzerhof, M. Physical Review Letters 1996, 77, 3865
- Vanderbilt 1990 Vanderbilt, D. Physical Review B 1990, 41, 7892
- Sun et al. 2012 Sun, L.-Q.; Li, M.-J.; Sun, K.; Yu, S.-H.; Wang, R.-S.; Xie, H.-M. The Journal of Physical Chemistry C 2012, 116, 14772–14779
- Urban et al. 2016 Urban, A.; Seo, D.-H.; Ceder, G. npj Computational Materials 2016, 2, 1–13
- Hinuma et al. 2017 Hinuma, Y.; Pizzi, G.; Kumagai, Y.; Oba, F.; Tanaka, I. Computational Materials Science 2017, 128, 140 – 184
- Togo and Tanaka 2018 Togo, A.; Tanaka, I. arXiv 2018, http://arxiv.org/abs/1808.01590 (accessed Feb 19, 2020)
- Morris et al. 2014 Morris, A. J.; Nicholls, R. J.; Pickard, C. J.; Yates, J. R. Computer Physics Communications 2014, 185, 1477–1485
- Nicholls et al. 2012 Nicholls, R. J.; Morris, A. J.; Pickard, C. J.; Yates, J. R. OptaDOS - a new tool for EELS calculations. Journal of Physics Conference Series. 2012; p 012062
- Tkatchenko et al. 2012 Tkatchenko, A.; DiStasio Jr, R. A.; Car, R.; Scheffler, M. Physical Review Letters 2012, 108, 236402
- Sun et al. 2016 Sun, W.; Dacek, S. T.; Ong, S. P.; Hautier, G.; Jain, A.; Richards, W. D.; Gamst, A. C.; Persson, K. A.; Ceder, G. Science Advances 2016, 2, e1600225
- Zhang et al. 2018 Zhang, G.-X.; Reilly, A. M.; Tkatchenko, A.; Scheffler, M. New Journal of Physics 2018, 20, 063020
- Olofsson 1972 Olofsson, O. Acta Chemica Scandinavica 1972, 26, 2777–2787
- Lange et al. 2008 Lange, S.; Bawohl, M.; Weihrich, R.; Nilges, T. Angewandte Chemie International Edition 2008, 47, 5654–5657
- Møuller and Jeitschko 1982 Møuller, M.; Jeitschko, W. Journal for Inorganic and General Chemistry 1982, 491, 225–236
- Schlenger et al. 1971 Schlenger, H.; Jacobs, H.; Juza, R. Journal of Inorganic and General Chemistry 1971, 385, 177–201
- De Trizio et al. 2015 others,, et al. Chemistry of Materials 2015, 27, 1120–1128
- Otte 1961 Otte, H. M. Journal of Applied Physics 1961, 32, 1536–1546
- Steenberg 1938 Steenberg, B. Arkiv Foer Kemi, Meralogi Och Geologi a Argka 1938, 12
- Owusu et al. 1972 Owusu, M.; Jawad, H.; Lundström, T.; Rundqvist, S. Physica Scripta 1972, 6, 67–70
- Zumbusch 1940 Zumbusch, M. Journal for Inorganic and General Chemistry 1940, 243, 322–329
- Moeller and Jeitschko 1981 Moeller, M. H.; Jeitschko, W. Inorganic Chemistry 1981, 20, 828–833
- Crichton et al. 2003 Crichton, W. A.; Mezouar, M.; Monaco, G.; Falconi, S. Powder Diffraction 2003, 18, 155–158
- Thurn and Krebs 1969 Thurn, H.; Krebs, H. Acta Crystallographica Section B: Structural Crystallography and Crystal Chemistry 1969, 25, 125–135
- Wolff et al. 2018 others,, et al. Chemistry of Materials 2018, 30, 7111–7123
- Yang and Ganz 2016 Yang, L.-M.; Ganz, E. Physical Chemistry Chemical Physics 2016, 18, 17586–17591
- Iglesias and Nowacki 1977 Iglesias, J.; Nowacki, W. Zeitschrift für Kristallographie-Crystalline Materials 1977, 145, 334–345
- Rundqvist 1960 Rundqvist, S. Nature 1960, 185, 31–32
- Jain et al. 2013 Jain, A.; Ong, S. P.; Hautier, G.; Chen, W.; Richards, W. D.; Dacek, S.; Cholia, S.; Gunter, D.; Skinner, D.; Ceder, G.; Persson, K. A. APL Materials 2013, 1, 011002
- Larsson 1965 Larsson, E. Ark. Kemi 1965, 23, 335–365
- Carlsson et al. 1973 Carlsson, B.; Gölin, M.; Rundqvist, S. Journal of Solid State Chemistry 1973, 8, 57–67
- Song et al. 2009 Song, M.-S.; Kang, Y.-M.; Kim, Y.-I.; Park, K.-S.; Kwon, H.-S. Inorganic Chemistry 2009, 48, 8271–8275
- Baroni et al. 2001 Baroni, S.; de Gironcoli, S.; Dal Corso, A.; Giannozzi, P. Rev. Mod. Phys. 2001, 73, 515–562
- Van de Walle et al. 2004 Van de Walle, A.; Moser, Z.; Gasior, W. Archives of Metallurgy 2004, 49, 535–544
- Okamoto 2011 Okamoto, H. Journal of Phase Equilibria and Diffusion 2011, 32, 172–172
- Fang et al. 2019 others,, et al. Nature 2019, 572, 511–515
- Bichat et al. 2004 Bichat, M. P.; Politova, T.; Pascal, J. L.; Favier, F.; Monconduit, L. Journal of The Electrochemical Society 2004, 151, A2074
- Schlenger and Jacobs 1972 Schlenger, H.; Jacobs, H. Acta Crystallographica Section B: Structural Crystallography and Crystal Chemistry 1972, 28, 327–327
- Han et al. 2010 Han, J.-T.; Zhou, J.-S.; Cheng, J.-G.; Goodenough, J. B. Journal of the American Chemical Society 2010, 132, 908–909
- Bawohl and Nilges 2015 Bawohl, M.; Nilges, T. Zeitschrift für Anorganische und Allgemeine Chemie 2015, 641, 304–310
7 For Table of Contents Only
![[Uncaptioned image]](/html/2005.05375/assets/x14.png)
8 Supporting Information
8.1 Simulation of powder X-ray diffraction patterns and pair distribution functions
Powder X-ray diffraction (PXRD) patterns and pair distribution function (PDF) data were simulated using v0.9 of the matador package 21. All PXRD patterns were calculated assuming a Cu- source with wavelength 1.541 Å. PXRD peak intensities were corrected with atomic scattering factors, Lorentz-polarization correction and a thermal broadening term with an element-independent Debye-Waller factor (). All peaks were then artificially broadened with a Lorentzian envelope of width 0.03 ∘, which ignores instrument-dependent and momentum-dependent peak broadening. PDFs were computed from pairwise atomic distances in non-diagonal supercells to ensure all appropriate distances were considered within the region shown (1–8 Å). The pairwise distances were then collected as a histogram and broadened with a Gaussian envelope of width 0.01 Å. In these calculations, no element-dependence was introduced into the scattering behavior of each atom and thus intensities are not expected to match experimental data.
8.2 Details of band structure calculations
To calculate the spin-orbit coupled electronic band structures for Cu2P, Ir2P and Rh2P, -dependent pseudopotentials were used to account for coupling between orbitals, as implemented in CASTEP v20.1. All band structures were calculated using paths generated with SeeK-path 36, with a -point spacing of 2 0.03 Å-1. The Cu -dependent pseudopotential required a higher plane wave kinetic energy cutoff of 1000 eV, while both Rh and Ir required only 500 eV.