Tunable coupling of two mechanical resonators by a graphene membrane
Abstract
Coupled nanomechanical resonators are interesting for both fundamental studies and practical applications as they offer rich and tunable oscillation dynamics.
At present, the mechanical coupling in such systems is often mediated by a fixed geometry, such as a joint clamping point of the resonators or a displacement-dependent force.
Here we show a graphene-integrated electromechanical system consisting of two physically separated mechanical resonators – a comb-drive actuator and a suspended silicon beam – that are tunably coupled by a graphene membrane.
The graphene membrane, moreover, provides a sensitive electrical read-out for the two resonating systems silicon structures showing 16 different modes in the frequency range from 0.4 to 24 MHz. In addition, by pulling on the graphene membrane with an electrostatic potential applied to one of the silicon resonators, we control the mechanical coupling, quantified by the -factor, from 20 kHz to 100 kHz. Our results pave the way for coupled nanoelectromechanical systems requiring controllable mechanically coupled resonators.
Keywords: Graphene, resonators, tunable coupling, NEMS, MEMS
Resonating silicon-based micro- and nanoelectromechanical systems can operate over a wide range of frequencies, varying from the kHz to the GHz regime, very much depending on the applications. This includes high-quality-factor band pass filters [1, 2, 3], signal amplifiers [4, 5], high-precision sensors (incl. biosensors) [6], or even logic gates [7]. Moreover, mechanically coupled resonators have attracted increasing attention thanks to their interesting dynamics [8, 9, 10, 11], improved performance and advanced tunability compared to single resonators [12]. The mechanical coupling between different resonators can be well-designed [13] and can be used e.g. as low-noise signal amplifier [14]. Yet, up to now, the coupling is mediated by a fixed geometric contact or clamping between the mechanical resonators or a position-dependent force, which limits the control over the coupling [15]. The implementation of an integrated and independent control of the mechanical coupling is still a major technological challenge. This is mainly a consequence of the missing frequency tunability of the constituent mechanical resonators and their weak vibration coupling [15].

Graphene-integrated nano-electromechanical systems are promising candidates for overcoming these limitations of silicon-based micro-electromechanical systems (MEMS). Graphene, an atomically thin crystal of carbon atoms, features a high mechanical strength [16, 17], an unprecedented high carrier mobility [18], and an highly sensitive electrical read-out scheme for its mechanical motion [19, 20, 21]. Moreover, the low mass density and the high Young’s modulus [22, 16] make graphene interesting for resonator based sensor applications [23], for example as force [24, 25, 26], ultrasound [27, 28, 29, 30] or pressure sensors [31]. There is also a growing interest to implement graphene as a mechanical element in silicon MEMS devices such as accelerometers [32, 33], since their high flexiblity allows for a considerable scaling down of the device footprint while maintaining high sensitivity. These prototype demonstrations show that graphene is an interesting candidate for the integration in MEMS as a motion sensor of spring. Despite its high flexibility and the large tuning range of stiffness, the implementation of graphene as a tunable spring and mechanical coupler in silicon based MEMS devices has up to now not been demonstrated.
Here we show that a suspended graphene membrane can be used to couple two physically separated mechanical resonators. Moreover, the graphene membrane simultaneously provides an electrical read-out scheme for the motion of both of these resonators. The mechanical coupling between the resonators, mediated by the graphene membrane, can be controlled over a wide range by an electrostatic potential, realizing substantially enhanced coupling, when compared to systems without integrated membranes [15].
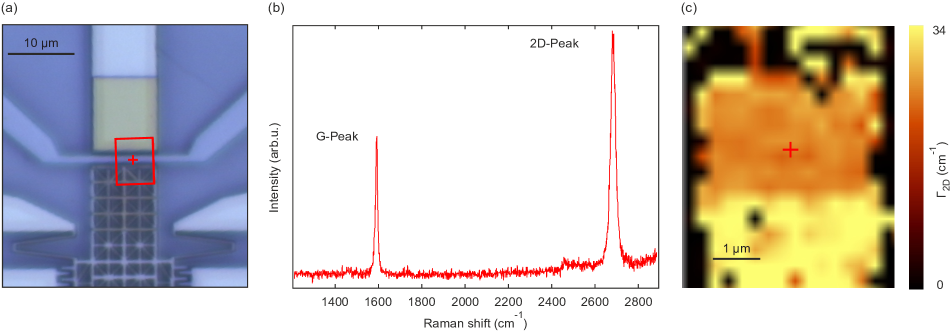
The device was fabricated by an electron-beam lithography (EBL) based structuring of a Cr/Au/Cr hard mask on a silicon-on-insulator substrate consisting of 725 m silicon, 1 m SiO and 2 m highly p-doped silicon followed by a deep reactive ion etching (DRIE) step, as described in detail in Refs. [34, 35]. The silicon beam (SB), which also functions as a bottom electrostatic gate for tuning the graphene properties, was fabricated by interrupting the DRIE step after etching 275 nm deep followed by the deposition of an additional Cr mask before etching completely through the highly p-doped silicon layer. After removal of the Cr, a graphene/PMMA stack is transferred on the patterned comb-drive (CD) actuator. Raman spectroscopy confirms the single-layer nature of the graphene flake (Supplementary Figure 1). By an additional EBL step we partly cross-link the PMMA to clamp the graphene membrane onto the actuator on one side and to a fixed anchor on the other side (Figures 1a to 1d). Finally, the actuator with the integrated graphene membrane is released from the substrate by removing the SiO layer with 10% hydrofluoric (HF) acid solution followed by a critical point drying (CPD) step. In the measurements presented here, the suspended graphene membrane has a length of m and a width of m (Supplementary Figure 1). The measurements were performed in a 3He/4He dilution refrigerator with a base temperature around 20 mK, unless otherwise stated.
Figures 1b and 1e depicts the electrical scheme of the measured device. A potential difference between the asymmetrically placed fingers of the CD actuator gives rise to an electrostatic force, that pulls the suspended comb in the -direction (see Fig. 1d and white arrow in Fig. 1b). Here, the capacitance and are given by the zeroth and the first order term in the displacement of the actuator in a series expansion of the parallel plate approximation for the capacitance between its fingers [34].
An AC potential on the suspended SB at frequency supplies an external force acting on the suspended graphene membrane. The mechanical displacement of the graphene perpendicular to the membrane plane (-direction, see Figure 1d) at frequency modulates its conductance . The other (in-plane) directions do not modulate the conductance and thus do not contribute to the signal [19]. As is usually in the MHz range, a drain-source bias is applied at a slightly different frequency to generate a down-mixed current passing the graphene membrane at a low, measurable frequency [36]:
| (1) |
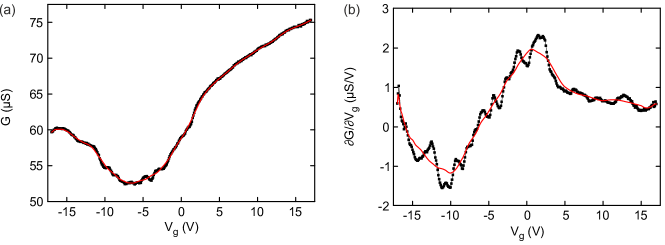
where is the applied DC potential on the SB acting as gate, and is the transconductance (Supplementary Figure 2). The capacitance fF and nF/m are given by the zeroth and the first order term in of an analytical series expansion of the parallel plate approximation for the capacitance between the suspended SB and the graphene membrane.
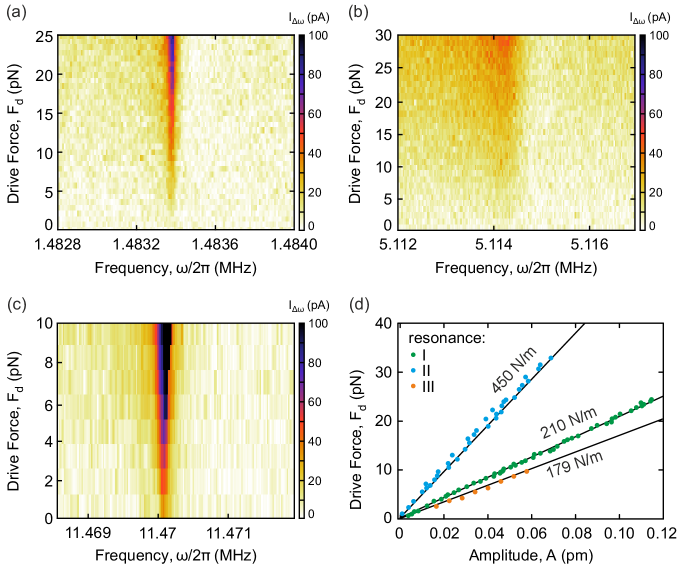
To extract the resonance frequencies of the device, we measure as a function of . The mechanical resonances are observed as dips and peaks in (see Figure 1f). We observe in total sixteen resonances in the range from to MHz. In this work, we focus on the three main resonances (labelled as I, II, and III). Corresponding close-ups are shown in Figure 1g. We fit the resonances with a nonzero-phase Lorentzian [36] to extract the resonance frequency , the quality factor , and the effective drive amplitude .
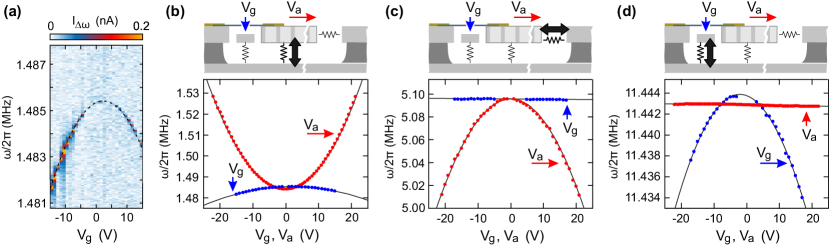
To understand the physical origin of the different resonances, we extract the effective masses and spring constants of the resonances from the tuning of the resonance frequencies with applied electrostatic potentials. Figure 2a shows the measured down-mixed current as a function of for V. From such data, we extract the dependencies of the resonance frequencies on the applied potentials. Figures 2b-d show the dependencies of resonances I, II, and III on (blue) and (red). Resonances I and III tune towards lower frequencies for increasing , whereas resonance II tunes towards lower frequencies for increasing . The tuning towards lower frequencies for increasing or suggests a dominating capacitive softening effect [37, 38, 39, 40]. Therefore, we fit the tuning of with [36]
| (2) |
where is the effective spring constant, is the effective mass, mF/m characterizes the capacitive softening of the actuator, and mF/m characterizes the capacitive softening of the graphene-SB capacitance (see Figure 1e). Here, denotes the second order term in of an analytical series expansion of the parallel plate approximation for . The fit results for the resonances I, II, and III are depicted by black lines in the lower panels of Figures 2b-d. The fit parameters are summarized in Supplementary Table 1. Resonances I and II have an effective mass of ng and ng, respectively, and that of resonance III is ng. We confirmed the extracted values for (and ) with a second independent measurement, in which we extracted the effective drive amplitude as a function of the driving force [36, 41] by varying for a fixed and (Supplementary Figure 3). In this measurement, the measured transconductance (Supplementary Figure 2), in combination with the applied potentials and the estimated capacitances allows us to quantitatively extract the physical vibration amplitudes contained in . The effective masses for our device are at least three orders of magnitude larger than the ones typically observed for graphene resonators [36], indicating that the graphene mass is irrelevant for the total device.
The effective masses of resonances I and II are comparable to the estimated mass of the CD actuator when taking a density of 2329 kg/m for the highly p-doped silicon leading to ng, in good agreement with the effective mass extracted from resonance I. The effective mass extracted from resonance II is roughly one-third of , which can be explained by the effective mass reduction for a doubly clamped beam [42] in its fundamental mode and thus highlights the importance of the mode shape. The effective mass extracted from resonance III is approximately equal to the estimated mass of the suspended silicon beam, ng. This suggests that the observed resonances can be attributed to resonances of the actuator and of the silicon beam, and not to the mechanical motion of the graphene membrane.
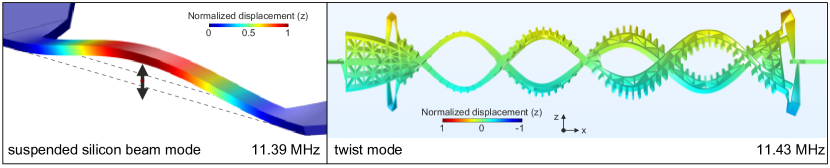
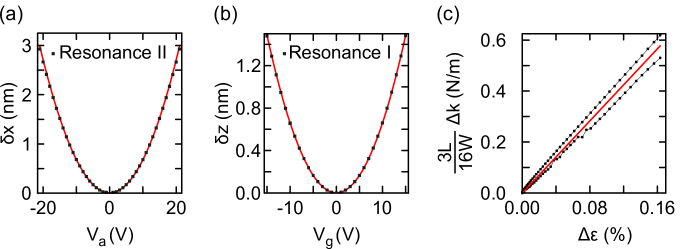
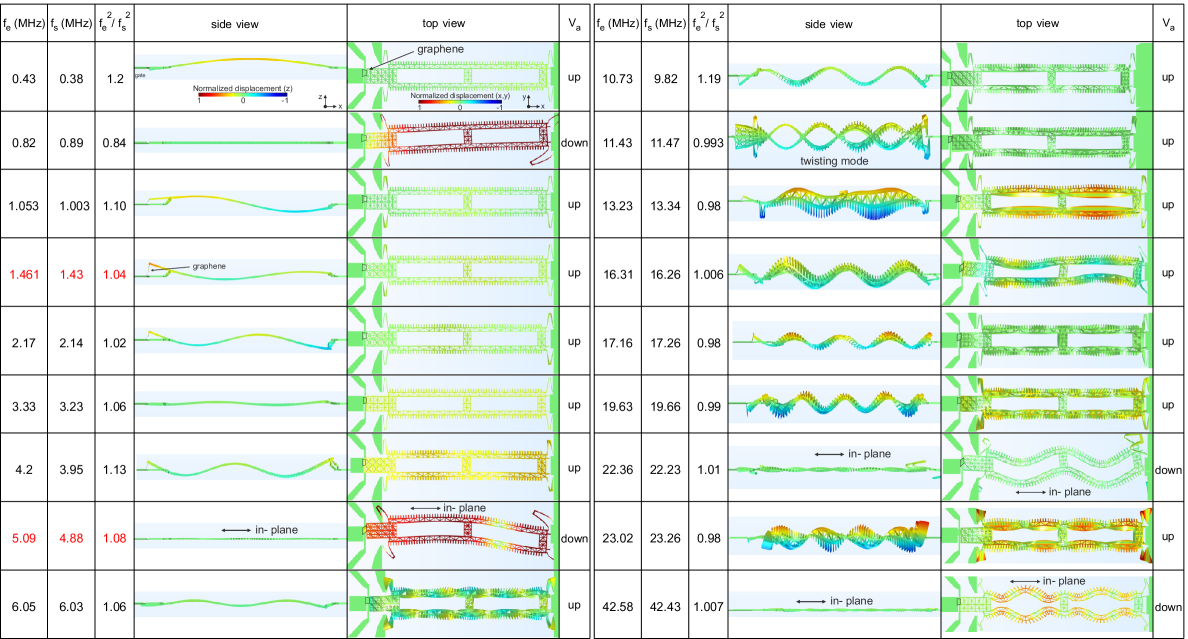
To verify the origin of the resonances and to clarify the mode shapes, we performed finite element calculations [43]. It is important to include the suspended graphene membrane in the simulations for two reasons: (i) we can only measure modes with an oscillation of the graphene membrane in the -direction (see equation 1) and (ii) the spring constant N/m of the silicon actuator in the -direction is much smaller than the expected spring constant N/m of the graphene membrane. Here we used the literature value N/m for the two-dimensional Young’s modulus of graphene that is expected at cryogenic temperatures [16, 44, 45]. The highly p-doped silicon has a Young’s modulus of 160 GPa [46, 47]. We find excellent agreement between all the measured and computed resonance frequencies: the ratio between them is on average (see Supplementary Table 2). The top panels in Figures 2b-d schematically illustrate the main vibrating components for resonances I, II, and III. We find that resonances I and II correspond to an out-of-plane and in-plane motion of the CD actuator. Resonance III is an out-of-plane mode of the silicon beam, which is supported by the absence of any tunablility with . Details of all computed frequencies and mode shapes are provided in Supplementary Table 2 (and Supplementary Figure 4). The computed mode shapes are consistent with the observed capacitive softening. In total we directly detect sixteen mechanical resonances of the CD actuator and one of the suspended silicon beam. As the observed frequency-tuning is in agreement with capacitive softening, we can use the extracted effective spring constants to determine the static displacements and . We compute these displacements by dividing the electrostatic forces and by the spring constant of the lowest in-plane and out-of-plane mode, respectively (Supplementary Figure 5). The in-plane displacement goes up to 3 nm and is in agreement with the related strain values extracted by Raman spectroscopy measurements on similar devices [34].
To understand the increase of resonance I with applied in Figure 2b, we now focus on the graphene membrane. As illustrated in the top panel of Fig. 2b, resonance I is dominated by a spring along the -direction, i.e. by an out-of-plane motion of the CD. Both the actuator and the graphene contribute to this spring. The contribution of the graphene membrane is known to be highly sensitive to the induced strain , and thus to a displacement [48, 49]. As the total spring constant is known from the resonance itself, and the in-plane displacement of the actuator as well as the dimensions of the graphene membrane are known, the only free parameter is the Young’s modulus of the graphene membrane (see Methods). Requiring the same in-plane actuator displacement for tuning resonance I as for tuning resonance II, we obtain an effective Young’s modulus of N/m (see Methods and Supplementary Figure 5), which is in good agreement with values reported in the literature [16, 44] and supports the used value in the finite element calculations. This type of analysis gives us a complete understanding of the mechanical behavior of the system.
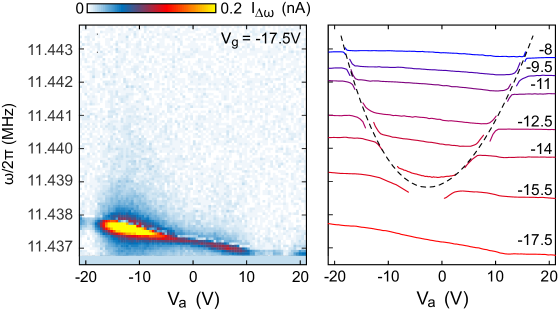
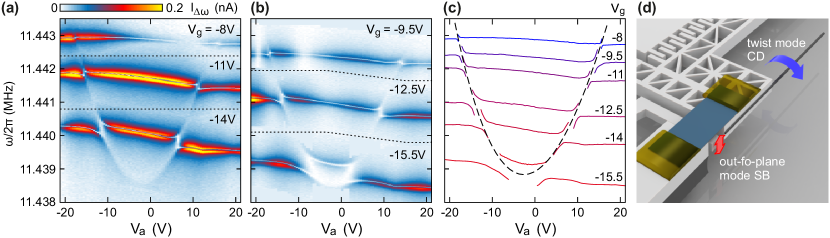
Let us next focus on the resonance III attributed to the suspended silicon beam. When measuring this resonance as a function of and , we observe the emergence of avoided crossings, which is a clear signature for two strongly coupled modes. Figures 3a and 3b show the down-mixing current as function of for various values (separated by dashed lines). We fit these measurements to extract the resonance frequency as function of for various values, which are plotted in Figure 3c. Remarkably, we only observe both interacting modes at the avoided crossings. This suggests that the graphene membrane has no measurable motion in the -direction for the mode with which the silicon beam is interacting. However, we can reconstruct the dependence of the mode with which the silicon beam is interacting by tracing the position of the avoided crossing as a function of , as indicated by the black dashed parabola in Figure 3c (for more data see Supplementary Figure 6). The computed resonance frequency spectrum of the CD actuator shows a twist mode close to the one of the suspended SB with negligible net graphene motion (displacement) in -direction. We thus attribute the avoided crossing to a strong coupling between the silicon beam and the twist mode of the CD actuator (see illustration in Fig. 3d).
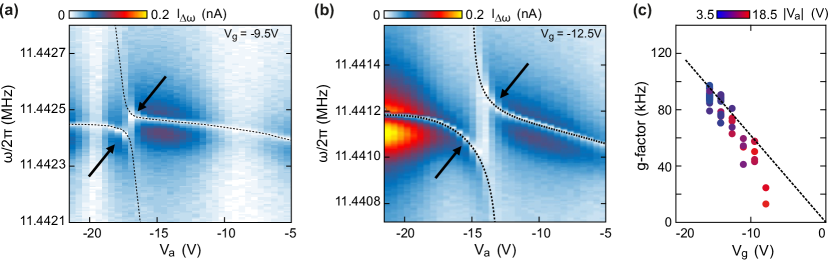
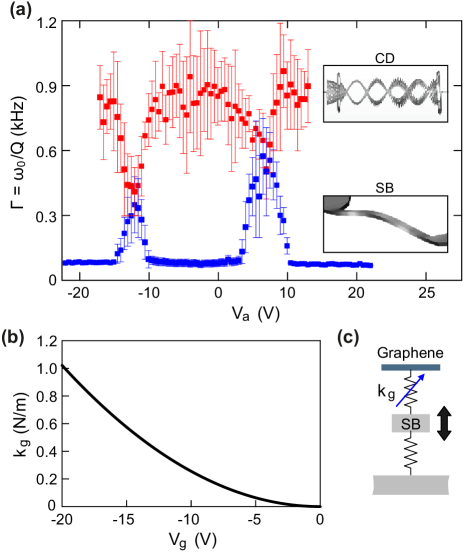
We extract the coupling strength between the modes, i.e. the so-called -factor [11], and linewidth from each individual avoided crossing (see close-ups in Figure 4a and 4b). Figure 4c shows that the strong coupling () between the modes is tunable with applied , i.e. by the electrostatic force between the silicon beam and the graphene membrane [11]. Figure 5a shows as function of highlighting that both modes fully hybridize with equal energy transfer between them [12], which is another sign of strong coupling. The linewidth comparison was performed on the data at V, which show the twist mode nearly over the full -range. The observed -factor is in agreement with the coupling expected from the electrostatic softening between the silicon beam and the graphene membrane, as shown in Figure 5b. Both the motion of (i) the silicon beam and (ii) the graphene membrane alter their separation, resulting not only in a shift of the resonance frequency, i.e. the well-known electrostatic softening [36], but also in a change of the coupling between the two resonators. Following equation (2), this coupling can be characterized by an effective spring constant (Figures 5b,5c). Then the -factor can be estimated without making any assumptions on the mode shape by . Here, the effective mass is the one of the hybridized modes. As the mass of the suspended silicon beam is much smaller than that of the twist mode, we set equal to the mass of the actuator. When using the estimated mass of the actuator ( ng) for as well as the value for mF/m given above, we find a remarkably good agreement with the experimentally extracted -factor and the computed one (see dashed line in Figure 4c). Thus, the suspended graphene membrane allows for a strong coupling between two physically separated resonators, and even allows for the tuning of this coupling by an applied voltage.
In summary, by taking advantage of the high sensitivity of graphene resonators, we implement and quantitatively validate a new coupling scheme for nano-electromechanical systems. The coupling strength can be tuned from 20 kHz to 100 kHz and be completely switched off by an electrostatic potential. We thus realise a maximal coupling of almost 1000 times larger than in systems without any integrated graphene membranes [15] and approximately equal to that obtained for spatially separated graphene resonators [9]. The resonators themselves are not affected by the light-weighted graphene membrane. This coupling scheme is on-chip, poses no restrictions on the choice of material for the connected masses. It is possibly scalable by means of integrated graphene obtained via chemical vapour deposition, and can be possibly extended using other conducting two-dimensional materials instead. The presented technique provides a platform to study the route to chaos in nonlinear dynamics by systematically measuring the orbit diagram [50]. Additionally, the presented scheme enables one to switch on and off the mechanical coupling, giving rise to read-out schemes for quantum states at a well defined time instant with minimal back-action effects at other times.
Methods. Young’s modulus extraction. The effective spring constant is given by the one of the actuator in parallel to the out-of-plane stiffness of the graphene membrane. The out-of-plane stiffness of the graphene membrane depends on the pre-strain [36]. For a fixed , we find a direct relation between the strain induced by the actuator and the change of the out-of-plane spring constant of the graphene membrane:
| (3) |
Here, () is the width (length) of the suspended graphene membrane. Note that we neglect the increase in strain by pulling upon the graphene with for two reasons: Firstly, is constant, and secondly, the in-plane spring constant of the CD actuator ( N/m) is much smaller than the expected in-plane spring constant of the graphene membrance ( N/m), thereby minimising the strain induced with . We extract and experimentally and determine and from optical and scanning electron microscope images, which leaves as the only free parameter. We extract from the in-plane modes of the CD actuator. The induced strain is then simply . We then determine from the observed increase in resonance frequency of the out-of-plane mode:
| (4) |
In Supplementary Figure 5, we plot as a function of , such that the slope is directly providing .
Data Availability The data that support the findings of this study are available from the corresponding author upon reasonable request.
Associated Content The Supporting Information is available free of charge on the ACS Publications website at DOI:
Author Information
Author Contribution GV and MG executed the experiments. GV designed the experiments and analysed the data. MG, JS, and TK fabricated the devices. NvdD and DB provided support in device fabrication. CS supervised the overall project. All authors contributed to writing and reviewing the paper.
Corresponding Author Correspondence and requests for materials should be addressed to G.V. (email: G.J.Verbiest@tudelft.nl).
Notes The authors declare that there are no competing interests.
Acknowledgements The authors thank F. Haupt for help on the manuscript, R. Dolleman and M. Siskins for proof-reading, and S. Staacks for help on the figures. Support by the ERC (GA-Nr. 280140), the Helmholtz Nanoelectronic Facility (HNF) [51] at the Forschungszentrum Jülich, and the Deutsche Forschungsgemeinschaft (DFG) (STA 1146/12-1) are gratefully acknowledged. G.V. acknowledges funding by the Excellence Initiative of the German federal and state governments.
References
- [1] Yang, L.-J., Huang, T.-W. & Chang, P.-Z. Cmos microelectromechanical bandpass filters. Sensors and Actuators A: Physical 90, 148–152 (2001).
- [2] Gouttenoire, V. et al. Digital and fm demodulation of a doubly clamped single-walled carbon-nanotube oscillator: Towards a nanotube cell phone. Small 6, 1060–1065 (2010).
- [3] Piekarski, B., DeVoe, D., Dubey, M., Kaul, R. & Conrad, J. Surface micromachined piezoelectric resonant beam filters. Sensors and Actuators A: Physical 91, 313 – 320 (2001).
- [4] Mathew, J., Patel, R., Borah, A., Vijay, R. & Deshmukh, M. Dynamical strong coupling and parametric amplification of mechanical modes of graphene drums. Nat. Nanotech. 11, 747–751 (2016).
- [5] Karabalin, R. et al. Signal amplification by sensitive control of bifurcation topology. Phys. Rev. Lett. 106, 094102 (2011).
- [6] Bogue, R. Recent developments in mems sensors: a review of applications, marketsand technologies. Sensor Review 33, 300–304 (2013).
- [7] Tsai, C.-Y., Kuo, W.-T., Lin, C.-B. & Chen, T.-L. Design and fabrication of mems logic gates. Journal of Micromechanics and Microengineering 18, 045001 (2008).
- [8] Okamoto, H. et al. Coherent phonon manipulation in coupled mechanical resonators. Nat. Phys. 9, 480–484 (2013).
- [9] Luo, G. et al. Strong indirect coupling between graphene-based mechanical resonators via a phonon cavity. Nat. Commun. 9, 1–4 (2018).
- [10] Deng, G.-W. et al. Strongly coupled nanotube electromechanical resonators. Nano Lett. 16, 5456–5462 (2016).
- [11] Verbiest, G. et al. Tunable mechanical coupling between driven microelectromechanical resonators. Appl. Phys. Lett. 109, 143507 (2016).
- [12] Teufel, J. et al. Circuit cavity electromechanics in the strong-coupling regime. Nature 471, 204 (2011).
- [13] Singh, R., Nicholl, R., Bolotin, K. & Ghosh, S. Motion transduction with thermo-mechanically squeezed graphene resonator modes. Nano Letters 18, 6719–6724 (2018).
- [14] Singh, R. et al. Giant tunable mechanical nonlinearity in graphene-silicon nitride hybrid resonator. arxiv: 1904.01613 (2019). URL https://arxiv.org/abs/1904.01613.
- [15] Okamoto, H. et al. Coherent phonon manipulation in coupled mechanical resonators. Nat. Phys. 9, 1745–2481 (2013).
- [16] Lee, C., Wei, X., Kysar, J. & Hone, J. Measurement of the elastic properties and intrinsic strength of monolayer graphene. Science 321, 385–388 (2008).
- [17] Tomori, H. et al. Introducing nonuniform strain to graphene using dielectric nanopillars. Appl. Phys. Express 4, 075102 (2011).
- [18] Mayorov, A. et al. Micrometer-scale ballistic transport in encapsulated graphene at room temperature. Nano Lett. 11, 2396 (2011).
- [19] Chen, C. et al. Graphene mechanical oscillators with tunable frequency. Nat. Nanotech. 8, 923–927 (2013).
- [20] Katsnelson, M. Graphene: carbon in two dimensions. Materials Today 10, 20–27 (2007).
- [21] de Juan, F., Mañes, J. & Vozmediano, M. Gauge fields from strain in graphene. Phys. Rev. B 87, 165131 (2013).
- [22] Novoselov, K. et al. Electric field effect in atomically thin carbon films. Science 306, 666–669 (2004).
- [23] Lemme, M. et al. Nanoelectromechanical sensors based on suspended 2d materials. Research 2020 (2020).
- [24] Mashoff, T. et al. Bistability and oscillatory motion of natural nanomembranes appearing within monolayer graphene on silicon dioxide. Nano Letters 10, 461–465 (2010).
- [25] Chen, C. & Hone, J. Graphene nanoelectromechanical systems. Proceedings of the IEEE 101, 1766–1779 (2013).
- [26] Chaste, J. et al. A nanomechanical mass sensor with yoctogram resolution. Nat. Nanotech. 7, 301–304 (2012).
- [27] Verbiest, G. et al. Detecting ultrasound vibrations by graphene resonators. Nano Lett. 29, 375301 (2018).
- [28] Laitinen, A. et al. A graphene resonator as an ultrasound detector for generalized love waves in a polymer film with two level states. Journal of Physics D: Applied Physics 52, 24LT02 (2019).
- [29] Todorović, D. et al. Multilayer graphene condenser microphone. 2D Materials 2, 045013 (2015).
- [30] Xu, Y. et al. Radio frequency electrical transduction of graphene mechanical resonators. Appl. Phys. Lett. 97, 243111 (2010).
- [31] Dolleman, R. J., Davidovikj, D., Cartamil-Bueno, S. J., van der Zant, H. S. J. & Steeneken, P. G. Graphene squeeze-film pressure sensors. Nano Letters 16, 568–571 (2016). URL https://doi.org/10.1021/acs.nanolett.5b04251. PMID: 26695136, eprint https://doi.org/10.1021/acs.nanolett.5b04251.
- [32] Hurst, A., Lee, S., Cha, W. & Hone, J. A graphene accelerometer. In 2015 28th IEEE International Conference on Micro Electro Mechanical Systems (MEMS), 865–868 (2015).
- [33] Fan, X. et al. Graphene ribbons with suspended masses as transducers in ultra-small nanoelectromechanical accelerometers. Nat. Electron. 2, 394–404 (2019).
- [34] Goldsche, M. et al. Tailoring mechanically tunable strain fields in graphene. Nano Lett. 18, 1707–1713 (2018).
- [35] Goldsche, M. et al. Fabrication of comb-drive actuators for straining nanostructured suspended graphene. Nanotechnology 29, 375301 (2018).
- [36] Chen, C. et al. Performance of monolayer graphene nanomechanical resonators with electrical readout. Nat. Nanotech. 4, 861–867 (2009).
- [37] Wu, C. & Zhong, Z. Capacitive spring softening in single-walled carbon nanotube nanoelectromechanical resonators. Nano Lett. 11, 1448–1451 (2011).
- [38] Eichler, A. et al. Nonlinear damping in mechanical resonators made from carbon nanotubes and graphene. Nat. Nanotech. 6, 339–342 (2011).
- [39] Song, X. et al. Stamp transferred suspended graphene mechanical resonators for radio frequency electrical readout. Nano Lett. 12, 198–202 (2011).
- [40] Kozinsky, I., Postma, H., Bargatin, I. & Roukes, M. Tuning nonlinearity, dynamic range, and frequency of nanomechanical resonators. Appl. Phys. Lett. 88, 253101 (2006).
- [41] Sazonova, V. et al. A tunable carbon nanotube electromechanical oscillator. Nature 431, 284–287 (2004).
- [42] Hauer, B., Doolin, C., Beach, K. & Davis, J. A general procedure for thermomechanical calibration of nano/micro-mechanical resonators. Annals of Physics 339, 181 – 207 (2013). URL http://www.sciencedirect.com/science/article/pii/S0003491613001723.
- [43] URL https://www.comsol.com/.
- [44] Liu, K. & Wu, J. Mechanical properties of two-dimensional materials and heterostructures. J. Mater. Sci. 31, 832–844 (2016).
- [45] Nicholl, R. et al. The effect of intrinsic crumpling on the mechanics of free-standing graphene. Nat. Commun. 6, 8789 (2015).
- [46] Hopcroft, M., Nix, W. & Kenny, T. What is the young’s modulus of silicon? J. Microelectromech. Syst. 19, 229–238 (2010).
- [47] Li, X., Ono, T., Wang, Y. & Esashi, M. Ultrathin single-crystalline-silicon cantilever resonators: fabrication technology and significant specimen size effect on young’s modulus. Appl. Phys. Lett. 83, 3081–3083 (2003).
- [48] Lau, C., Bao, W. & Velasco Jr, J. Properties of suspended graphene membranes. Mater. Today 15, 238–245 (2012).
- [49] López-Polín, G. et al. The influence of strain on the elastic constants of graphene. Carbon 124, 42–48 (2017).
- [50] Strogatz, S. Nonlinear Dynamics And Chaos: With Applications To Physics, Biology, Chemistry, And Engineering (Studies in Nonlinearity) (Westview Press, 2001).
- [51] Journal of large-scale research facilities 3, A112 (2017). Research Center Jülich GmbH. (2017). HNF - Helmholtz Nano Facility.
- [52] Hao, Y. et al. Probing layer number and stacking order of few-layer graphene by raman spectroscopy. Small 6, 195–200 (2010). URL https://onlinelibrary.wiley.com/doi/abs/10.1002/smll.200901173. eprint https://onlinelibrary.wiley.com/doi/pdf/10.1002/smll.200901173.