Contribution of operando X-ray experiments and modeling to the understanding of the heterogeneous lithiation of graphite electrodes
Broader Context
Graphite, alone or blended with silicon, is by far the most used anode material in lithium-ion batteries. To safely enable the fast charge of the high energy density cells designed for the electric vehicle market, one must control the lithium concentration gradients that form across the electrode thickness. Simulations of this phenomenon have been reported in the literature. Experimental validation at the local scale remains however hampered by the required spatial and temporal resolutions. Here, we report on an operando synchrotron x-ray diffraction experiment that fulfills these requirements to measure locally and quantitatively the LixC6 phases formed during cycling. The lithium concentration evolution across the electrode thickness follows a very particular pattern with alternating sequences of homogeneous and heterogeneous lithium distributions. The comparison with simulation results comforts modeling predictions at low Li content, but calls for revisiting the balance between the physical driving forces at higher stoichiometries. Experimental observations and theoretical predictions are reconciled by considering a reduction of the insertion kinetics during the LiC6/LiC12 transition. This finding may have important consequences as negative potentials, which favors the formation of lithium deposits, would be reached for much lower electrode thickness and C-rate than what is currently predicted with classical models.
Abstract
Distributions of potential and lithium content inside lithium ion batteries highly affects their performance and durability. An increased heterogeneity of the lithium distribution is expected in thick electrodes with high energy densities or cycling at high currents. To optimize electrodes and cells designs, it is crucial to probe lithium concentration gradients across the depth of the electrode, but also to predict their occurrence and magnitude as a function of materials properties. Here, we follow the lithium distribution across a thick porous graphite electrode using a focused synchrotron X-ray beam. The sequential formation of the individual LixC6 phases during lithium de-insertion is extracted from X-ray diffraction patterns, allowing the quantification of lithium concentration across the electrode thickness. Analyzing the evolution of heterogeneities as a function of time, we recover the striking features we predicted with a porous electrode model, including the succession of homogeneous and heterogeneous distributions of lithium. However, a clear difference is obtained at high stoichiometry, with a much more homogeneous distribution than initially predicted. Revisiting the interplay between transport and kinetic transfers limitations in the porous electrode model, we suggest that the kinetics of lithium (de)-insertion is highly reduced during the LiC6/LiC12 phase transition.
1 Introduction
Li-ion batteries (LiB) are now ubiquitous in consumer electronics and there is a strong demand from the automotive sector for devices charging faster (e.g. using larger currents) and with a larger capacity (e.g. using thicker electrodes). 1, 2 However, large current densities and thick electrodes are expected to increase Li concentration gradients across the electrode.3, 4, 5 Such an heterogeneous intercalation of Li can be highly detrimental to the cells performance and durability. Indeed, the distribution of corresponding overpotentials leads to electrode polarization and may results in either Li plating during charge or drastically reduced capacity. As a consequence, some volumes of the electrode may reach higher states of charge and thus age faster, while others may not be used to their full capacity. Additionally, gradients in Li concentration might induce strain and stress gradients that can result in electrode pulverization and electrical disconnection.6
Predicting the amplitude of such Li concentration gradients inside electrodes is key for cell design optimization but remains challenging. In fact, these gradients result from the complex interaction between various physical phenomena, i.e. lithium (de)-intercalation in the active material, or lithium transport in both the active materials and the electrolyte filling the pores of the electrode. In particular, the latter is strongly impacted by the thickness, porosity and tortuosity of the electrode.7 Theoretical studies can help quantifying the concentration gradients, based on the porous media approach of Newman-type models8, 9 or direct simulations of lithium transport and intercalation in detailed 3D microstructure4, 10. However, the reliability of these models strongly depends on the consolidated knowledge of the materials transport and intercalation properties. Given the experimental difficulties to measure all parameters individually,11 simplifications and fittings are often performed. The validity of the model is usually checked a posteriori by the comparison of the simulated cell voltages with electro-chemical measurements only at the cell scale, since there is a dearth of validation data at the particles and electrode scale.
From the electrode perspective, graphite is the most widely used active material for LiB. However the simulation of lithium (de)-intercalation in graphite active materials remains complex as it happens through a succession of different Li ordering between the graphene planes, leading to several phase transitions, 12, 13 whose dynamics are still insufficiently understood.14 While most models use a solid solution description and Fick’s law to simulate the lithium diffusion inside the graphite, more recent works incorporate the dynamics of phase transitions using multi-layer phase field theory to capture the evolution of the phase fronts.15, 16 These new approaches are still under development at the particles scale and are difficult to transpose to the whole electrode level. Nevertheless, some recent works have combined phase field description in active materials with a porous description of the electrode.15, 17 Furthermore, Thomas-Alyea et al. have shown that both solid solution and phase field approaches give very similar results for the particle average Li concentration and cell potential in out-of-equilibrium conditions,17 thus confirming the relevance of a Newman-type model with a solid-solution description to capture the evolution of these quantities.
Using a Newman-type model and a solid-solution approach, we predicted that lithiation in graphite electrodes occurs with a succession of homogeneous and heterogeneous lithium distributions over the thickness of the electrode, with the maximum heterogeneities happening during the plateaus of the graphite equilibrium voltage curve.5 The corresponding simulated electrochemical results (potential, Li content) were validated at the electrode scale, i.e. averaged over the whole electrode, by comparison with experimental cell electrochemical measurements. However, it is much harder to confirm the lithium distribution predicted by the simulations at a lower scale, e.g. across the thickness of the electrode, as one needs both a local, micron-sized probe and an electrochemical cell that allows the measurements to be performed during battery cycling.
To probe heterogeneous graphite lithiation, several in situ and operando experiments have been performed using optical microscopy and taking advantage of the different colors of the lithiated graphite phases.18, 19, 20 This method yields interesting qualitative information about phase front evolution inside graphite electrodes, but the method hardly separates contributions from mixed phases. Very recently, more quantitative results have been obtained in an operando X-ray diffraction experiment with a depth resolution of 20m in the graphite electrode.21 Focusing on the quantification of lithium gradients that develop in a porous graphite electrode, Yao et al. 21 reported a complex dynamic during the partial charging or discharging of their 114 m thick graphite electrode. The observed dynamic seemed to include the succession of homogeneous/heterogeneous Li distributions, although the spatial resolution was not sufficient for a detailed quantification.
Here we report on operando microfocused synchrotron X-ray diffraction measurements to quantify the succession of LixC6 phases formed during a complete (de)lithiation across the thickness of a graphite electrode at the micron scale. We describe the obtained experimental results, focusing our analysis on the quantification of the heterogeneities that develop through the thickness of the electrode during (de)lithiation. The experimental results are confronted to numerical predictions obtained with a porous electrode model and we further discuss how these experimental results imply revisiting some assumptions of the model. In particular, we propose a new shape for the exchange current density, beyond the classical Butler-Volmer model.
2 Modeling and experiment
2.1 Electrode model and heterogeneity quantification
We use a graphite electrode model based on the porous electrode theory, originally introduced by Newman and Tiedemann.8 The resolved equations are classical and details about the model calibration and validation can be found in Dufour et al.5 To quantify the heterogeneity of lithium concentration upon cycling, we introduce the Normalized Absolute Averaged Deviation (NAAD):22
| (1) |
where is the electrode thickness, is the lithium concentration at position , and is the mean lithium concentration over the electrode thickness. The NAAD is a direct quantification of the lithium homogeneity within the electrode: a small (large) NAAD indicates an homogeneous (heterogeneous) electrode lithiation.
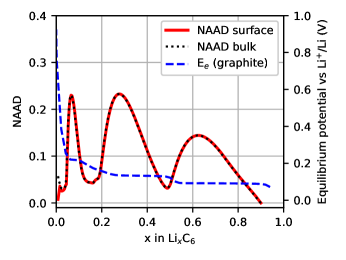
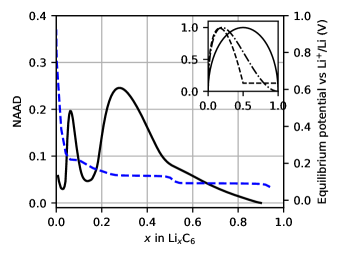
In numerical models, the NAAD can be computed either for the lithium concentration at the surface of the active particles or for the mean lithium concentration inside the particles, as both quantities can be accessed. In Dufour et al, we computed the NAAD of the lithium at the surface of the graphite particles () while focusing on the mechanisms at the origin of the different resistances inside the electrode.5 We predicted the occurrence of successive heterogeneous and homogeneous distribution during lithiation of the graphite electrode. Using the same model, we show here that similar NAAD patterns are obtained for lithium concentration at the surface of the particles and inside the particles (figure 1), as long as the diffusion inside the graphite particles is not the limiting factor. More precisely, the predicted NAAD pattern has a particular wave shape with three maxima located around equals 0.06, 0.27 and 0.61, and three minima, located around 0.03, 0.15 and 0.49. The position of these extrema is strongly correlated with the graphite equilibrium potential, also displayed in figure 1, which presents three plateaus and three transition regions. For states of charge corresponding to a plateau region, there is no modification of the equilibrium potential upon delithiation, thus no potential modification, while transporting lithium from the back of the electrode is a source of overpotential. This promotes lithiation disparities along thickness, and thus a maximum NAAD. On the contrary, on a transition region between two plateaus, transport of lithium from the back of the electrode can induce less potential differences than the transition from one plateau to the next one, boosting the return to a homogeneous distribution of lithium through the electrode thickness and thus a minimum NAAD.
2.2 Cell design and materials
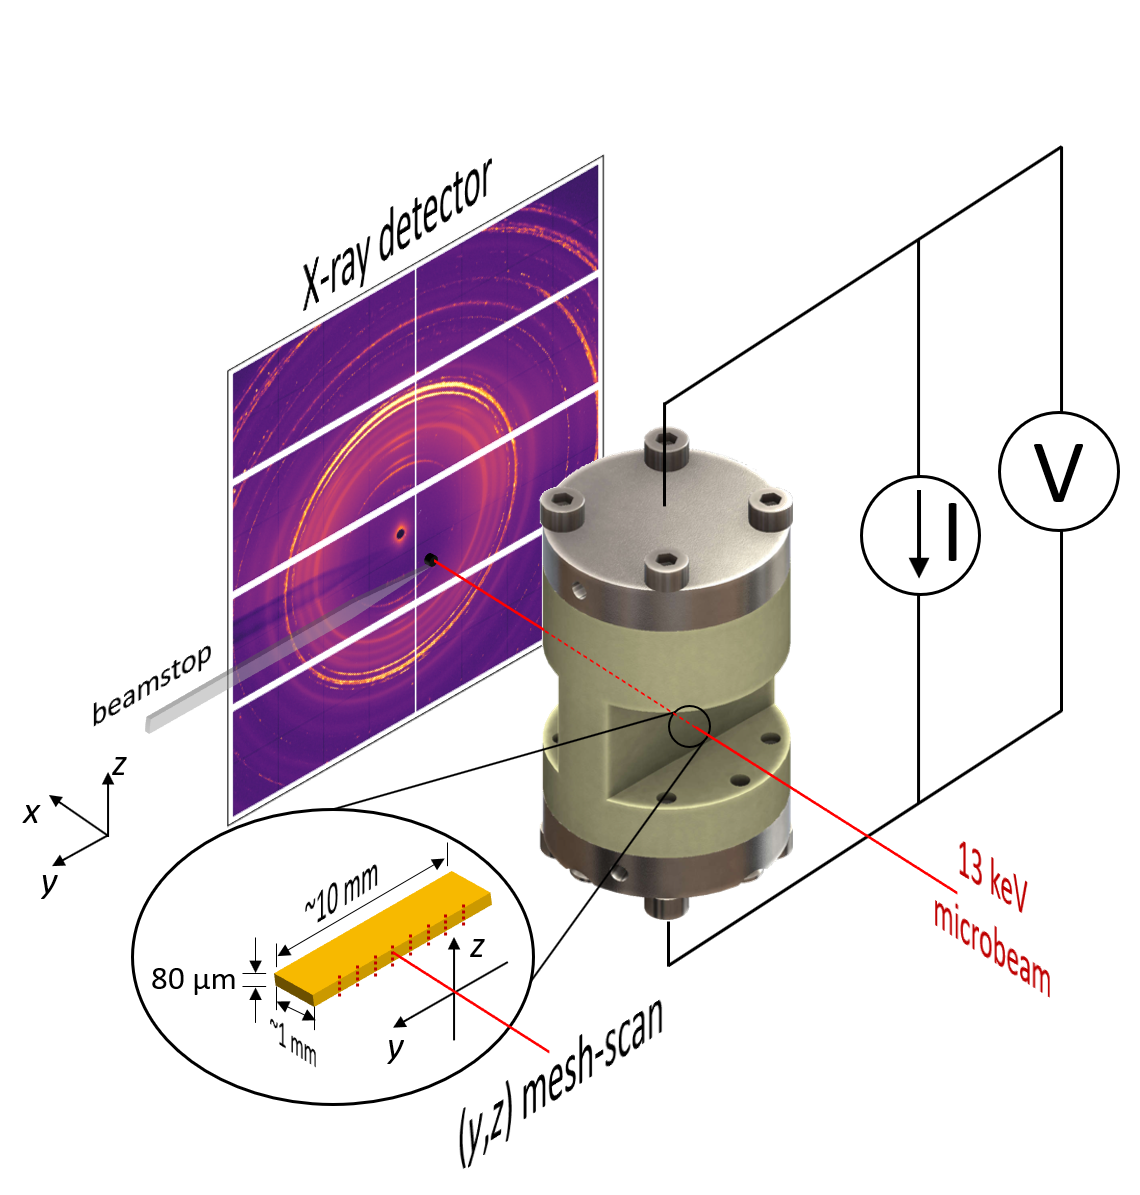
An operando electrochemical cell has been designed to perform the local microdiffraction measurements needed to validate the lithium heterogeneities predicted by the model. The cell body comprises 200 m-thick X-ray transparent polyetheretherketone (PEEK) entry and exit windows, as shown in figure 2. The electrochemical cell was assembled in a glovebox and consisted of the graphite electrode, which is roughly 80 m-thick, two microporous Celgard 2500 separators of 25 m thickness each, and a 250 m-thick metal lithium foil. The graphite electrode, which was roughly 1 cm-long in the direction perpendicular to the beam contains 96%wt of SLP30 graphite powder from TIMCAL, 2.5%wt conductive carbon particles and 1.5%wt of polymer binder coated on a 15 m-thick copper foil current collector. To reduce as much as possible the attenuation of the beam and to limit the parallax effects, the graphite electrode was only 1 mm large in the direction of the beam. The areal capacity of the electrode was around 4.5 mAh.cm-2. A thick lithium foil was used for the counter electrode since its transparency to the beam prevents the diffracted beam from being masked by the upper stainless steel cap while measuring the graphite electrode region close to the separator. The cell was filled with 1M LiPF6 in 1:1:1 volume proportion of ethylene carbonate (EC), ethyl methyl carbonate (EMC) and dimethyl carbonate (DMC).
2.3 Cycling conditions
The cycling tests have been conducted at room temperature using a VSP potentiostat from Biologic. The graphite electrode was cycled once and relithiated prior to the diffraction experiment, the detailed procedure is reported in the Supplementary Information. It was then delithiated during the diffraction experiment at a constant current of 0.1 mA, corresponding roughly to C/5, between 0 V and 1.5 V.
2.4 Microdiffraction experiment
The microdiffraction data were collected on the ID13 beamline at the European Synchrotron Radiation Facility (Grenoble, France). The X-ray beam energy was set to 13 keV () to reduce the attenuation of the different cell components while maintaining the focusing ability. A two-dimensional Dectris EIGER 4M pixel detector was placed 175 mm behind the electrochemical cell. The exact position of the detector was calibrated prior to the experiment using Al2O3 powder. The cell was mounted on a stepper motor to control its exact position, to allow a very fast displacement, and to scan it in both and directions (figure 2). The microfocus probe size at the sample location was 1 m1 m and the cell was repeatedly scanned over a mesh of 8 points along (width) and 51 points along (thickness). These 8 51 measures will be also referred as one scan, hereafter. The step size was 3 m and the step size was 500 m. We used such a large step and shifted the points between each mesh by 5 m (and circling back every 48 meshes) in order to avoid repeated measurements over the exact same region, i.e. to distribute the dose over the electrode. An exposure time of 10 ms was sufficient for the acquisition of the diffraction powder pattern at each location. The total time for a complete mesh was about 110 s, i.e. including motors movements and deadtime.
3 Results
3.1 Electrode-averaged analysis
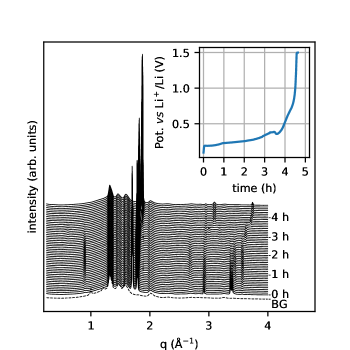
An overview of the evolution of the state of the whole electrode during the delithiation can be obtained by averaging the measurements of each scan, as shown in figure 3. The high intensity peaks between and correspond to reflections on successive graphene planes, i.e. d-spacing between (LiC6 ) and (graphite ). Second higher order reflections (e.g. LiC6 , graphite ) can also be seen at twice the q-values, between and . Additional peaks with in-plane components ( or ) are visible around (e.g. LiC6 at , graphite at ). The intense peaks as well as the diffuse one between and stem from the PEEK of the cell windows, as indicated by a measurement above the electrode, through the separator (dashed line in figure 3). Note that if present, Li metal would appear at or . The inset in figure 3 shows the simultaneous evolution of the potential as a function of the elapsed time. As expected for a delithiation reaction, the potential rises from a low voltage value to the higher cut-off potential (1.5 V).
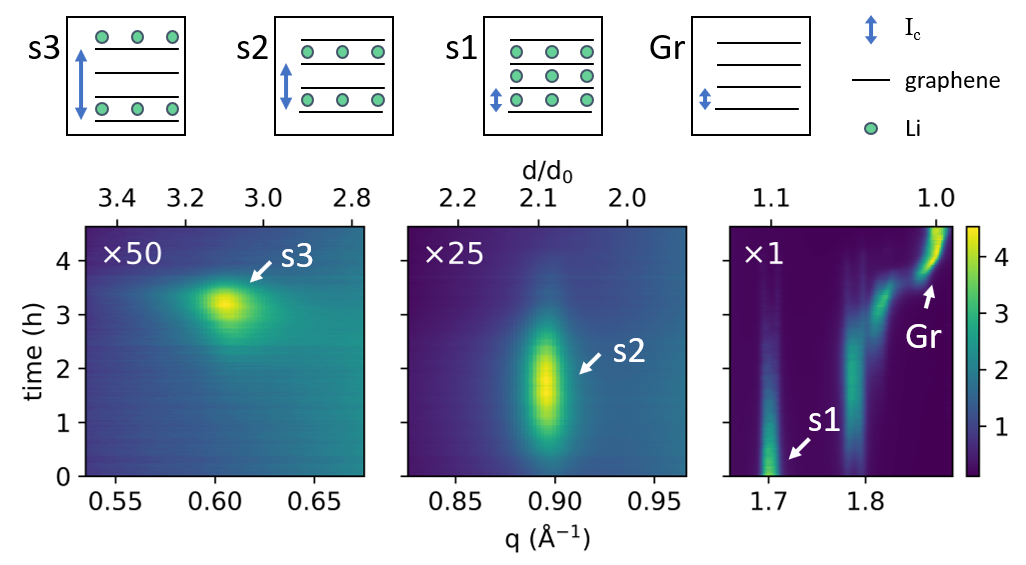
The different lithiation stages can be readily identified by the examination of reflections on planes separated by about times the graphite interlayer distance (i.e. the repetition length along the axis), independently of their composition or detailed crystalline structure. Figure 4 shows a map of the intensity around selected values corresponding to 3, 2 and 1 times the interlayer d-spacing in empty graphite (). Note that no peak could be resolved above the background level for . At the beginning of the measurement ( h), when the graphite electrode is almost fully lithiated, the intensity is maximum around , i.e. an interlayer distance of about . This indicates a stage 1 lithiation, with the graphite dilated by about 10 along the c axis. During the delithiation, this peak fades away and a new peak appears at a d-spacing of ( h to h), corresponding to the stage 2. Similarly, when this latter peak decreases, another peak appears at a d-spacing of about ( h to h), indicating a transition to stage 3. Finally the stage 3 disappears, and a new peak appears at a d-spacing slightly larger than and shifts towards by the end of the delithiation ( h), marking the transition to the stage 1d (dilute) and then pure graphite. As seen on the right panel of figure 4, reflections on successive graphene planes are also seen for stage 2 and 3, at and , corresponding to , i.e. , and , i.e. , respectively.
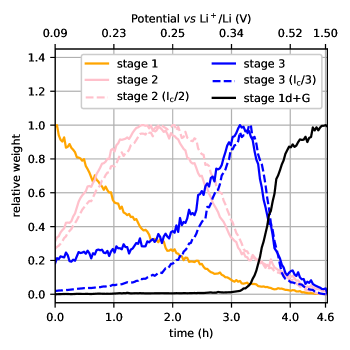
Once the different stages have been identified, the relative contribution of each stage to the overall electrode state has been estimated by comparing the relative variations of the integrated intensity around the corresponding values (stage 1 from to , stage 2 from to , stage 3 from to , stage dilute and graphite from to ). The corresponding integrated intensities are shown in figure 5, where the minimum and maximum values for each curve have been arbitrarily set to 0 and 1, respectively. A clear succession of stages of increasing order can be observed during the delithiation, with each stage reaching successively a peak in maximum proportion. The stage 2 and 3 can also be estimated from the integrated intensity around reflections on successive graphene planes (i.e. from to for , and from to for , for stage 2 and 3, respectively). The relative maxima of stage 2 and 3 composition calculated in this fashion are slightly shifted towards later times: while the intensity is much larger for those reflections, they are very close together and it can be difficult to separate successive contributions. The initial composition is mostly stage 1, as expected from the preliminary lithiation of the electrode. However, the stage 2 proportion is not at its minimum, suggesting that the electrode was not fully lithiated. Initial stage 3 content is around zero according to the integrated intensity around . The non-vanishing initial stage 3 content measured from the fundamental reflection () stems from the poor signal-to-background ratio for this weak reflection and thus a high sensitivity to small background variations. In the following we base our analysis on the most intense reflections (q between and ). In conclusion of the electrode-averaged analysis, the electrochemical performances of the operando cell were satisfactory and we observed the expected structural evolution, in agreement with the literature. 23, 24, 12, 25, 13, 26, 27, 28, 29, 30, 31, 32, 33, 34, 35, 36
3.2 Depth-resolved analysis
Now that we have shown the overall evolution of the electrode, we turn to a depth-resolved description. The depth distribution of each phase can be obtained similarly as before by integrating the intensity over values around each peak for each position of each scan, only keeping the averaging along . The results are shown in figure 6, using the same normalization between 0 and 1 as in figure 5. The Li metal counter electrode can be observed in the top part of the intensity map, and we can resolve the deposition of Li metal during the delithiation as the thickness of the electrode linearly increases over time. No traces of Li metal could be observed elsewhere, either in the graphite electrode or in the separators. In the intensity map from the PEEK windows of the cell, the shadow of the more absorbing graphite electrode and Cu current collector are clearly visible. The distance between the surface of the graphite electrode () and the surface of the Li metal () corresponds to the thickness of the two -thick Celgard separators. The interface of the graphite electrode with the separator constantly shifts towards lower values while the interface with the Cu current collector stays constant. This indicates that the thickness of the graphite electrode decreases over time, while Li is extracted and deposited on the counter electrode, as expected. The shape of the electrode shadow over time was therefore used as a mask for the intensity map of stages 1, 2, 3, and dilute + graphite. In the initial state, the electrode is an uniform stage 1 state, though the stage 2 intensity is not at its minimum, as discussed above. As the delithiation begins, the stage 1 content decreases while the stage 2 content increases in a seemingly homogenous fashion across the thickness of the electrode, up to about h. Then, the stage 2 content starts decreasing and the stage 3 content starts increasing from the surface. The transition takes some time to reach the current collector at the bottom of the electrode, as can be seen from the slanted shape of the color map between roughly h and h. Similarly, the stage dilute + graphite starts to appear on the surface while the stage 3 content decreases. Stage dilute + graphite progresses towards the current collector over time, between roughly h and h. The propagation of the transition from stage 3 to stage dilute + graphite from the electrode surface to the current collector is thus faster than the previous one, as seen from the more vertical slope. At the end of the delithiation, the electrode is in a homogeneous graphite state.
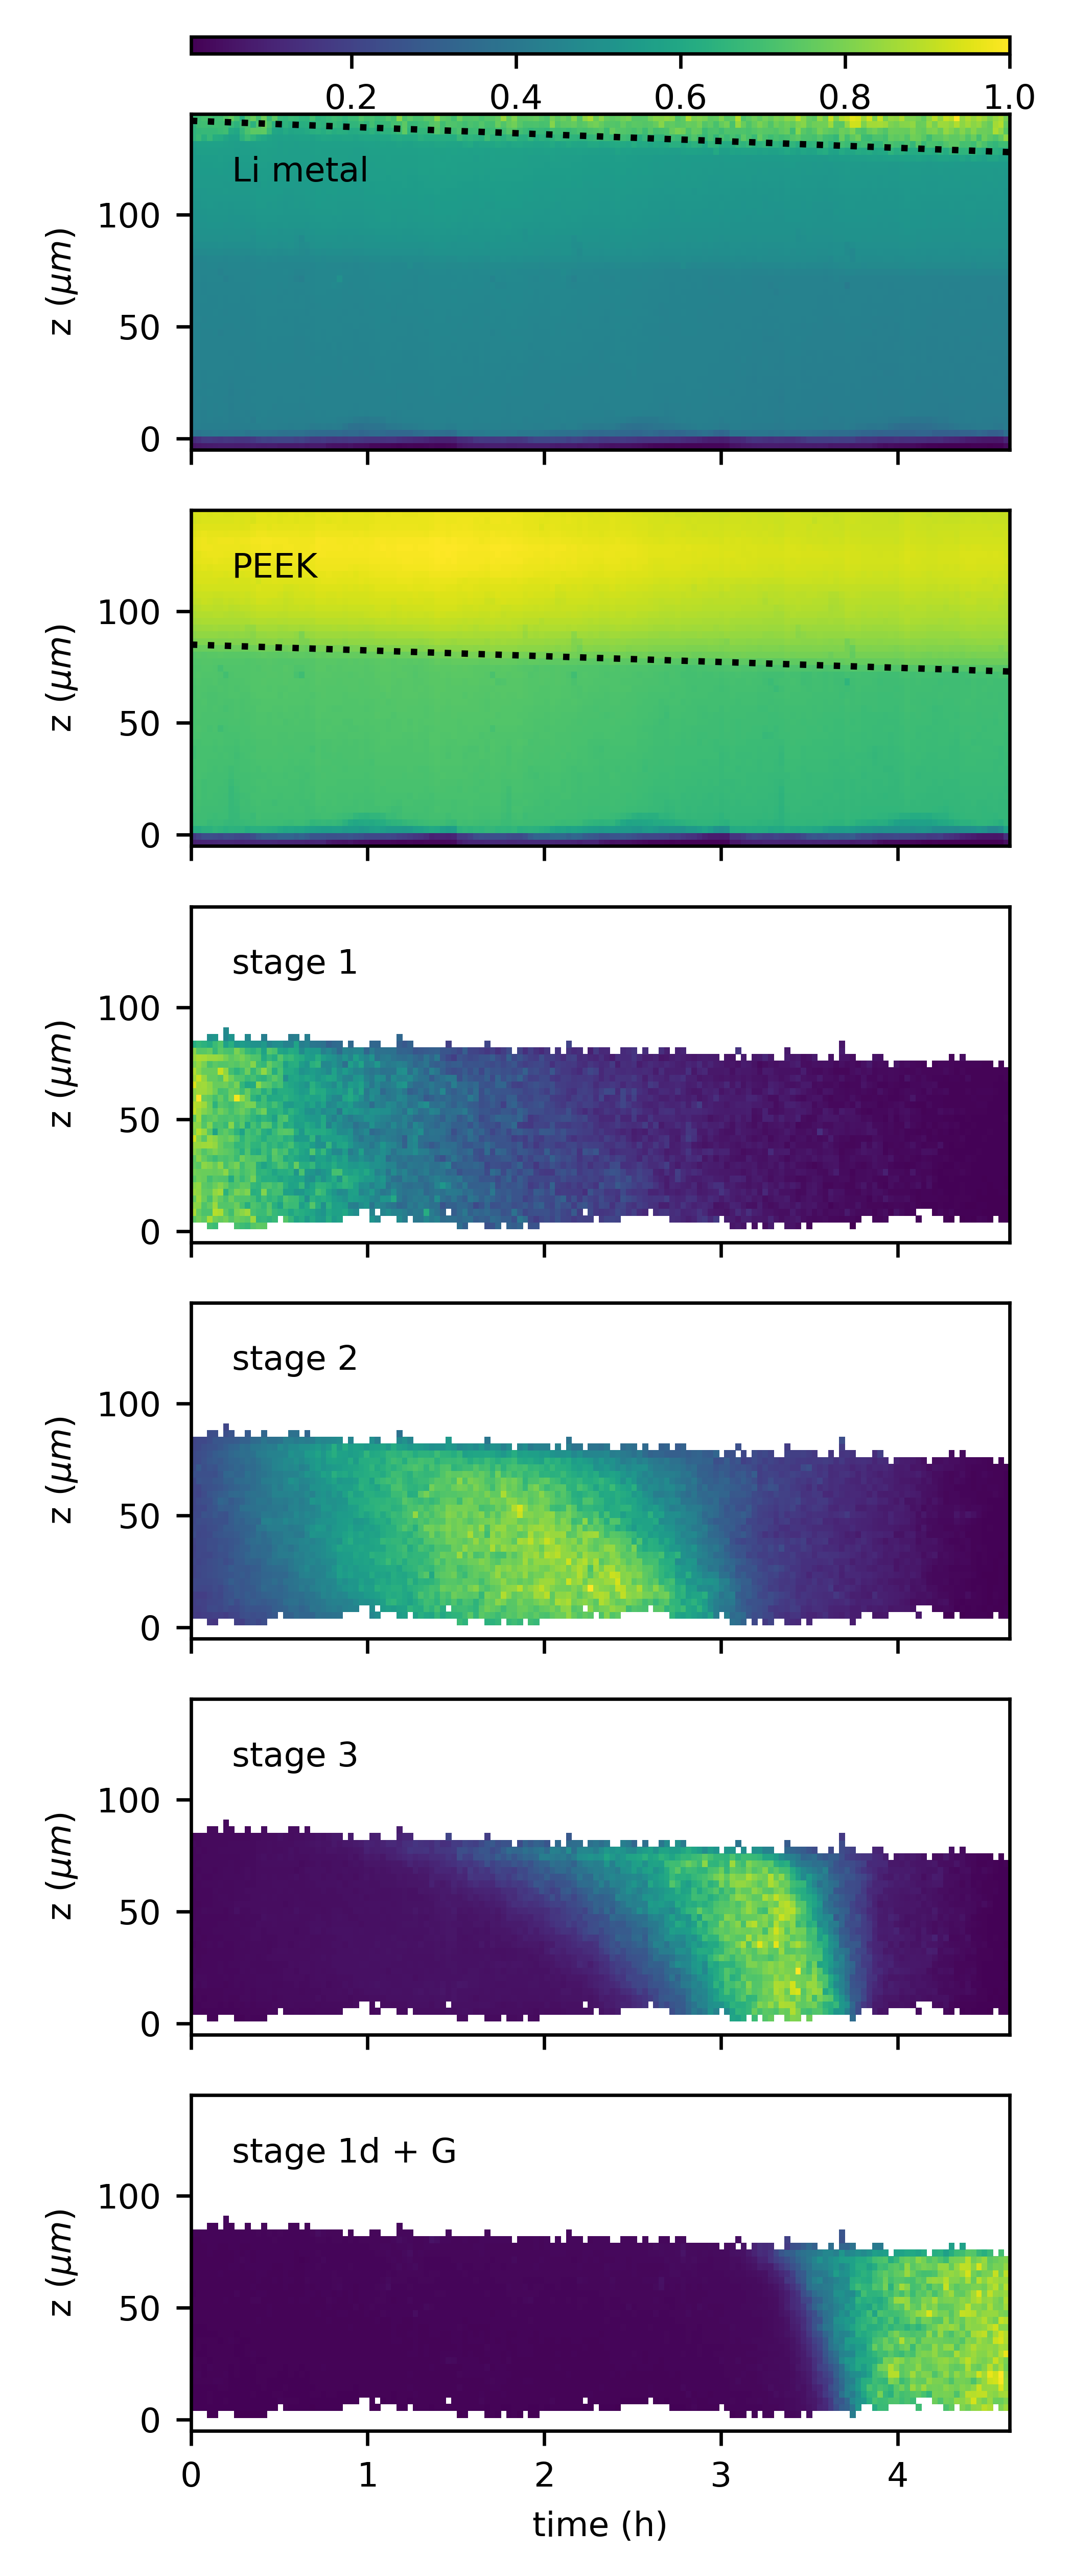
It is clear from these results that the graphite electrode undergoes different distributions of compositions across its thickness during the delithiation. The distribution of composition can be homogeneous (e.g. stage 1, stage 1 + stage 2, or stage dilute + graphite) or heterogeneous (e.g.transition stage 2 to stage 3, or transition stage 3 to stage dilute + graphite). This type of successive homogeneous/heterogeneous composition distribution across a graphite electrode can also be observed in the results reported by Yao et al..21
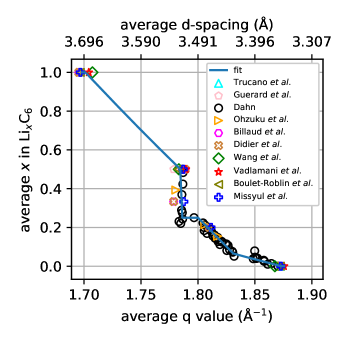
In order to go further and describe quantitatively the homogeneous or heterogeneous distribution of the electrode composition, one would require a quantifiable parameter. The Li content, in LixC6, is of course the most direct metric to quantify the phase composition. It is however not so easily accessible, and the relation between staging and composition is not straightforward. While the stoichiometries of stage 1 and graphite are trivial, respectively LiC6 () and C (), it is not the case for higher order stages. For example, stage 2 is usually further distinguished between stage 2 with an ordered, full Li layer between every second graphene sheet, and stage 2L (liquid) where the Li layer is potentially disordered and not all Li sites are occupied. As a result, the Li content can be between (stage 2L) and (stage 2) for a similar staging order.30 Ideally, one would be able to fully resolve all the crystalline structures present in the sample at any given time and thus quantify the Li content, using precise Rietveld refinements with either X-rays30 or neutron diffraction.29, 36 However, this approach requires excellent signal-to-noise ratio (SNR) over an extended -range, which is hardly compatible with fast operando experiment and may still be limited by the intrinsic disorder of some of the phases. Another alternative approach is to use a stroboscopic technique, i.e. repeated short illuminations with a controlled delay over several cycles to increase the SNR, as successfully performed by Sheptyakov et al. at the electrode scale using neutron diffraction.37 It is yet to be verified that the underlying hypothesis of reproducible cycling still holds at the local scale. Conversely, one could simply consider only the Bragg reflection from each stage and somewhat arbitrarily attribute it to a given composition, with the limitations that have been stated before.38, 34, 35 Here we adopted an alternative strategy based on an empirical law and described hereafter. We considered only the diffracted signal between the LiC6 001 Bragg reflection and the graphite 002 (), i.e. only the reflection on adjacent graphene sheets. We suggest that we can estimate the local average composition from a relation between the intensity-weighted average value over the whole range (or conversely d-spacings using ) and the local average Li concentration in LixC6, as described hereafter. In figure 7 we have plotted the compositions as a function of the -value from several reports in the literature over the past 45 years. All the reported data are quite consistent, some uncertainty remains on the exact value for LiC6 but most importantly, in the region (i.e. LixC24 to LixC12), there is a very limited dependence of the value on the composition , e.g. the stage 2 and 2L mentioned above. Nonetheless, we attempted to fit a piecewise linear function to establish the aforementioned relation between and and obtained the result shown in figure 7. The details of the fit are given in the Supplementary Information
For each location that we have measured, we calculated the intensity-weighted average value over the whole range between LiC6 001 and graphite 002. Prior to the intensity weighting, the intensity was corrected by the structure factor to take into account the reduction of the scattered amplitude by the inserted Li layer, which is scattering in antiphase with the graphene sheets. Volume changes for the different LiC6 compositions, i.e. the shrinking of the electrode upon delithiation were also considered.30 The corrected-intensity-weighted average -value at each location was then used to calculate the local average value using the function introduced above. The aforementioned limitations must be kept in mind, it is clear from the data scattering and the almost vertical slope around that the quantification of the Li content in this region is difficult. In order to estimate the robustness of our approach, we tested different fitting functions and considered all those with a geometric distance to the data points smaller than twice the best fitting function (see SI). We could thus test the dependency of our results on the fitting function and estimate the uncertainty of our approach.
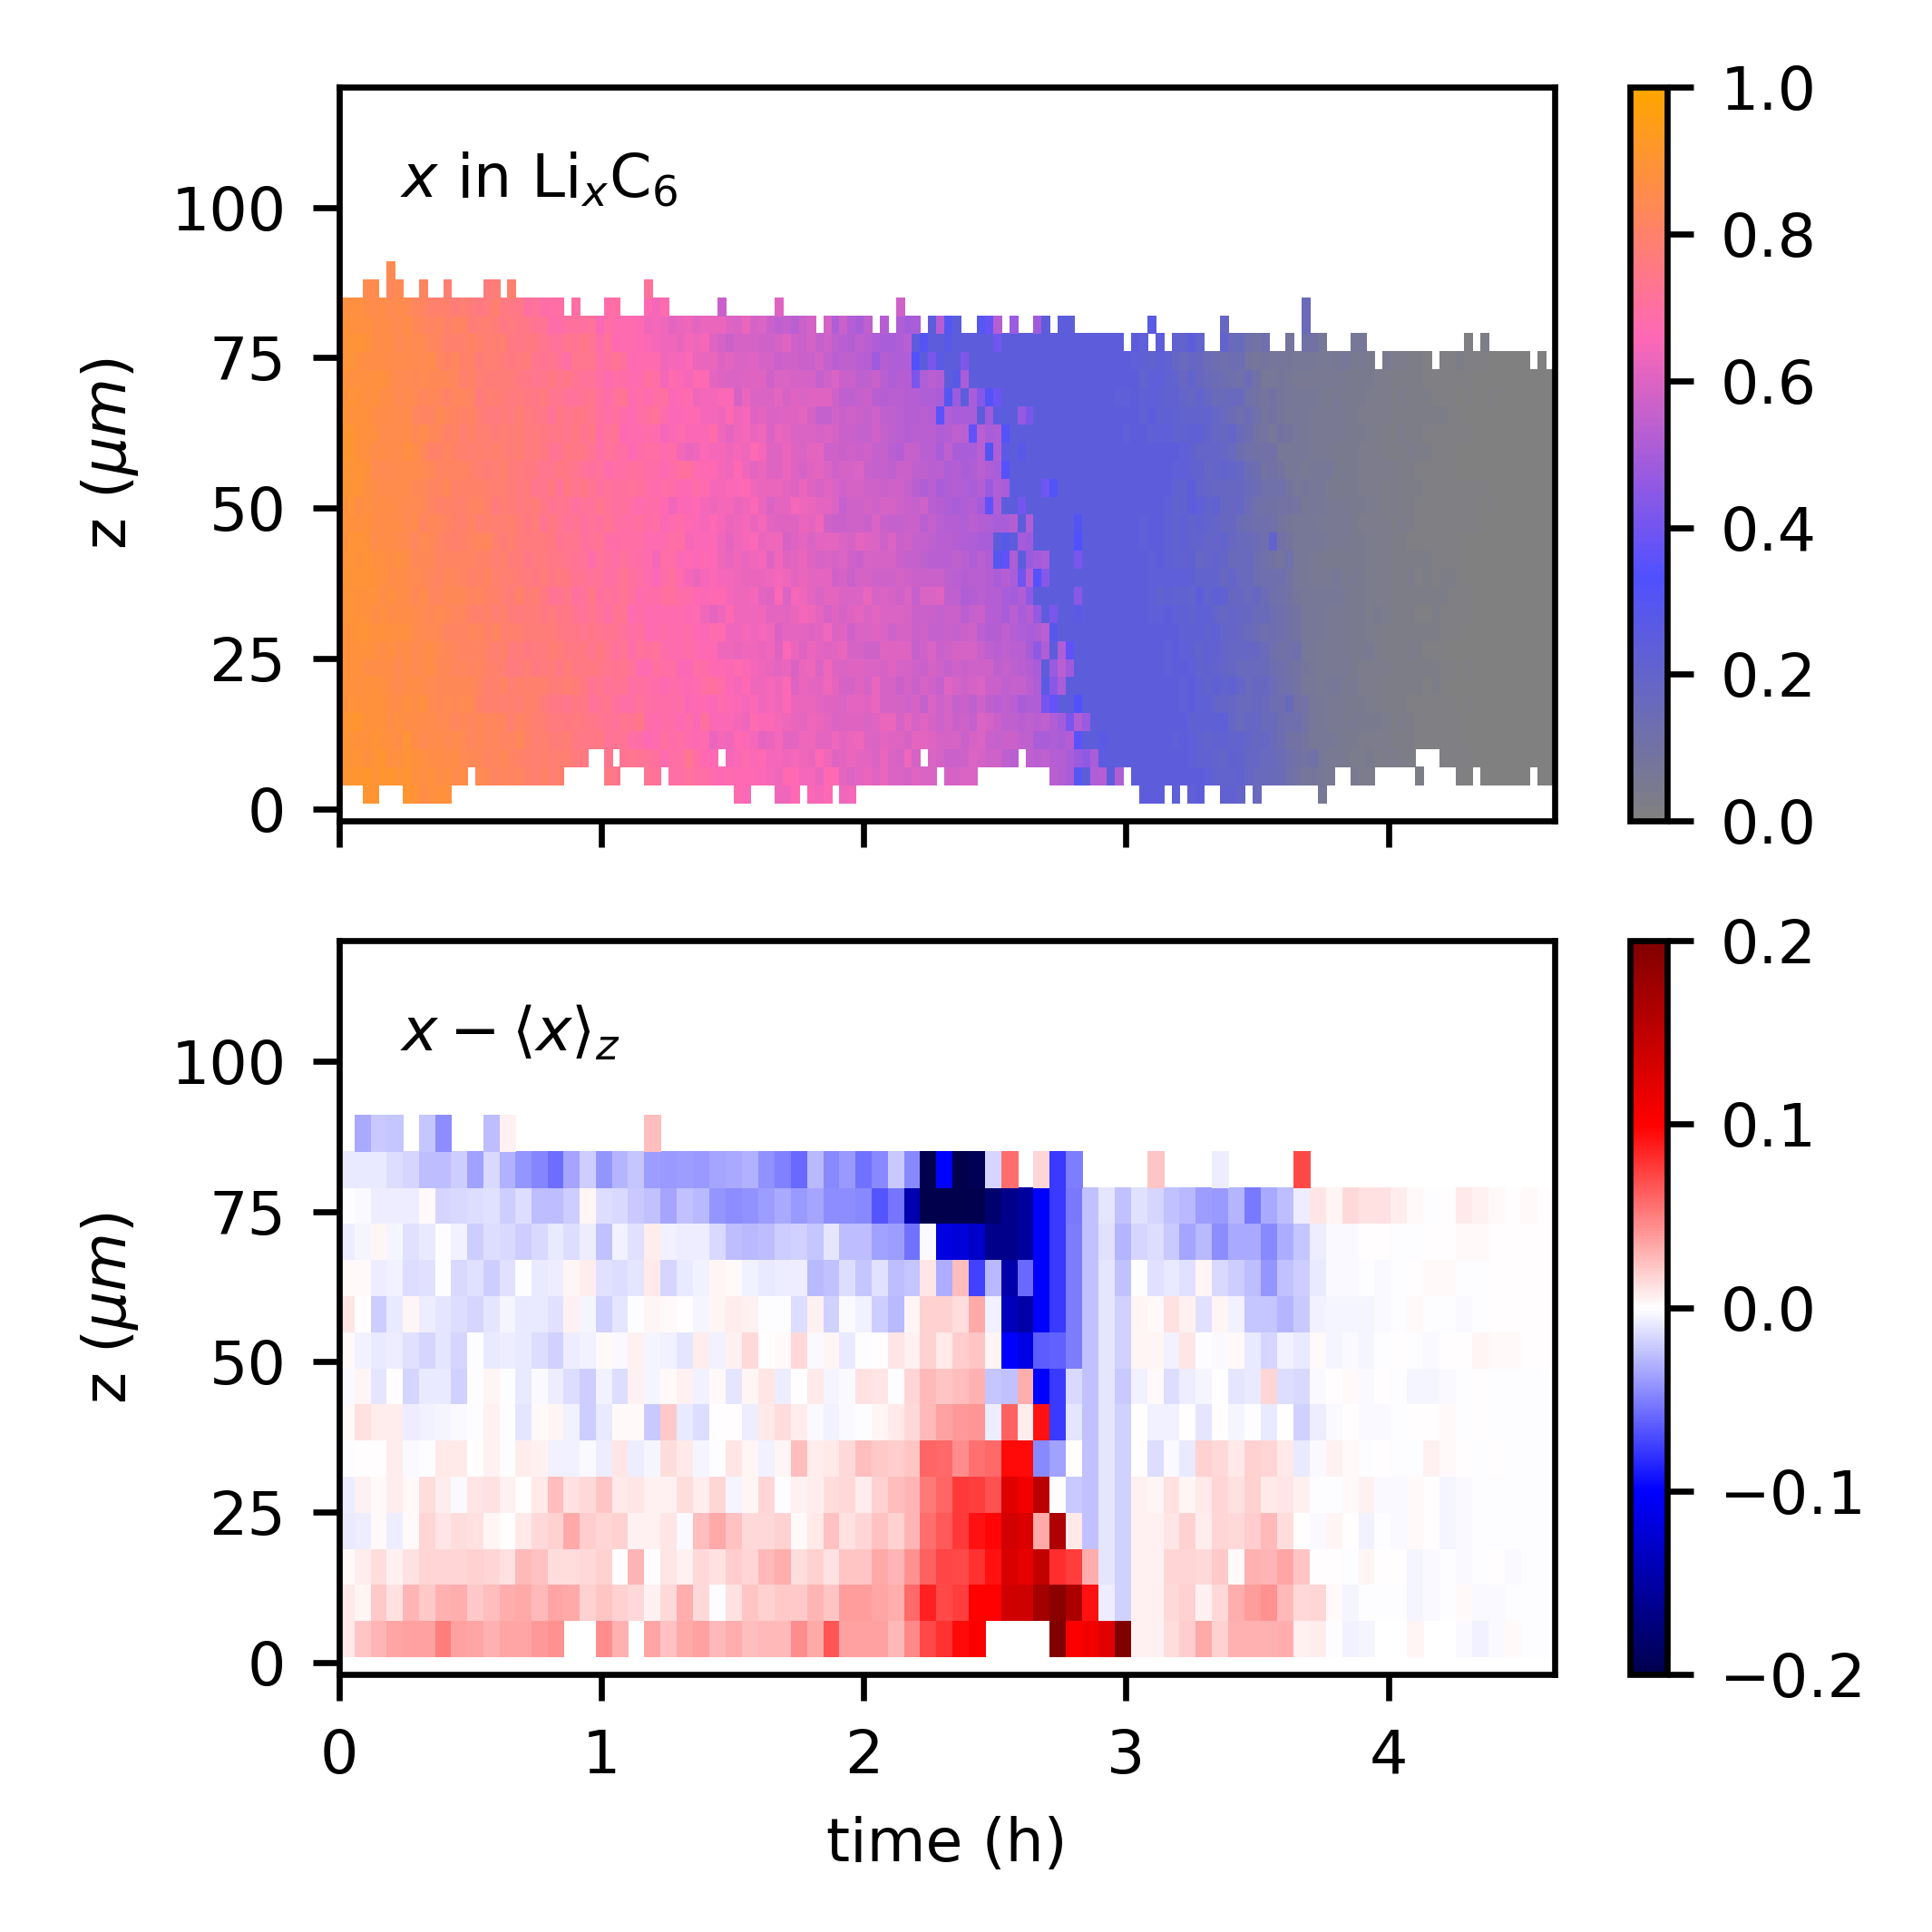
The resulting map of the electrode composition across the electrode is plotted in figure 8. We can observe the depth-resolved evolution of the Li content as a function of time. We observe a smooth transition from to over the whole electrode, with a sharper transition around (typically around the stage transition), due to the steep slope of the function around these values. Though it is clear that the exact value at that transition is highly dependent on the choice of , there is a noticeable difference in the average value between the top and the bottom of the electrode, indicating a heterogeneous distribution of the composition. Heterogeneities in electrode lithiation across the thickness are better seen in the bottom panel, were the difference to the mean value along is reported. It highlights the heterogeneous stage transition, and stage transition, at around h and h, respectively. Around such times, the top of the electrode, near the separator, is systematically more delithiated than the bottom, near the current collector.
Our estimate of the Li content can also be double-checked by comparing it to the estimate from the macroscopic capacity measurement. We obtain a fair agreement over the whole delithiation process, as shown in figure S3 of the Supplementary Information Slight discrepancies can be seen for between 0.25 and 0.55, with an overestimation followed by an underestimation. This most likely stems from the difficult separation of the phases with those compositions with X-ray diffraction. Differences observed at low values may be due to parasitic reactions or the lithiation of disordered graphite, which is not visible in diffraction. We also note that our quantification and its comparison to the capacity measurement is quite similar to that obtained by Yao et al. using a decomposition of the same diffraction peaks over a finite set of five stages.38
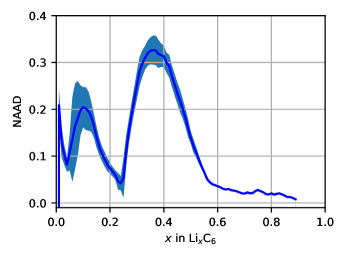
We can now focus on the quantification of heterogeneities and compute the experimental NAAD from the quantified Li content , as introduced in the model. Figure 9 shows the experimental NAAD and the estimated error. We recover some of the striking features predicted by the simulation, including two large bumps around and , two minima around and , and a slower decrease for . The positions of the extrema are quite robust and insensitive to the choice of the function used to treat the data, while the amplitude of the maxima can show some variations. These extrema positions are very consistent with the model predictions, and well correlated with the graphite equilibrium potential shape. Similar peculiar NAAD shape at stoichiometry below was also observed for two other conditions (see Supplementary Information), hence demonstrating the reliability of the data acquisition, treatment and analysis.
Contrary to the simulations, no significant NAAD increase is however observed at higher stoichiometry, i.e. around the stage transition. As seen in figure 6 and previously described, this transition seems really homogeneous throughout the electrode thickness. Thus, while the stage two-phase transition is associated with a plateau on the graphite equilibrium potential and should promote heterogeneous lithiation along the thickness, no such behavior is experimentally observed. Therefore it implies revising the description of the limiting phenomena during this particular transition in our model.
4 Discussion
To analyze the discrepancy observed at larger values, it is necessary to revisit the model. Newman-type models with solid-solution approach for lithium transport inside the active particles do not allow to capture phase front propagation in multi-phase materials such as graphite, but remain sufficient to highlight the main competing phenomena and their relative weights. The competition between lithium transport through the electrode thickness and lithium intercalation inside graphite drives lithium heterogeneities at the electrode scale. It is clear from the present experimental results that Newman-type models can predict accurately the succession of homogeneous/heterogeneous distribution of lithium content across the electrode thickness for the lower half of the regime.
The main driving processes, e.g. Li transport through the electrode and Li intercalation in graphite, seem to be differently balanced at high stoichiometry. The experimentally observed homogeneous distribution of lithium during the stage transition indicates that lithium transport through the electrode thickness is not the limiting phenomena compared to lithium (de)-intercalation during this transition. Since lithium transport in the electrolyte is not impacted by the stoichiometry, we must reconsider the lithium intercalation description. The kinetics of lithium intercalation is driven by the exchange current density (ECD) at the surface of the graphite particle and by the lithium transport inside them. Since the diffusion approach used in the present porous electrode model is anyway not suited to describe transport in materials undergoing phase transitions, we do not modify it and keep it as simple as possible. Therefore, we focus on the description of the ECD. In our initial work following classical descriptions,9 we used a Butler-Volmer expression to model the ECD, and took it proportional to , where is the so-called asymmetry coefficient and is the lithium stoichiometry at the surface of the graphite particle. A value of leads to a symmetric ECD, with a maximum at and two equal minimum at and . As underlined by Bazant,39 the classical Butler-Volmer model does not account for the activity coefficient of the transition state of the reaction. Introducing a modified expression of the ECD to describe the exclusion of intercalation sites during the reaction, the position of the maximum can be shifted to lower stoichiometry. This leads to an auto-inhibitory or auto-catalytic lithium intercalation or deintercalation, as discussed by Bazant.40 In particular, this shift of the maximum of the ECD reduces the kinetics of (de)intercalation at high stoichiometry. This is consistent with our experimental results, since lower (de)intercalation kinetics leads to lower heterogeneities. Nevertheless, we could not reproduce the striking experimental features of lithium distribution inside the graphite electrode using the modified expression introduced by Bazant et al. 39, 41, 42 to study phase separation in LiFePO4 (see insert in figure 10). We found that a much lower value of the (de)intercalation kinetics is necessary for to wash out the heterogeneities only at high stoichiometry. Considering such a form of the ECD, with a much lower value for (insert in figure 10), we could obtain a calculated NAAD in agreement with the experimental observations, namely the two low- heterogeneities are maintained, while the one at large disappears, as can be seen figure 10.
Further theoretical work would be necessary to propose an ECD expression with more sound thermodynamic arguments and a clear relation with phase front propagation, which is beyond the scope of this work. We can nevertheless highlight that an ECD with a much lower value during the LiC6/LiC12 phase transition is required to be consistent with the experimental observations. This drastic reduction of the ECD could be related to the higher repulsive energies between the intercalated lithiums at high stoichiometry, which impacts the intercalation kinetics.
Low values of the exchange current density, not only close to as in the Butler-Volmer expression, but for all , could imply revisiting our understanding of lithium plating, a phenomenon that occurs during lithiation of the negative electrode when the rate of lithium deposition exceeds the rate of lithium intercalation. Yao et al.21 already highlighted the importance of accounting for lithium concentration gradients through the electrode and not just averaged values to correctly capture the occurrence of this degradation phenomena. The low values of the ECD during all the stage transition reported in this work implies important over-potentials inside the graphite electrode even at low C-rates and not only close to the end of lithiation, but during a much longer period. This finding may have important consequences as negative graphite electrode potentials, which favor the formation of lithium deposit, would be reached for much lower electrode thickness and C-rate than what is currently predicted with models using classical Butler-Volmer expression for the ECD.10, 43 Further investigations on the intercalation kinetics of lithium in graphite as a function of the stoichiometry seem therefore crucial for better optimization of graphite electrode under fast charge conditions.
5 Conclusions
Graphite remains the most widely used active material within lithium-ion negative electrodes. Detailed understanding of lithium dynamics inside negative electrodes is critical in optimizing these electrodes in terms of performance, lifetime and safety. In this study, lithium distribution across a thick porous graphite electrode has been followed operando using -spatially resolved X-ray diffraction during delithiation at a moderate C-rate (C/5). Quantitative analysis of the lithium heterogeneities that develop across the electrode thickness reveals a very particular pattern with alternating sequences of homogeneous and heterogeneous lithium distributions. For stoichiometries , the main striking features of the experimental pattern match the prediction from our previous numerical study based on a Newman-type porous electrode model. Thus, the experimental approach developed here validates for the first time such modeling studies at the local scale, i.e. across the electrode thickness. It also strengthen our analysis of lithium heterogeneities based on the competition between lithium transport through the electrode and variation of graphite equilibrium potential with stoichiometry.
At higher stoichiometries, e.g. during the stage transition, no significant heterogeneities are experimentally observed, contrary to the model predictions. This observation implies that lithium transport through the electrode thickness is not the limiting phenomena during this two-phase transition, and assumptions of the model must be refined. Accordingly, we revisited the model and show that a non-symmetric exchange current densities with a very low value for can explain the homogeneous behavior observed during the stage transition. Further theoretical work is needed to understand the grounds of such a non-symmetric behavior.
The present experimental methodology allows the quantification of lithium intercalation with both space and time resolution. It is therefore a high-value tool to validate and improve the theoretical models of the electrodes, which are needed for materials and cell developments. Furthermore, the combination of modeling and advanced operando synchrotron experiment that we present here is extendable to other anode and cathode intercalation materials, including next generation energy storage technologies, beyond LiB.
Conflicts of interest
There are no conflicts to declare.
Acknowledgements
We are grateful to Peter van der Linden and Diego Pontoni from the PSCM Group at the ESRF for 3D printing parts for the experimental setup, and Philippe Montmayeul at CEA for machining the electrochemical cell. We acknowledge the use of the EC-LAB facility at the ESRF, and the Hybrid’En and LITEN batteries platform at CEA to prepare the cells prior to the experiments.
References
- 1 Vinodkumar Etacheri, Rotem Marom, Ran Elazari, Gregory Salitra, and Doron Aurbach. Challenges in the development of advanced li-ion batteries: a review. Energy & Environmental Science, 4:3243–3262, 2011.
- 2 Yuanli Ding, Zachary P. Cano, Aiping Yu, Jun Lu, and Zhongwei Chen. Automotive Li-Ion Batteries: Current Status and Future Perspectives. Electrochemical Energy Reviews, 2(1):1–28, March 2019.
- 3 Stephen J. Harris and Peng Lu. Effects of inhomogeneities :nanoscale to mesoscale on the durability of li-ion batteries. The Journal of Physical Chemistry C, 117(13):6481–6492, 2013.
- 4 Timo Danner, Madhav Singh, Simon Hein, Jorg Kaiser, Horst Hahn, and Arnulf Latz. Thick electrodes for li-ion batteries: A model based analysis. Journal of Power Sources, 334:191–201, 2016.
- 5 Nicolas Dufour, Marion Chandesris, Sylvie Genies, Mikael Cugnet, and Yann Bultel. Lithiation heterogeneities of graphite according to C-rate and mass-loading: A model study. Electrochimica Acta, 272:97–107, May 2018.
- 6 Yue Qi and Stephen J. Harris. In situ observation of strains during lithiation of a graphite electrode. Journal of The Electrochemical Society, 157(6):A741–A747, 2010.
- 7 Kevin G. Gallagher, Stephen E. Trask, Christoph Bauer, Thomas Woehrle, Simon F. Lux, Matthias Tschech, Peter Lamp, Bryant J. Polzin, Seungbum Ha, Brandon Long, Qingliu Wu, Wenquan Lu, Dennis W. Dees, and Andrew N. Jansen. Optimizing areal capacities through understanding the limitations of lithium-ion electrodes. Journal of The Electrochemical Society, 163(2):A138–A149, 2016.
- 8 J. Newman and W. Tiedemann. Porous-electrode theory with battery applications. AIChE J., 21:25–41, 1975.
- 9 M. Doyle, T. F. Fuller, and J. Newman. Modeling of galvanostatic charge and discharge of the lithium/polymer/insertion cell. Journal of The Electrochemical Society, 140:1526–1533, 1993.
- 10 Simon Hein and Arnulf Latz. Influence of local lithium metal deposition in 3d microstructures on local and global behavior of lithium-ion batteries. Electrochimica Acta, 201:354 – 365, 2016.
- 11 Madeleine Ecker, Thi Kim Dung Tran, Philipp Dechent, Stefan Katz, Alexander Warnecke, and Dirk Uwe Sauer. Parameterization of a physico-chemical model of a lithium-ion battery: I. determination of parameters. Journal of The Electrochemical Society, 162(9):A1836–A1848, 2015.
- 12 J. R. Dahn. Phase diagram of ${\mathrm{Li}}_{\mathit{x}}$${\mathrm{C}}_{6}$. Physical Review B, 44(17):9170–9177, November 1991.
- 13 D. Billaud, F. X. Henry, M. Lelaurain, and P. Willmann. Revisited structures of dense and dilute stage II lithium-graphite intercalation compounds. Journal of Physics and Chemistry of Solids, 57(6):775–781, June 1996.
- 14 E. M. Gavilán-Arriazu, O. A. Pinto, B. A. López de Mishima, D. E. Barraco, O. A. Oviedo, and E. P. M. Leiva. Kinetic Monte Carlo applied to the electrochemical study of the Li-ion graphite system. Electrochimica Acta, 331:135439, January 2020.
- 15 Raymond B. Smith and Martin Z. Bazant. Multiphase porous electrode theory. Journal of The Electrochemical Society, 164(11):E3291–E3310, 2017.
- 16 M. Chandesris, D. Caliste, D. Jamet, and P. Pochet. Thermodynamics and related kinetics of staging intercalation compounds. The Journal of Physical Chemistry, 123:23711–23720, 2019.
- 17 K. E. Thomas-Alyea, C. Jung, R. B. Smith, and M. Z. Bazant. In situ observation and mathematical modeling of lithium distribution within graphite. Journal of The Electrochemical Society, 164(11):E3063–E3072, 2017.
- 18 Stephen J. Harris, Adam Timmons, Daniel R. Baker, and Charles Monroe. Direct in situ measurements of li transport in li-ion battery negative electrodes. Chemical Physics Letters, 485:265–274, 2010.
- 19 P. Maire, H. Kaiser, W. Scheifele, and P. Novak. Colorimetric determination of lithium-ion mobility in graphite composite electrodes. Journal of Electroanalytical Chemistry, 644:127–131, 2010.
- 20 Yinsheng Guo, Raymond B. Smith, Zhonghua Yu, Dmitri K. Efetov, Junpu Wang, Philip Kim, Martin Z. Bazant, and Louis E. Brus. Li intercalation into graphite: Direct optical imaging and cahn-hilliard reaction dynamics. The Journal of Physical Chemistry Letters, 7(11):2151–2156, 2016. PMID: 27203128.
- 21 Koffi P. C. Yao, John S. Okasinski, Kaushik Kalaga, Ilya A. Shkrob, and Daniel P. Abraham. Quantifying lithium concentration gradients in the graphite electrode of Li-ion cells using operando energy dispersive X-ray diffraction. Energy & Environmental Science, 12(2):656–665, February 2019.
- 22 H. Gu. Mathematical Analysis of a Zn / NiOOH Cell. Journal of The Electrochemical Society, 130(7):1459–1464, July 1983.
- 23 D. Guerard and A. Herold. Intercalation of lithium into graphite and other carbons. Carbon, 13(4):337–345, August 1975.
- 24 Peter Trucano and Ruey Chen. Structure of graphite by neutron diffraction. Nature, 258(5531):136–137, November 1975.
- 25 Tsutomu Ohzuku, Yasunobu Iwakoshi, and Keijiro Sawai. Formation of Lithium‐Graphite Intercalation Compounds in Nonaqueous Electrolytes and Their Application as a Negative Electrode for a Lithium Ion (Shuttlecock) Cell. Journal of The Electrochemical Society, 140(9):2490–2498, September 1993.
- 26 Xun-Li Wang, Ke An, Lu Cai, Zhili Feng, Stephen E. Nagler, Claus Daniel, Kevin J. Rhodes, Alexandru D. Stoica, Harley D. Skorpenske, Chengdu Liang, Wei Zhang, Joon Kim, Yue Qi, and Stephen J. Harris. Visualizing the chemistry and structure dynamics in lithium-ion batteries by in-situ neutron diffraction. Scientific Reports, 2:747, October 2012.
- 27 B. Vadlamani, K. An, M. Jagannathan, and K. S. Ravi Chandran. An In-Situ Electrochemical Cell for Neutron Diffraction Studies of Phase Transitions in Small Volume Electrodes of Li-Ion Batteries. Journal of The Electrochemical Society, 161(10):A1731–A1741, January 2014.
- 28 Lucien Boulet-Roblin, Philippe Borel, Denis Sheptyakov, Cécile Tessier, Petr Novak, and Claire Villevieille. Operando Neutron Powder Diffraction Using Cylindrical Cell Design: The Case of LiNi0.5mn1.5o4 vs Graphite. The Journal of Physical Chemistry C, 120(31):17268–17273, August 2016.
- 29 Sou Taminato, Masao Yonemura, Shinya Shiotani, Takashi Kamiyama, Shuki Torii, Miki Nagao, Yoshihisa Ishikawa, Kazuhiro Mori, Toshiharu Fukunaga, Yohei Onodera, Takahiro Naka, Makoto Morishima, Yoshio Ukyo, Dyah Sulistyanintyas Adipranoto, Hajime Arai, Yoshiharu Uchimoto, Zempachi Ogumi, Kota Suzuki, Masaaki Hirayama, and Ryoji Kanno. Real-time observations of lithium battery reactions—operando neutron diffraction analysis during practical operation. Scientific Reports, 6(1):28843, June 2016.
- 30 Alexander Missyul, Ivan Bolshakov, and Roman Shpanchenko. XRD study of phase transformations in lithiated graphite anodes by Rietveld method. Powder Diffraction, 32(S1):S56–S62, September 2017.
- 31 Natalia Andrea Cañas, Philipp Einsiedel, Oliver Thomas Freitag, Christopher Heim, Miriam Steinhauer, Dong-Won Park, and Kaspar Andreas Friedrich. Operando X-ray diffraction during battery cycling at elevated temperatures: A quantitative analysis of lithium-graphite intercalation compounds. Carbon, 116:255 – 263, 2017.
- 32 Jette K. Mathiesen, Rune E. Johnsen, Ane S. Blennow, and Poul Norby. Understanding the structural changes in lithiated graphite through high-resolution operando powder X-ray diffraction. Carbon, 153:347–354, November 2019.
- 33 Toshiyuki Matsunaga, Shigeharu Takagi, Keiji Shimoda, Ken-ichi Okazaki, Yoshihisa Ishikawa, Masao Yonemura, Yoshio Ukyo, Toshiharu Fukunaga, and Eiichiro Matsubara. Comprehensive elucidation of crystal structures of lithium-intercalated graphite. Carbon, 142:513 – 517, 2019.
- 34 Christopher L. Berhaut, Diana Zapata Dominguez, Praveen Kumar, Pierre-Henri Jouneau, Willy Porcher, David Aradilla, Samuel Tardif, Stéphanie Pouget, and Sandrine Lyonnard. Multiscale multiphase lithiation and delithiation mechanisms in a composite electrode unraveled by simultaneous operando small-angle and wide-angle x-ray scattering. ACS Nano, 13(10):11538–11551, 2019. PMID: 31560519.
- 35 Christopher L. Berhaut, Diana Zapata Dominguez, Daniel Tomasi, Christophe Vincens, Cédric Haon, Yvan Reynier, Willy Porcher, Nathalie Boudet, Nils Blanc, Gilbert A. Chahine, Samuel Tardif, Stéphanie Pouget, and Sandrine Lyonnard. Prelithiation of silicon/graphite composite anodes: Benefits and mechanisms for long-lasting li-ion batteries. Energy Storage Materials, 29:190 – 197, 2020.
- 36 Christophe Didier, Wei Kong Pang, Zaiping Guo, Siegbert Schmid, and Vanessa K. Peterson. Phase evolution and intermittent disorder in electrochemically lithiated graphite determined using in operando neutron diffraction. Chemistry of Materials, 32(6):2518–2531, 2020.
- 37 Denis Sheptyakov, Lucien Boulet-Roblin, Vladimir Pomjakushin, Philippe Borel, Cécile Tessier, and Claire Villevieille. Stroboscopic neutron diffraction applied to fast time-resolved operando studies on li-ion batteries (d-lini0.5mn1.5o4vs. graphite). Journal of Materials Chemistry A, 8:1288–1297, 2020.
- 38 Koffi P. C. Yao, John S. Okasinski, Kaushik Kalaga, Jonathan D. Almer, and Daniel P. Abraham. Operando quantification of (de)lithiation behavior of silicon–graphite blended electrodes for lithium-ion batteries. Advanced Energy Materials, 9(8):1803380, 2019.
- 39 M. Z. Bazant. Theory of chemical kinetics and charge transfer based on nonequilibrium thermodynamics. Accounts of chemical research, 46:1144, 2013.
- 40 Martin Z. Bazant. Thermodynamic stability of driven open systems and control of phase separation by electro-autocatalysis. Faraday Discussions, 199(0):423–463, July 2017.
- 41 D. A. Cogswell and M. Z. Bazant. Coherency strain and the kinetics of phase separation in lifepo4 nanoparticles. ACS Nano, 6(3):2215–2225, 2012.
- 42 P. Bai, D. A. Cogswell, and M. Z. Bazant. Suppression of phase separation in lifepo4 nanoparticles during discharge. Nano Letters, 11:4890–4896, 2011.
- 43 Xiao-Guang Yang, Yongjun Leng, Guangsheng Zhang, Shanhai Ge, and Chao-Yang Wang. Modeling of lithium plating induced aging of lithium-ion batteries: Transition from linear to nonlinear aging. Journal of Power Sources, 360:28 – 40, 2017.
See pages - of article_arXiv_ID13_Tardif_Supplementary_Information.pdf