How Unusual is the Milky Way’s Assembly History?
Abstract
In the CDM model of structure formation galactic haloes build up by accretion of mass and mergers of smaller subunits. The most recent massive merger event experienced by the Milky Way (MW) halo was the accretion of the Large Magellanic Cloud (LMC; which has a stellar mass of ). Recent analyses of galactic stellar data from the Gaia satellite have uncovered an earlier massive accretion event, the Gaia-Enceladus-Sausage (GES), which merged with the MW around 10 Gyr ago. Here, we use the EAGLE cosmological hydrodynamics simulation to study properties of simulated MW-mass haloes constrained to have accretion histories similar to that of the MW, specifically the recent accretion of an “LMC” galaxy and a “GES” merger, with a quiescent period between the GES merger and the infall of the LMC (the “GES & LMC” class). We find that per cent of MW-mass haloes have an LMC; per cent have a GES event and no further merger with an equally massive object since ; and only per cent belong to the LMC & GES category. The progenitors of the MWs in this last category are much less massive than average at early times but eventually catch up with the mean. The LMC & GES class of galaxies naturally end up in the “blue cloud” in the colour-magnitude diagram at , tend to have a disc morphology and have a larger than average number of satellite galaxies.
keywords:
Methods: numerical – Galaxy: evolution – Galaxy: formation1 Introduction
The Milky Way (MW) is sometimes regarded as a template for studies of the structure and evolution of spiral galaxies. Yet, the more we find out about the MW, the more we recognise that it is anything but typical; in fact, several of its properties are distinctly atypical. For example, the MW hosts a very massive satellite, the Large Magellanic Cloud (LMC), which has approximately 10% of the total MW halo mass (e.g. Benson et al., 2002; Penarrubia et al., 2016; Shao et al., 2018). Studies using large samples of observed local galaxies, combined with cosmological simulations, find that only of MW-mass galaxies host a satellite as massive as this (e.g. Liu et al., 2011; Busha et al., 2011; Boylan-Kolchin et al., 2011; Tollerud et al., 2011). Not only is the presence of a massive satellite rare, but the scale of the damage the LMC is inflicting on the Galaxy has recently began to be recognised. This includes perturbing the barycentre of the MW (Gomez et al., 2015), disturbing the Galactic disc (Laporte et al., 2018) and inducing a large-scale gravitational “wake” in the stellar and dark matter haloes (Garavito-Camargo et al., 2019). Clearly the accretion of the LMC is a significant, transformative event in our Galaxy’s history.
In addition to hosting the LMC, the MW has other peculiarities. Its central supermassive black hole has an abnormally small mass compared to other galaxies of similar stellar mass (e.g. Savorgnan et al., 2016); its satellite system has a strange planar alignment perpendicular to the MW disc (e.g. Lynden-Bell, 1976; Libeskind et al., 2005; Metz et al., 2008); and the Galactic stellar halo may be unusually low-mass and metal-poor (e.g. Bell et al. 2017; Harmsen et al. 2017, but see Conroy et al. 2019; Deason et al. 2019). Some of these seemingly atypical qualities could be explained by the paucity of mergers experienced by our Galaxy. For example, it is expected that our forthcoming merger with the LMC (in a couple of gigayears time) may return the MW back to “normality” (Cautun et al., 2019). In view of all these peculiarities, a natural question to ask is how similar or different is the MW assembly history to that of other galaxies of similar mass?
A fundamental prediction of the CDM model is that MW-mass galaxies grow by accretion and mergers with smaller galaxies. Simulations show that large stellar haloes form as a result of these accretion events (Bullock & Johnston, 2005; Abadi et al., 2006; Font et al., 2006; Cooper et al., 2010). Dynamical timescales in the stellar halo are long, so the phase-space distribution of halo stars can retain some memory of the past accretion events. Moreover, the chemistry of the debris of merger events reflects that of the progenitor galaxies: more massive dwarfs are more metal-rich than lower mass dwarfs, and have distinct sequences in chemical abundance space (e.g. Tolstoy et al., 2009). Hence, by analysing the stellar phase-space and chemistry properties, it may be possible to identify different accretion events. The link between the chemodynamics of halo stars and the Galaxy’s assembly history can be traced back to the early work by Eggen et al. (1962). More recently, our view of the Galaxy has been transformed by the availability of 6D phase-space information for large numbers of halo stars provided by large astrometric, photometric and spectroscopic surveys.
The Gaia mission, in particular, is providing new detailed insights into the assembly history of the MW. The first and second data releases led to the discovery of an ancient merger event, discovered independently by two teams who called it “Gaia Enceladus” (Helmi et al., 2018) and “Gaia Sausage” (Belokurov et al., 2018) respectively; here we will refer to both jointly as the Gaia-Enceladus Sausage (GES)111Note, however, that it is still debated whether or not these two discoveries are describing exactly the same event (e.g. Evans, 2020; Elias et al., 2020).
Helmi et al. (2018) analysed the kinematics, chemistry and positions of stars in the MW’s thick disc and stellar halo, and found that high-energy stars on retrograde orbits are also linked by their chemical compositions. They concluded that the inner halo is dominated by stars coming from a single object accreted around 8-11 Gyr ago. Belokurov et al. (2018) used kinematics and chemistry of stars from SDSS and Gaia DR1 to show that, at higher metallicity ([Fe/H]>1.7), the orbits of the halo stars are very radially biased (with velocity anisotropy, ). These authors argue that the extreme radial orbits in the inner stellar halo cannot have been caused by steady accretion of low-mass dwarf galaxies, but instead must have come from a single merger event with a massive satellite some 8-11 Gyr ago. This proposal agrees with the idea of orbit radialization put forward by Amorisco (2017). The connection relation between highly radial orbits and massive merger events has been confirmed with cosmological simulations (e.g. Fattahi et al., 2019; Mackereth et al., 2019).
In addition to halo stars, globular clusters can be used to identify accreted dwarf galaxies since, by virtue of their high stellar mass density, they are able to survive tidal disruption long after a dwarf galaxy that brought them into the MW has been destroyed (e.g. Kruijssen & Portegies Zwart, 2009; Penarrubia et al., 2009). Recent work using Gaia DR2 shows that the Galactic globular cluster population also points to a GES merger event (Myeong et al., 2018; Pfeffer et al., 2020). In particular, Myeong et al. (2018) show that at least eight Galactic globular clusters are likely to be associated with the GES. However, in addition to the GES, the globular cluster population has possibly revealed two additional merger events: Sequoia and Kraken (Myeong et al., 2019; Kruijssen et al., 2020). Sequoia is thought to have merged with the MW around the same time as the GES, but the progenitor had a much lower mass (Myeong et al., 2019). Kraken is thought to be much older (accretion at ), but may have an even higher mass ratio relative to the MW than the GES merger (Pfeffer et al., 2020). The existence of this latter event is still under debate, and it may be more difficult to identify in the halo stars as its stellar debris likely occupies the inner few kiloparsecs of the Galaxy.
In view of the recent advances in our knowledge of the assembly history of the MW, the aim of this paper is to characterise MW-like galaxies in cosmological simulations that have similar past accretion events to our own galaxy. Specifically, we use the cosmological hydrodynamics EAGLE simulation (Schaye et al., 2015; Crain et al., 2015) to identify MW-mass systems that underwent mergers analogous to both the LMC and GES events. Previous studies have considered MW-like galaxies with either an LMC or a GES event (e.g. Bignone et al., 2019; Cautun et al., 2019; Elias et al., 2020), but not both as seems appropriate for the actual MW. The “classical” view of the LMC (e.g. Cautun et al., 2019) allows for a variety of previous mergers but does not include the paucity of massive merger events experienced by the MW between the recent infall of the LMC and the ancient merger of the GES. This paper aims to explore differences amongst galaxies that experience late (LMC), early (GES) merger events, or both. In particular, we aim to establish how unusual it is for a MW-mass galaxy to have both these events and a dearth of massive mergers in between.
2 Simulations
We now give a brief overview of the EAGLE simulations. We also describe the selection criteria for our MW-mass galaxies, and the reasoning behind each choice.
2.1 EAGLE
We aim to identify MW analogues in the EAGLE simulation (Schaye et al., 2015; Crain et al., 2015; McAlpine et al., 2016), which have either an LMC-mass satellite, an ancient merger similar to the GES, or both an LMC and a GES event. The EAGLE project is a suite of cosmological hydrodynamical simulations that follow the formation and evolution of galaxies, tracking the gas, stars and dark matter throughout cosmic history. The simulations use a modified version of the Tree-PM SPH code p-gadget3, which is based on the publicly available code gadget-2 (Springel, 2005). The hydrodynamics solver uses a pressure-entropy formalism (see Schaller et al., 2015b, for details). The subgrid galaxy formation model includes homogeneous photoionising background radiation, metallicity-dependent star formation and cooling, stellar evolution and supernovae feedback, seeding and growth of supermassive black holes, and AGN feedback (see Schaye et al., 2015, for a full description of the model). The galaxy formation model was calibrated to reproduce the stellar mass function of galaxies at and realistic galaxy sizes, down to a stellar mass of . The model has been shown to produce galaxies with realistic mass profiles and rotation curves (Schaller et al., 2015a).
We analyse the main EAGLE simulation (Ref0100N1504) which follows the evolution of a periodic cubic volume of (100 Mpc)3. The mass resolution is and for dark matter and gas particles, respectively. The Friends-of-Friends (FoF) algorithm was used to identify dark matter haloes (Davis et al., 1985), and the subfind algorithm was used to identify self-bound structures and substructures within the FoF groups (Springel, 2005). The cosmological parameters adopted for the simulations are based on Planck Collaboration et al. (2014): , , , , .
The large volume of the main EAGLE simulation provides a large number of MW-mass galaxies which have a variety of merger histories. The stellar mass, M∗, for each galaxy was calculated by summing the mass of the star particles bound to each galaxy within 30 kpc of the galaxy’s centre. The halo mass and radius, and respectively, are defined as those of the sphere with average enclosed density equal to 200 times the critical density of the universe. We define satellites as those subhaloes within of their host. Infall time or accretion time is defined as the time when a galaxy crosses the radius of the host. In practice, we take the snapshot immediately before the crossing. Finally, merger time is defined as the last snapshot at which an accreted galaxy was identified by subfind, before it merges with the host or is destroyed.
2.2 Sample selection
We first identify all galaxies with a present-day dark matter halo in the mass range M⊙ (see Callingham et al., 2019, and references therein). This sample comprises haloes. We then impose further restrictions based on assembly history.
The LMC is a relatively massive satellite, , with a small Galactocentric distance, kpc, and moves with a large tangential speed (McConnachie, 2012; Kallivayalil et al., 2013). The Galactocentric distance and velocity of the LMC indicate that it is close to the pericentre of its orbit. We do not impose any constraint on the orbit of LMC-mass satellites and only require that the stellar mass of the satellite galaxy should lie in the range M⊙, and the satellite be located within of the host halo at . We additionally require that no other satellite more massive than the LMC exists within the radius of the MW-mass hosts at . We do not impose a constraint on the infall time of the LMC-mass satellite. However, since these massive satellites survive to , they typically infall at late times (see Table 2).
The details of the GES-like event are more uncertain since it is a fairly new discovery. However, the stellar mass is likely to be in the range M⊙ and it is thought to have merged with the MW between 8 Gyr and 11 Gyr ago (Belokurov et al., 2018; Fattahi et al., 2019; Mackereth et al., 2019)222Fattahi et al. (2019) find a slightly higher stellar mass for the GES progenitors in the Auriga simulations. However, the stellar masses in Auriga subhaloes are slightly overestimated.. We impose no orbital constraint on the GES event. Similarly to the LMC constraint, we require that there was only one GES-mass accretion event in this time period (with no merger with a galaxy more massive than the GES). Finally, we impose the condition that there should be no massive accretion events with progenitor stellar mass , in the interval between the GES merger event and the infall of the LMC. Our constraints do, however, allow lower mass accretion events such as Sgr and Sequoia to occur between the merger with the GES and the infall of LMC. We do not consider the accretion of a Kraken-like event since it is suspected that this happened before the GES event. A brief summary of the selection criteria are as follows:
-
1.
MW analogue has MM⊙.
-
2.
LMC exists at within R200, with stellar mass MM⊙.
-
3.
GES merger event of mass MM⊙ occurs at Gyr.
-
4.
A ‘merger-free zone’ when there are no massive accretion (M) events is required between the time of the merger of the GES and the infall of the LMC
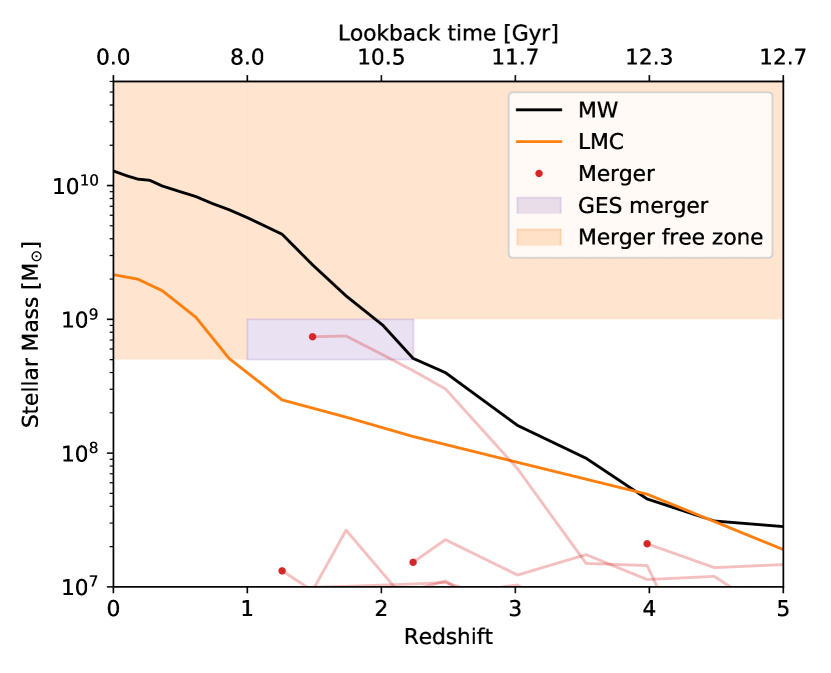
In order to apply these criteria, we used merger trees to follow the assembly history of the MW-mass galaxies. Fig. 1 shows an example of MW-mass galaxy in EAGLE, and helps to visualise the constraints imposed by the different selection criteria. The black and orange lines show the main branch of the simulated MW galaxy and its LMC satellite respectively. The red dots represent dwarf galaxies (above stellar mass of ) which have merged onto the MW main branch, the light red lines show the main branch of the merging dwarfs up until they have completely merged with the MW. The orange and purple shaded regions show the mass and redshift zones for the merger-free area, and the area in which a GES merger should occur.
Throughout this paper, the properties of MW-mass galaxies are compared in the “categories” described below. These groupings were chosen to clarify how having either, or both of the LMC and GES would have influenced the Galaxy’s evolution. These categories are:
-
1.
All MW-mass galaxies (MW-all).
-
2.
MW-mass galaxies which have an LMC within R200 at with no merger history constraint333This is the “classical” MW with LMC studied in many previous papers. (LMC-all).
-
3.
MW-mass galaxies which have an LMC within R200 at , but did not experience a GES merger event or accrete any other massive dwarfs according to our constraints (LMC-o).
-
4.
MW-mass galaxies which have a merger event similar to the GES, but do not have an LMC satellite at and did not accrete any other massive dwarf according to our constraints (GES-o).
-
5.
MW-mass galaxies which have both a LMC, a GES event, and a ‘merger free zone’ during which no object more massive than the LMC or the GES is accreted. This final group (LMC & GES) most closely describes the true MW galaxy444Kruijssen et al. (2020) found a lower mass for the GES than used in this paper. However, their findings for the MW assembly history are consistent with the LMC-o sample of galaxies presented here..
| Group | Number of galaxies | Percentage | Median | Median | |
|---|---|---|---|---|---|
| ( M☉) | ( M☉) | () | |||
| MW-all | 1078 | - | 2.03 | 1.04 | 19.5 |
| LMC-all | 169 | 15.7% | 1.78 | 1.12 | 15.9 |
| LMC-o | 40 | 3.7% | 1.30 | 0.87 | 14.9 |
| GES-o | 54 | 5.0% | 1.74 | 0.92 | 18.9 |
| LMC & GES | 7 | 0.65% | 1.44 | 0.80 | 18.0 |
The number of galaxies that meet these criteria is presented in Table 1, along with the percentage of MW galaxies that belong in each category and their median stellar and halo masses. Our values for the fraction of MW-mass haloes in the LMC-o or GES-o categories are significantly higher than those stated in Bignone et al. (2019) and Cautun et al. (2019). Cautun et al. (2019) found only eight MW analogues in the EAGLE simulation which had an LMC-mass satellite; however, that work applied more restrictive constraints to the sample. For example, the mass of the cold gas content and the black hole mass were also considered in the constraints. Bignone et al. (2019) found only one MW galaxy with a GES type merger event in the EAGLE simulation; however, that work also imposed constraints on the current star formation and the disc of the MW, and, importantly, required that the stellar debris from the GES event be highly anisotropic.
Our constraints are deliberately imposed to depend only on the mass and time of significant accretion events in the MW’s history. Anything more restrictive would result in a very small sample size. The fraction of MW haloes with ‘classical’ LMCs (LMC-all) is slightly higher than the observed value (, see e.g. Liu et al. 2011; Tollerud et al. 2011) but, again, our constraints are less restrictive (e.g. no constraint on present-day position, or orbit of the LMC). The final value for the fraction of MW galaxies with both an LMC and a GES merger event, and nothing significant in between, is only 0.65% of all MWs in EAGLE – this is already an indicator that our Galaxy’s assembly history is very rare.
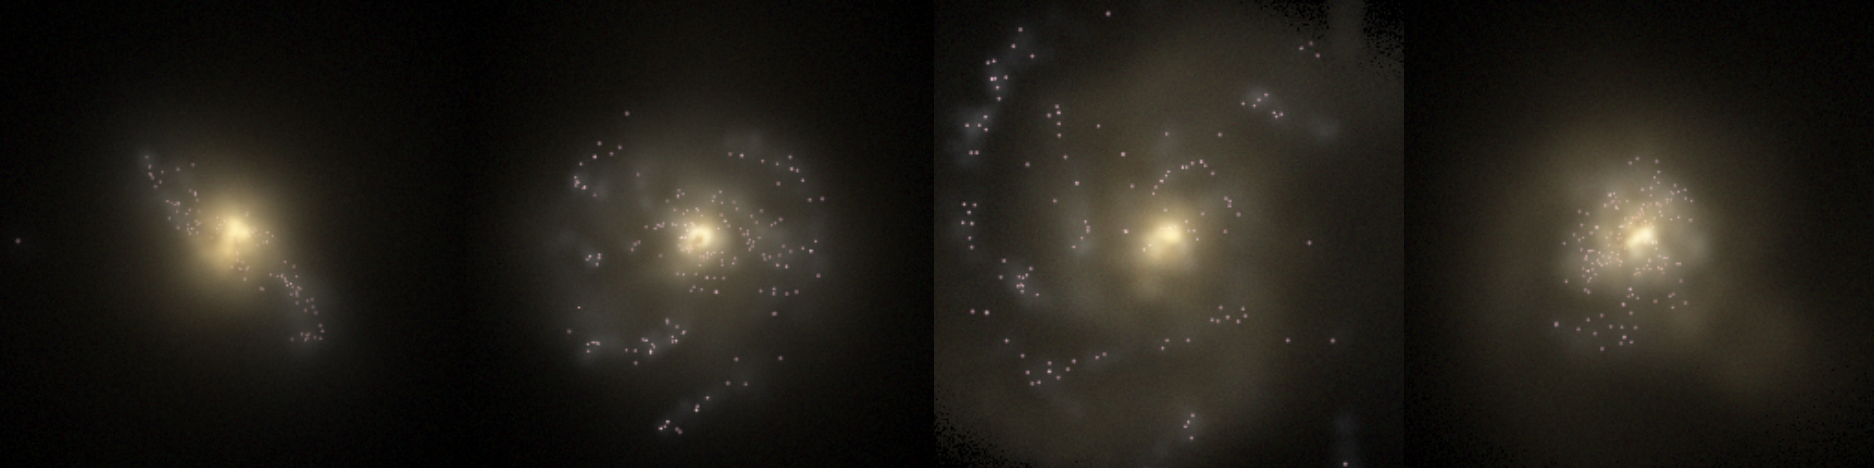
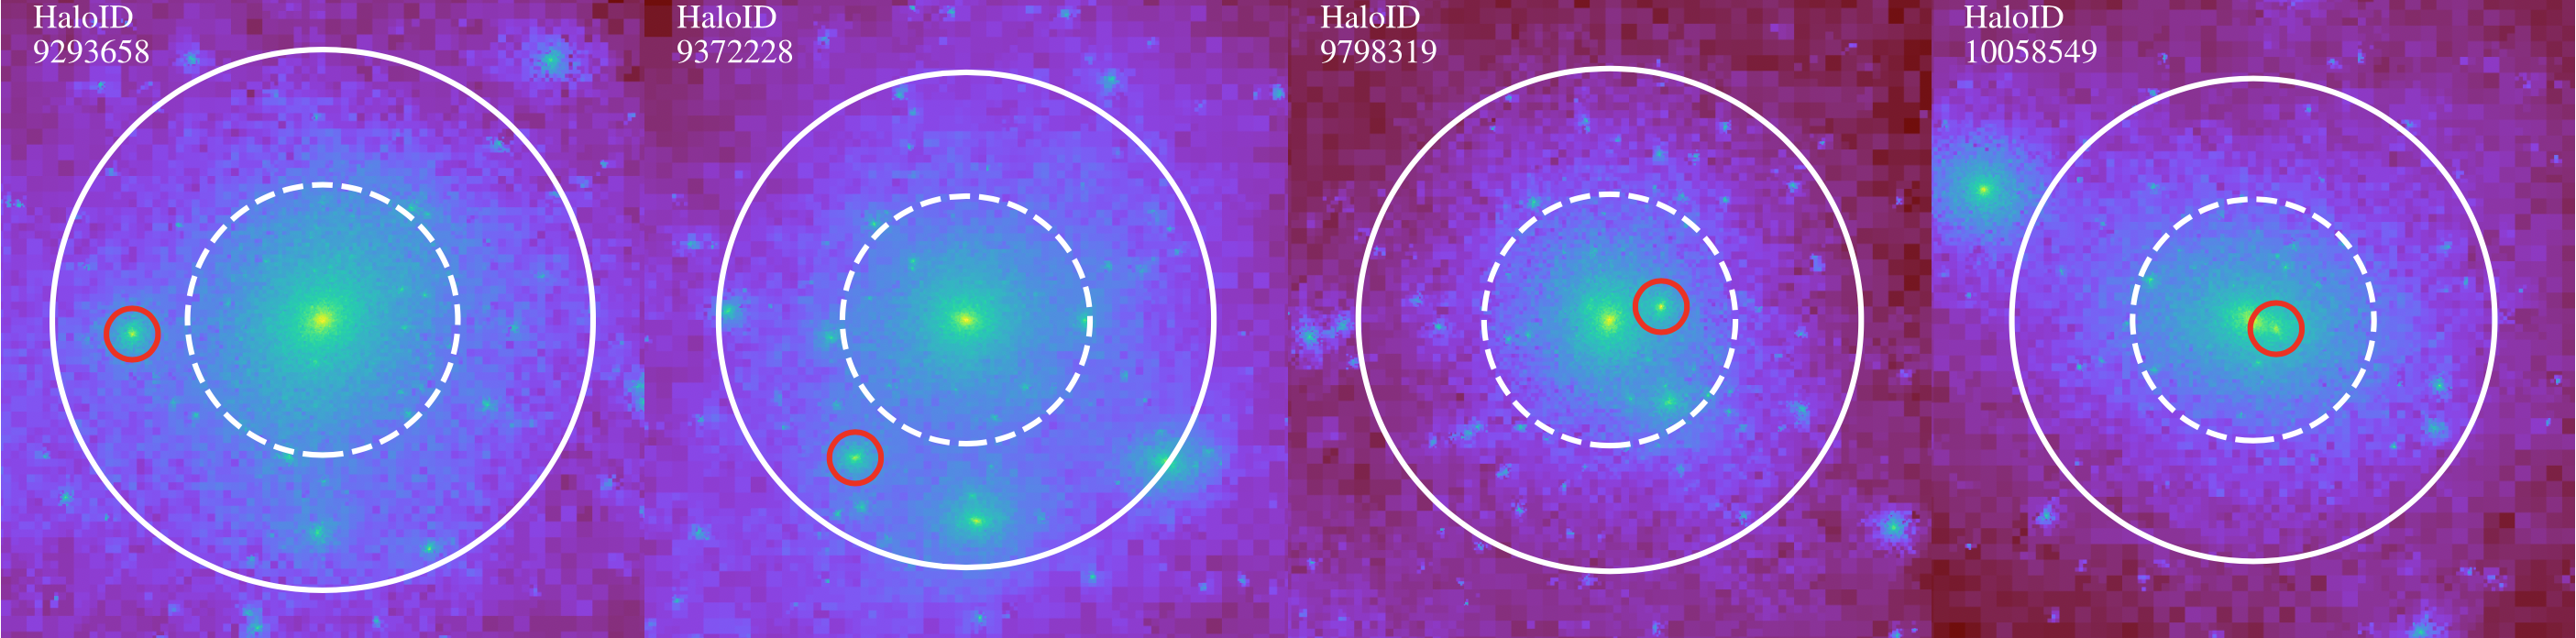
Four representative galaxies from our final LMC & GES sample are illustrated in Fig. 2 and Fig. 3. The former shows mock face-on images of the central galaxies at , where face-on has been defined according to the stellar angular momentum axis (Trayford et al., 2017)555Note that Trayford et al. (2017) states that the galactic plane is not always easily defined, which could explain the irregularity of the leftmost image in Fig. 2. The images have been retrieved from the EAGLE public database666http://virgodb.dur.ac.uk:8080/Eagle/. They have been produced by post-processed ray-tracing using a version of the code SKIRT (Camps & Baes, 2015); please see Trayford et al. (2017) for more details. Fig. 3 shows 2D projections of the dark matter particles in a region around the four haloes. The outer and inner circles mark the and boundaries. The LMC-mass satellite is highlighted in each halo with a red circle.
3 Results
| EAGLE | MW M200 | GES | GES merger | LMC | LMC infall | Number of |
|---|---|---|---|---|---|---|
| Halo ID | ( M⊙) | ( M⊙) | redshift | ( M⊙) | redshift | satellites |
| (a) | (b) | (c) | (d) | (e) | (f) | (g) |
| 8806615 | 1.13 | 5.2 | 2.01 | 2.16 | 0.37 | 6 |
| 9293658 | 0.99 | 2.9 | 1.00 | 1.29 | 0.27 | 8 |
| 9372228 | 0.76 | 7.4 | 1.49 | 2.16 | 0.27 | 9 |
| 9626514 | 0.80 | 6.2 | 1.00 | 1.26 | 0.1 | 13 |
| 9798319 | 0.80 | 9.0 | 1.74 | 1.27 | 0.74 | 12 |
| 9968042 | 0.79 | 7.8 | 1.00 | 1.46 | 0.37 | 6 |
| 10058549 | 0.71 | 9.9 | 1.26 | 3.34 | 0.62 | 10 |
We now present an overview of the properties of our various MW-mass categories defined in the previous section and their assembly histories. We start by examining the stellar and halo mass distributions and the stellar mass – halo mass relation.
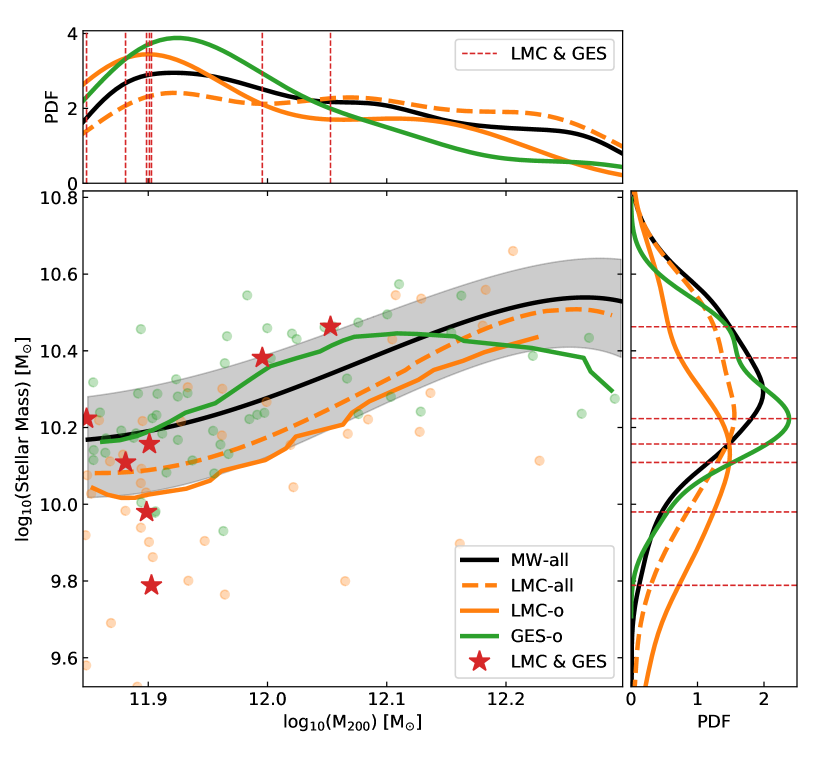
The halo mass distributions of our different MW-mass categories are displayed in the top panel of Fig. 4. The black line shows the distribution of halo masses for the MW-all sample. The mass distributions are approximately linear, with a slight bias towards lower mass haloes, as expected from the power law halo mass function in CDM in this mass range (Jenkins et al., 2001). The decrease in halo mass distributions at the lowest mass bins are an artefact introduced by the KDE kernel used for smoothing. The LMC-all sample (dashed orange line) follows the general MW-mass halo trend closely, although it is flatter and less biased towards lower masses. This classical LMC-all group is different from the LMC-o group shown as the solid orange line, which has a more prominent peak towards lower masses.
Fig. 4 shows that the halo mass of the MW is shifted towards lower values for both the LMC-o and GES-o samples (medians of and respectively). This effect is further enhanced when the MW has both an LMC and a GES. The seven LMC & GES galaxies are represented individually by vertical dashed red lines. Halo mass, by definition, is all the mass within and therefore includes the halo mass of the LMC-mass satellite.
The stellar mass-halo mass relationship is shown in the central panel of Fig. 4. The LMC-all and LMC-o samples appear to have a lower stellar mass compared to the total sample at any given halo mass. We, however, note that there are biases in the way halo and stellar masses are measured. The stellar mass includes the stellar particles within 30 kpc of the centre of the MW; however, the halo mass, , includes all mass within the FoF group (i.e. including the halo of the LMC which is generally more than 30 kpc away from the centre). Therefore, the difference is not a shift down in stellar mass for MWs with an LMC but rather a shift to the right in the stellar mass-halo mass plane.
The central panel of Fig. 4 suggests that the GES-o category has a higher than average stellar mass for a given halo mass in the range . However, the stellar mass distribution shown in the right panel shows that there is a small peak at slightly higher stellar mass for the GES-o sample than the average MW peak, but the main peak for the GES-o sample is at a slightly lower stellar mass than the average. This is because this category is biased towards lower halo masses (see top panel), and thus lower, on average, stellar masses. For low halo masses (), the LMC & GES sample has lower than average stellar mass, but for higher halo masses (log), it has higher than average stellar mass. The former is due to the aforementioned reason for LMC samples; namely, the stellar mass is measured for the central galaxy but halo mass includes the mass of LMC.
The right panel of Fig. 4 shows the distribution of stellar masses for each category of galaxies. The LMC-o sample has a peak at lower stellar masses than the MW-all sample, reflecting the lower halo masses seen in the top panel. The stellar masses of the LMC & GES sample are distributed across the entire range of stellar masses.
3.1 Assembly history
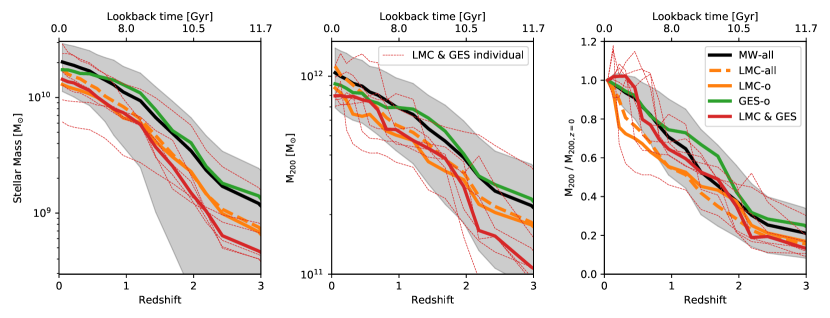
Fig. 5 shows the evolution of stellar mass (left panel), (middle panel), and the normalised halo mass (/; right panel) for each category of MW-mass galaxies. The thick lines show the median stellar mass and halo mass at each redshift for each sample.
The LMC-all category (dashed orange line) does not have any constraint on assembly history and is consistently lower in stellar and halo mass until the infall of its LMC-mass satellite. During infall, the LMC satellite gives rise to a sudden increase in halo mass, which leads to the LMC-all sample having the highest halo mass of all categories at . The LMC-o sample is consistently low in both stellar and halo mass. As in the case of the LMC-all sample, the LMC-o galaxies also show an increase in halo mass as the LMC-mass satellite is accreted by its host. However, unlike the LMC-all sample, the final halo masses are not particularly high, and, in fact, are lower on average than the MW-all sample. This difference reflects the fact the the LMC-o sample is constrained to have no other significant merger (other than the LMC), which naturally biases this sample to lower halo masses.
For the most part, the GES-o group follows the average MW but there is a clear bump in halo mass (central and right panels of Fig. 5) that appears roughly at the redshift of the merger with the GES. The stellar and halo masses of this category tends to follow the average MW until after the GES merger event has ended. Preceding this event, the stellar and halo mass rise more slowly than the average MW sample since the MW-all sample experiences more continuous mergers than the GES-o, and therefore has a continuous influx of accreted mass.
Initially, the LMC & GES galaxies have stellar and halo masses that are lower than those of the LMC-o sample. These galaxies then follow the evolution of the LMC-o category until the merger with the GES at , when it also shows a bump in halo mass similar to that in the GES-o category. Some of the individual LMC & GES galaxies show a very sudden increase in halo mass (in some cases almost double in mass) because of the accretion of the LMC-mass satellite. The stellar mass growth is much smoother than the halo mass growth. There is no bump in the stellar mass corresponding to the bump in halo mass since not all stars go to the centre of the MW (i.e. within 30kpc, the aperture used to calculate the stellar mass). The combination of the two events, the merger with the GES and the infall of the LMC increase the halo mass of the MW above the threshold of our definition MW-mass haloes. However, our results suggest that the main progenitor of the MW would have been much smaller than those of the other categories of MW-mass galaxies.
The difference in the assembly histories of our various MW categories is more apparent in the right-hand panel of Fig. 5, which shows the normalised halo mass as a function of redshift. There is a clear bump in the GES-o sample (green line) around the redshift of the GES merger with the MW. There is also clearly a sudden increase in halo mass of the LMC-o sample (solid orange line) at infall time of the LMC-mass satellite. Some of the LMC & GES individual galaxies (red dashed lines) go above , which is likely due to the infall of the LMC-mass satellite, followed by tidal stripping.
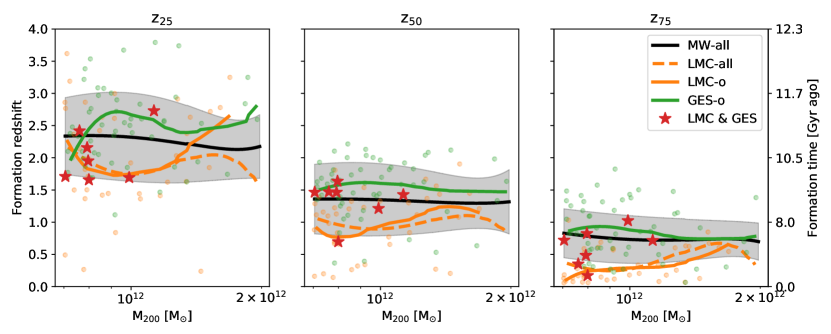
We use the normalised halo mass assembly to define halo formation redshifts, , for each MW-mass galaxy as the time when the main progenitor branch of the merger tree reaches X percent of the present-day M200. Fig. 6 shows , , and of our MW samples in the left, middle and right panels respectively.
Due to the sudden increase in halo mass resulting from the infall of the LMC-mass satellite, the formation redshifts of the LMC-all and LMC-o categories are shifted to lower values across all three panels. The formation redshift is the most affected by this since this is roughly the infall time of the LMC-like satellites, particularly for the lower halo mass galaxies.
The GES-o sample has a consistently earlier formation redshifts across all three panels. The left panel suggests that the GES-o galaxies form 25% of their mass earlier than the other samples even before the merger with the GES. The middle panel shows that the formation redshift occurs at roughly the same redshift as the merger with the GES, and the right panel shows that after the merger with the GES, the MW-mass galaxies follow the MW-all sample more closely.
Overall, Fig. 6 suggests that the LMC & GES galaxies tend to have later formation redshifts, similar to the LMC-o formation redshifts. This is expected since in that time interval the GES is only beginning to merge with the MW and so the galaxy has experienced roughly the same amount of merging as the LMC-o category. The middle panel shows that the formation redshifts of the LMC & GES follow more closely the GES-o line, which is likely due to the merger of the GES occurring at roughly these redshifts. Finally, the right panel shows that the LMC & GES return to follow the LMC-o lines for the formation redshifts, likely due to the imminent infall of the LMC-like satellites. Figs. 5 and 6 show that the assembly history of the MW intricately follows the details of these two (GES & LMC) accretion events, and, at most redshifts, looks very different to the average MW-mass halo.
3.2 Galaxy colour and morphology
Assembly histories are reflected in the morphology of galaxies. Our selection of samples of MW-mass galaxies with different constraints (Section 2.2) does not include any criteria for the MW to be a star-forming spiral galaxy rather than a red, non-star forming elliptical galaxy. In this section, we show how the assembly history affects the colours of our galaxies.
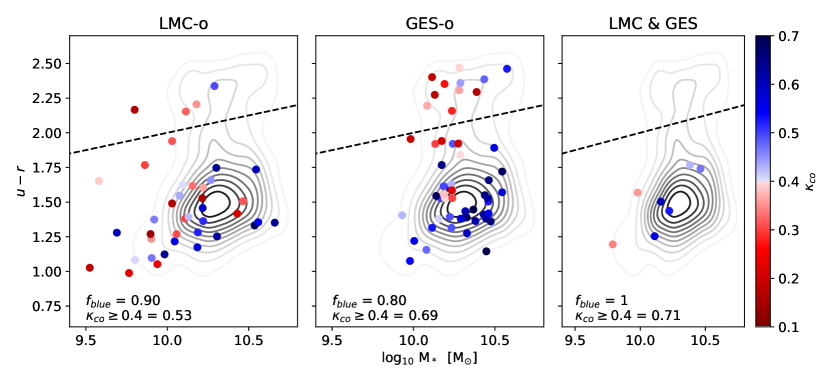
To characterize the MW-mass galaxies we consider their colour and morphology. The rest-frame absolute magnitude without dust attenuation was used to estimate the colour; see Trayford et al. (2015) for details. We adopt the threshold defined by Schawinski et al. (2014) to label galaxies as blue or red (dashed line in Fig. 7). The fraction of blue galaxies for the MW-all sample is f.
Fig. 7 shows the colour-stellar mass diagram for our MW-mass haloes. The grey contours, repeated in all panels, correspond to the distribution for the MW-all group which is clearly bimodal showing a red sequence and a blue cloud. Different panels correspond to the various categories of MW-mass galaxies, as labelled, with the colour of each point indicating whether they are disc (blue) or elliptical (red) galaxies. To characterise morphology we use the stellar kinematics morphological indicator introduced by Sales et al. (2012) and calculated for EAGLE galaxies by Correa et al. (2017). The fraction of disc galaxies (i.e. with ) for the MW-all sample is 0.6.
The left panel shows that the LMC-o sample contains more blue galaxies than average, with f. This is likely due to the late formation redshift discussed previously, and the restriction that there should be no significant mergers until the LMC infall. However, fewer galaxies in the LMC-o sample are disc galaxies compared to the MW-all sample. The middle panel shows that the GES-o sample contains a similar fraction of blue galaxies as the MW-all sample but a much higher fraction of disc galaxies. Since GES-o galaxies experience an early merger event (and hence have an earlier formation redshift) they are more likely to become redder with time. The right panel shows that the LMC & GES galaxies are all in the blue cloud. This is consistent with the trend seen in the LMC-o sample that the later forming galaxies are more likely to be bluer. The LMC & GES sample also has the highest fraction of disc galaxies, 0.71, similar to the GES-o sample.
3.3 Satellite population
In this subsection we examine the satellite population of our MW samples and investigate whether the LMC & GES sample is different in this respect to the other samples. As shown in the simulations of the APOSTLE project (Sawala et al., 2016; Fattahi et al., 2016), the EAGLE model reproduces well the observed stellar mass function for dwarfs galaxies, both those that are satellites orbiting in the MW and those in the field around the Local Group. Several important properties of dwarf galaxies, such as their sizes and star formation histories, are also consistent with observations (Campbell et al., 2017; Sawala et al., 2016; Bose et al., 2019a; Sales, 2016; Bose et al., 2019b; Digby et al., 2019).
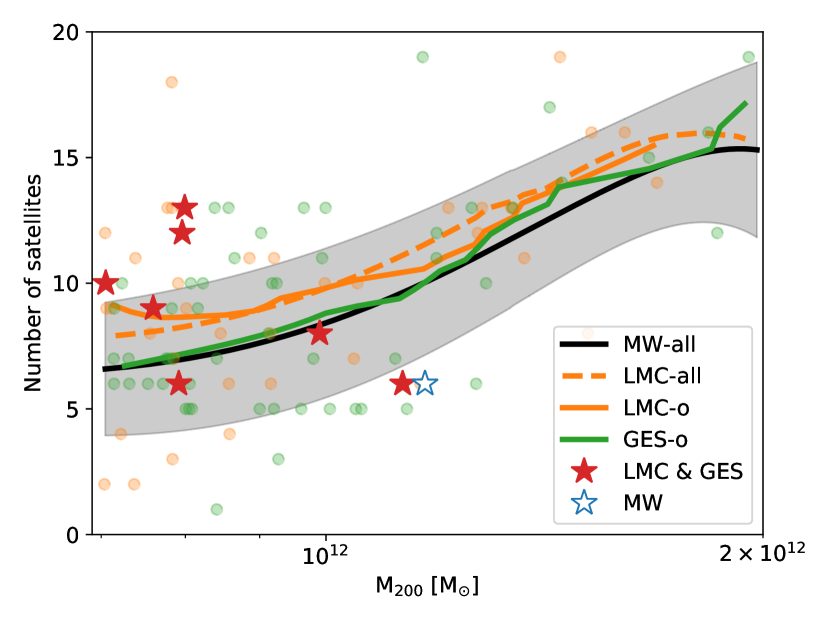
The number of ‘luminous’ satellites as a function of halo mass for our various samples is shown in Fig. 8. Since EAGLE does not resolve ultra-faint dwarfs, the satellites plotted are those with stellar mass above that are within the virial radius of the MW-mass haloes. The mass and number of satellites above this stellar mass within the radius of our Galaxy is shown as a blue open star symbol. Here, the halo mass of the MW and its radius are taken from Callingham et al. (2019) and the stellar masses and Galactocentric distances of the MW satellites from McConnachie (2012).
Fig. 8 shows the well-known correlation between the number of satellites and the halo mass (Wang et al., 2012). The LMC-all and LMC-o samples have slightly higher numbers of satellites at fixed halo mass than the MW-all sample. This is probably because the LMC-mass dwarfs would have brought in their own satellite cohorts (Shao et al., 2019). The GES-o sample has a very similar trend to the MW-all sample, possibly because these galaxies have a similar late-time assembly history to the MW-all galaxies (Fig. 5 right panel) when the bulk of the satellite population is accreted (Fattahi et al., 2020). At low halo masses, the infall of the LMC-like satellite (in LMC-all, LMC-o and LMC & GES samples) has a much larger impact as it is fractionally much larger compared to the host than for higher halo mass MW galaxies. We also examined the radial distribution of satellites and found no discernible differences between the different categories of MW-like galaxies. However, we note that we do not take “orphan” satellites into consideration, which can make a substantial difference to the radial profiles (Bose et al., 2019b).
4 Discussion and Conclusions
We have used the EAGLE hydrodynamical simulation to assess the extent to which the two known major accretion events experienced by our Galaxy –the Gaia/Enceladus/Sausage (GES) merger at early times and the more recent infall of the LMC– have shaped the properties of our galaxy. We have also tested whether these events make the MW stand out amongst galaxies of similar mass.
We identified 1078 MW-mass haloes in the mass range and subdivided this sample into three: (i) galaxies with an LMC-mass satellite within their virial radius at (LMC-all sample); (ii) galaxies with an LMC as in (i), but which did not experience a GES merger event or accrete any other more massive dwarfs than that in the past 8 Gyrs (LMC-o sample); (iii) galaxies that experienced a merger between similar to the GES but no further large mergers (GES-o sample); and (iv) galaxies that experienced both a GES merger and the accretion of an LMC-mass satellite but no other significant mergers in between these two (LMC & GES sample). Only 7 galaxies fall in the last category; their assembly histories bear the closest resemblance to the assembly history of the MW, as far as it is currently known. Our main conclusions are as follows:
-
•
In agreement with earlier work, we find that the presence of an LMC-mass satellite orbiting a MW-mass galaxy is relatively uncommon: only 15.7% of galaxies fall in our LMC-all category. However, once the constraint is imposed that there should have been no massive mergers in the past 8 Gyr, the frequency is reduced to 3.7% (LMC-o). The number of MW-mass galaxies with a GES event between (GES-o) amounts to 5% of the total sample. These fractions are slightly higher than in other studies (e.g. Cautun et al., 2019; Bignone et al., 2019) because of different ways of identifying the LMCs and GES in simulations.
-
•
The assembly history of the MW is rare in the CDM model: only 0.65% of MW-mass EAGLE galaxies have both an early GES merger and a late LMC infall and no significant mergers in between. This sample most closely resembles the assembly history of the Milky Way.
-
•
The existence of an LMC or a GES event selects haloes towards the lower end of the mass range we considered. Requiring both events further lowers the halo mass.
-
•
At a fixed halo mass, galaxies with an LMC (with or without the restriction on past mergers) have lower than average stellar mass. This bias is partly a matter of definition since the stellar mass of the galaxy is measured within 30 kpc, well inside the position of a typical LMC, whereas the mass of the halo is measured out to .
-
•
Haloes destined to accrete an LMC have lower than average mass at early times but “catch up” at late times once the LMC has been accreted. The GES-o sample closely follows the accretion history of the MW-all sample until the merger with the GES around , after which the increase in halo mass is much slower. Haloes in the LMC & GES sample have much lower initial masses but they experience large increases in mass at the time of the merger with the GES and the later infall of the LMC. As a result, the formation redshift of the LMC & GES haloes (defined as the time when 50% of the final halo mass was in place) ends up being typical of haloes of that mass.
-
•
Although no constraints on the morphology, colour or star formation rate of the final galaxy were applied in the sample selection, the LMC & GES galaxies all fall in the “blue cloud” in the colour-stellar mass diagram. This is a reflection of the long period without massive mergers required for this sample. Using a kinematical diagnostic of galaxy morphology (the fraction of the kinetic energy invested in rotation), the LMC & GES galaxies are predominantly disc galaxies: whereas 60% of the MW-all sample are discs according to this definition, 70% of the LMC & GES sample are discs.
-
•
Galaxies with an LMC have more satellites than galaxies without one, including those with a GES event. The excess is due to the additional satellite population brought into the MW halo by the LMC.
Our simulations indicate that the build-up of both the stellar and dark matter mass in the Milky Way were strongly influenced by the GES merger and the accretion of the LMC. We therefore expect the progenitors of the MW, perhaps accessible to observational study with forthcoming telescopes such as JWST, to be atypical of galaxies of similar mass today.
The main limitation of this work is the relatively small volume sampled by the EAGLE simulation: there are only 7 galaxies in the EAGLE volume that satisfy the main constraints we imposed for the assembly history to resemble that of the MW, namely an early GES merger, a late LMC infall and a quiescent phase in between. A larger simulation is required to understand in more detail the atypical properties of the assembly history of the MW.
Acknowledgements
TE is supported by a Royal Society Research Grant, and AD by a Royal Society University Research Fellowship. AF is supported by a Marie-Curie COFUND/Durham Junior Research Fellowship (under grant agreement no. 609412). CSF is supported by ERC Advanced Investigator grant, DMIDAS [GA 786910]. We acknowledge support by the Science and Technology Facilities Council (STFC) [grant numbers ST/T000244/1, ST/P000541/1]. This work used the DiRAC Data Centric system at Durham University, operated by the ICC on behalf of the STFC DiRAC HPC Facility (www.dirac.ac.uk). This equipment was funded by BIS National E-infrastructure capital grant ST/K00042X/1, STFC capital grant ST/H008519/1, and STFC DiRAC Operations grant ST/K003267/1 and Durham University. DiRAC is part of the National E-Infrastructure. This research made use of the open source project yt (Turk et al., 2010).
References
- Abadi et al. (2006) Abadi M. G., Navarro J. F., Steinmetz M., 2006, Monthly Notices of the Royal Astronomical Society, 365, 747
- Amorisco (2017) Amorisco N. C., 2017, Monthly Notices of the Royal Astronomical Society, 464, 2882
- Bell et al. (2017) Bell E. F., Monachesi A., Harmsen B., de Jong R. S., Bailin J., Radburn-Smith D. J., D’Souza R., Holwerda B. W., 2017, The Astrophysical Journal Letters, 837, L8
- Belokurov et al. (2018) Belokurov V., Erkal D., Evans N. W., Koposov S. E., Deason A. J., 2018, Monthly Notices of the Royal Astronomical Society, 478, 611
- Benson et al. (2002) Benson A. J., Frenk C. S., Lacey C. G., Baugh C. M., Cole S., 2002, MNRAS, 333, 177
- Bignone et al. (2019) Bignone L. A., Helmi A., Tissera P. B., 2019, The Astrophysical Journal Letters, 883, L5
- Bose et al. (2019a) Bose S., et al., 2019a, MNRAS, 486, 4790
- Bose et al. (2019b) Bose S., Deason A. J., Belokurov V., Frenk C. S., 2019b, arXiv e-prints, 1909, arXiv:1909.04039
- Boylan-Kolchin et al. (2011) Boylan-Kolchin M., Bullock J. S., Kaplinghat M., 2011, Monthly Notices of the Royal Astronomical Society, 415, L40
- Bullock & Johnston (2005) Bullock J. S., Johnston K. V., 2005, The Astrophysical Journal, 635, 931
- Busha et al. (2011) Busha M. T., Marshall P. J., Wechsler R. H., Klypin A., Primack J., 2011, The Astrophysical Journal, 743, 40
- Callingham et al. (2019) Callingham T. M., et al., 2019, Monthly Notices of the Royal Astronomical Society, 484, 5453
- Campbell et al. (2017) Campbell D. J. R., et al., 2017, Monthly Notices of the Royal Astronomical Society, 469, 2335
- Camps & Baes (2015) Camps P., Baes M., 2015, Astronomy and Computing, 9, 20
- Cautun et al. (2019) Cautun M., Deason A. J., Frenk C. S., McAlpine S., 2019, Monthly Notices of the Royal Astronomical Society, 483, 2185
- Conroy et al. (2019) Conroy C., Naidu R. P., Zaritsky D., Bonaca A., Cargile P., Johnson B. D., Caldwell N., 2019, The Astrophysical Journal, 887, 237
- Cooper et al. (2010) Cooper A. P., et al., 2010, Monthly Notices of the Royal Astronomical Society, 406, 744
- Correa et al. (2017) Correa C. A., Schaye J., Clauwens B., Bower R. G., Crain R. A., Schaller M., Theuns T., Thob A. C. R., 2017, Monthly Notices of the Royal Astronomical Society, 472, L45
- Crain et al. (2015) Crain R. A., et al., 2015, Monthly Notices of the Royal Astronomical Society, 450, 1937
- Davis et al. (1985) Davis M., Efstathiou G., Frenk C. S., White S. D. M., 1985, The Astrophysical Journal, 292, 371
- Deason et al. (2019) Deason A. J., Belokurov V., Sanders J. L., 2019, Monthly Notices of the Royal Astronomical Society, 490, 3426
- Digby et al. (2019) Digby R., et al., 2019, Monthly Notices of the Royal Astronomical Society, 485, 5423
- Eggen et al. (1962) Eggen O. J., Lynden-Bell D., Sandage A. R., 1962, The Astrophysical Journal, 136, 748
- Elias et al. (2020) Elias L. M., Sales L. V., Helmi A., Hernquist L., 2020, arXiv:2003.03381 [astro-ph]
- Evans (2020) Evans N. W., 2020, arXiv e-prints, 2002, arXiv:2002.05740
- Fattahi et al. (2016) Fattahi A., et al., 2016, Monthly Notices of the Royal Astronomical Society, 457, 844
- Fattahi et al. (2019) Fattahi A., et al., 2019, Monthly Notices of the Royal Astronomical Society, 484, 4471
- Fattahi et al. (2020) Fattahi A., et al., 2020, arXiv e-prints, 2002, arXiv:2002.12043
- Font et al. (2006) Font A. S., Johnston K. V., Bullock J. S., Robertson B. E., 2006, The Astrophysical Journal, 646, 886
- Garavito-Camargo et al. (2019) Garavito-Camargo N., Besla G., Laporte C. F. P., Johnston K. V., Gomez F. A., Watkins L. L., 2019, The Astrophysical Journal, 884, 51
- Gomez et al. (2015) Gomez F. A., Besla G., Carpintero D. D., Villalobos A., O’Shea B. W., Bell E. F., 2015, The Astrophysical Journal, 802, 128
- Harmsen et al. (2017) Harmsen B., Monachesi A., Bell E. F., de Jong R. S., Bailin J., Radburn-Smith D. J., Holwerda B. W., 2017, Monthly Notices of the Royal Astronomical Society, 466, 1491
- Helmi et al. (2018) Helmi A., Babusiaux C., Koppelman H. H., Massari D., Veljanoski J., Brown A. G. A., 2018, Nature, 563, 85
- Jenkins et al. (2001) Jenkins A., Frenk C. S., White S. D. M., Colberg J. M., Cole S., Evrard A. E., Couchman H. M. P., Yoshida N., 2001, Monthly Notices of the Royal Astronomical Society, 321, 372
- Kallivayalil et al. (2013) Kallivayalil N., Marel R. P. v. d., Besla G., Anderson J., Alcock C., 2013, The Astrophysical Journal, 764, 161
- Kruijssen & Portegies Zwart (2009) Kruijssen J. M. D., Portegies Zwart S. F., 2009, ApJ, 698, L158
- Kruijssen et al. (2020) Kruijssen J. M. D., et al., 2020, arXiv:2003.01119 [astro-ph]
- Laporte et al. (2018) Laporte C. F. P., Gómez F. A., Besla G., Johnston K. V., Garavito-Camargo N., 2018, Monthly Notices of the Royal Astronomical Society, 473, 1218
- Libeskind et al. (2005) Libeskind N. I., Frenk C. S., Cole S., Helly J. C., Jenkins A., Navarro J. F., Power C., 2005, Monthly Notices of the Royal Astronomical Society, 363, 146
- Liu et al. (2011) Liu L., Gerke B. F., Wechsler R. H., Behroozi P. S., Busha M. T., 2011, The Astrophysical Journal, 733, 62
- Lynden-Bell (1976) Lynden-Bell D., 1976, Monthly Notices of the Royal Astronomical Society, 174, 695
- Mackereth et al. (2019) Mackereth J. T., et al., 2019, Monthly Notices of the Royal Astronomical Society, 482, 3426
- McAlpine et al. (2016) McAlpine S., et al., 2016, Astronomy and Computing, 15, 72
- McConnachie (2012) McConnachie A. W., 2012, The Astronomical Journal, 144, 4
- Metz et al. (2008) Metz M., Kroupa P., Libeskind N. I., 2008, The Astrophysical Journal, 680, 287
- Myeong et al. (2018) Myeong G. C., Evans N. W., Belokurov V., Sanders J. L., Koposov S. E., 2018, The Astrophysical Journal Letters, 863, L28
- Myeong et al. (2019) Myeong G. C., Vasiliev E., Iorio G., Evans N. W., Belokurov V., 2019, Monthly Notices of the Royal Astronomical Society, 488, 1235
- Penarrubia et al. (2009) Penarrubia J., Walker M. G., Gilmore G., 2009, Monthly Notices of the Royal Astronomical Society, 399, 1275
- Penarrubia et al. (2016) Penarrubia J., Gomez F. A., Besla G., Erkal D., Ma Y.-Z., 2016, Monthly Notices of the Royal Astronomical Society: Letters, 456, L54
- Pfeffer et al. (2020) Pfeffer J. L., Trujillo-Gomez S., Kruijssen J. M. D., Crain R. A., Hughes M. E., Reina-Campos M., Bastian N., 2020, arXiv e-prints, 2003, arXiv:2003.00076
- Planck Collaboration et al. (2014) Planck Collaboration et al., 2014, Astronomy and Astrophysics, 571, A1
- Sales (2016) Sales L., 2016, HST Proposal, p. 14582
- Sales et al. (2012) Sales L. V., Navarro J. F., Theuns T., Schaye J., White S. D. M., Frenk C. S., Crain R. A., Dalla Vecchia C., 2012, Monthly Notices of the Royal Astronomical Society, 423, 1544
- Savitzky & Golay (1964) Savitzky A., Golay M. J. E., 1964, Analytical Chemistry, 36, 1627
- Savorgnan et al. (2016) Savorgnan G. A. D., Graham A. W., Marconi A., Sani E., 2016, The Astrophysical Journal, 817, 21
- Sawala et al. (2016) Sawala T., et al., 2016, Monthly Notices of the Royal Astronomical Society, 457, 1931
- Schaller et al. (2015a) Schaller M., et al., 2015a, Monthly Notices of the Royal Astronomical Society, 451, 1247
- Schaller et al. (2015b) Schaller M., Dalla Vecchia C., Schaye J., Bower R. G., Theuns T., Crain R. A., Furlong M., McCarthy I. G., 2015b, Monthly Notices of the Royal Astronomical Society, 454, 2277
- Schawinski et al. (2014) Schawinski K., et al., 2014, Monthly Notices of the Royal Astronomical Society, 440, 889
- Schaye et al. (2015) Schaye J., et al., 2015, Monthly Notices of the Royal Astronomical Society, 446, 521
- Shao et al. (2018) Shao S., Cautun M., Deason A. J., Frenk C. S., Theuns T., 2018, Monthly Notices of the Royal Astronomical Society, 479, 284
- Shao et al. (2019) Shao S., Cautun M., Frenk C. S., 2019, Monthly Notices of the Royal Astronomical Society, 488, 1166
- Springel (2005) Springel V., 2005, Monthly Notices of the Royal Astronomical Society, 364, 1105
- Tollerud et al. (2011) Tollerud E. J., Barton E. J., Bullock J. S., Trinh C., 2011, ] 10.1051/eas/1148098, 48, 455
- Tolstoy et al. (2009) Tolstoy E., Hill V., Tosi M., 2009, Annual Review of Astronomy and Astrophysics, 47, 371
- Trayford et al. (2015) Trayford J. W., et al., 2015, Monthly Notices of the Royal Astronomical Society, 452, 2879
- Trayford et al. (2017) Trayford J. W., et al., 2017, Monthly Notices of the Royal Astronomical Society, 470, 771
- Turk et al. (2010) Turk M. J., Smith B. D., Oishi J. S., Skory S., Skillman S. W., Abel T., Norman M. L., 2010, The Astrophysical Journal Supplement Series, 192, 9
- Wang et al. (2012) Wang J., Frenk C. S., Navarro J. F., Gao L., Sawala T., 2012, MNRAS, 424, 2715