Comparison and Benchmark of Graph Clustering Algorithms
Abstract
Graph clustering is widely used in analysis of biological networks, social networks and etc. For over a decade many graph clustering algorithms have been published, however a comprehensive and consistent performance comparison is not available. In this paper we benchmarked more than 70 graph clustering programs to evaluate their runtime and quality performance for both weighted and unweighted graphs. We also analyzed the characteristics of ground truth that affects the performance. Our work is capable to not only supply a start point for engineers to select clustering algorithms but also could provide a viewpoint for researchers to design new algorithms.
Keywords— Network, Graph Clustering, Benchmark
1 Introduction
Comparison of graph clustering algorithms is not new and has been discussed in academic literature, but not thoroughly. Most of comparisons are only for a few of them and seldom report runtime performance. [32] leveraged LFR benchamrk to test clustering perfomrance for about 11 algorithms up to year 2010. [30] tested community detection algorithms for overlapped graphs with CPM algorithm. [76] benchmarked 8 algorithms available in iGraph [13].
When we were working on our previous work of Sparc [61, 39], it was demanding to know a better algorithm than LPA that works on large graphs. However we can not find a comprehensive study which resulting initiating this work. In this paper we tested on more than 70 clustering programs published in last decade. We both analyzed their quality performance and runtime performance.
Definition
A graph is defined as a set of vertices and a set of edges where . We use and to denote the number of edges and number of vertices.
An undirected graph does not distinguish the order of the vertices of an edge , while a directed graph takes and as two different edges. To be uniform we always put both and in for an undirected graph. If it is not specified in this text, it always assumes undirected graphs.
A weighted function may defined on edges as to consider the importance of edges. Most commonly weights are always positive. If it is not specified in this text, it always assumes unweighted graphs.
A clustering of a graph is a collection of subset of , that is . Each element in is called a cluster or a community. It usually assumes that the union of clusters of a clustering covers (otherwise we can always create a new cluster for the remaining vertices). If , , is not overlapped, others it is overlapped. If it is not specified in this text, it always assumes it is not overlapped.
1.1 Graph Properties
Here is some commonly used properties of a graph.
Density
The density of a graph is defined as
Diameter
The diameter of a graph is the length of its longest shortest path among all pairs of nodes. effect diameter is more stable and defined as 90th of the distribution of shortest path lengths.
Centrality
Degree centrality of a vertex is defined as . Farness centrality of a vertex is the average shortest path length to all other nodes that reside in the same connected component as . Farness centrality is the reciprocal of farness centrality.
Eccentricity
Eccentricity of a vertex is the largest shortest-path distance from the node to any other node in the Graph.
Clustering coefficient
Global clustering coefficient is defined as the ratio between the number of closed triplets and the number of all triplets. Local clustering coefficient is defined in [70] to determine whether a graph is a small-world network.
2 Clustering Measures
To evaluate the quality of a clustering, both fitness measures and score measures can be used.
2.1 Fitness Measures
Fitness measures evaluate the performance of a clustering by inspecting the properties of intraconnection and interconnection of clusters. Fitness measures are defined on a graph or a subgraph. Many algorithms depend on certain measures to make a decision. Although they are vital in designing algorithms, we found that they are not very useful when evaluating clustering result. However we put them here briefly for completeness. Please refer to [74] which provides a more detailed description for some of them.
sum of intra weights
The summation of intra weights for a cluster is defined as
where is weight function.
sum of out weights
The summation of out weights for a cluster is defined as
where is weight function.
expansion
Expansion of a cluster is defined as
.
cut ratio
Cut ratio of a cluster is defined as
.
intra cluster density
Intra cluster density of a cluster for a unweighted graph is defined as
where is the edge set of subgraph induced by .
inter cluster density
Inter cluster density of a cluster for a unweighted graph is defined as
where is the vertices set of subgraph induced by .
relative cluster density
relative cluster density of a cluster is defined as
.
modularity
The modularity of a unweighted graph is defined as
where is the sum of weights. For unweighted graph it is indentical to
where is the adjacency matrix , is indicator function, is the expected number of random edges between the two nodes.
conductance
Conductance of a cluster is defined as
normalized cut
Normalized cut of a cluster is defined as
out degree fraction
Maximum out degree fraction of a cluster is defined as
Average out degree fraction of a cluster is defined as
Flake out degree fraction of a cluster is defined as
separability
The separability of a cluster is defined as
coefficient
For a cluster, similar to a graph, global clustering coefficient and local clustering coefficient can be defined on the induced subgraph of the cluster.
2.2 Score Measures
Score Measures evaluate performance by comparing clusters to its corresponding ground truth. Score measures are better choices to evaluate performance when ground truth is available (e.g. benchmark graphs)
mutual information (MI)
Assume , are two clusterings of a graph , the mutual information between the two clusters is defined as
normalized mutual info score (NMI)
Assume , are two clusterings of a graph , the normalized mutual information between the two clusters is defined as
where is the entropy function.
adjusted mutual information (ami)
Assume , are two clusterings of a graph , the adjusted normalized mutual information between the two clusters is defined as
where is the entropy function and is the adjustment for mutual information [69].
adjusted rand score (ARS)
Rand index is defined as
where TP is the number of true positives, TN is the number of true negatives, FP is the number of false positives, and FN is the number of false negatives.
V-measure score
Support is the ground truth, and is a clustering, V-measure score [54] is the harmonic mean between homogeneity (or purification) and completeness, that is
where , where is entropy function and is conditional entropy function.
3 Algorithms
This section describes a few of algorithms that were tested in this paper. The descriptions are mainly excerpted from the original papers and not all the algorithms are covered. Please find references by Table LABEL:tbl:graph_support or online documentation.
Infomap
Infomap [55] introduced an information theoretic approach that reveals community structure in weighted and directed graphs. To find a partition of a graph, the algorithm minimizes the expected description length of a random walk (a.k.a map equation) defined as
where the first part is the entropy of the movement between partitions, and the second part is the entropy of movements within partitions.
Hierarchical Infomap (infohiermap)
Hierarchical map equation [57] extended map equation to enable multiple levels partitions of a graph.
where is the description length of submap which is defined recursively until the finest level
Order Statistics Local Optimization Method (OSLM)
OSLOM [35] is capable to detect clusters in networks accounting for edge directions, edge weights, overlapping communities, hierarchies and community dynamics. It is based on the local optimization of a fitness function expressing the statistical significance of clusters with respect to random fluctuations, which is estimated with tools of Extreme and Order Statistics.
COPRA (Community Overlap PRopagation Algorithm)
COPRA [22] finds overlapping community structure by extending the label propagation algorithm to include information about more than one community.
Louvain
Louvain [6] is method that greedily optimize the modularity of a graph. The algorithm initially assigns a partition for each vertex, then a two-step process are repeated until maximum modularity is achieved.
In the first step it greedily merges partitions until no gain got. In the second step, a new graph is built whose nodes are partitions in the first step.
Label Propagation Method/Algorithm(LPM, LPA)
LPA or LPM [50] is a simple algorithm that propagates the labels (partition ids) to neighbors, then updates the labels by voting.
GANXiSw (SLPA)
SLPA [72] (Speaker-listener Label Propagation Algorithm) is an extension of LPA that discovers overlapping structures according to dynamic interaction rules
HiReCS
HiReCS 111http://www.lumais.com/hirecs a C++ clustering library for the multi-scale hierarchical community structure discovery with crisp overlaps.
LabelRank
LabelRank [71] proposed strategies to stabilized the LPA and to extend MCL approach to resolve the randomness issue in traditional label propagation algorithms (LPA).
CONGA
CONGA [21] (Cluster-Overlap Newman Girvan Algorithm) is a method that discovers overlapping communities in networks, by extending Girvan and Newman’s well-known algorithm based on the betweenness centrality measure.
CliquePercolation
CliquePercolation [29] is a fast community detection method in weighted and unweighted networks, for cliques of a chosen size. It is based on sequentially inserting the constituent links to the network and simultaneously keeping track of the emerging community structure.
Connected Iterative Scan(CIS)
Connected Iterative Scan is also known at times as Locally Optimal Sets. Refer to [27] for details.
DEMON
DEMON (Democratic Estimate of the Modular Organization of a Network) [11] is a local-first approach to cluster discovery. It first democratically let each node vote for the communities in its limited surrounding view of the global system using a label propagation algorithm. Then the local communities are merged into a global collection.
EAGLE
EAGLE (agglomerativE hierarchicAl clusterinG based on maximaL cliquE) [60] is a algorithm that detects both the overlapping and hierarchical properties of complex community structure together. It deals with the set of maximal cliques and adopts an agglomerative framework, where the quality function of modularity is extended to evaluate the goodness of a cover.
FastCpm
Greedy Clique Expansion (GCE) Community Finder
GCE [37] first detects a set of seeds in graph G, then expanding these seeds in series by greedily maximizing a local community fitness function, and then finally accepts only those communities that are not near-duplicates of communities that have already been accepted. The fitness function of community is defined as
where and is the internal and external degrees of .
Hierarchical Demon (HDEMON)
Hierarchical Demon [12] extended the DEMON algorithm by introducing the possibility of returning the hierarchical organization of the communities.
Link communities algorithm
Link communities algorithm [2] is a hierarchical clustering algorithm through link dendrogram by a similarity function between links
where is the the neighbor nodes of node .
Model-based Overlapping Seed Expansion (MOSE)
MOSE [44] algorithm is based on a statistical model of community structure, which is capable of detecting highly overlapping community structure, especially when there is variance in the number of communities each node is in.
Fast Multi-Scale Community Detection Tools (MSCD)
MSCD [36] is a method compatible with global and local criteria that enables fast multi-scale community detection on large networks. It was implemented with 6 known criteria of HSLSW, LFK, RB, RN, SO and AFG.
Model-based Overlapping Seed Expansion (ParCPM)
ParCPM [20] is a novel, parallel k-clique community detection method, based on an innovative technique which enables connected components of a network to be obtained from those of its subnetworks.
SVINET
SVINET [19] implements sampling based algorithms that derive from stochastic variational inference under the (assortative) mixed-membership stochastic blockmodel.
Top Graph Clusters (TopGC)
TopGC [41] implements probabilistically finds the best well connected, clique-like clusters within large graphs. It is inherently parallelizable, and runs in linear time on the graph size.
Clique Modularity
Clique modularity algorithm [73] optimizes modularity by detecting disjoint cliques and then merges these.
CGGC (Core Groups Graph ensemble Clustering)
CGGC [46] is an ensemble learning algorithm to learn several weak classifiers and use these weak classifiers to determine a strong classifier.
4 Benchmark Graphs
We used several types of simulated graphs in our benchmark tests. Our focus is on undirected graphs since they are most commonly used graphs and are supported by most of algorithms.
4.1 Lancichinetti-Fortunato-Radicchi (LFR) Benchmark
LFR[34] is an algorithm that generates benchmark networks with a priori known communities. Overlapped and/or weighted LFR benchmark networks are described in [31].
LFR requires specifying at least four parameters , , and for unweighted graphs, where is the number of node, is the average in-degree, is the maximum in-degree and is a mixing parameter (which controls how clusters ”mix” together”). For weighted graphs, weight mixing parameter is introduced.
Symbols of LFR(, , , ) and WLFR(, , , , ) is used for unweighted and weighted LFR graphs in the following sections.
4.2 Random Graph
A random graph itself does not has any structure, but it is a baseline and can be used to evaluate how algorithms scale with graph size.
We use RAND(,) to denote a random graph where and are number of nodes and number of edges.
4.3 SIMPLE Graph
The performance of a clustering algorithm might not behavior evenly. It might be affected by
-
•
graph size
-
•
cluster sizes
-
•
inner degrees
-
•
inter degrees
-
•
other factors
While LFR is a widely used benchmark, it mixed these factors together so that it is hard to do analysis like performance attribution.
We introduce a simple structural graph, SIMPLE(, , , ), for our analysis where is the number of cluster, is the cluster size, is the internal degree for each node in a cluster and is the number of inter-edges between two clusters. We also define which measures how well a cluster is separated from its peers.
5 Benchmark Result Analysis
We collected 70+ graph clustering programs for our tests. These programs origin from sources of github, open source graph libraries or sharing by paper authors. An algorithm might be implemented by different authors or be improved in some way for performance reason.
To distinguish these programs we use name convenience of ”prefix_name” where ”prefix” is the source of the code and ”name” is the algorithm name that used by the source which is easy for readers to identify it. A summary of prefixes can be found in Table 1 and further details can be found in our code repository of https://bitbucket.org/LizhenShi/graph_clustering_toolkit.
| Prefix | Description |
|---|---|
| mcl | https://micans.org/mcl/ |
| igraph [13] | https://igraph.org/ |
| sklearn [47] | https://scikit-learn.org/ |
| scan | scan family (scan, pscan, anyscan etc) |
| dct | https://github.com/kit-algo/distributed_clustering_thrill |
| cgcc | https://github.com/eXascaleInfolab/CGGC |
| networkit [63] | https://networkit.github.io/ |
| snap [38] | https://snap.stanford.edu |
| cdc | https://github.com/RapidsAtHKUST/CommunityDetectionCodes |
| oslom | http://www.oslom.org/index.html |
| pycabem | https://github.com/eXascaleInfolab/PyCABeM |
| karateclub [58] | https://github.com/benedekrozemberczki/karateclub |
| alg | others |
5.1 Graph Supports
A graph could be undirected/directed, weighted/unweighted and clustering could also be unoverlapped or overlapped. An algorithm usually does not support all these types. Unfortunately sources and papers may do not specifies its support clearly. We have to ”guess” it by tests.
To determine the support of directed graph for an algorithm, a directed graph is made first, then is converted to its corresponding undirected graph . The algorithm is applied to both graphs and the clustering results are compared, where the algorithm is considered supporting directed graph if the results are not consistent. A similar approach is applied to determine the support of weighted graph. However be aware that this method might not be accurate.
The results are presented in Table LABEL:tbl:graph_support, which shows of all the algorithms, support directed graph, support weighted graph and support overlapped graph.
5.2 Runtime Benchmark
Nowadays graph data is common to have number of edges up to millions and billions, so runtime is a big concern when choosing algorithms. Despite the fact that most clustering algorithms are only capable for small or medium graph size, we are still interested in which algorithms have lesser runtime cost, so that we can try them first or try to implement a parallel version when being necessary.
We benchmarked algorithms on three types of graphs (RAND, SIMPLE, LRF) where graph sizes (#node) ranging from 32 to 100K. The maximum runtime is limited up to 1 hour and the core number is limited to 1 to be fair.
The results in Table LABEL:tbl:graph_runtime shows the ranks that are sorted by the median of the three. Half of the algorithms can handle 100K node graph in 1 hour while the slowest igraph_community_optimal_modularity can only handle hundreds of nodes. The actual maximum runtime ranges from 1 second to 1 hour and the top 30 finished in 100 seconds. From the table we can see that most of the tops are based on LPM, scan and louvain methods.
Be warned that the result is not highly accurate might because of the facts like
-
•
code languages make big difference (c/c++, java, python)
-
•
algorithm may pre-process the graph into binary format
-
•
algorithm is designed for parallel processing, while it is limited to 1 core
5.3 Clustering Quality Benchmark
Clustering quality is critical for algorithms. We tested for the quality with both LFR and SIMPLE graphs. NMI is selected as criterion since ground truth is available (it was found that measures solely based on clusters have their drawbacks and have to be used with other measures together). Overlapped clustering was transferred to an unoverlapped one by randomly choosing one label for overlapped nodes when computing NMI.
5.4 LFR benchmark
Unweighted Graph
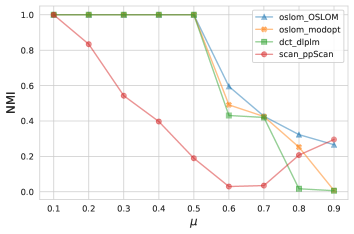
We tested the graphs of where and ranges from 0.1 to 0.9. Table LABEL:tbl:lfr_nmi_rank_short shows top-rank algorithms (full list in Table LABEL:tbl:lfr_nmi_rank).
| Algorithm | Median | |||||||||
|---|---|---|---|---|---|---|---|---|---|---|
| oslom_OSLOM | 1 | 1 | 6 | 5 | 1 | 2 | 1 | 2 | 3 | 2 |
| igraph_community_spinglass | 2 | 2 | 2 | 1 | 3 | 4 | 2 | 8 | 16 | 4 |
| dct_dlplm | 1 | 1 | 1 | 3 | 4 | 5 | 5 | 13 | 16 | 5 |
| oslom_modopt | 1 | 1 | 1 | 2 | 4 | 5 | 3 | 10 | 16 | 5 |
| igraph_community_walktrap | 1 | 1 | 1 | 4 | 3 | 1 | 4 | 10 | 17 | 5 |
| igraph_community_leading_eigenvector | 1 | 3 | 4 | 4 | 10 | 8 | 6 | 6 | 13 | 6 |
| dct_dlslm_no_contraction | 1 | 1 | 3 | 8 | 5 | 6 | 8 | 11 | 14 | 6 |
| oslom_louvain_method | 1 | 1 | 3 | 7 | 4 | 6 | 5 | 12 | 16 | 6 |
| dct_dlslm | 1 | 1 | 1 | 5 | 5 | 5 | 3 | 13 | 16 | 6 |
| dct_seq_louvain | 1 | 1 | 1 | 7 | 2 | 5 | 7 | 12 | 16 | 6 |
| dct_dlslm_with_seq | 1 | 1 | 1 | 4 | 6 | 4 | 5 | 13 | 16 | 6 |
| networkit_PLM | 1 | 1 | 1 | 4 | 7 | 5 | 7 | 13 | 16 | 6 |
| igraph_community_multilevel | 1 | 1 | 1 | 8 | 3 | 4 | 7 | 13 | 16 | 6 |
| karateclub_EgoNetSplitter | 8 | 4 | 2 | 6 | 6 | 4 | 4 | 10 | 15 | 7 |
| alg_lso_cluster | 1 | 1 | 5 | 10 | 9 | 7 | 11 | 14 | 15 | 8 |
| igraph_community_fastgreedy | 1 | 3 | 6 | 9 | 8 | 8 | 10 | 11 | 16 | 8 |
| snap_Clauset_Newman_Moore | 1 | 5 | 8 | 12 | 12 | 9 | 9 | 6 | 14 | 8 |
| oslom_Infohiermap | 1 | 1 | 13 | 22 | 18 | 10 | 2 | 1 | 2 | 8 |
| karateclub_DANMF | 13 | 13 | 9 | 13 | 15 | 12 | 4 | 1 | 1 | 9 |
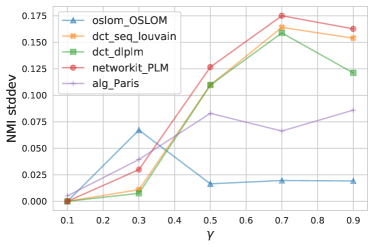
OSLOM is the best one which ranks top for all the ’s. Several algorithms from iGraph are also good. If being interested in large graphs, algorithms from dct family are worth trying since they support distributed computing.
Ranks does not reveal the whole story, actually NMI’s for all the algorithms drop quickly when goes beyond 0.5. Figure 1 shows a few examples of algorithms based on OSLOM, modularity optimization, Louvain and scan.
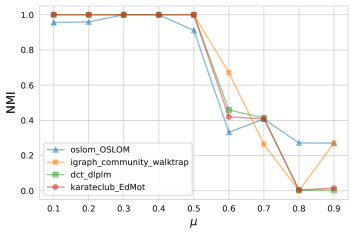
Weighted Graph
We used similar configuration of where and ranges from 0.1 to 0.9. Table 3 shows the top-rank algorithms (full list in Table 11). NMI’s also drop quickly when is higher than 0.5. Figure 2 shows a few examples.
| Algorithm | _0.1 | _0.2 | _0.3 | _0.4 | _0.5 | _0.6 | _0.7 | _0.8 | _0.9 | Mean |
| igraph_community_walktrap | 1 | 1 | 2 | 3 | 1 | 1 | 1 | 3 | 5 | 2 |
| oslom_OSLOM | 3 | 2 | 4 | 4 | 7 | 6 | 1 | 1 | 2 | 3 |
| oslom_modopt | 1 | 1 | 3 | 3 | 2 | 4 | 2 | 8 | 12 | 4 |
| dct_dlplm | 1 | 1 | 1 | 1 | 3 | 2 | 6 | 8 | 13 | 4 |
| dct_dlslm | 1 | 1 | 2 | 1 | 3 | 5 | 5 | 9 | 13 | 4 |
| dct_seq_louvain | 1 | 1 | 1 | 2 | 3 | 2 | 7 | 9 | 13 | 4 |
| igraph_community_leading_eigenvector | 2 | 1 | 1 | 5 | 9 | 7 | 3 | 8 | 7 | 5 |
| igraph_community_spinglass | 2 | 1 | 5 | 3 | 5 | 7 | 5 | 8 | 12 | 5 |
| karateclub_EgoNetSplitter | 4 | 3 | 3 | 1 | 3 | 7 | 7 | 9 | 12 | 5 |
| igraph_community_multilevel | 1 | 1 | 6 | 3 | 3 | 3 | 4 | 9 | 12 | 5 |
| networkit_PLM | 1 | 1 | 6 | 3 | 3 | 3 | 4 | 9 | 12 | 5 |
| alg_lso_cluster | 1 | 1 | 6 | 3 | 2 | 5 | 6 | 7 | 11 | 5 |
| karateclub_EdMot | 1 | 4 | 6 | 3 | 2 | 5 | 4 | 9 | 12 | 5 |
| oslom_Infohiermap | 1 | 5 | 8 | 10 | 12 | 9 | 1 | 1 | 2 | 5 |
| oslom_louvain_method | 1 | 4 | 6 | 3 | 4 | 8 | 6 | 9 | 11 | 6 |
| igraph_community_fastgreedy | 5 | 6 | 7 | 4 | 6 | 6 | 6 | 8 | 12 | 7 |
| karateclub_SymmNMF | 14 | 9 | 11 | 7 | 10 | 12 | 3 | 2 | 1 | 8 |
| sklearn_SpectralClustering | 12 | 9 | 9 | 6 | 8 | 11 | 9 | 7 | 12 | 9 |
5.5 SIMPLE benchmark
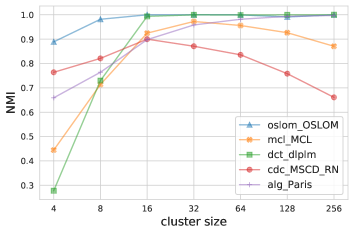
SIMPLE benchmark was performed with graphs of 1024 nodes while (cluster size) varies from 4 to 256, and with a set of (, ).
Cluster Size Effect
Table LABEL:tbl:simple_cz_nmi_rank_short (full in Table LABEL:tbl:simple_cz_nmi_rank) shows the NMI ranking by cluster size. We see that OSLOM performs the best and Louvain based algorithms are also in the tops. Another observation is that some algorithms behave better for larger cluster size, while a few of them behave better for smaller graph size.
Figure 3 shows examples how NMI changes along with cluster sizes.
| Algorithm | cz004 | cz008 | cz016 | cz032 | cz064 | cz128 | cz256 | Mean |
|---|---|---|---|---|---|---|---|---|
| oslom_OSLOM | 1 | 2 | 1 | 1 | 1 | 2 | 1 | 1 |
| oslom_Infohiermap | 1 | 3 | 1 | 1 | 1 | 3 | 2 | 2 |
| alg_Paris | 4 | 7 | 9 | 5 | 3 | 2 | 1 | 4 |
| dct_dlplm | 13 | 9 | 2 | 1 | 1 | 1 | 1 | 4 |
| dct_dlslm_with_seq | 15 | 16 | 2 | 1 | 1 | 1 | 1 | 5 |
| karateclub_EdMot | 14 | 14 | 2 | 1 | 1 | 1 | 1 | 5 |
| dct_seq_louvain | 13 | 14 | 2 | 1 | 1 | 1 | 1 | 5 |
| dct_dlslm | 13 | 15 | 2 | 1 | 1 | 1 | 1 | 5 |
| igraph_community_walktrap | 19 | 11 | 1 | 1 | 1 | 1 | 1 | 5 |
| dct_dlslm_no_contraction | 10 | 12 | 2 | 2 | 3 | 4 | 3 | 5 |
| oslom_louvain_method | 12 | 8 | 2 | 2 | 3 | 3 | 3 | 5 |
| networkit_PLM | 16 | 18 | 4 | 1 | 1 | 1 | 1 | 6 |
| cdc_MSCD_RB | 8 | 11 | 5 | 5 | 4 | 3 | 3 | 6 |
| igraph_community_multilevel | 15 | 18 | 4 | 1 | 1 | 1 | 1 | 6 |
| cdc_MOSES | 28 | 1 | 1 | 2 | 2 | 5 | 9 | 7 |
| cdc_MSCD_AFG | 12 | 17 | 5 | 5 | 4 | 3 | 3 | 7 |
| cdc_MSCD_SO | 13 | 15 | 5 | 5 | 4 | 3 | 3 | 7 |
| cdc_MSCD_SOM | 15 | 13 | 5 | 5 | 4 | 3 | 3 | 7 |
| oslom_modopt | 21 | 27 | 2 | 2 | 2 | 1 | 1 | 8 |
| cdc_GCE | 29 | 4 | 1 | 1 | 5 | 7 | 7 | 8 |
| mcl_MCL | 7 | 10 | 7 | 4 | 5 | 8 | 12 | 8 |
| pycabem_LabelRank | 1 | 8 | 14 | 2 | 4 | 10 | 19 | 8 |
| igraph_community_spinglass | 18 | 22 | 13 | 6 | 2 | 1 | 1 | 9 |
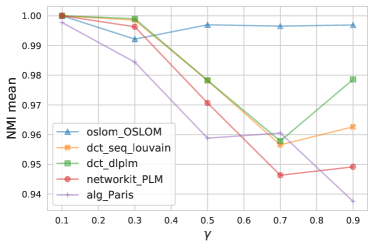
Gamma Effect
Recall which measures how well a cluster is separated from others. Since is a continuous number, it was categorized into 5 bins from 0 to 1.
Table LABEL:tbl:simple_gamma_nmi_rank_short (full in Table LABEL:tbl:simple_gamma_nmi_rank) shows the ranks for the bins and Figure 4 displays the actual changes. OSOM still outperforms others.
| Algorithm | (0.0-0.2) | (0.2-0.4) | (0.4-0.6) | (0.6-0.8) | (0.8-1.0) | Mean |
|---|---|---|---|---|---|---|
| oslom_OSLOM | 1 | 2 | 1 | 1 | 1 | 1 |
| igraph_community_walktrap | 1 | 1 | 2 | 3 | 3 | 2 |
| dct_dlplm | 1 | 1 | 2 | 3 | 2 | 2 |
| karateclub_EdMot | 1 | 1 | 2 | 3 | 4 | 2 |
| dct_seq_louvain | 1 | 1 | 2 | 3 | 4 | 2 |
| dct_dlslm | 1 | 1 | 2 | 3 | 4 | 2 |
| dct_dlslm_with_seq | 1 | 1 | 2 | 4 | 4 | 2 |
| oslom_Infohiermap | 1 | 2 | 2 | 2 | 2 | 2 |
| igraph_community_multilevel | 1 | 1 | 3 | 4 | 5 | 3 |
| networkit_PLM | 1 | 1 | 3 | 4 | 5 | 3 |
| dct_dlslm_map_eq | 1 | 2 | 4 | 5 | 5 | 3 |
| oslom_modopt | 1 | 3 | 4 | 4 | 5 | 3 |
| alg_Paris | 1 | 3 | 4 | 3 | 6 | 3 |
| dct_infomap | 1 | 3 | 4 | 5 | 8 | 4 |
| dct_dlslm_no_contraction | 1 | 3 | 6 | 6 | 6 | 4 |
| oslom_louvain_method | 1 | 2 | 6 | 5 | 5 | 4 |
| igraph_community_infomap | 1 | 2 | 4 | 5 | 8 | 4 |
| oslom_lpm | 1 | 3 | 4 | 6 | 8 | 4 |
| cdc_MSCD_AFG | 3 | 4 | 5 | 6 | 7 | 5 |
| cdc_MSCD_RB | 3 | 4 | 5 | 5 | 6 | 5 |
| igraph_community_spinglass | 2 | 4 | 6 | 6 | 7 | 5 |
| cdc_MSCD_HSLSW | 3 | 4 | 6 | 6 | 8 | 5 |
| cdc_MSCD_SO | 3 | 4 | 5 | 5 | 6 | 5 |
| oslom_copra | 1 | 4 | 5 | 6 | 11 | 5 |
| igraph_community_label_propagation | 1 | 4 | 4 | 7 | 8 | 5 |
| cdc_MSCD_SOM | 3 | 4 | 5 | 5 | 6 | 5 |
6 Summary
In this paper we benchmarked more than 70 graph clustering programs for unweighted and weighted graphs. We tested their runtimes up to 100K nodes . When evaluating the quality of clustering, we focused on NMI metric and tested with LFR and SIMPLE benchmarks. Specifically we introduced SIMPLE benchmark to investigate how performance varies with cluster size, intra-degree and inter-degree. Our work is able to not only supply a start point for engineers to select clustering algorithms but also could provide a viewpoint for researchers to design new algorithms.
We opened the source code which is shared at https://bitbucket.org/LizhenShi/graph_clustering_toolkit where documents and docker image are also provided.
References
- [1]
- Ahn et al. [2010] Yong-Yeol Ahn, James P Bagrow, and Sune Lehmann. 2010. Link communities reveal multiscale complexity in networks. nature 466, 7307 (2010), 761–764.
- Arenas et al. [2008] A. Arenas, A. Fernández, and S. Gómez. 2008. Analysis of the structure of complex networks at different resolution levels. New Journal of Physics 10 (2008). https://doi.org/10.1088/1367-2630/10/5/053039 arXiv:physics/0703218
- Bae et al. [2013] Seung-Hee Bae, Daniel Halperin, Jevin West, Martin Rosvall, and Bill Howe. 2013. Scalable flow-based community detection for large-scale network analysis. In 2013 IEEE 13th International Conference on Data Mining Workshops. IEEE, 303–310.
- Bae and Howe [2015] Seung Hee Bae and Bill Howe. 2015. GossipMap: A distributed community detection algorithm for billion-edge directed graphs. In International Conference for High Performance Computing, Networking, Storage and Analysis, SC, Vol. 15-20-Nove. https://doi.org/10.1145/2807591.2807668
- Blondel et al. [2008] Vincent D Blondel, Jean Loup Guillaume, Renaud Lambiotte, and Etienne Lefebvre. 2008. Fast unfolding of communities in large networks. Journal of Statistical Mechanics: Theory and Experiment 2008, 10 (2008). https://doi.org/10.1088/1742-5468/2008/10/P10008 arXiv:0803.0476
- Bonald et al. [2018] Thomas Bonald, Bertrand Charpentier, Alexis Galland, and Alexandre Hollocou. 2018. Hierarchical Graph Clustering using Node Pair Sampling. (jun 2018). arXiv:1806.01664 http://arxiv.org/abs/1806.01664
- Chang et al. [2017] Lijun Chang, Wei Li, Lu Qin, Wenjie Zhang, and Shiyu Yang. 2017. PSCAN : Fast and Exact Structural Graph Clustering. IEEE Transactions on Knowledge and Data Engineering 29, 2 (feb 2017), 387–401. https://doi.org/10.1109/TKDE.2016.2618795
- Che et al. [2018] Yulin Che, Shixuan Sun, and Qiong Luo. 2018. Parallelizing pruning-based graph structural clustering. In Proceedings of the 47th International Conference on Parallel Processing. 1–10.
- Clauset et al. [2004] Aaron Clauset, M. E.J. Newman, and Cristopher Moore. 2004. Finding community structure in very large networks. Physical Review E - Statistical Physics, Plasmas, Fluids, and Related Interdisciplinary Topics 70, 6 (dec 2004), 6. https://doi.org/10.1103/PhysRevE.70.066111 arXiv:cond-mat/0408187
- Coscia et al. [2012] Michele Coscia, Giulio Rossetti, Fosca Giannotti, and Dino Pedreschi. 2012. DEMON: A local-first discovery method for overlapping communities. In Proceedings of the ACM SIGKDD International Conference on Knowledge Discovery and Data Mining. 615–623. https://doi.org/10.1145/2339530.2339630 arXiv:1206.0629
- Coscia et al. [2014] Michele Coscia, Giulio Rossetti, Fosca Giannotti, and Dino Pedreschi. 2014. Uncovering hierarchical and overlapping communities with a local-first approach. ACM Transactions on Knowledge Discovery from Data 9, 1 (aug 2014), 1–27. https://doi.org/10.1145/2629511
- Csardi and Nepusz [2006] Gabor Csardi and Tamas Nepusz. 2006. The igraph software package for complex network research. InterJournal Complex Systems (2006), 1695. http://igraph.org
- Epasto et al. [2017] Alessandro Epasto, Silvio Lattanzi, and Renato Paes Leme. 2017. Ego-splitting framework: From non-overlapping to overlapping clusters. In Proceedings of the 23rd ACM SIGKDD International Conference on Knowledge Discovery and Data Mining. 145–154.
- Flake et al. [2004] Gary William Flake, Robert E. Tarjan, and Kostas Tsioutsiouliklis. 2004. Graph clustering and minimum cut trees. Internet Mathematics 1, 4 (2004), 385–408. https://doi.org/10.1080/15427951.2004.10129093
- Frey and Dueck [2007] Brendan J Frey and Delbert Dueck. 2007. Clustering by passing messages between data points. science 315, 5814 (2007), 972–976.
- Girvan and Newman [2002] M Girvan and M. E.J. Newman. 2002. Community structure in social and biological networks. Proceedings of the National Academy of Sciences of the United States of America 99, 12 (2002), 7821–7826. https://doi.org/10.1073/pnas.122653799 arXiv:cond-mat/0112110
- Gonzalez et al. [[n. d.]] Joseph E Gonzalez, Danny Bickson, and Carlos Guestrin. [n. d.]. PowerGraph : Distributed Graph-Parallel Computation on Natural Graphs. 12 ([n. d.]), 17.
- Gopalan and Blei [2013] Prem K Gopalan and David M Blei. 2013. Efficient discovery of overlapping communities in massive networks. Proceedings of the National Academy of Sciences 110, 36 (2013), 14534–14539.
- Gregori et al. [2013] Enrico Gregori, Luciano Lenzini, and Simone Mainardi. 2013. Parallel -clique community detection on large-scale networks. IEEE Transactions on Parallel and Distributed Systems 24, 8 (aug 2013), 1651–1660. https://doi.org/10.1109/TPDS.2012.229
- Gregory [2007] Steve Gregory. 2007. An Algorithm to Find Overlapping Community Structure in Networks. Lecture Notes in Computer Science 4702 (2007), 91. https://doi.org/10.1007/978-3-540-87479-9
- Gregory [2010] Steve Gregory. 2010. Finding overlapping communities in networks by label propagation. New Journal of Physics 12, 10 (oct 2010), 103018. https://doi.org/10.1088/1367-2630/12/10/103018
- Hamann et al. [2018] Michael Hamann, Ben Strasser, Dorothea Wagner, and Tim Zeitz. 2018. Distributed Graph Clustering Using Modularity and Map Equation. In Lecture Notes in Computer Science (including subseries Lecture Notes in Artificial Intelligence and Lecture Notes in Bioinformatics), Vol. 11014 LNCS. 688–702. https://doi.org/10.1007/978-3-319-96983-1_49 arXiv:1710.09605
- Hollocou et al. [2017] Alexandre Hollocou, Julien Maudet, Thomas Bonald, and Marc Lelarge. 2017. A Streaming Algorithm for Graph Clustering. (dec 2017). arXiv:1712.04337 http://arxiv.org/abs/1712.04337
- Huang et al. [2011] Jianbin Huang, Heli Sun, Yaguang Liu, Qinbao Song, and Tim Weninger. 2011. Towards online multiresolution community detection in large-scale networks. PLoS ONE 6, 8 (aug 2011). https://doi.org/10.1371/journal.pone.0023829
- Hubert and Arabie [1985] L. Hubert and P. Arabie. 1985. Comparing partitions. Journal of classification 2, 1 (1985), 193–218. http://scholar.google.de/scholar.bib?q=info:IkrWWF2JxwoJ:scholar.google.com/&output=citation&hl=de&ct=citation&cd=0
- Kelley [2009] Stephen Kelley. 2009. The existence and discovery of overlapping communities in large-scale networks. Ph.D. Dissertation.
- Kuang et al. [2012] Da Kuang, Chris Ding, and Haesun Park. 2012. Symmetric nonnegative matrix factorization for graph clustering. In Proceedings of the 2012 SIAM international conference on data mining. SIAM, 106–117.
- Kumpula et al. [2008] Jussi M Kumpula, Mikko Kivelä, Kimmo Kaski, and Jari Saramäki. 2008. Sequential algorithm for fast clique percolation. Physical Review E 78, 2 (2008). https://doi.org/10.1103/physreve.78.026109 arXiv:0805.1449
- Lancichinetti and Fortunato [[n. d.]] Andrea Lancichinetti and Santo Fortunato. [n. d.]. Benchmarks for testing community detection algorithms on directed and weighted graphs with overlapping communities. arXiv:0904.3940v2 https://arxiv.org/pdf/0904.3940.pdf
- Lancichinetti and Fortunato [2009a] Andrea Lancichinetti and Santo Fortunato. 2009a. Benchmarks for testing community detection algorithms on directed and weighted graphs with overlapping communities. Physical Review E 80, 1 (2009), 016118.
- Lancichinetti and Fortunato [2009b] Andrea Lancichinetti and Santo Fortunato. 2009b. Community detection algorithms: A comparative analysis. Physical Review E - Statistical, Nonlinear, and Soft Matter Physics 80, 5 (aug 2009). https://doi.org/10.1103/PhysRevE.80.056117 arXiv:0908.1062
- Lancichinetti et al. [2009] Andrea Lancichinetti, Santo Fortunato, and János Kertész. 2009. Detecting the overlapping and hierarchical community structure in complex networks. New Journal of Physics 11 (2009). https://doi.org/10.1088/1367-2630/11/3/033015 arXiv:0802.1218
- Lancichinetti et al. [2008] Andrea Lancichinetti, Santo Fortunato, and Filippo Radicchi. 2008. Benchmark graphs for testing community detection algorithms. Physical Review E 78, 4 (Oct. 2008), 046110+. https://doi.org/10.1103/physreve.78.046110
- Lancichinetti et al. [2011] Andrea Lancichinetti, Filippo Radicchi, José J. Ramasco, and Santo Fortunato. 2011. Finding statistically significant communities in networks. PLoS ONE 6, 4 (2011). https://doi.org/10.1371/journal.pone.0018961 arXiv:1012.2363
- Le Martelot and Hankin [2013] E. Le Martelot and C. Hankin. 2013. Fast Multi-Scale Detection of Relevant Communities in Large-Scale Networks. Comput. J. 56, 9 (sep 2013), 1136–1150. https://doi.org/10.1093/comjnl/bxt002
- Lee et al. [2010] Conrad Lee, Fergal Reid, Aaron McDaid, and Neil Hurley. 2010. Detecting highly overlapping community structure by greedy clique expansion. (2010). https://doi.org/10.1.1/770.7354 arXiv:1002.1827
- Leskovec and Sosič [2016] Jure Leskovec and Rok Sosič. 2016. SNAP: A General-Purpose Network Analysis and Graph-Mining Library. ACM Transactions on Intelligent Systems and Technology (TIST) 8, 1 (2016), 1.
- Li et al. [2020] Kexue Li, Yakang Lu, Li Deng, Lili Wang, Lizhen Shi, and Zhong Wang. 2020. Deconvolute individual genomes from metagenome sequences through short read clustering. PeerJ 8 (2020), e8966.
- Li et al. [2019] Pei-Zhen Li, Ling Huang, Chang-Dong Wang, and Jian-Huang Lai. 2019. EdMot: An Edge Enhancement Approach for Motif-aware Community Detection. In Proceedings of the 25th ACM SIGKDD International Conference on Knowledge Discovery & Data Mining. 479–487.
- Macropol and Singh [2010] Kathy Macropol and Ambuj Singh. 2010. Scalable discovery of best clusters on large graphs. Proceedings of the VLDB Endowment 3, 1 (2010), 693–702. https://doi.org/10.14778/1920841.1920930
- Mai et al. [2017] Son T. Mai, Martin Storgaard Dieu, Ira Assent, Jon Jacobsen, Jesper Kristensen, and Mathias Birk. 2017. Scalable and interactive graph clustering algorithm on multicore CPUs. In Proceedings - International Conference on Data Engineering. 349–360. https://doi.org/10.1109/ICDE.2017.94
- Martelot and Hankin [2013] Erwan Le Martelot and Chris Hankin. 2013. Fast Multi-Scale Detection of Relevant Communities. Comput. J. 56 (2013), 1136. arXiv:1204.1002 http://arxiv.org/abs/1204.1002
- McDaid and Hurley [2010] Aaron McDaid and Neil Hurley. 2010. Detecting Highly Overlapping Communities with Model-Based Overlapping Seed Expansion. In 2010 International Conference on Advances in Social Networks Analysis and Mining. IEEE, 112–119. https://doi.org/10.1109/ASONAM.2010.77
- Newman [2006] M. E.J. Newman. 2006. Finding community structure in networks using the eigenvectors of matrices. Physical Review E - Statistical, Nonlinear, and Soft Matter Physics 74, 3 (2006). https://doi.org/10.1103/PhysRevE.74.036104 arXiv:physics/0605087
- Ovelgönne and Geyer-Schulz [2013] Michael Ovelgönne and Andreas Geyer-Schulz. 2013. An ensemble learning strategy for graph clustering. 187–205. https://doi.org/10.1090/conm/588/11701
- Pedregosa et al. [2011] F. Pedregosa, G. Varoquaux, A. Gramfort, V. Michel, B. Thirion, O. Grisel, M. Blondel, P. Prettenhofer, R. Weiss, V. Dubourg, J. Vanderplas, A. Passos, D. Cournapeau, M. Brucher, M. Perrot, and E. Duchesnay. 2011. Scikit-learn: Machine Learning in Python. Journal of Machine Learning Research 12 (2011), 2825–2830.
- Pons and Latapy [2006] Pascal Pons and Matthieu Latapy. 2006. Computing communities in large networks using random walks. Journal of Graph Algorithms and Applications 10, 2 (2006), 191–218. https://doi.org/10.7155/jgaa.00124 arXiv:physics/0512106
- Prat-Pérez et al. [2014] Arnau Prat-Pérez, David Dominguez-Sal, and Josep-Lluis Larriba-Pey. 2014. High quality, scalable and parallel community detection for large real graphs. In Proceedings of the 23rd international conference on World wide web. 225–236.
- Raghavan et al. [2007] Usha Nandini Raghavan, Réka Albert, and Soundar Kumara. 2007. Near linear time algorithm to detect community structures in large-scale networks. Physical Review E - Statistical, Nonlinear, and Soft Matter Physics 76, 3 (2007). https://doi.org/10.1103/PhysRevE.76.036106 arXiv:0709.2938
- Reichardt and Bornholdt [2006] Jörg Reichardt and Stefan Bornholdt. 2006. Statistical mechanics of community detection. Physical Review E - Statistical, Nonlinear, and Soft Matter Physics 74, 1 (2006). https://doi.org/10.1103/PhysRevE.74.016110 arXiv:cond-mat/0603718
- Reid et al. [2012] Fergal Reid, Aaron Mcdaid, and Neil Hurley. 2012. Percolation computation in complex networks. In Proceedings of the 2012 IEEE/ACM International Conference on Advances in Social Networks Analysis and Mining, ASONAM 2012. 274–281. https://doi.org/10.1109/ASONAM.2012.54 arXiv:1205.0038
- Ronhovde and Nussinov [2010] Peter Ronhovde and Zohar Nussinov. 2010. Local resolution-limit-free Potts model for community detection. Physical Review E 81, 4 (2010), 046114.
- Rosenberg and Hirschberg [2007] Andrew Rosenberg and Julia Hirschberg. 2007. V-Measure: A Conditional Entropy-Based External Cluster Evaluation Measure.. In EMNLP-CoNLL, Vol. 7. 410–420.
- Rosvall and Bergstrom [2008a] Martin Rosvall and Carl T. Bergstrom. 2008a. Maps of random walks on complex networks reveal community structure. Proceedings of the National Academy of Sciences of the United States of America 105, 4 (jan 2008), 1118–1123. https://doi.org/10.1073/pnas.0706851105 arXiv:0707.0609
- Rosvall and Bergstrom [2008b] Martin Rosvall and Carl T Bergstrom. 2008b. Maps of random walks on complex networks reveal community structure. Proceedings of the National Academy of Sciences 105, 4 (2008), 1118–1123.
- Rosvall and Bergstrom [2011] Martin Rosvall and Carl T. Bergstrom. 2011. Multilevel compression of random walks on networks reveals hierarchical organization in large integrated systems. PLoS ONE 6, 4 (2011). https://doi.org/10.1371/journal.pone.0018209 arXiv:1010.0431
- Rozemberczki et al. [2020] Benedek Rozemberczki, Oliver Kiss, and Rik Sarkar. 2020. An API Oriented Open-source Python Framework for Unsupervised Learning on Graphs. arXiv:cs.LG/2003.04819
- Sales-Pardo et al. [2007] Marta Sales-Pardo, Roger Guimera, André A Moreira, and Luís A Nunes Amaral. 2007. Extracting the hierarchical organization of complex systems. Proceedings of the National Academy of Sciences 104, 39 (2007), 15224–15229.
- Shen et al. [2009] Huawei Shen, Xueqi Cheng, Kai Cai, and Mao Bin Hu. 2009. Detect overlapping and hierarchical community structure in networks. Physica A: Statistical Mechanics and its Applications 388, 8 (2009), 1706–1712. https://doi.org/10.1016/j.physa.2008.12.021 arXiv:0810.3093
- Shi et al. [2019] Lizhen Shi, Xiandong Meng, Elizabeth Tseng, Michael Mascagni, and Zhong Wang. 2019. SpaRC: scalable sequence clustering using Apache Spark. Bioinformatics 35, 5 (2019), 760–768.
- Shiokawa et al. [2015] Hiroaki Shiokawa, Yasuhiro Fujiwara, and Makoto Onizuka. 2015. SCAN++: Efficient Algorithm for Finding Clusters , Hubs and Outliers on Large-scale Graphs. Proceedings of the VLDB Endowment (2015), 3–9. https://doi.org/10.14778/2809974.2809980
- Staudt et al. [2016] Christian L Staudt, Aleksejs Sazonovs, and Henning Meyerhenke. 2016. NetworKit: A tool suite for large-scale complex network analysis. Network Science 4, 4 (2016), 508–530.
- Stella and Shi [2003] X Yu Stella and Jianbo Shi. 2003. Multiclass spectral clustering. In null. IEEE, 313.
- Sun et al. [2017] Bing-Jie Sun, Huawei Shen, Jinhua Gao, Wentao Ouyang, and Xueqi Cheng. 2017. A non-negative symmetric encoder-decoder approach for community detection. In Proceedings of the 2017 ACM on Conference on Information and Knowledge Management. 597–606.
- Traag and Bruggeman [2009] V A Traag and Jeroen Bruggeman. 2009. Community detection in networks with positive and negative links. Physical Review E - Statistical, Nonlinear, and Soft Matter Physics 80, 3 (2009). https://doi.org/10.1103/PhysRevE.80.036115 arXiv:0811.2329
- Van Dongen [2000] Stijn Marinus Van Dongen. 2000. Graph clustering by flow simulation. Ph.D. Dissertation.
- van Laarhoven and Marchiori [2013] Twan van Laarhoven and Elena Marchiori. 2013. Graph clustering with local search optimization: The resolution bias of the objective function matters most. Phys. Rev. E 87 (Jan 2013), 012812. Issue 1. https://doi.org/10.1103/PhysRevE.87.012812
- Vinh et al. [2010] Nguyen Xuan Vinh, Julien Epps, and James Bailey. 2010. Information theoretic measures for clusterings comparison: Variants, properties, normalization and correction for chance. The Journal of Machine Learning Research 11 (2010), 2837–2854.
- Watts and Strogatz [1998] Duncan J. Watts and Steven Strogatz. 1998. Collective dynamics of ’small-world’ networks. Nature 393 (June 1998), 440–442.
- Xie and Szymanski [2013] Jierui Xie and Boleslaw K Szymanski. 2013. Labelrank: A stabilized label propagation algorithm for community detection in networks. In 2013 IEEE 2nd Network Science Workshop (NSW). IEEE, 138–143.
- Xie et al. [2011] Jierui Xie, Boleslaw K Szymanski, and Xiaoming Liu. 2011. SLPA: Uncovering overlapping communities in social networks via a speaker-listener interaction dynamic process. In Proceedings - IEEE International Conference on Data Mining, ICDM. 344–349. https://doi.org/10.1109/ICDMW.2011.154 arXiv:1109.5720
- Yan and Gregory [2009] Bowen Yan and Steve Gregory. 2009. Detecting communities in networks by Merging Cliques. In Proceedings - 2009 IEEE International Conference on Intelligent Computing and Intelligent Systems, ICIS 2009, Vol. 1. 832–836. https://doi.org/10.1109/ICICISYS.2009.5358036
- Yang and Leskovec [2012] Jaewon Yang and Jure Leskovec. 2012. Defining and Evaluating Network Communities Based on Ground-Truth. In 2012 IEEE 12th International Conference on Data Mining. 745–754. https://doi.org/10.1109/ICDM.2012.138
- Yang and Leskovec [2013] Jaewon Yang and Jure Leskovec. 2013. Overlapping community detection at scale: a nonnegative matrix factorization approach. In Proceedings of the sixth ACM international conference on Web search and data mining. 587–596.
- Yang et al. [2016] Zhao Yang, René Algesheimer, and Claudio J Tessone. 2016. A comparative analysis of community detection algorithms on artificial networks. Scientific Reports 6 (2016), 30750.
- Ye et al. [2018] Fanghua Ye, Chuan Chen, and Zibin Zheng. 2018. Deep autoencoder-like nonnegative matrix factorization for community detection. In Proceedings of the 27th ACM International Conference on Information and Knowledge Management. 1393–1402.
Appendix A Full Tables of Benchmarks
| Algorithm | Directed? | Weighted? | Overlapped? |
|---|---|---|---|
| oslom_Infohiermap [57] | Y | Y | N |
| oslom_Infomap [55] | N | Y | N |
| oslom_OSLOM [35] | N | Y | Y |
| oslom_copra [22] | Y | Y | Y |
| oslom_louvain_method [6] | N | Y | N |
| oslom_lpm [50] | N | Y | N |
| oslom_modopt [59] | N | Y | N |
| pycabem_GANXiSw [72] | Y | Y | Y |
| pycabem_HiReCS | Y | Y | Y |
| pycabem_LabelRank [71] | N | N | N |
| cdc_CONGA [21] | Y | Y | Y |
| cdc_Connected_Iterative_Scan [27] | Y | Y | Y |
| cdc_EAGLE [60] | Y | Y | Y |
| cdc_FastCpm [52] | Y | Y | Y |
| cdc_GCE [37] | N | N | N |
| cdc_LinkCommunities [2] | Y | Y | ? |
| cdc_MOSES [44] | N | Y | Y |
| cdc_MSCD_AFG [3, 43] | N | Y | N |
| cdc_MSCD_HSLSW [25, 43] | N | Y | N |
| cdc_MSCD_LFK [33, 43] | N | Y | N |
| cdc_MSCD_LFK2 [33, 43] | Y | Y | Y |
| cdc_MSCD_RB [51, 43] | N | Y | N |
| cdc_MSCD_SO [51, 43] | N | Y | N |
| cdc_MSCD_SOM [51, 43] | N | Y | N |
| cdc_ParCPM [20] | N | N | Y |
| cdc_SVINET [19] | Y | Y | Y |
| cdc_TopGC [41] | Y | Y | Y |
| cdc_clique_modularity [73] | N | N | N |
| cgcc_CGGC [46] | N | N | N |
| dct_dlplm [23] | Y | Y | N |
| dct_dlslm [23] | Y | Y | N |
| dct_dlslm_map_eq [23] | N | Y | N |
| dct_dlslm_no_contraction [23] | N | Y | N |
| dct_dlslm_with_seq [23] | N | Y | N |
| dct_infomap [23] | N | Y | N |
| dct_seq_louvain [23] | N | Y | N |
| igraph_community_label_propagation [50] | N | Y | N |
| igraph_community_spinglass [51, 66] | N | Y | N |
| igraph_community_walktrap [48] | N | Y | N |
| networkit_CutClustering [15] | N | Y | N |
| networkit_LPDegreeOrdered | N | N | N |
| networkit_PLM | N | Y | N |
| networkit_PLP [46] | Y | Y | N |
| alg_GossipMap [5] | N | Y | N |
| alg_RelaxMap [4] | N | Y | N |
| alg_pg_label_propagation [18] | Y | Y | N |
| scan_AnyScan_Scan [42] | N | N | N |
| scan_AnyScan_anyScan [42] | N | N | N |
| scan_AnyScan_anyScanParl [42] | N | N | N |
| scan_AnyScan_pScan [42] | N | N | N |
| scan_Scanpp [62] | N | N | N |
| scan_pScan [8] | N | N | N |
| scan_ppScan [9] | N | N | N |
| scan_ppScanSSE [9] | N | N | N |
| sklearn_AffinityPropagation [16] | Y | Y | N |
| sklearn_SpectralClustering [64] | Y | Y | N |
| alg_lso_cluster [68] | Y | Y | N |
| alg_streamcom [24] | Y | Y | N |
| cdc_CliquePercolation [29] | N | N | N |
| cdc_DEMON [11] | N | Y | ? |
| cdc_HDEMON [12] | N | N | N |
| cdc_MSCD_RN [53] | N | N | N |
| igraph_community_edge_betweenness [17] | N | Y | N |
| igraph_community_fastgreedy [10] | N | Y | N |
| igraph_community_infomap [56] | N | Y | N |
| igraph_community_leading_eigenvector [45] | N | Y | N |
| igraph_community_multilevel [6] | N | Y | N |
| igraph_community_optimal_modularity | N | Y | N |
| karateclub_BigClam [75] | N | Y | N |
| karateclub_DANMF [77] | N | Y | N |
| karateclub_EdMot [40] | N | Y | N |
| karateclub_EgoNetSplitter [14] | N | Y | Y |
| karateclub_NNSED [65] | N | Y | N |
| karateclub_SCD [49] | N | N | N |
| karateclub_SymmNMF [28] | N | Y | N |
| mcl_MCL [67] | N | Y | N |
| snap_Clauset_Newman_Moore [10] | N | N | N |
| snap_Girvan_Newman [17] | N | N | N |
| alg_Paris [7] | N | Y | N |
| Algorithm | RAND | SIMPLE | LFR | Median |
|---|---|---|---|---|
| scan_ppScanSSE | 1 | 1 | 8 | 1 |
| scan_ppScan | 2 | 2 | 9 | 2 |
| networkit_PLP | 3 | 4 | 3 | 3 |
| igraph_community_label_propagation | 12 | 3 | 2 | 3 |
| alg_streamcom | 4 | 5 | 5 | 5 |
| networkit_LPDegreeOrdered | 69 | 6 | 4 | 6 |
| scan_pScan | 5 | 7 | 28 | 7 |
| igraph_community_multilevel | 41 | 8 | 7 | 8 |
| scan_Scanpp | 8 | 9 | 10 | 9 |
| dct_seq_louvain | 23 | 10 | 6 | 10 |
| scan_AnyScan_pScan | 10 | 11 | 26 | 11 |
| alg_pg_label_propagation | 15 | 12 | 11 | 12 |
| scan_AnyScan_anyScanParl | 11 | 13 | 37 | 13 |
| cdc_MSCD_RB | 36 | 14 | 14 | 14 |
| scan_AnyScan_anyScan | 7 | 16 | 38 | 15 |
| cdc_MSCD_RN | 17 | 17 | 34 | 16 |
| alg_lso_cluster | 25 | 18 | 12 | 17 |
| networkit_PLM | 18 | 62 | 1 | 17 |
| dct_dlslm_with_seq | 22 | 19 | 18 | 19 |
| dct_dlslm_no_contraction | 20 | 20 | 17 | 20 |
| dct_dlslm_map_eq | 29 | 23 | 16 | 21 |
| cdc_TopGC | 21 | 27 | 23 | 21 |
| oslom_louvain_method | 31 | 24 | 20 | 23 |
| dct_dlslm | 24 | 21 | 30 | 23 |
| dct_infomap | 43 | 25 | 22 | 25 |
| scan_AnyScan_Scan | 9 | 26 | 40 | 26 |
| dct_dlplm | 26 | 22 | 29 | 26 |
| cdc_MSCD_AFG | 34 | 15 | 27 | 28 |
| alg_RelaxMap | 33 | 28 | 19 | 29 |
| oslom_lpm | 28 | 45 | 13 | 29 |
| oslom_Infohiermap | 56 | 29 | 24 | 31 |
| oslom_copra | 35 | 30 | 31 | 32 |
| cdc_MSCD_LFK2 | 16 | 31 | 49 | 32 |
| igraph_community_leading_eigenvector | 32 | 44 | 15 | 34 |
| igraph_community_infomap | 66 | 32 | 33 | 35 |
| oslom_Infomap | 51 | 34 | 21 | 36 |
| alg_GossipMap | 75 | 33 | 35 | 37 |
| cdc_MSCD_LFK | 38 | 35 | 51 | 38 |
| mcl_MCL | 54 | 39 | 36 | 39 |
| cdc_CliquePercolation | 13 | 40 | 60 | 40 |
| alg_Paris | 37 | 41 | 45 | 41 |
| karateclub_SymmNMF | 42 | 36 | 43 | 42 |
| karateclub_BigClam | 47 | 37 | 44 | 43 |
| cdc_MSCD_HSLSW | 45 | 43 | 59 | 44 |
| cgcc_CGGC | 59 | 46 | 32 | 45 |
| karateclub_EgoNetSplitter | 46 | 48 | 62 | 46 |
| snap_Clauset_Newman_Moore | 64 | 50 | 25 | 47 |
| cdc_SVINET | 40 | 51 | 50 | 47 |
| karateclub_DANMF | 52 | 55 | 47 | 49 |
| pycabem_GANXiSw | 50 | 52 | 53 | 49 |
| igraph_community_walktrap | 58 | 53 | 52 | 51 |
| karateclub_SCD | 49 | 54 | 67 | 52 |
| karateclub_EdMot | 55 | 38 | 61 | 53 |
| cdc_MSCD_SO | 65 | 49 | 55 | 53 |
| cdc_MOSES | 27 | 56 | 65 | 55 |
| igraph_community_fastgreedy | 48 | 58 | 56 | 55 |
| pycabem_HiReCS | 60 | 42 | 57 | 57 |
| cdc_clique_modularity | 67 | 57 | 41 | 57 |
| karateclub_NNSED | 62 | 47 | 58 | 59 |
| pycabem_LabelRank | 57 | 59 | 64 | 60 |
| oslom_modopt | 71 | 60 | 54 | 61 |
| sklearn_AffinityPropagation | 68 | 61 | 42 | 62 |
| networkit_CutClustering | 61 | 69 | 46 | 62 |
| cdc_LinkCommunities | 30 | 63 | 70 | 64 |
| igraph_community_spinglass | 63 | 65 | 63 | 64 |
| sklearn_SpectralClustering | 70 | 64 | 39 | 66 |
| cdc_DEMON | 44 | 66 | 69 | 67 |
| cdc_Connected_Iterative_Scan | 53 | 68 | 66 | 67 |
| oslom_OSLOM | 73 | 67 | 68 | 69 |
| cdc_MSCD_SOM | 72 | 70 | 48 | 70 |
| cdc_GCE | 14 | 71 | 72 | 71 |
| cdc_HDEMON | 39 | 76 | 71 | 71 |
| cdc_FastCpm | 19 | 72 | 73 | 73 |
| cdc_ParCPM | 6 | 73 | 77 | 74 |
| igraph_community_edge_betweenness | 76 | 74 | 74 | 75 |
| cdc_EAGLE | 74 | 75 | 78 | 76 |
| cdc_CONGA | 78 | 77 | 75 | 77 |
| snap_Girvan_Newman | 77 | 78 | 76 | 77 |
| igraph_community_optimal_modularity | 79 | 79 | 79 | 79 |
| Algorithm | Median | |||||||||
|---|---|---|---|---|---|---|---|---|---|---|
| oslom_OSLOM | 1 | 1 | 6 | 5 | 1 | 2 | 1 | 2 | 3 | 2 |
| igraph_community_spinglass | 2 | 2 | 2 | 1 | 3 | 4 | 2 | 8 | 16 | 4 |
| dct_dlplm | 1 | 1 | 1 | 3 | 4 | 5 | 5 | 13 | 16 | 5 |
| oslom_modopt | 1 | 1 | 1 | 2 | 4 | 5 | 3 | 10 | 16 | 5 |
| igraph_community_walktrap | 1 | 1 | 1 | 4 | 3 | 1 | 4 | 10 | 17 | 5 |
| igraph_community_leading_eigenvector | 1 | 3 | 4 | 4 | 10 | 8 | 6 | 6 | 13 | 6 |
| dct_dlslm_no_contraction | 1 | 1 | 3 | 8 | 5 | 6 | 8 | 11 | 14 | 6 |
| oslom_louvain_method | 1 | 1 | 3 | 7 | 4 | 6 | 5 | 12 | 16 | 6 |
| dct_dlslm | 1 | 1 | 1 | 5 | 5 | 5 | 3 | 13 | 16 | 6 |
| dct_seq_louvain | 1 | 1 | 1 | 7 | 2 | 5 | 7 | 12 | 16 | 6 |
| dct_dlslm_with_seq | 1 | 1 | 1 | 4 | 6 | 4 | 5 | 13 | 16 | 6 |
| networkit_PLM | 1 | 1 | 1 | 4 | 7 | 5 | 7 | 13 | 16 | 6 |
| igraph_community_multilevel | 1 | 1 | 1 | 8 | 3 | 4 | 7 | 13 | 16 | 6 |
| karateclub_EgoNetSplitter | 8 | 4 | 2 | 6 | 6 | 4 | 4 | 10 | 15 | 7 |
| alg_lso_cluster | 1 | 1 | 5 | 10 | 9 | 7 | 11 | 14 | 15 | 8 |
| igraph_community_fastgreedy | 1 | 3 | 6 | 9 | 8 | 8 | 10 | 11 | 16 | 8 |
| snap_Clauset_Newman_Moore | 1 | 5 | 8 | 12 | 12 | 9 | 9 | 6 | 14 | 8 |
| oslom_Infohiermap | 1 | 1 | 13 | 22 | 18 | 10 | 2 | 1 | 2 | 8 |
| karateclub_DANMF | 13 | 13 | 9 | 13 | 15 | 12 | 4 | 1 | 1 | 9 |
| cgcc_CGGC | 21 | 17 | 15 | 11 | 11 | 3 | 3 | 8 | 16 | 12 |
| scan_AnyScan_Scan | 5 | 7 | 11 | 19 | 22 | 18 | 22 | 4 | 4 | 12 |
| dct_dlslm_map_eq | 1 | 1 | 7 | 11 | 14 | 16 | 24 | 18 | 17 | 12 |
| scan_AnyScan_pScan | 5 | 7 | 11 | 19 | 22 | 18 | 22 | 4 | 4 | 12 |
| karateclub_SCD | 1 | 1 | 12 | 15 | 25 | 19 | 22 | 7 | 12 | 13 |
| scan_AnyScan_anyScan | 5 | 7 | 11 | 20 | 22 | 18 | 22 | 4 | 4 | 13 |
| cdc_clique_modularity | 8 | 9 | 10 | 16 | 16 | 13 | 12 | 13 | 16 | 13 |
| scan_AnyScan_anyScanParl | 5 | 7 | 11 | 20 | 22 | 18 | 22 | 4 | 4 | 13 |
| sklearn_SpectralClustering | 15 | 17 | 17 | 14 | 13 | 11 | 9 | 10 | 16 | 14 |
| scan_pScan | 8 | 8 | 14 | 22 | 23 | 21 | 22 | 5 | 6 | 14 |
| scan_ppScan | 8 | 8 | 14 | 22 | 23 | 21 | 22 | 5 | 6 | 14 |
| scan_ppScanSSE | 8 | 8 | 14 | 22 | 23 | 21 | 22 | 5 | 6 | 14 |
| cdc_GCE | 1 | 1 | 1 | 17 | 24 | 27 | 24 | 18 | 17 | 14 |
| pycabem_LabelRank | 11 | 12 | 16 | 19 | 18 | 15 | 16 | 9 | 11 | 14 |
| alg_Paris | 9 | 12 | 18 | 18 | 20 | 17 | 13 | 10 | 15 | 15 |
| karateclub_NNSED | 12 | 19 | 22 | 24 | 28 | 20 | 19 | 6 | 5 | 17 |
| alg_streamcom | 22 | 23 | 28 | 23 | 21 | 14 | 9 | 3 | 8 | 17 |
| mcl_MCL | 1 | 1 | 15 | 35 | 33 | 27 | 24 | 18 | 2 | 17 |
| cdc_MOSES | 14 | 18 | 19 | 21 | 17 | 16 | 14 | 14 | 16 | 17 |
| karateclub_EdMot | 10 | 19 | 21 | 26 | 19 | 22 | 19 | 13 | 13 | 18 |
| dct_infomap | 1 | 1 | 19 | 35 | 33 | 27 | 24 | 18 | 17 | 19 |
| cdc_HDEMON | 25 | 25 | 30 | 25 | 23 | 16 | 12 | 5 | 7 | 19 |
| cdc_Connected_Iterative_Scan | 3 | 16 | 22 | 23 | 24 | 25 | 24 | 18 | 17 | 19 |
| sklearn_AffinityPropagation | 18 | 20 | 27 | 27 | 26 | 22 | 19 | 14 | 11 | 20 |
| oslom_lpm | 1 | 11 | 20 | 25 | 33 | 27 | 24 | 18 | 17 | 20 |
| igraph_community_label_propagation | 6 | 6 | 24 | 29 | 33 | 27 | 24 | 18 | 17 | 20 |
| networkit_LPDegreeOrdered | 4 | 14 | 26 | 30 | 33 | 27 | 24 | 18 | 17 | 21 |
| pycabem_GANXiSw | 6 | 15 | 22 | 25 | 33 | 27 | 24 | 18 | 17 | 21 |
| oslom_copra | 1 | 16 | 30 | 35 | 33 | 27 | 24 | 18 | 7 | 21 |
| cdc_CONGA | 24 | 24 | 25 | 28 | 25 | 22 | 18 | 15 | 13 | 22 |
| alg_pg_label_propagation | 7 | 13 | 23 | 35 | 33 | 27 | 24 | 18 | 17 | 22 |
| cdc_ParCPM | 20 | 23 | 28 | 31 | 22 | 24 | 17 | 14 | 17 | 22 |
| igraph_community_infomap | 1 | 10 | 29 | 35 | 33 | 27 | 24 | 18 | 17 | 22 |
| cdc_SVINET | 16 | 22 | 30 | 27 | 30 | 22 | 18 | 17 | 16 | 22 |
| karateclub_SymmNMF | 23 | 26 | 32 | 31 | 29 | 22 | 16 | 10 | 9 | 22 |
| cdc_MSCD_RN | 28 | 28 | 33 | 29 | 27 | 19 | 15 | 8 | 10 | 22 |
| cdc_TopGC | 26 | 27 | 31 | 32 | 28 | 23 | 19 | 13 | 14 | 24 |
| networkit_PLP | 19 | 21 | 34 | 35 | 33 | 27 | 24 | 18 | 17 | 25 |
| pycabem_HiReCS | 29 | 30 | 35 | 33 | 31 | 26 | 22 | 16 | 15 | 26 |
| cdc_MSCD_SO | 30 | 30 | 35 | 34 | 31 | 26 | 21 | 16 | 15 | 26 |
| cdc_MSCD_AFG | 30 | 30 | 35 | 33 | 31 | 25 | 21 | 16 | 15 | 26 |
| cdc_MSCD_SOM | 30 | 30 | 35 | 33 | 31 | 26 | 22 | 16 | 15 | 26 |
| cdc_MSCD_LFK2 | 29 | 29 | 35 | 33 | 31 | 26 | 23 | 16 | 16 | 26 |
| cdc_MSCD_RB | 30 | 30 | 35 | 33 | 31 | 24 | 20 | 14 | 14 | 26 |
| cdc_MSCD_LFK | 30 | 30 | 35 | 34 | 32 | 26 | 23 | 17 | 16 | 27 |
| alg_RelaxMap | 17 | 32 | 37 | 35 | 33 | 27 | 24 | 18 | 17 | 27 |
| cdc_MSCD_HSLSW | 30 | 30 | 35 | 34 | 32 | 26 | 23 | 17 | 16 | 27 |
| alg_GossipMap | 25 | 32 | 37 | 35 | 33 | 27 | 24 | 18 | 17 | 28 |
| karateclub_BigClam | 32 | 31 | 36 | 34 | 33 | 27 | 24 | 18 | 17 | 28 |
| cdc_DEMON | 32 | 32 | 37 | 35 | 33 | 27 | 24 | 18 | 17 | 28 |
| scan_Scanpp | 32 | 32 | 37 | 35 | 33 | 27 | 24 | 18 | 17 | 28 |
| cdc_CliquePercolation | 32 | 32 | 37 | 35 | 33 | 27 | 24 | 18 | 17 | 28 |
| cdc_LinkCommunities | 32 | 32 | 37 | 35 | 33 | 27 | 24 | 18 | 17 | 28 |
| oslom_Infomap | 27 | 32 | 37 | 35 | 33 | 27 | 24 | 18 | 17 | 28 |
| networkit_CutClustering | 32 | 32 | 37 | 35 | 33 | 27 | 24 | 18 | 17 | 28 |
| cdc_FastCpm | 32 | 37 | 35 | 33 | 27 | 23 | 18 | 16 | 28 |
| Algorithm | cz004 | cz008 | cz016 | cz032 | cz064 | cz128 | cz256 | Mean |
|---|---|---|---|---|---|---|---|---|
| oslom_OSLOM | 1 | 2 | 1 | 1 | 1 | 2 | 1 | 1 |
| oslom_Infohiermap | 1 | 3 | 1 | 1 | 1 | 3 | 2 | 2 |
| alg_Paris | 4 | 7 | 9 | 5 | 3 | 2 | 1 | 4 |
| dct_dlplm | 13 | 9 | 2 | 1 | 1 | 1 | 1 | 4 |
| dct_dlslm_with_seq | 15 | 16 | 2 | 1 | 1 | 1 | 1 | 5 |
| karateclub_EdMot | 14 | 14 | 2 | 1 | 1 | 1 | 1 | 5 |
| dct_seq_louvain | 13 | 14 | 2 | 1 | 1 | 1 | 1 | 5 |
| dct_dlslm | 13 | 15 | 2 | 1 | 1 | 1 | 1 | 5 |
| igraph_community_walktrap | 19 | 11 | 1 | 1 | 1 | 1 | 1 | 5 |
| dct_dlslm_no_contraction | 10 | 12 | 2 | 2 | 3 | 4 | 3 | 5 |
| oslom_louvain_method | 12 | 8 | 2 | 2 | 3 | 3 | 3 | 5 |
| networkit_PLM | 16 | 18 | 4 | 1 | 1 | 1 | 1 | 6 |
| cdc_MSCD_RB | 8 | 11 | 5 | 5 | 4 | 3 | 3 | 6 |
| igraph_community_multilevel | 15 | 18 | 4 | 1 | 1 | 1 | 1 | 6 |
| cdc_MOSES | 28 | 1 | 1 | 2 | 2 | 5 | 9 | 7 |
| cdc_MSCD_AFG | 12 | 17 | 5 | 5 | 4 | 3 | 3 | 7 |
| cdc_MSCD_SO | 13 | 15 | 5 | 5 | 4 | 3 | 3 | 7 |
| cdc_MSCD_SOM | 15 | 13 | 5 | 5 | 4 | 3 | 3 | 7 |
| oslom_modopt | 21 | 27 | 2 | 2 | 2 | 1 | 1 | 8 |
| cdc_GCE | 29 | 4 | 1 | 1 | 5 | 7 | 7 | 8 |
| mcl_MCL | 7 | 10 | 7 | 4 | 5 | 8 | 12 | 8 |
| pycabem_LabelRank | 1 | 8 | 14 | 2 | 4 | 10 | 19 | 8 |
| igraph_community_spinglass | 18 | 22 | 13 | 6 | 2 | 1 | 1 | 9 |
| cgcc_CGGC | 22 | 21 | 1 | 2 | 3 | 5 | 13 | 10 |
| igraph_community_infomap | 29 | 32 | 5 | 1 | 1 | 1 | 1 | 10 |
| cdc_Connected_Iterative_Scan | 29 | 24 | 10 | 1 | 2 | 3 | 3 | 10 |
| karateclub_SCD | 29 | 19 | 2 | 3 | 5 | 7 | 8 | 10 |
| oslom_lpm | 29 | 34 | 6 | 1 | 1 | 1 | 1 | 10 |
| alg_RelaxMap | 27 | 23 | 8 | 3 | 3 | 4 | 4 | 10 |
| cdc_MSCD_HSLSW | 29 | 16 | 5 | 5 | 5 | 4 | 3 | 10 |
| dct_infomap | 29 | 33 | 5 | 1 | 1 | 1 | 1 | 10 |
| dct_dlslm_map_eq | 29 | 33 | 2 | 1 | 1 | 1 | 1 | 10 |
| alg_GossipMap | 29 | 23 | 3 | 3 | 3 | 4 | 5 | 10 |
| cdc_MSCD_RN | 3 | 5 | 9 | 12 | 9 | 13 | 19 | 10 |
| cdc_MSCD_LFK | 29 | 28 | 5 | 5 | 4 | 4 | 3 | 11 |
| oslom_Infomap | 29 | 25 | 6 | 3 | 3 | 4 | 4 | 11 |
| cdc_clique_modularity | 18 | 24 | 19 | 14 | 8 | 1 | 3 | 12 |
| oslom_copra | 29 | 39 | 12 | 1 | 1 | 1 | 1 | 12 |
| igraph_community_label_propagation | 29 | 38 | 11 | 1 | 1 | 1 | 1 | 12 |
| alg_lso_cluster | 12 | 32 | 20 | 11 | 4 | 1 | 1 | 12 |
| pycabem_HiReCS | 19 | 26 | 15 | 7 | 5 | 9 | 11 | 13 |
| igraph_community_fastgreedy | 24 | 35 | 22 | 10 | 1 | 1 | 1 | 13 |
| cdc_MSCD_LFK2 | 29 | 31 | 10 | 6 | 6 | 6 | 6 | 13 |
| networkit_LPDegreeOrdered | 29 | 43 | 21 | 4 | 1 | 1 | 1 | 14 |
| snap_Clauset_Newman_Moore | 25 | 36 | 23 | 10 | 1 | 1 | 1 | 14 |
| cdc_DEMON | 9 | 20 | 21 | 15 | 10 | 11 | 13 | 14 |
| karateclub_EgoNetSplitter | 5 | 16 | 17 | 17 | 18 | 15 | 17 | 15 |
| alg_streamcom | 2 | 6 | 18 | 18 | 23 | 21 | 24 | 16 |
| networkit_CutClustering | 7 | 10 | 16 | 19 | 20 | 19 | 20 | 16 |
| pycabem_GANXiSw | 29 | 43 | 26 | 6 | 3 | 2 | 1 | 16 |
| igraph_community_leading_eigenvector | 23 | 37 | 25 | 13 | 7 | 3 | 1 | 16 |
| alg_pg_label_propagation | 29 | 43 | 31 | 9 | 4 | 1 | 1 | 17 |
| sklearn_SpectralClustering | 17 | 33 | 27 | 22 | 12 | 1 | 14 | 18 |
| cdc_ParCPM | 29 | 27 | 18 | 8 | 11 | 12 | 18 | 18 |
| cdc_CliquePercolation | 11 | 30 | 24 | 20 | 19 | 14 | 16 | 19 |
| karateclub_DANMF | 20 | 37 | 33 | 25 | 17 | 1 | 10 | 20 |
| karateclub_SymmNMF | 6 | 28 | 29 | 21 | 13 | 17 | 23 | 20 |
| karateclub_NNSED | 9 | 29 | 29 | 23 | 22 | 20 | 22 | 22 |
| scan_AnyScan_anyScan | 29 | 43 | 28 | 14 | 14 | 18 | 21 | 24 |
| cdc_SVINET | 26 | 40 | 32 | 24 | 21 | 12 | 12 | 24 |
| scan_AnyScan_pScan | 29 | 43 | 28 | 14 | 14 | 18 | 21 | 24 |
| scan_AnyScan_anyScanParl | 29 | 43 | 28 | 14 | 14 | 18 | 21 | 24 |
| scan_AnyScan_Scan | 29 | 43 | 28 | 14 | 14 | 18 | 21 | 24 |
| scan_ppScanSSE | 29 | 43 | 30 | 16 | 15 | 19 | 22 | 25 |
| scan_ppScan | 29 | 43 | 30 | 16 | 16 | 19 | 22 | 25 |
| scan_pScan | 29 | 43 | 30 | 16 | 15 | 19 | 22 | 25 |
| networkit_PLP | 29 | 43 | 36 | 26 | 24 | 16 | 15 | 27 |
| cdc_TopGC | 29 | 41 | 35 | 27 | 25 | 23 | 25 | 29 |
| sklearn_AffinityPropagation | 29 | 43 | 34 | 28 | 26 | 22 | 26 | 30 |
| karateclub_BigClam | 29 | 42 | 37 | 29 | 28 | 25 | 27 | 31 |
| cdc_LinkCommunities | 29 | 43 | 38 | 30 | 27 | 24 | 23 | 31 |
| scan_Scanpp | 29 | 43 | 38 | 30 | 29 | 25 | 27 | 32 |
| Algorithm | (0.0-0.2) | (0.2-0.4) | (0.4-0.6) | (0.6-0.8) | (0.8-1.0) | Mean |
|---|---|---|---|---|---|---|
| oslom_OSLOM | 1 | 2 | 1 | 1 | 1 | 1 |
| igraph_community_walktrap | 1 | 1 | 2 | 3 | 3 | 2 |
| dct_dlplm | 1 | 1 | 2 | 3 | 2 | 2 |
| karateclub_EdMot | 1 | 1 | 2 | 3 | 4 | 2 |
| dct_seq_louvain | 1 | 1 | 2 | 3 | 4 | 2 |
| dct_dlslm | 1 | 1 | 2 | 3 | 4 | 2 |
| dct_dlslm_with_seq | 1 | 1 | 2 | 4 | 4 | 2 |
| oslom_Infohiermap | 1 | 2 | 2 | 2 | 2 | 2 |
| igraph_community_multilevel | 1 | 1 | 3 | 4 | 5 | 3 |
| networkit_PLM | 1 | 1 | 3 | 4 | 5 | 3 |
| dct_dlslm_map_eq | 1 | 2 | 4 | 5 | 5 | 3 |
| oslom_modopt | 1 | 3 | 4 | 4 | 5 | 3 |
| alg_Paris | 1 | 3 | 4 | 3 | 6 | 3 |
| dct_infomap | 1 | 3 | 4 | 5 | 8 | 4 |
| dct_dlslm_no_contraction | 1 | 3 | 6 | 6 | 6 | 4 |
| oslom_louvain_method | 1 | 2 | 6 | 5 | 5 | 4 |
| igraph_community_infomap | 1 | 2 | 4 | 5 | 8 | 4 |
| oslom_lpm | 1 | 3 | 4 | 6 | 8 | 4 |
| cdc_MSCD_AFG | 3 | 4 | 5 | 6 | 7 | 5 |
| cdc_MSCD_RB | 3 | 4 | 5 | 5 | 6 | 5 |
| igraph_community_spinglass | 2 | 4 | 6 | 6 | 7 | 5 |
| cdc_MSCD_HSLSW | 3 | 4 | 6 | 6 | 8 | 5 |
| cdc_MSCD_SO | 3 | 4 | 5 | 5 | 6 | 5 |
| oslom_copra | 1 | 4 | 5 | 6 | 11 | 5 |
| igraph_community_label_propagation | 1 | 4 | 4 | 7 | 8 | 5 |
| cdc_MSCD_SOM | 3 | 4 | 5 | 5 | 6 | 5 |
| cdc_GCE | 1 | 4 | 11 | 9 | 6 | 6 |
| alg_GossipMap | 2 | 4 | 8 | 8 | 10 | 6 |
| cdc_Connected_Iterative_Scan | 1 | 3 | 6 | 8 | 11 | 6 |
| cdc_MOSES | 1 | 5 | 9 | 9 | 8 | 6 |
| alg_RelaxMap | 2 | 4 | 7 | 8 | 11 | 6 |
| oslom_Infomap | 2 | 4 | 6 | 7 | 11 | 6 |
| cdc_MSCD_LFK | 3 | 4 | 8 | 8 | 9 | 6 |
| cgcc_CGGC | 8 | 7 | 9 | 9 | 9 | 8 |
| alg_lso_cluster | 1 | 7 | 10 | 8 | 14 | 8 |
| karateclub_SCD | 2 | 6 | 10 | 10 | 12 | 8 |
| networkit_LPDegreeOrdered | 1 | 6 | 6 | 11 | 15 | 8 |
| igraph_community_fastgreedy | 1 | 5 | 10 | 9 | 14 | 8 |
| snap_Clauset_Newman_Moore | 1 | 5 | 10 | 10 | 15 | 8 |
| cdc_MSCD_LFK2 | 3 | 7 | 11 | 11 | 12 | 9 |
| pycabem_GANXiSw | 1 | 6 | 11 | 12 | 17 | 9 |
| mcl_MCL | 3 | 8 | 11 | 11 | 16 | 10 |
| cdc_clique_modularity | 5 | 8 | 12 | 11 | 13 | 10 |
| alg_pg_label_propagation | 1 | 7 | 15 | 13 | 19 | 11 |
| igraph_community_leading_eigenvector | 3 | 9 | 14 | 13 | 18 | 11 |
| pycabem_HiReCS | 9 | 10 | 13 | 13 | 16 | 12 |
| cdc_DEMON | 2 | 10 | 17 | 17 | 25 | 14 |
| pycabem_LabelRank | 17 | 11 | 14 | 13 | 16 | 14 |
| sklearn_SpectralClustering | 12 | 14 | 16 | 14 | 20 | 15 |
| cdc_MSCD_RN | 13 | 15 | 17 | 15 | 22 | 16 |
| karateclub_DANMF | 11 | 15 | 18 | 15 | 23 | 16 |
| karateclub_EgoNetSplitter | 10 | 16 | 19 | 18 | 24 | 17 |
| cdc_ParCPM | 18 | 13 | 17 | 16 | 21 | 17 |
| cdc_SVINET | 6 | 15 | 20 | 21 | 28 | 18 |
| cdc_CliquePercolation | 2 | 12 | 21 | 24 | 29 | 18 |
| networkit_CutClustering | 4 | 17 | 26 | 24 | 29 | 20 |
| scan_AnyScan_pScan | 14 | 19 | 24 | 21 | 30 | 22 |
| scan_AnyScan_anyScan | 14 | 19 | 24 | 21 | 30 | 22 |
| scan_AnyScan_Scan | 14 | 19 | 24 | 21 | 30 | 22 |
| karateclub_SymmNMF | 21 | 19 | 22 | 19 | 27 | 22 |
| networkit_PLP | 7 | 18 | 27 | 25 | 32 | 22 |
| scan_AnyScan_anyScanParl | 14 | 19 | 24 | 21 | 30 | 22 |
| scan_pScan | 15 | 20 | 25 | 23 | 31 | 23 |
| scan_ppScanSSE | 15 | 20 | 25 | 23 | 31 | 23 |
| scan_ppScan | 16 | 21 | 25 | 23 | 31 | 23 |
| karateclub_NNSED | 19 | 22 | 24 | 22 | 28 | 23 |
| alg_streamcom | 22 | 23 | 23 | 20 | 26 | 23 |
| cdc_TopGC | 23 | 24 | 28 | 27 | 33 | 27 |
| sklearn_AffinityPropagation | 24 | 25 | 29 | 26 | 34 | 28 |
| cdc_LinkCommunities | 20 | 26 | 30 | 28 | 35 | 28 |
| karateclub_BigClam | 25 | 27 | 31 | 29 | 35 | 29 |
| scan_Scanpp | 26 | 28 | 32 | 29 | 36 | 30 |
| Algorithm | _0.1 | _0.2 | _0.3 | _0.4 | _0.5 | _0.6 | _0.7 | _0.8 | _0.9 | Mean |
| igraph_community_walktrap | 1 | 1 | 2 | 3 | 1 | 1 | 1 | 3 | 5 | 2 |
| oslom_OSLOM | 3 | 2 | 4 | 4 | 7 | 6 | 1 | 1 | 2 | 3 |
| oslom_modopt | 1 | 1 | 3 | 3 | 2 | 4 | 2 | 8 | 12 | 4 |
| dct_dlplm | 1 | 1 | 1 | 1 | 3 | 2 | 6 | 8 | 13 | 4 |
| dct_dlslm | 1 | 1 | 2 | 1 | 3 | 5 | 5 | 9 | 13 | 4 |
| dct_seq_louvain | 1 | 1 | 1 | 2 | 3 | 2 | 7 | 9 | 13 | 4 |
| igraph_community_leading_eigenvector | 2 | 1 | 1 | 5 | 9 | 7 | 3 | 8 | 7 | 5 |
| igraph_community_spinglass | 2 | 1 | 5 | 3 | 5 | 7 | 5 | 8 | 12 | 5 |
| karateclub_EgoNetSplitter | 4 | 3 | 3 | 1 | 3 | 7 | 7 | 9 | 12 | 5 |
| igraph_community_multilevel | 1 | 1 | 6 | 3 | 3 | 3 | 4 | 9 | 12 | 5 |
| networkit_PLM | 1 | 1 | 6 | 3 | 3 | 3 | 4 | 9 | 12 | 5 |
| alg_lso_cluster | 1 | 1 | 6 | 3 | 2 | 5 | 6 | 7 | 11 | 5 |
| karateclub_EdMot | 1 | 4 | 6 | 3 | 2 | 5 | 4 | 9 | 12 | 5 |
| oslom_Infohiermap | 1 | 5 | 8 | 10 | 12 | 9 | 1 | 1 | 2 | 5 |
| oslom_louvain_method | 1 | 4 | 6 | 3 | 4 | 8 | 6 | 9 | 11 | 6 |
| igraph_community_fastgreedy | 5 | 6 | 7 | 4 | 6 | 6 | 6 | 8 | 12 | 7 |
| karateclub_SymmNMF | 14 | 9 | 11 | 7 | 10 | 12 | 3 | 2 | 1 | 8 |
| sklearn_SpectralClustering | 12 | 9 | 9 | 6 | 8 | 11 | 9 | 7 | 12 | 9 |
| cdc_MOSES | 11 | 7 | 10 | 8 | 11 | 13 | 11 | 9 | 13 | 10 |
| sklearn_AffinityPropagation | 19 | 18 | 14 | 9 | 13 | 10 | 8 | 4 | 3 | 11 |
| alg_Paris | 16 | 13 | 13 | 9 | 14 | 13 | 10 | 6 | 9 | 11 |
| karateclub_DANMF | 8 | 12 | 15 | 11 | 15 | 15 | 10 | 7 | 8 | 11 |
| karateclub_NNSED | 13 | 11 | 16 | 12 | 17 | 17 | 13 | 5 | 4 | 12 |
| cdc_Connected_Iterative_Scan | 7 | 8 | 18 | 16 | 16 | 19 | 18 | 11 | 14 | 14 |
| mcl_MCL | 1 | 10 | 12 | 24 | 25 | 21 | 18 | 11 | 5 | 14 |
| dct_infomap | 1 | 1 | 14 | 19 | 25 | 21 | 18 | 11 | 14 | 14 |
| cdc_CONGA | 18 | 18 | 19 | 15 | 17 | 14 | 12 | 7 | 11 | 15 |
| oslom_lpm | 10 | 15 | 13 | 12 | 25 | 21 | 18 | 11 | 14 | 15 |
| networkit_PLP | 9 | 17 | 14 | 13 | 25 | 21 | 18 | 11 | 14 | 16 |
| cdc_SVINET | 12 | 16 | 19 | 17 | 20 | 20 | 16 | 10 | 14 | 16 |
| alg_pg_label_propagation | 15 | 18 | 17 | 14 | 19 | 21 | 18 | 11 | 14 | 16 |
| cdc_TopGC | 21 | 20 | 20 | 18 | 18 | 16 | 14 | 8 | 10 | 16 |
| igraph_community_label_propagation | 17 | 14 | 21 | 14 | 25 | 21 | 18 | 11 | 14 | 17 |
| pycabem_GANXiSw | 6 | 19 | 17 | 20 | 25 | 21 | 18 | 11 | 14 | 17 |
| igraph_community_infomap | 1 | 13 | 22 | 24 | 25 | 21 | 18 | 11 | 14 | 17 |
| oslom_copra | 20 | 21 | 22 | 23 | 21 | 21 | 18 | 11 | 6 | 18 |