Influence of Collisions with Hydrogen on Titanium Abundance Determinations in Cool Stars
Abstract
We performed the non-local thermodynamic equilibrium (non-LTE) calculations for Ti I-II with the updated model atom that includes quantum-mechanical rate coefficients for inelastic collisions with hydrogen atoms. We have calculated for the first time the rate coefficients for bound-bound transitions in inelastic collisions of titanium atoms and ions with hydrogen atoms and for the charge-exchange processes: Ti I + H Ti II + H- and Ti II + H Ti III + H-. The influence of these data on non-LTE abundance determinations has been tested for the Sun and four metal-poor stars. For Ti I and Ti II, the application of the derived rate coefficients has led to an increase in the departures from LTE and an increase in the titanium abundance compared to that, obtained with approximate formulas for the rate coefficients. In metal-poor stars, we have failed to achieve consistent non-LTE abundances from lines of two ionization stages. The known in the literature discrepancy in the non-LTE abundances from Ti I and Ti II lines in metal-poor stars cannot be solved by improvement of the rates of inelastic processes in collisions with hydrogen atoms in non-LTE calculations with classical model atmospheres.
DOI: 10.1134/S1063773720010041
Keywords: titanium abundance in stars, non-LTE line formation, inelastic collisions with hydrogen atoms.
1 Introduction
In stars over a wide range of spectral types, from K to A, titanium is observed in spectral lines of two ionization stages (Ti I and Ti II). Titanium lines can be used to determine stellar atmosphere parameters – the effective temperature () and the surface gravity (log g). For accurate abundance determinations from lines of Ti I and Ti II, the departures from local thermodynamic equilibrium (non-LTE effects) should be taken into account (Bergemann 2011, Sitnova et al. 2016). In stellar atmospheres with > 4500 K, neutral titanium is a minority species, and its statistical equilibrium (SE) can easily deviate from thermodynamic equilibrium owing to deviations of the mean intensity of ionizing radiation from the Planck function. Overionization of low-excitation levels by ultraviolet (UV) radiation, which leads to an underpopulation of atomic levels and a weakening of spectral lines compared to the LTE, is responsible for the departures from LTE for Ti I. The accuracy of the non-LTE calculations depends on the completeness and quality of the employed atomic data. In non-LTE calculations for Ti I-II (Bergemann 2011; Bergemann et al. 2012; Sitnova et al. 2016; Sitnova 2016; Mashonkina et al. 2017), inelastic collisions with hydrogen were taken into account using the Drawin formula (Drawin 1968, 1969; Steenbock and Holweger 1984) with a scaling coefficient to the rates (). The application of this formula is criticized in the literature, since it does not contain the essential physics and significantly overestimates the collision rate (Barklem et al. 2011). However, it is used by astrophysicists for non-LTE calculations in the absence of accurate quantum-mechanical calculations.
Bergemann (2011) and Sitnova et al. (2016) showed that non-LTE leads to agreement between the abundances from Ti I and Ti II lines in stars of spectral types from G to A and nearly solar metallicity. However, for metal-poor halo stars, [Fe/H]111We use the standard notation for the elemental abundance ratios [X/H] = . < , with well-known atmospheric parameters the non-LTE abundances from Ti I and Ti II lines have not been reconciled neither with = 1 (Sitnova et al. 2016) nor with = 3 (Bergemann 2011). The discrepancy in the non-LTE abundances from Ti I and Ti II lines as a function of metallicity was discussed by Sitnova (2016). For dwarf stars in the solar neighborhood, consistent abundances from two ionization stages were obtained for stars with [Fe/H] > , while stars with a lower metallicity show a discrepancy in the mean non-LTE abundances from Ti I and Ti II lines, , up to 0.35 dex. A similar behavior of was found for cool giants by Mashonkina et al. (2017). Due to the lower effective temperatures of giants, the abundances from two ionization stages begin to diverge at a lower metallicity, [Fe/H] < .
At present, the non-LTE calculations in metal-poor stars incorrectly predict the departures from LTE for Ti I and, possibly, also for Ti II. The departures from LTE increase with decreasing metallicity due to a rise in the UV flux and a decrease in the rates of collisions with electrons. Because of the lower electron density, the accuracy of data for the collisions with hydrogen atoms plays a crucial role in non-LTE calculations for metal-poor stars. In this paper, for the first time we present the rate coefficients of excitation and de-excitation processes for bound-bound transitions in collisions of titanium atoms and ions with hydrogen atoms and for the following charge-exchange processes: Ti I + H Ti II + H- and Ti II + H Ti III + H-. These results are of great practical importance for modeling the formation of titanium lines in the atmospheres of cool stars.
Our calculations of the rate coefficients for transitions in inelastic collisions of titanium atoms and ions with hydrogen atoms are presented in Section 2. A brief description of the stellar sample, employed for testing the impact of the derived rate coefficients on the non-LTE abundance is given in Section 3. The method of calculation of the spectra is described in Section 4. The results of our non-LTE calculations and the derived non-LTE abundances are presented in Sections 5 and 6, respectively.
2 Rate coefficients for inelastic processes in collisions with hydrogen
The rate coefficients were calculated for excitation and de-excitation processes for bound-bound transitions in collisions of titanium atoms and ions with hydrogen atoms and for the following charge-exchange processes: Ti I + H Ti II + H- and Ti II + H Ti III + H-. For our calculations we used the quantum model approach proposed by Belyaev and Yakovleva (2017a, 2017b) and based on the application of the asymptotic semi-empirical approach and the two-channel Landau-Zener model within the Born-Oppenheimer approach. This approach allows us to calculate the rate coefficients for the inelastic processes associated with the transitions due to the long-range ionic-covalent interaction of electronic states in the quasi-molecules formed in collisions of atoms and ions of various chemical elements with hydrogen atoms and anions.
When considering collisions of Ti I with hydrogen, we included 107 molecular states of the TiH quasi-molecule in our calculations, two of which correspond to the ionic pairs: Ti II (3d24s 4F) + H- and Ti II (3d3 4F) + H-. The model approach allows only the single-electron transitions between various states of the same molecular symmetry of the quasi-molecule to be taken into account; therefore, we performed two sets calculations of the rate coefficients and included the Ti I (3d24s nl 3,5L) + H and Ti II (3d24s 4F) + H- states in one of them and the Ti I (3d3nl 3,5L) + H and Ti II (3d3 4F) + H- states in the other one. Note that the Ti I (3d34s 3,5L) states were included in both analyses. The transitions between electronic states can occur within various molecular symmetries. However, since both ionic configurations produce molecular states of symmetries , , , and , the covalent states of only the same molecular symmetries were included in our analysis. The transitions occurring within each molecular symmetry were considered separately, while the rate coefficients for each inelastic process were summed over the molecular symmetries.
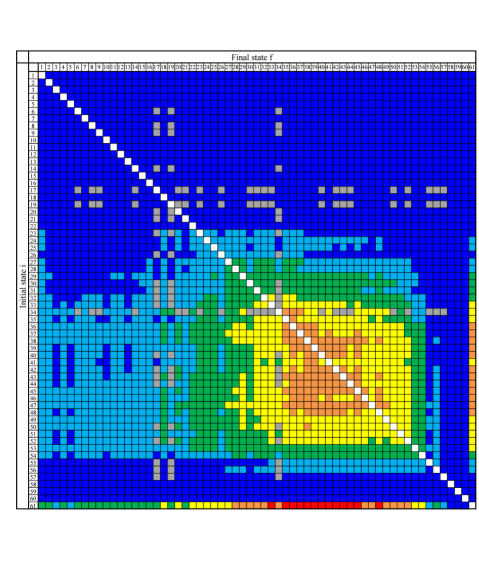
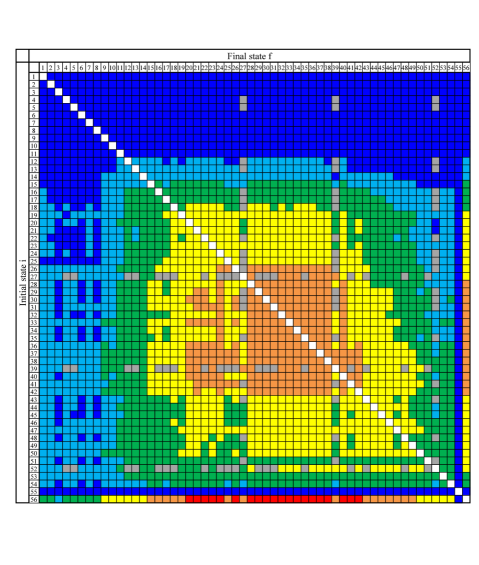
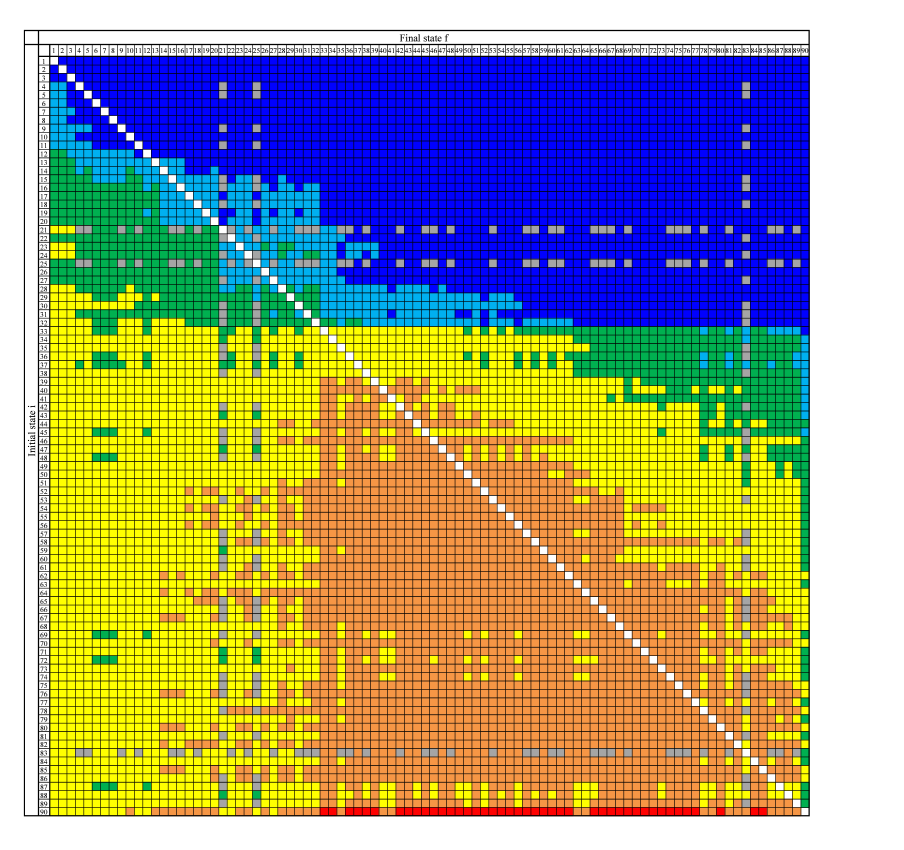
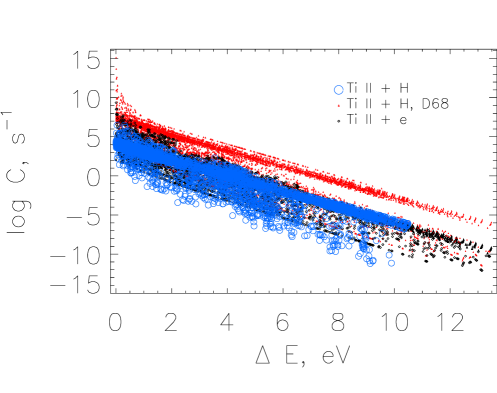
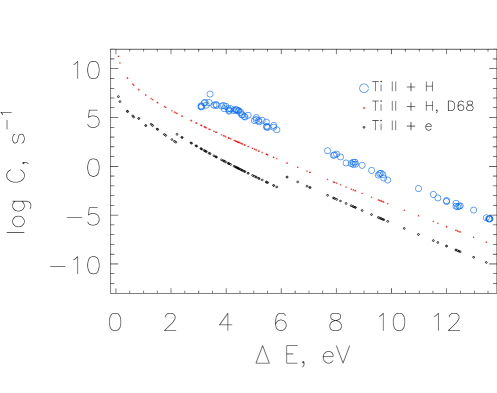
When investigating collisions of Ti II with hydrogen, we considered 90 molecular states of the TiH+ quasi-molecule, including one state corresponding to the ionic pair Ti III (3d2 3F) + H-. Since the ionic state has molecular symmetries , , , and , our calculations were performed within each of the molecular symmetries. Graphical representations of the calculated rate coefficients for all inelastic processes are presented in Fig. 1. The rate coefficient in this figure is indicated by a color from red (with values greater than 10-8 cm3/s) to blue (with values less than 10-12 cm3/s). Note that the rate coefficients for elastic processes were not calculated in this study and, therefore, they are indicated by the white color, while the rate coefficients for the processes associated with the transitions between states of different molecular symmetries are zero and indicated by the gray color.
The two upper panels show the rate coefficients for the processes occurring in the collisions of Ti I with hydrogen: Figs. 1a and 1b present, respectively, the rate coefficients for the processes associated with the transitions due to the interaction of the covalent Ti I (3d24s nl 3,5L) + H states with the first ionic Ti II (3d24s 4F) + H- state and due to the interaction of the Ti I (3d3nl 3,5L) + H states with the second ionic Ti II (3d3 4F) + H- state. We formed a complete matrix of rate coefficients for the transitions between all 107 states considered to be used in our subsequent calculations. We performed summation for the excitation and deexcitation processes associated with the transitions between the Ti I (3d34s 3,5L) states occurring due to the interaction with both ionic configurations. The rate coefficients for the processes associated with the transitions between the states interacting with different ionic configurations are zero. Figure 1c presents the rate coefficients for the inelastic processes occurring in the collisions of Ti II with hydrogen.
It can be seen from the graphical representations in Fig. 1 that the largest rate coefficients correspond to the processes of mutual neutralization into the states for which the electron binding energy is in an optimal window and the processes associated with the transitions between these states. As shown by Belyaev and Yakovleva (2017a, 2017b), the electron binding energy in such states is about 2 eV for the collisions of neutral atoms with hydrogen, corresponding to Ti I excitation energies in the range 4-5 eV, and about 4 eV for the collisions of singly charged positive ions with hydrogen, corresponding to Ti II excitation energies in the range 8-10 eV.
The derived rate coefficients are accessible at http://www.non-lte.com/ti_h.html and in the arXiv source file.
(а)
 (b)
(b)
 (c)
(c)
3 Stellar sample, atmospheric parameters, and observations
The sample of stars includes four metal-poor stars and the Sun. Their atmospheric parameters are given in Table 1. For HD 84937, HD 140283, and HD 122563 we use the atmospheric parameters as in Mashonkina et al. (2019). Here we only note that based on photometric measurements (Casagrande et al. 2010), stellar angular diameter measurements (Karovicova et al. 2018; Creevey et al. 2012, 2015), and the distances (Bailer-Jones et al. 2018) derived from the trigonometric parallaxes from the Gaia DR2 archive (Brown et al. 2018), the effective temperature and surface gravity for these stars are reliably fixed within 50 K and 0.05 dex, respectively. For the ultra metal-poor giant CD-38245, stellar parameters were determined in Sitnova et al. (2019), using the color-magnitude calibrations, distances, isochrones, and the non-LTE analysis of the Balmer line profiles and the Ca I/Ca II ionization equilibrium.
For abundance determinations, we used high spectral resolution ( > 45 000) observations with a signal-to-noise ratio S/N > 50. The spectra were taken from the UVES222http://archive.eso.org/eso/eso_archive_main.html archive. For HD 84937 and HD 140283, we also used the spectra in the UV range (1875 – 3158 Å), obtained at the Hubble Space Telescope with the STIS spectrograph. The UV spectra were reduced by T. Ayres and are publicly accessible at http://casa.colorado.edu/ayres/ASTRAL. The solar abundance was determined using a spectrum of the Sun as a star (Kurucz et al. 1984).
| LTE | non-LTE | |||||||
|---|---|---|---|---|---|---|---|---|
| Star | log g | [Fe/H] | logA | logA | logA | logA | ||
| Sun | 5777 | 4.44 | 0.0 | 0.9 | –7.120.06 | –7.050.05 | –7.090.08 | –7.060.05 |
| HD 84937 | 6350 | 4.09 | –2.18 | 1.7 | –8.810.03 | –8.860.10 | –8.650.03 | –8.820.09 |
| HD 140283 | 5780 | 3.70 | –2.43 | 1.3 | –9.340.08 | –9.310.07 | –9.160.08 | –9.270.06 |
| HD 122563 | 4600 | 1.40 | –2.55 | 1.6 | –9.810.06 | –9.420.08 | –9.600.11 | –9.400.07 |
| CD–38 245 | 4850 | 1.80 | –3.70 | 1.7 | –10.800.04 | –10.860.11 | –10.430.05 | –10.680.10 |
4 Method of spectra calculation
We determined the titanium abundance from Ti I and Ti II lines in the non-LTE, where the population of each level in the model atom is calculated by solving the system of the statistical equilibrium equations coupled with the radiative transfer equation. The equations are solved in a given model atmosphere with the DETAIL code developed by Butler and Giddings (1985). The continuum opacity calculations were updated, as described by Mashonkina et al. (2011). The level populations obtained in DETAIL were then used to compute the line profiles with the synthV_NLTE code (Tsymbal et al. 2019). To compare the theoretical spectrum with the observed one, we use O. Kochukhov’s binmag333http://www.astro.uu.se/oleg/download.html code. We use the classical plane-parallel model atmospheres interpolated from the MARCS grid (Gustafsson et al. 2008).
This study applies the Ti I-II model atom from Sitnova et al. (2016) with the modifications concerning computations of rates of hydrogenic collisions. Sitnova et al. (2016) applied the Drawin formula with the scaling coefficient = 1. In this paper, we calculated the rate coefficients for the inelastic collision processes using the approximate, but physically justified method proposed by Belyaev and Yakovleva (2017a, 2017b) and based on quantum-mechanical calculations (see Section 2). The list of Ti I and Ti II lines in the visible range was adopted from our previous paper (Sitnova 2016). The atomic data for the transitions, namely, the wavelengths , oscillator strengths (log gf), and excitation energies of the lower level (), were taken from the VALD database (Kupka et al. 1999; Ryabchikova et al. 2015). Note that the gf values for Ti I (Lawler et al. 2013) and Ti II (Wood et al. 2013) were obtained in the same laboratory. Table 2 gives the atomic data for the Ti II lines in the UV spectral range that have been used for the first time to determine the non-LTE titanium abundances in HD 84937 and HD 140283. The oscillator strengths were taken from Wood et al. (2013), Pickering et al. (2001), or R. Kurucz’s database (kurucz.harvard.edu); for each line the source is specified in Table 2.
| log gf | Ref. | log | log | log | ||
|---|---|---|---|---|---|---|
| Å | eV | s-1 | s-1cm-3 | s-1cm-3 | ||
| 2041.47 | 0.57 | –1.12 | P | 8.41 | –6.38 | –7.84 |
| 2043.23 | 0.57 | –1.82 | K | 8.41 | –6.38 | –7.84 |
| 2054.53 | 0.61 | –0.87 | P | 8.41 | –6.38 | –7.84 |
| 2135.71 | 1.18 | –1.56 | P | 8.42 | –6.35 | –7.83 |
| 2162.68 | 1.24 | –0.49 | P | 8.42 | –6.35 | –7.83 |
| 2229.24 | 1.08 | –1.21 | P | 8.41 | –6.38 | –7.84 |
| 2261.19 | 1.89 | 0.21 | K | 8.52 | –6.34 | –7.83 |
| 2534.62 | 0.12 | –0.93 | W | 8.35 | –6.47 | –7.86 |
| 2884.10 | 1.13 | –0.23 | W | 8.45 | –6.54 | –7.83 |
| 3046.68 | 1.16 | –0.81 | W | 8.32 | –6.44 | –7.86 |
| 3148.04 | 0.00 | –1.22 | P | 8.16 | –6.41 | –7.85 |
P – Pickering et al. (2001), K – Kurucz database (kurucz.harvard.edu), W – Wood et al. (2013).
5 Statistical equilibrium of Ti I-II
In stellar atmospheres with > 4000 K, titanium is highly ionized. For example, everywhere in the solar atmosphere. Because of the low Ti I number density compared to Ti II, a slight deviation of the mean intensity of ionizing radiation from the Planck function results in a noticeable deviation of the Ti I number density from the equilibrium one. This mechanism of departures from LTE is called overionization and leads to an underpopulation of atomic levels compared to LTE. For Ti II, as for the majority species, the departures from LTE are small and ruled by bound-bound transitions.
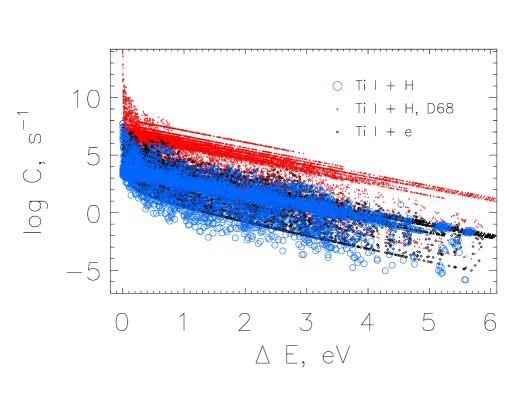
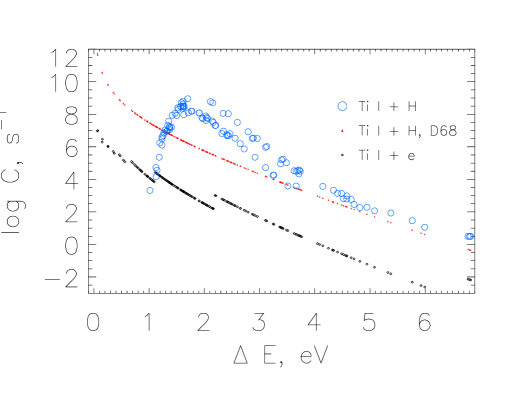
Figure 2 shows the excitation and ion pair formation rates in collisions with H atoms together with electronic rates, under physical conditions corresponding to the line formation depth in the atmospheres of cool metal-poor stars. For comparison, we show the Drawinian rates for inelastic collisions with hydrogen atoms, which were applied in earlier studies due to the absence of accurate data. We used the Drawin (1968, 1969) formula to calculate the rates of radiatively allowed transitions and the approach proposed by Takeda (1994) for radiatively forbidden transitions. This approach implies that the rate of inelastic collisions with hydrogen atoms (CH) is calculated via the electron collision rate (Ce) from the relation CH = C, where mH, me and , are the masses and number densities of hydrogen atoms and electrons, respectively. For Ti I and Ti II, the excitation rates in collisions with hydrogen atoms derived in this paper are equal in order of magnitude to those in collisions with electrons and are lower than the Drawinian rates by three orders of magnitude. The ion-pair formation rates in collisions with hydrogen atoms exceed the electron-impact ionization rates approximately by three orders of magnitude at ionization energies greater than 2 eV.
The rates obtained in this paper differ fundamentally from those that we applied previously, since the former are based on a physically realistic assumption. First, the process of conversion, for example, of Ti I into Ti II, occurs via charge exchange, Ti I + H Ti II + H- , while the Drawin formula was used for ionization, Ti I + H Ti II + H + e. Second, when the excitation rates are calculated from the Drawin and Takeda formulas, all levels in the model atom are coupled by collisions, while quantum-mechanical calculations predict that the transitions in inelastic collisions with hydrogen atoms occur between the levels that satisfy the selection rules for a molecular symmetry. A decrease in the number of transitions, for which the inelastic collisions with hydrogen atoms are efficient, leads to an increase of the departures from LTE.
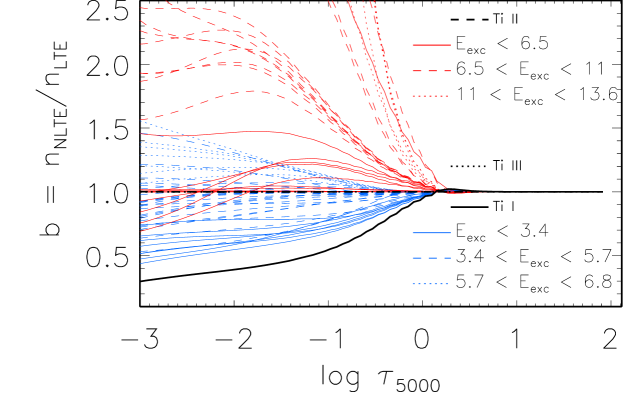
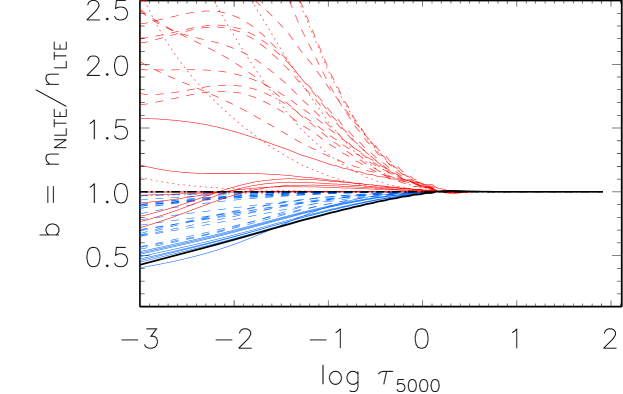
The deviation of the level populations from the equilibrium ones are characterized by the departure coefficients, bi = /, where and are the populations of level i in the non-LTE and LTE cases, respectively. Figure 3 shows the departure coefficients for Ti I and Ti II levels in the model atmosphere with = 6350 K, log g = 4.09, [Fe/H] = –2.1 calculated with the rates of inelastic collisions with hydrogen atoms from this paper and from the approximate formulas. The Ti I levels with an excitation energy < 5 eV are depleted as a result of overionization by UV radiation. The lower the excitation energy of the level, the greater its underpopulation, which leads to a weakening of the Ti I lines due to a decrease in the line opacity (, where bl is the departure coefficient of the lower level). The Ti II levels, on the contrary, are overpopulated due to radiative pumping, the more so, the greater their excitation energy. On the one hand, the line opacity increases due to the lower-level overpopulation, but, on the other hand, the source function exceeds the Planck function at the transition frequency due to a greater overpopulation of the upper level compared to the lower one (Sν/B, where Sν is the source function, Bν is the Planck function, and are the departure coefficients of the upper and lower levels, respectively). Therefore, for Ti II lines, non-LTE can lead to both line weakening and strengthening. The ground level of the majority species, Ti II, retains its equilibrium population in all atmospheric layers.
With the application of new data, the departures from LTE are strengthened due to a decrease in the collision rates. Besides with the increase of the departures from LTE, it is important that the coupling between levels with close energies weakens. This effect is most pronounced for the departure coefficient of the ground level of Ti I, which became separated from the departure coefficient of the levels with higher excitation energy (Fig. 3).
6 Titanium abundance in the sample stars
For the Sun and four metal-poor stars, we determined the non-LTE and LTE titanium abundances from Ti I and Ti II lines. The application of accurate data led to an increase in the mean non-LTE abundance from Ti I and Ti II lines for all sample stars. For the Sun, the mean non-LTE abundance increased only by 0.01 dex for both Ti I and Ti II. Despite the small change in the mean non-LTE abundance, for individual Ti I lines the difference in collision rates leads to changes in the non-LTE abundance up to 0.09 dex in absolute value. In the Sun, the non-LTE abundance corrections ( = log Anon-LTE – log ALTE) for Ti I and Ti II lines do not exceed 0.1 dex in absolute value.
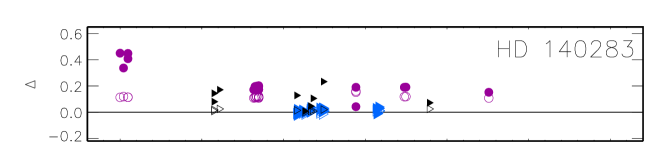
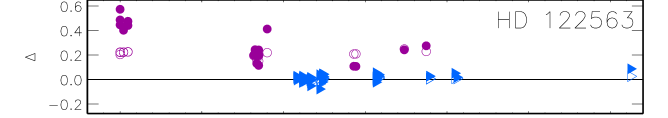
For our metal-poor stars, the non-LTE corrections for different lines calculated with the accurate and approximate rates are shown in Fig. 4. In the non-LTE calculations with the approximate rates, the non-LTE corrections for the lines forming in transitions with different lower-level excitation energies are similar. For most lines, the application of accurate data led to an increase in the non-LTE corrections. We obtained the largest change in the non-LTE abundance for the Ti I lines forming in the transitions from the ground level. For these lines, the non-LTE corrections increase by up to 0.3 dex in HD 140283 and HD 122563. At the same time, with the new data the non-LTE corrections themselves in different stars are 0.3–0.5 and 0.1–0.2 dex for the lines from the ground level and levels with > 0.8 eV, respectively.
For Ti II lines in the visible spectral range, the changes in non-LTE abundance do not exceed 0.1 dex, while for Ti II lines in the UV range we obtained significant changes, for example, 0.2 dex for Ti II 2162 Å in HD 140283. The non-LTE corrections themselves are either positive, up to 0.25 dex, or small negative, no more than 0.1 dex in absolute value for strong lines with an equivalent width 100 mÅ < EW < 120 mÅ.
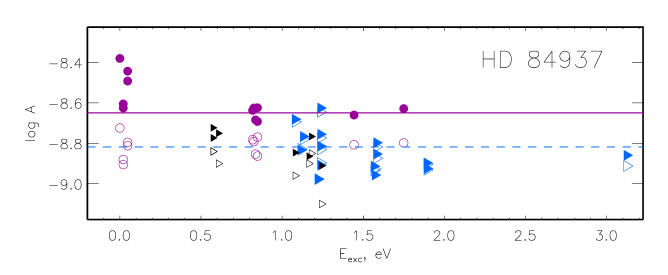
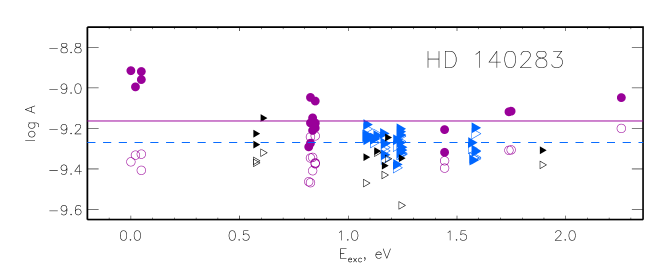
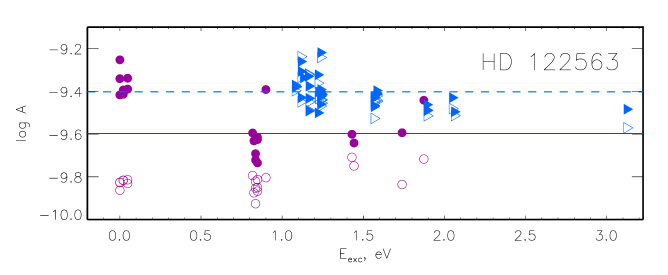
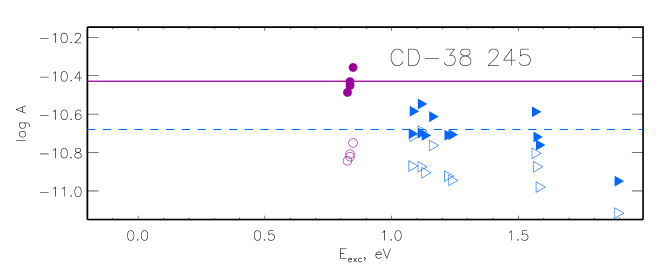
Figure 5 shows the derived non-LTE and LTE abundances from individual lines in the metal-poor sample stars. The changes in the rates led to a discrepancy in the abundances from Ti I lines from the ground level and with an excitation energy > 0.8 eV in all four stars. Such a behavior is observed for Fe I lines with < 1.5 eV and can be interpreted as a signature of convection (3D-effects, see, e.g., Collet et al. 2007; Dobrovolskas et al. 2013; Amarsi et al. 2019). These lines are not recommended for abundance determinations with classical model atmospheres. In this paper, the mean abundance from Ti I lines was calculated neglecting the lines forming in the transitions from the ground level. Table 1 gives the non-LTE and LTE abundances from Ti I and Ti II lines. For HD 140284 and HD 84937, for which UV spectra are available, we found the non-LTE abundances from Ti II lines in the visible and UV ranges to be consistent.
For the sample stars, we compare the titanium abundances calculated separately from Ti I and Ti II lines. For the Sun, non-LTE leads to an agreement between the abundances from lines of different ionization stages. The mean abundance difference between Ti I and Ti II is = –0.07 dex0.08 and –0.03 dex0.09 in LTE and non-LTE, respectively. For HD 140283, HD 84937, and CD-38 245, the abundances from two ionization stages agree in LTE. For HD 122563, the LTE difference is = –0.4 dex. In non-LTE, the abundances from Ti I and Ti II lines do not agree and = 0.10 dex0.10, 0.17 dex0.09, –0.20 dex0.13, and 0.25 dex0.11 for HD 140283, HD 84937, HD 122563, and CD-38 245, respectively. Such a behavior cannot be explained by the errors in the atmospheric parameters. For example, for CD-38 245, where the uncertainties in and log g are largest compared to the other sample stars, a decrease in by 250 K or an increase in log g by 0.3 allows the discrepancy to be reduced only by 0.15 and 0.09 dex, respectively. However, such changes in parameters would lead to an implausible evolutionary status of CD-38 245 that does not correspond to its metallicity, age, and position on the corresponding isochrone.
The problem of a discrepancy in the non-LTE abundances from Ti I and Ti II lines in metal-poor stars was discussed in the literature (Bergemann 2011; Sitnova et al. 2016; Sitnova 2016). Table 3 gives the abundance difference for three sample stars obtained in this paper, our previous paper (Sitnova et al. 2016), and Bergemann (2011). For comparison, we also provide the analogous quantities for iron derived by Mashonkina et al. (2019) with the accurate quantum-mechanical data for Fe I + H and Fe II + H collisions. For titanium, no agreement between the non-LTE abundances from different ionization stages was obtained in any of the papers. Bergemann (2011) suggested that the problem could lie in an insufficient accuracy of the atomic data. Since then, a significant progress has been achieved in the atomic data for Ti I and Ti II line calculations, and (i) laboratory measurements of the oscillator strengths for Ti I (Lawler et al. 2013) and Ti II (Wood et al. 2013) transitions, (ii) accurate quantum-mechanical calculations of the photoionization cross sections for Ti I (Nahar 2015) and Ti II (K. Butler, private communication 2015), and (iii) accurate quantum-mechanical calculations of the transition rate coefficients in inelastic collisions with hydrogen atoms (this paper) have appeared. However, as can be clearly seen from Table 3, the application of these data has not solved the problem of a discrepancy in the abundances from Ti I and Ti II lines in metal-poor stars. Note that there is also a hint of a higher abundance from Fe I lines than that from Fe II in non-LTE for iron (Mashonkina et al. 2011, 2019). However, this effect for iron is weaker than for titanium, possibly, due to smaller departures from LTE.
The problem refers more to the Ti I lines than to Ti II. The elemental abundance ratios in Milky Way halo stars argue for this conclusion. From a non-LTE analysis of Mg I, Ca I, Ti II, and Fe II lines Zhao et al. (2016) found that for stars with [Fe/H] < –1 the elemental abundance ratios [Mg, Ca, Ti/Fe] 0.3. For HD 84937, HD 140283, and HD 122563 [Ti II/Fe] = 0.44, 0.25, and 0.26, respectively, and are close to [/Fe] from Zhao et al. (2016), while from Ti I with [Ti I/Fe] = 0.61, 0.36, and 0.06 the elemental abundance ratios shows larger deviations from the mean Galactic [/Fe]. As before, we conclude that Ti II lines in metal-poor stars give more reliable non-LTE abundance than that obtained from Ti I lines. Depending on the stellar effective temperature, the abundance from Ti I lines is either overestimated, as in the case of HD 84937 with = 6350 K and, to a lesser extent, HD 140283 with = 5780 K, or, on the contrary, underestimated, as in the case of the giant HD 122563 with = 4600 K. It should be noted that the titanium abundance in CD-38 245 does not follow this trend. The metallicity of this star is lower than that for the other three metal-poor stars by more than an order of magnitude. More data for stars in different metallicity ranges are needed to understand the behavior of the non-LTE abundance discrepancy as a function of atmospheric parameters.


| [Ti I/Fe] | [Ti II/Fe] | |||||
| Star | S20 | S16 | B11 | M19 | S20 + M19 | |
| HD 84937 | 0.17 | 0.15 | 0.24 | 0.10 | 0.61 | 0.44 |
| HD 140283 | 0.10 | 0.09 | 0.16 | 0.09 | 0.36 | 0.25 |
| HD 122563 | –0.20 | –0.18 | –0.10 | –0.07 | 0.06 | 0.26 |
| S20 – this paper, S16 – Sitnova et al. (2016), | ||||||
| B11 – Bergemann (2011), M19 – Mashonkina et al. (2019). | ||||||
7 Conclusions
In this paper, we made an attempt to solve the problem of a discrepancy in the non-LTE abundances from Ti I and Ti II lines in metal-poor stars by applying accurate data to for the inelastic collisions with hydrogen atoms. For this purpose, we calculated the rate coefficients for bound-bound transitions in inelastic collisions of titanium atoms and ions with hydrogen atoms and for the following charge-exchange processes: Ti I + H Ti II + H- and Ti II + H Ti III + H-. The influence of accurate data on non-LTE abundance determinations was tested for the Sun and four metal-poor stars.
The application of the derived rate coefficients led to an increase in the departures from LTE and an increase in the titanium abundance compared to what is obtained using approximate formulas. For the Sun, the mean non-LTE abundance increased only by 0.01 dex from both Ti I and Ti II lines. In metal-poor stars, we found a significant change in the non-LTE abundance, up to 0.3 dex, for the Ti I lines forming in the transitions from the ground level. This led to a discrepancy in the abundances from Ti I lines from the ground level and with an excitation energy > 0.8 eV in the sample stars.
For our metal-poor stars, the mean non-LTE abundance from Ti II lines increased by a few hundredths, from 0.01 to 0.07 dex, depending on the atmospheric parameters. For Ti II lines in the UV range, the non-LTE corrections are significant and can reach 0.2 dex in dwarfs with [Fe/H] = –2. In HD 84937 and HD 140283, we found consistent non-LTE abundances from Ti II lines in the visible and UV ranges.
For the Sun, non-LTE leads to agreement between the abundances from Ti I and Ti II lines. The mean abundance difference between Ti I and Ti II is = dex and dex in LTE and non-LTE, respectively. For our metal-poor stars, there is a discrepancy in the non-LTE abundances from Ti I and Ti II lines; = 0.10 dex, 0.17 dex, –0.20 dex, and 0.25 dex for HD 140283, HD 84937, HD 122563, and CD-38 245, respectively. The problem of a discrepancy in the abundances from Ti I and Ti II lines in metal-poor stars known in the literature, apparently, cannot be solved via an improvement of the rates of inelastic processes in collisions with hydrogen atoms in non-LTE calculations with classical model atmospheres.
Acknowledgments: S.A. Yakovleva and A.K. Belyaev gratefully acknowledge support from the Ministry of Science and Higher Education of the Russian Federation (project nos. 3.5042.2017/6.7 and 3.1738.2017/4.6). We are grateful to K. Fuhrmann for the spectra and O. Kochukhov for the binmag code. We used the VALD, MARCS, and ASTRAL databases.
References
- [1] A. M. Amarsi, P. E. Nissen, Á. Skúladóttir, Astron. Astrophys., 630, A104 (2019).
- [2] C. A. L. Bailer-Jones, J. Rybizki, M. Fouesneau, G. Mantelet, R.Andrae, Astron. J., 156, 58 (2018).
- [3] P. S. Barklem, A. K. Belyaev, M. Guitou, N. Feautrier, F. X. Gadéa, A. Spielfiedel, Astron. Astrophys., 530, A94 (2011).
- [4] K. Butler, J. Giddings, Newsletter on Analysis of Astronomical Spectra 9, University of London, 723, (1985).
- [5] A. K. Belyaev, S. A. Yakovleva, Astron. Astrophys., 606, A147 (2017a).
- [6] A. K. Belyaev, S. A. Yakovleva, Astron. Astrophys., 608, A33 (2017b).
- [7] M. Bergemann, R.-P. Kudritzki, B. Plez, B. Davies, K. Lind, Z. Gazak, MNRAS, 751, 156 (2012).
- [8] M. Bergemann, Astrophys. J., 413, 2184 (2011).
- [9] Gaia Collaboration A. G. A. Brown, A. Vallenari, T. Prusti, J. H. J. de Bruijne, C. Babusiaux, C. A. L. Bailer-Jones, M. Biermann, D. W. Evans, L. Eyer, et al., Astron. Astrophys., 616, A1 (2018).
- [10] M. P. Wood, J. E. Lawler, C. Sneden, J. J. Cowan, Astrophys. J.s, 208, 27 (2013).
- [11] B. Gustafsson, B. Edvardsson, K. Eriksson U. G., Jørgensen, Å. Nordlund, B. Plez, Astron. Astrophys., 486, 951 (2008).
- [12] V. Dobrovolskas, A. Kučinskas, M. Steffen, H.-G. Ludwig, D. Prakapavičius, J. Klevas, E. Caffau, P. Bonifacio, Astron. Astrophys., 559, A102 (2013).
- [13] H.W. Drawin, Z. Physik, 211, 404 (1968).
- [14] H.W. Drawin, Z. Physik, 225, 483 (1969).
- [15] G. Zhao, L. Mashonkina, S. Alexeeva, Yu. Pakhomov, J.-R. Shi, T. Sitnova, K. Tan, H.-W. Zhang, et al., Astrophys. J., 833, I2, 225 (2016).
- [16] I. Karovicova, T. R. White, T. Nordlander, K. Lind, L. Casagrande, M. J. Ireland, D. Huber, O. Creevey, D. Mourard, G. H. Schaefer, G. Gilmore, A. Chiavassa, M. Wittkowski, P. Jofré, U. Heiter, F. Thévenin, M. Asplund, MNRAS, 475, L81 (2018).
- [17] L. Casagrande, I. Ramírez, J. Meléndez, M. Bessel, M. Asplund, Astron. Astrophys., 512, A54 (2010).
- [18] R. Collet, M. Asplund, R. Trampedach, Astron. Astrophys., 469, 687 (2007).
- [19] O. L. Creevey, F. Thevenin, T. S. Boyajian, P. Kervella, A. Chiavassa, L. Bigot, A. Merand, U. Heiter et al., Astron. Astrophys., 545, A17 (2012).
- [20] O. L. Creevey, F. Thevenin, P. Berio, U. Heiter, K. von Braun, D. Mourard, L. Bigot, T. S. Boyajian et al., Astron. Astrophys., 575, A26 (2015).
- [21] F. Kupka, N.E. Piskunov, T.A. Ryabchikova, H. C. Stempels, W. W. Weiss, Astron. Astrophys. Suppl., 138, 119 (1999).
- [22] R. Kurucz, I. Furenlid, J. Brault, L. Testerman, National Solar Observatory Atlas, Sunspot, New Mexico: National Solar Observatory (1984).
- [23] J. E. Lawler, A. Guzman, M. P. Wood, C. Sneden, J. J. Cowan, Astrophys. J. Suppl., 205, 11 (2013).
- [24] L. Mashonkina, T. Gehren, J.R. Shi, A. J. Korn, F. Grupp, Astron. Astrophys., 528, A87 (2011).
- [25] L. Mashonkina, P. Jablonka, T. Sitnova, Y. Pakhomov, P. North, Astron. Astrophys., 608, A89 (2017).
- [26] L. Mashonkina, T. Sitnova, S. A. Yakovleva, A. K. Belyaev, Astron. Astrophys., 631, A43 (2019).
- [27] J. C. Pickering, A. P. Thorne, R. Perez, Astrophys. J. Suppl. Ser., 132, 403 (2001).
- [28] T. Ryabchikova, N. Piskunov, R. L. Kurucz, H. C. Stempels, U. Heiter, Y. Pakhomov, P. S. Barklem, Phys. Scr., 90, 054005 (2015).
- [29] T. M. Sitnova, L. I. Mashonkina, T. A. Ryabchikova, MNRAS, 461, 1000 (2016).
- [30] T. M. Sitnova, Astron. Letters, 42, 734 (2016).
- [31] T. M. Sitnova, L. I. Mashonkina, R. Ezzeddine, A. Frebel, MNRAS, 485, 3527 (2019).
- [32] W. Steenbock, H. Holweger, Astron. Astrophys., 130, 319 (1984).
- [33] Y. Takeda, PASJ, 46, 53 (1994).
- [34] V. Tsymbal, T. Ryabchikova, T. Sitnova, Software for NLTE Spectrum Fitting. pp 247–252 (2019).