Multi-Epoch VLBI of L Dwarf Binary 2MASS J0746+2000AB: Precise Mass Measurements and Confirmation of Radio Emission from Both Components
Abstract
Surveys have shown that up to one tenth of all ultracool dwarfs (UCDs) are appreciable radio emitters, with their emission attributed to a combination of gyrosynchrotron radiation and the electron cyclotron maser instability (ECMI). 2M J0746+2000AB is a close stellar binary comprised of an L0 and L1.5 dwarf that was previously identified as a source of 5 GHz radio emission. We used very-long-baseline interferometry (VLBI) to precisely track the radio emission over seven epochs in 2010–2017, and found both components to be radio emitters—the first such system identified—with the secondary component as the dominant source of emission in all epochs. The previously identified 2.07 h periodic bursts were confirmed to originate from the secondary component, although an isolated burst was also identified from the primary component. We additionally fitted the VLBI absolute astrometric positions jointly with existing relative orbital astrometry derived from optical/IR observations with Markov-chain Monte Carlo (MCMC) methods to determine the orbital parameters of the two components. We found the masses of the primary and secondary optical components to be and , respectively, representing the most precise mass estimates of any UCDs to date. Finally, we place a upper limit of 0.9 au on the mass and separation of planets orbiting either of the two components.
The Astrophysical Journal (preprint; accepted 2020 May 6)
1 Introduction
At the bottom of the stellar mass distribution sit the ultracool dwarfs (UCDs), a class of stellar and substellar objects typically defined by a spectral type of M7 or later (Kirkpatrick et al., 1997). Their evolutionary pathways are largely set by their initial mass, with those above a minimum stellar mass threshold of 0.07 entering the main sequence as stable hydrogen-burning stars, and those below the threshold becoming deuterium-burning brown dwarfs, which more rapidly fade and cool after radiating away their formation energy (e.g., Kumar, 1963; Hayashi & Nakano, 1963; Saumon & Marley, 2008; Baraffe et al., 2015; Dupuy & Liu, 2017).
Evolutionary models have been developed to describe both low mass stars and brown dwarfs, and can be tested and refined through observation of nearby objects (e.g., Burrows et al., 1997; Chabrier et al., 2000; Saumon & Marley, 2008). A near degeneracy in the the evolutionary tracks of UCDs hinders constraints on their mass or age from their temperature and luminosity, as is typically possible with more massive stars. Mass-luminosity-metallicity relationships have been developed for UCDs (e.g., Mann et al., 2019), but are calibrated by a limited number of sources with well-constrained masses, which, unlike luminosity and metallicity, cannot be readily measured for isolated objects.
Close binary systems are well-suited as model calibrators due to their measurable orbits which provide their dynamical masses, and their presumed co-evolution which eliminates age as a confounding factor between the components. 2M J0746+2000 is a nearby spectral class L source cataloged by the Two Micron All Sky Survey (2MASS; Skrutskie et al., 2006) that was resolved to be a close binary system comprised of an L0 primary component (2M J0746+2000A) and an L1.5 secondary component (2M J0746+2000B) by a Hubble Space Telescope (HST) survey of L dwarfs (Reid et al., 2001). Bouy et al. (2004) provided additional relative astrometric observations, extending the observational baseline to four years, and found, through model fitting of the relative orbit, a system mass of ( bounds)—the first dynamical mass measurement of an L dwarf system. Konopacky et al. (2010) further extended the baseline to eight years with relative astrometry from HST and ground-based adaptive optics imagery, and found a system mass of .
The actual individual masses of the components, however, require the absolute orbits in an inertial frame, which can be established through radial velocity measurements or absolute astrometry. Konopacky et al. (2010) performed radial velocity observations of the two components, but were prevented from meaningfully constraining the relative masses by the low precision of the measured velocities, especially as they sampled a portion of the orbit with low relative radial velocities. Absolute astrometry of resolved optical/IR imagery, meanwhile, is hindered by the limited availability of fixed, extragalactic reference sources ideally used to anchor astrometry to an inertial frame, due the relatively restrictive field of view provided by adaptive optics, and to a lesser extent, HST. Calibration to faint field stars can introduce significant systematic errors, particularly if only a small number are available, although the recent availability of high precision field star astrometry (Gaia Collaboration et al., 2018) substantially mitigates these errors when at least a few such field stars are available, as is typically true for HST imagery (e.g., Bedin & Fontanive, 2018).
Adaptive optics, on the other hand, may not provide any calibrated field stars. As one workaround, Cardoso (2012) used point spread function (PSF) fitting of unresolved wide field images with large numbers of well-calibrated field stars, informed by higher precision relative astrometry provided by adaptive optics, to precisely constrain the absolute orbit and individual masses of the T dwarf binary Indi B, which were were later refined by similar methods (e.g., Dieterich et al., 2018). Harris et al. (2015) and Dupuy & Liu (2017) later applied an equivalent method to 2M J0746+2000AB, fitting the absolute motion of the system’s photocenter in wide field imagery jointly with higher precision relative astrometry. The latter paper found individual masses of and for 2M J0746+2000A and B, respectively—far superior to the precision possible with radial velocity measurements. Uncertainties were now constrained at this point by the relative optical variability of the components, systematic biases in proper motion and parallax of the field stars, and the comparatively poor resolution of the wide field imagery that requires a large number of observations to overcome.
By happenstance, the 2M J0746+2000 system is also one of a small fraction (10%; Route & Wolszczan, 2016; Pineda et al., 2017) of ultracool dwarfs detected in radio surveys to date (Antonova et al., 2008; Berger et al., 2009). Radio emission has been detected from objects extending down to spectral type T6.5 (Route & Wolszczan, 2012), including from an object with a possible mass of just 13 (Gagné et al., 2017; Kao et al., 2018). All members of the radio-detected sample have been found to be sources of both quiescent radio emission, typically attributed to gyrosynchrotron emission (Berger, 2002), and sources of periodic pulsed radio emission, consistent with that expected from electron cyclotron maser instability (ECMI; Hallinan et al., 2007, 2008). The latter is a likely manifestation of auroral currents in a large-scale magnetosphere, and can be accompanied by optical and Balmer line periodic variability (Hallinan et al., 2015). The exact electrodynamic engine powering auroral activity in a small fraction of ultracool dwarfs, all of which are rapid rotators, remains uncertain. Possibilities include an orbiting exoplanet (Hallinan et al., 2015; Pineda et al., 2017), analogous to the role played by Io in a component of the Jovian decametric emission (Zarka, 1998) or a breakdown of co-rotation of plasma in the middle magnetosphere, analogous to the role Iogenic plasma plays in generating the main Jovian aurora oval (Schrijver, 2009; Nichols et al., 2012).
2M J0746+2000 presents a particularly curious case. It was detected initially as a radio source by Antonova et al. (2008) and subsequently confirmed to be a pulsing source by Berger et al. (2009). Berger et al. (2009) also observed periodic H emission from the combined system with the same 2.07 h period seen in the radio. Using spatially unresolved archival measurements of the binary, and assuming the rotation axis to be orthogonal to the orbital plane, Berger et al. (2009) attributed the 2.07 h period to 2M J0746+2000A’s rotation and argued that its radius must therefore be 30% smaller than expected from theoretical models. However, individual measurements of each component (Konopacky et al., 2012) together with the 3.3 h period measured from spatially unresolved broadband optical photometry—attributed to the rotation period of the non-radio component—later established that 2M J0746+2000B is likely the dominant radio-emitting source, and that the radii of both components are therefore consistent with theoretical expectations (Harding et al., 2013a). The fact that the secondary appears to produce both radio emission and H emission, as implied by the shared 2.07 h period, while the primary is dominates the broadband optical variability, is unexpected. Harding et al. (2013b) showed that most radio-detected ultracool dwarfs produce periodic optical variability—attributed to auroral activity—similar to that responsible for periodic pulsing radio emission and periodic H emission (Hallinan et al., 2015). However, the non-radio emitting component in the 2M J0746+2000 system was the one detected as the dominant source of optical variability. One possibility is that the optical variability of the non-radio emitting component is due to inhomogeneities in its atmosphere, as has been observed for a sample of L and T dwarfs (Bailer-Jones & Mundt, 2001; Gelino et al., 2002; Maiti et al., 2005; Littlefair et al., 2008; Harding et al., 2013a). Harding et al. (2013b) suggested that the non-radio emitting component (likely 2M J0746+2000A) may also be a radio emitter, albeit at lower flux densities than detectable to date.
Importantly, the radio emission enables the use of very-long-baseline interferometry (VLBI) to precisely pinpoint the emission source relative to extragalactic references sources that are, for all practical purposes, fixed in inertial reference frames. VLBI can isolate the emission to individual components of the binary, and trace their absolute motion in the sky with extremely high precision. Dupuy et al. (2016) previously employed such a method to obtain absolute astrometry, and subsequently constrain the orbits and individual masses of the pre-main sequence LSPM J1314+1320AB system whose secondary component was found to be radio-emitting.
2M J0746+2000AB presents an opportunity to similarly investigate an older system with components much closer to the minimum stellar mass threshold. In this manuscript, we present 5 GHz VLBI observations of 2M J0746+2000AB from seven epochs spanning seven years. We locate and discuss the properties of sources of emission matching the expected motion of the two components. We then jointly fit their positions together with previously published relative astrometry reduced by Dupuy & Liu (2017) and Bouy et al. (2004) to tightly constrain the absolute motion of 2M J0746+2000A and B and determine their individual dynamical masses. We discuss our observations in the context of earlier observations, and establish limits on the presence of planets in the system set by the astrometric residuals.
2 Observations
| Epoch | Time (UT) | Time On Target (h) | AntennasaaStation codes (“–” prefixes the codes of excluded VLBA stations and “+” prefixes stations not part of the 10-station VLBA): SC=St. Croix, HN=Hancock, MK=Mauna Kea (VLBA); EF=Effelsberg, MC=Medicina, NT=Noto, WB=Westerbork (EVN); GB=Green Bank |
|---|---|---|---|
| GH009A | 2010 Mar 21 21:12–22 01:58 | 2.73 | VLBA–HN–MK+EF+MC+NT+WB+GB |
| BH181A | 2013 Feb 5 01:35–06:24 | 3.12 | VLBA–SC |
| BH181B | 2013 Sep 20 10:50–15:41 | 3.27 | VLBA |
| BH181C | 2015 Aug 28 12:23–17:09 | 3.44 | VLBA–SC |
| BH181D | 2016 Feb 23 00:08–04:56 | 3.23 | VLBA |
| BH181E | 2016 Aug 28 12:08–16:53 | 3.38 | VLBA–PT–SC |
| BH181F | 2017 Feb 21 00:08–04:54 | 3.29 | VLBA |
Radio observations were conducted of 2M J0746+2000AB with the Very Long Baseline Array (VLBA) and the Green Bank Telescope (GBT) over seven epochs in 2010–2017, as summarized in Table 1. The first epoch (labeled “GH009A”) also incorporates concurrent observations by stations in the European VLBI Network (EVN). The data quality for this particular epoch was poor, and the corresponding astrometry was downweighted by a procedure elaborated in section 4. Due to a recently uncovered long-term problem with phase coherence for GBT, all visibilities involving the dish were flagged for all epochs, significantly reducing the sensitivity relative to original projections. The sensitivity was still sufficient for the primary goal of dynamical mass measurement and the investigation of radio emission from both components. The loss in sensitivity, however, did hinder measurement of the relative position of left and right circularly polarized pulses of radio emission within the magnetosphere of 2M J0746+2000B and the investigation of planetary bodies within the binary system.
Each epoch spans a 5 h period and covers a series of rapid-switching phase-referencing observations alternating between 4 min on the 2M J0746+2000 field and 1 min on the reference source, J0750+1823, 2 away. Eight C band spectral channels were used, covering the frequency range 4.85–5.11 GHz in dual polarization.
Additionally, a compact extragalactic radio source was identified north of 2M J0746+2000AB at International Celestial Reference System (ICRS) R.A. and decl. within the primary beam when targeting 2M J0746+2000. A secondary phase center was requested to correlate the in-beam source in the BH181A–F epochs to correct phase offsets associated with the calibration. However, due to correlator technical issues beyond our control, this data was only collected for BH181B, BH181E, and BH181F, so the in-beam source is unavailable for the other four epochs.
The raw visibility data was initially calibrated with the Astronomical Image Processing System (aips) software package (Greisen, 1990). The calibrated visibilities were subsequently imaged and deconvolved with the clean utility in the Common Astronomy Software Applications (casa) package (Jaeger, 2008).
3 Radio Emission Properties
| Epoch | Component | (07:46:XX) | (mas) | (+20:00:XX) | (mas) | cov (mas2) | Flux (mJy) |
|---|---|---|---|---|---|---|---|
| GH009AaaEpoch downweighted in orbital fit as potential outlier due to suspect calibrationbbPositional uncertainties include a symmetric 0.19 mas (0.13 mas in and ) phase calibration uncertainty | A | 0.042 | |||||
| B | 42.2276733 | 0.160 | 31.330407 | 0.382 | |||
| BH181AbbPositional uncertainties include a symmetric 0.19 mas (0.13 mas in and ) phase calibration uncertainty | A | 0.053 | |||||
| B | 42.1629606 | 0.167 | 31.219139 | 0.381 | |||
| BH181BccPositions corrected with in-beam reference source, but stated uncertainties include a symmetric 0.13 mas (0.09 mas in and ) systematic uncertainty in in-beam source position | A | 42.1491173 | 0.154 | 31.347589 | 0.354 | ||
| B | 42.1553189 | 0.121 | 31.200961 | 0.241 | |||
| BH181CbbPositional uncertainties include a symmetric 0.19 mas (0.13 mas in and ) phase calibration uncertainty | A | 42.0988160 | 0.202 | 31.120543 | 0.591 | ||
| B | 42.1025746 | 0.158 | 31.231021 | 0.328 | |||
| BH181DbbPositional uncertainties include a symmetric 0.19 mas (0.13 mas in and ) phase calibration uncertainty | A | 42.0813946 | 0.183 | 31.104002 | 0.447 | ||
| B | 42.0801643 | 0.149 | 31.224959 | 0.244 | |||
| BH181EccPositions corrected with in-beam reference source, but stated uncertainties include a symmetric 0.13 mas (0.09 mas in and ) systematic uncertainty in in-beam source position | A | 42.0777828 | 0.167 | 31.073825 | 0.628 | ddMay be underestimated due to suspect calibration in several bands distributing flux into one or more secondary peaks. | |
| B | 42.0715563 | 0.174 | 31.167184 | 0.667 | ddMay be underestimated due to suspect calibration in several bands distributing flux into one or more secondary peaks. | ||
| BH181FccPositions corrected with in-beam reference source, but stated uncertainties include a symmetric 0.13 mas (0.09 mas in and ) systematic uncertainty in in-beam source position | A | 42.0599523 | 0.171 | 31.082929 | 0.462 | ||
| B | 42.0499620 | 0.109 | 31.135131 | 0.219 |
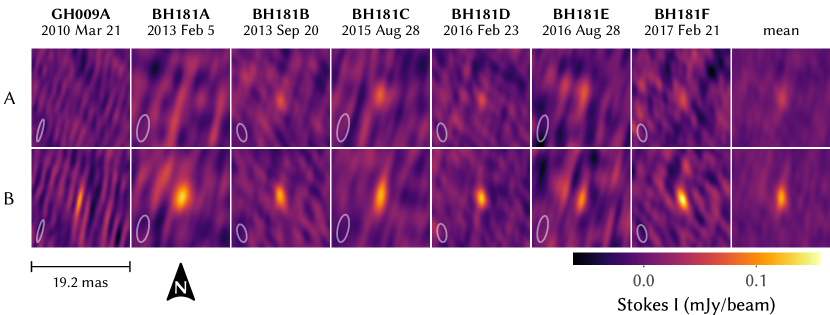
Only a single clear source was initially identified near the predicted optical/IR position of the 2M J0746+2000 system in images of each of the epochs. The motion of this source is consistent with the optical/IR motion of the B component providing the first direction confirmation of this component as the main contributor of radio emission from the binary, and confirming the conclusions reached by Konopacky et al. (2012) and Harding et al. (2013a).
The corresponding position of the A component at each epoch was then identified using the previously published relative orbits. Figure 1 presents images centered on the expected A component positions and corresponding B component sources, showing a weak but clear signal at the expected A component position in all but the first two epochs. Neither source is clearly distinguishable from a point source in any of the images.
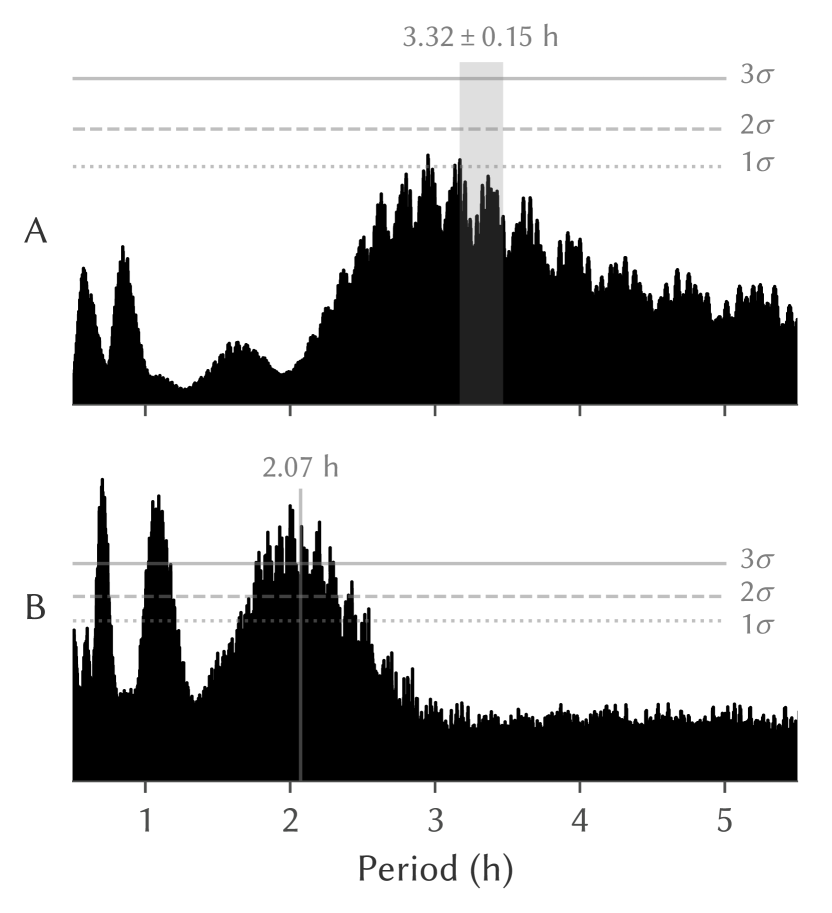
Lomb–Scargle periodograms (Lomb, 1976; Scargle, 1982) were used to analyze periodicity in the radio emission of both radio sources. Figure 2 shows periodograms computed from the flux at 2 s intervals at the best fit positions across all epochs where each source was detected. The , , and false alarm probability levels, conservatively estimated by the method of Baluev (2008), are included for reference, and represent the likelihood the maximum power exceeds these levels if the data series were normally distributed.
The rotation period of the A component was previously attributed to a rotation period of h by Harding et al. (2013a), therefore leading to the conclusion that the h radio bursts found by Berger et al. (2009) originate from the B component. The periodograms are consistent with this conclusion, and show a 3 peak near a 2 h period from the B source and a weak peak at 3 h from the A source at just over the false alarm probability level. Additionally, both sources show higher order harmonics at reciprocal integer fractions of their respective periods, reflecting the non-sinusoidal variation in the radio emission, such as from bursts.
As the signal-to-noise ratio (SNR) of the period data is much lower than that of Harding et al. (2013a) and Berger et al. (2009), we cannot further constrain the rotation periods of the components to better precision, and so do not attempt to rigorously model the periodicity. However, we can very crudely estimate the periods and their uncertainties as the simple mean and standard deviation of the period derived from the three strongest harmonics of each source (first, fourth, and fifth for A; first, second and third for B), and find h and h for the A and B sources, respectively, which is consistent with the published values.
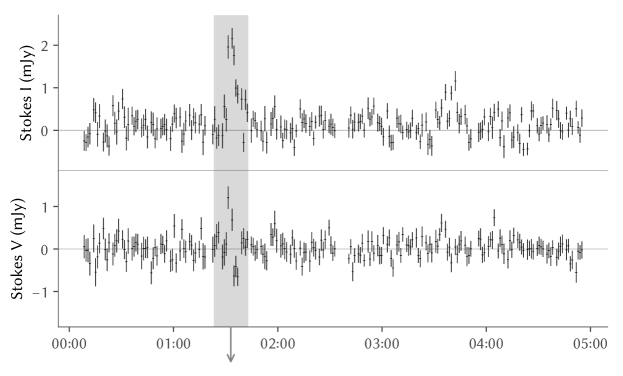
In contrast to the observations of Berger et al. (2009), no bursts exceeding 10 mJy were detected in any of the seven epochs. This high degree of variability of the luminosity of the periodic pulsed emission has been previously reported for radio detected ultracool dwarfs (Hallinan et al., 2007). Weaker 1 mJy bursts, however, were observed from the B source in all epochs, and generally recurred with a similar 2.1 h period. Figure 3 shows two such bursts in the light curve of the B source over the BH181F epoch, with the first being the strongest burst observed across all epochs. Unlike the 100% circularly polarized bursts observed by Berger et al. (2009), this burst appears to be unpolarized for at least part of the burst. This effect can be explained by two overlapping bursts of opposite polarization, with the left polarized (Stokes ) component lagging the stronger right polarized () component by several minutes. Similar behavior was previously observed from this system by Lynch et al. (2015).
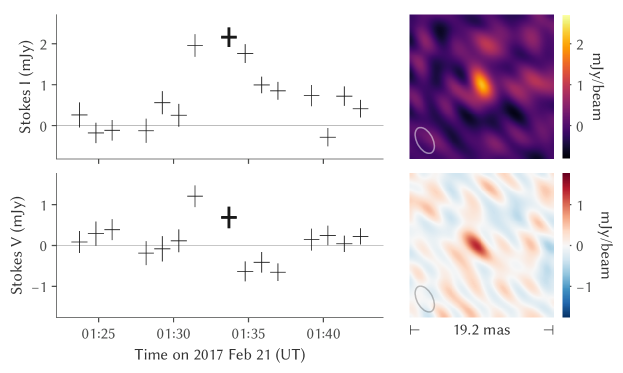
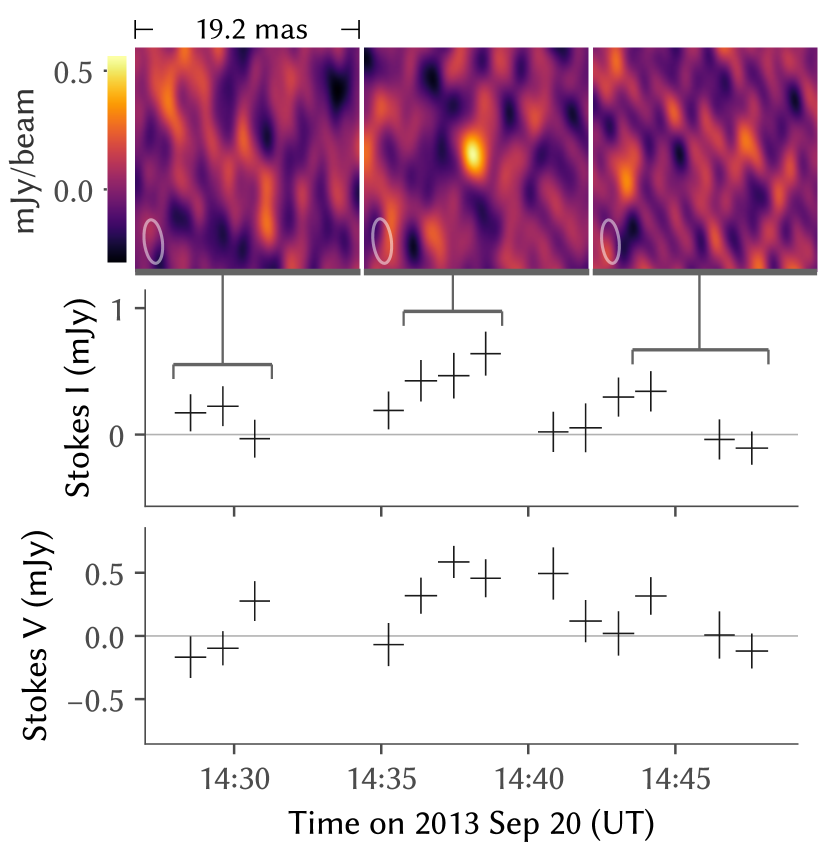
Additionally, a single 0.5 mJy right polarized burst was observed from the A source in the BH181B epoch. A light curve of this event, together with images created at the indicated times, are presented in Figure 4. Similar images made from the data 3.0–3.5 h earlier in the same epoch—one A component rotation period earlier—revealed no clear signal, and no additional bursts were discerned in any of the other epochs.
3.1 Implications of Radio Emission from Both Components
2M J0746+2000AB is now only the second radio emitting UCD binary system investigated with VLBI, after the M7 binary LSPM J1314+1240AB (Dupuy et al., 2016), and is the first identified to have two radio emitting components. Our observed C band luminosities for both 2M J0746+2000A and B is comparable to that observed from the other radio-emitting L dwarfs, and higher than that observed from T dwarfs (Pineda et al., 2017), and the radio emission from both components would individually have been detected by surveys had they been spatially separated. Only 10% of surveyed UCDs have been detected as radio emitters (Route & Wolszczan, 2016). If the presence or absence of radio emission were independent between binary components, the probability that at least one of the two observed systems would have two radio emitters would only be 20%. While not statistically significant by typical thresholds, this result motivates speculation on the possible correlation of radio emission presence between the individual components of multiple UCD systems.
In assessing such a correlation, we note that in each of the two observed systems, the binary components are similar in mass and can be reasonably assumed to have formed at the same time. The absence of a sample of objects with known mass or age prevents a robust assessment of a correlation between these properties and the presence of radio emission. However, a correlation has been shown with (McLean et al., 2012), with evidence for a sharp rise in the detection fraction at km s-1 (Pineda et al., 2017), corresponding to a 3.1 h rotation period for inclinations close to . We note an additional bias towards detection for inclinations significantly larger than (Pineda et al., 2017). We further note that both components of 2M J0746+2000 are rapid rotators, with rotation periods of 3.3 h and 2.07 h, for the A and B components, respectively, while the rotation axes of both components are aligned to within of the orbital pole, as consistent with many binary formation pathways (Harding et al., 2013a).
The detection of both components is therefore not surprising, given the increased detection fraction for rapid rotators. Under the assumption of coevality and formation via fragmentation of a molecular cloud core, similar mass components in a tight binary are expected to have similar rotational velocities, with rotation axes approximately aligned with the rotation axis of the cloud core (Batel, 1997). Konopacky et al. (2012) showed that a number of UCD binaries, including 2M J0746+2000AB, have somewhat discrepant rotational velocities, with the secondary rotating somewhat faster than the primary. Nonetheless, there remains a strong correlation between the rotation rates of binary components. VLBI investigation of the components of the remaining confirmed radio emitting UCD binaries LP 349-25 (Phan-Bao et al., 2007) and 2M J1315-2649 (Burgasser et al., 2012) is therefore warranted, with the optical light curve of the former suggesting possible radio emission contribution from both of its components (Harding et al., 2013a).
Finally, we note that magnetic field interaction between the binary components is unlikely to be responsible for the observed radiation. A 5 GHz gyrofrequency, as observed with 2M J0746+2000AB, occurs in a magnetic field strength of 2 kG. We can then model the system as a pair of dipole magnetic fields, scaled from an optimistic 10 kG surface field at a radius of 1 , with electrons supplied by an interstellar medium with electron density 1 cm-3. Using the plasma interaction model of Zarka (2007), the flux radiated by electrons accelerated by the pair’s interacting dipolar magnetic fields would be 1 nJy on Earth—far below that of the observed signal and the detection threshold.
4 Orbital Fitting
| Time (UT) | Polarization | (07:46:XX) | (mas) | (+20:00:XX) | (mas) | cov (mas2) | Flux (mJy) |
|---|---|---|---|---|---|---|---|
| A component burst in BH181B (Figure 4) | |||||||
| 2013 Sep 20 14:36–14:39 | RR | 42.1491356 | 0.153 | 31.347923 | 0.354 | ||
| 10:50–15:41aaex-burst: full epoch, excluding data included in burst astrometry | I | 42.1491155 | 0.157 | 31.347490 | 0.372 | ||
| B component burst in BH181F (Figure 3) | |||||||
| 2017 Feb 21 01:33–01:37 | LL | 42.0499569 | 0.208 | 31.135461 | 0.274 | ||
| 01:31–01:35 | RR | 42.0499620 | 0.195 | 31.134938 | 0.246 | ||
| 00:08–04:54aaex-burst: full epoch, excluding data included in burst astrometry | I | 42.0499637 | 0.115 | 31.135117 | 0.249 | ||
The position of both radio sources were astrometrically fitted in the integrated image of each epoch in which they are detected. Fitting was performed with a 2D Gaussian function with dimensions and orientation matching that of the restoring beam determined by casa. Fit uncertainties were estimated using the correlated noise formulas Condon (1997) as applied by casa’s imfit utility.
The positions of the in-beam source was similarly determined in the three epochs for which it was available. Subtracting the fit uncertainty from the root mean square (rms) variation of the fitted positions in quadrature leaves an estimated phase calibration error of mas, treated as symmetric in R.A. and decl. This was then added in quadrature to the fit uncertainties of the target radio sources for the four epochs where the in-beam source is not available.
The position of the in-beam source is taken to be the mean of the three fitted positions, with an assumed symmetric uncertainty 0.13 mas derived from the rms. The displacement of the in-beam source position from the mean at each of the three epochs—attributed to an offset error of the phase calibration at 2M J0746+2000—was added to the corresponding fitted target source position, with the in-beam position uncertainty added in quadrature. The in-beam uncertainty also introduces a covariance between in-beam corrected positions equal to the square of the in-beam uncertainty, 0.017 mas2. This correlation does not appreciably affect the final solution as the covariance is dwarfed by the square of the R.A. and decl. uncertainties added in quadrature, so is excluded for computational simplicity. The final corrected positions and uncertainties of the components in all seven epochs with respect to the International Celestial Reference Frame (ICRF) are given in Table 2.
Additionally, the dominant A component burst in the BH181B epoch and B component burst in BH181F each peak at a signal-to-noise ratio (SNR) comparable to the SNR of the source integrated over the full epoch, so astrometric positions can be measured for each burst individually to a precision comparable with that measured for the full epoch. As the bursts are polarized, SNR and thus astrometric precision are further improved by separately fitting the RR and LL signal. A physical separation of two polarized components of each burst on the order of the stellar radii (40 as) may theoretically be present, reflecting the separation of emission from the two magnetic poles. We neglect this physical separation in our analysis as its scale is far below the resolution of our astrometry.
Finally, the bursts contribute a minute fraction of the total flux recorded for the respective sources and epochs. We can therefore create a copy of the full epoch data with the bursts removed and measure an additional “ex-burst” position, which will have a precision only slight worse than that obtained with the full epoch. Errors in the burst and ex-burst positions are correlated by the 0.13 mas uncertainty of the in-beam source position used to calibrate the astrometry of BH181B and BH181F, which is similar to the correlation between the corresponding full epoch astrometry and handled in an identical manner. The in-beam source corrected burst and ex-burst astrometry are given in Table 3, and used in place of the full epoch BH181B A component and BH181F B component positions Table 2 for the orbit fitting procedure that follows.
| Time (UT) | Separation (mas) | Pos. Angle () | Ref. |
|---|---|---|---|
| 2000 Apr 15.34 | (1) | ||
| 2002 Feb 7.41 | (2) | ||
| 2002 Oct 21.97 | (1) | ||
| 2003 Mar 22.06 | (2) | ||
| 2003 Dec 4.64 | (2) | ||
| 2004 Jan 9.79 | (2) | ||
| 2007 Dec 1.62 | aaOffset from published values by , with a recently corrected implementation of the Yelda et al. (2010) NIRC2 calibration (Bowler et al., 2018). | (1) | |
| 2007 Dec 1.63 | aaOffset from published values by , with a recently corrected implementation of the Yelda et al. (2010) NIRC2 calibration (Bowler et al., 2018). | (1) | |
| 2008 Dec 18.48 | aaOffset from published values by , with a recently corrected implementation of the Yelda et al. (2010) NIRC2 calibration (Bowler et al., 2018). | (1) | |
| 2008 Dec 18.50 | aaOffset from published values by , with a recently corrected implementation of the Yelda et al. (2010) NIRC2 calibration (Bowler et al., 2018). | (1) |
| Relative Optical/IR + Absolute VLBI | Absolute VLBI Only | ||||||
|---|---|---|---|---|---|---|---|
| Parameter | Median aa uncertainties from the 15.866 and 84.134 percentiles of MCMC samples | Intervalbb2.275 and 97.725 percentiles of MCMC samples | Best Fit | Median aa uncertainties from the 15.866 and 84.134 percentiles of MCMC samples | Intervalbb2.275 and 97.725 percentiles of MCMC samples | Best Fit | Prior |
| Fitted Parameters | |||||||
| orbital period (yr) | 12.726, 12.741 | 12.733 | 12.66, 13.14 | 12.85 | |||
| semi-major axis (mas) | 237.04, 237.39 | 237.21 | 236.1, 242.7 | 238.4 | |||
| eccentricity | 0.48422, 0.48535 | 0.48479 | 0.4818, 0.4956 | 0.4872 | 1, | ||
| inclination () | 138.236, 138.480 | 138.36 | 137.62, 138.63 | 138.24 | , | ||
| pos. angle of asc. node () | 29.21, 29.68 | 29.44 | 29.00, 30.01 | 29.56 | 1 | ||
| arg. of periastron () | 355.63, 356.26 | 355.93 | 355.47, 356.42 | 355.89 | 1 | ||
| periastron time (2015 Jul XX) | 23.2, 25.3 | 24.2 | 21.4, 25.4 | 22.9 | 1 | ||
| A/B mass ratio | 1.044, 1.059 | 1.052 | 1.042, 1.061 | 1.054 | |||
| R.A. at J2010.0 (07:46:XX)ccICRS reference position and motion of the system barycenter | 42.243441, 42.243526 | 42.243483 | 42.243389, 42.243510 | 42.243463 | 1 | ||
| decl. at J2010.0 (+20:00:XX)ccICRS reference position and motion of the system barycenter | 31.4911, 31.4932 | 31.4921 | 31.4911, 31.4936 | 31.4926 | , | ||
| R.A. proper motion (mas yr-1)ccICRS reference position and motion of the system barycenter | , | , | 1 | ||||
| decl. proper motion (mas yr-1)ccICRS reference position and motion of the system barycenter | , | , | 1 | ||||
| parallax (mas) | 80.80, 81.13 | 80.96 | 80.85, 81.21 | 81.02 | |||
| Derived Properties | |||||||
| distance (pc) | 12.326, 12.377 | 12.352 | 12.313, 12.368 | 12.342 | |||
| semi-major axis (au) | 2.9237, 2.9364 | 2.9301 | 2.915, 2.993 | 2.942 | |||
| periastron distance (au) | 1.5039, 1.5116 | 1.5096 | 1.499, 1.519 | 1.508 | |||
| apoastron distance (au) | 4.341, 4.360 | 4.351 | 4.321, 4.476 | 4.375 | |||
| total mass () | 0.1541, 0.1562 | 0.1552 | 0.1521, 0.1573 | 0.1543 | |||
| primary (A) mass () | 0.07885, 0.08022 | 0.07955 | 0.0780, 0.0806 | 0.0792 | |||
| secondary (B) mass () | 0.07512, 0.07611 | 0.07561 | 0.0740, 0.0768 | 0.0751 | |||
4.1 Model Fitting
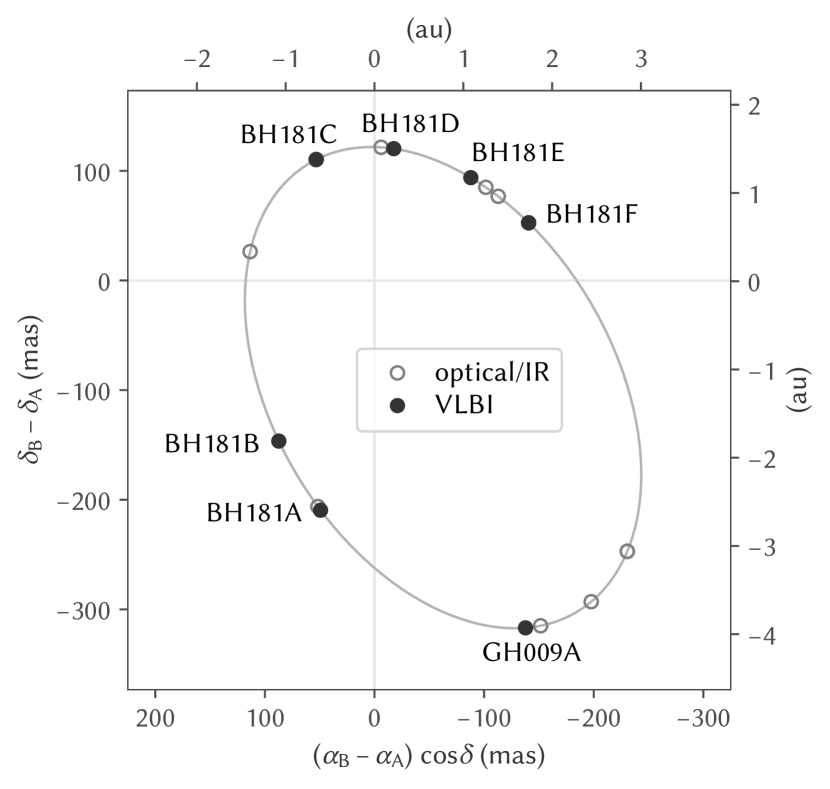
We constructed a two-body model of 2M J0746+2000A and B as gravitational point sources, with the system barycenter moving linearly with respect to the solar system. The model takes the six Keplerian orbital elements, the component mass ratio (A/B), as well as the position and proper motion of the system barycenter, and generates predictions for the position of B relative to A at each of the relative astrometry epochs in Table 4, and for the absolute positions of A and B at each of the seven VLBI epochs. The relative astrometry observations used are identical to those used by Dupuy & Liu (2017) in their joint photocenter analysis, and similarly excludes one epoch (2003 February 18) from Bouy et al. (2004) as an outlier, and a second epoch (2006 November 27) from Konopacky et al. (2010) for which the imagery was not publicly available for re-analysis. Orbital coverage by the optical/IR and VLBI observations is shown in Figure 5.
The model predictions are then compared with the actual observed values at each epoch to produce a likelihood. We consider astrometric uncertainty as normally distributed for all epochs except GH009A, and independent between epochs, other than the correlation between the in-beam corrected observations discussed earlier. Separation and position angle in the relative astrometry observations are treated as independent, while R.A. and decl. in the VLBI astrometry are treated as correlated by the computed covariance values.
The GH009A observation is downweighted by modeling its astrometric uncertainty as a 2D function whose radial cross sections are 1D Cauchy functions, with a error ellipse set by the stated uncertainties and covariance. This function was selected to be similar to a 2D normal distribution, should this observation be consistent with the others, while mitigating the observation’s impact as an outlier otherwise, since the Cauchy function has much heavier tails and thus penalizes solutions with outliers to a lesser degree than the normal distribution does.
We additionally note that calibration errors in the BH181E epoch appear to have redistributed part of the flux for each of the A and B sources into a secondary peak offset 5 mas east of the measured primary peak in a subset of bands, likely causing the reported flux in Table 2 to be an underestimate. Unlike GH009A, BH181E is surrounded by other, better calibrated epochs which already tightly constrain the source positions at BH181E. These surrounding observations are consistent only with the sources being located at the primary peaks. We therefore treat the measured primary peak positions as the properly calibrated source positions.
We found that an initial fit of the VLBI astrometry showed it to be systematically offset by 1′′ to the southwest from the near IR photocenter trajectory from Dupuy & Liu (2017). As the VLBI astrometry agrees with the J2015.5 position from the Gaia DR2 data archive (Gaia Collaboration et al., 2018), we believe the offset to be an error in the absolute astrometric calibration used by Dupuy & Liu (2017) whose analysis largely depended only on accurate astrometry relative to the background stars (T. J. Dupuy, private communication). We did not include the photocenter astrometry in our fit, and the observed shift was only used to inform an initial guess of the best fit parameters.
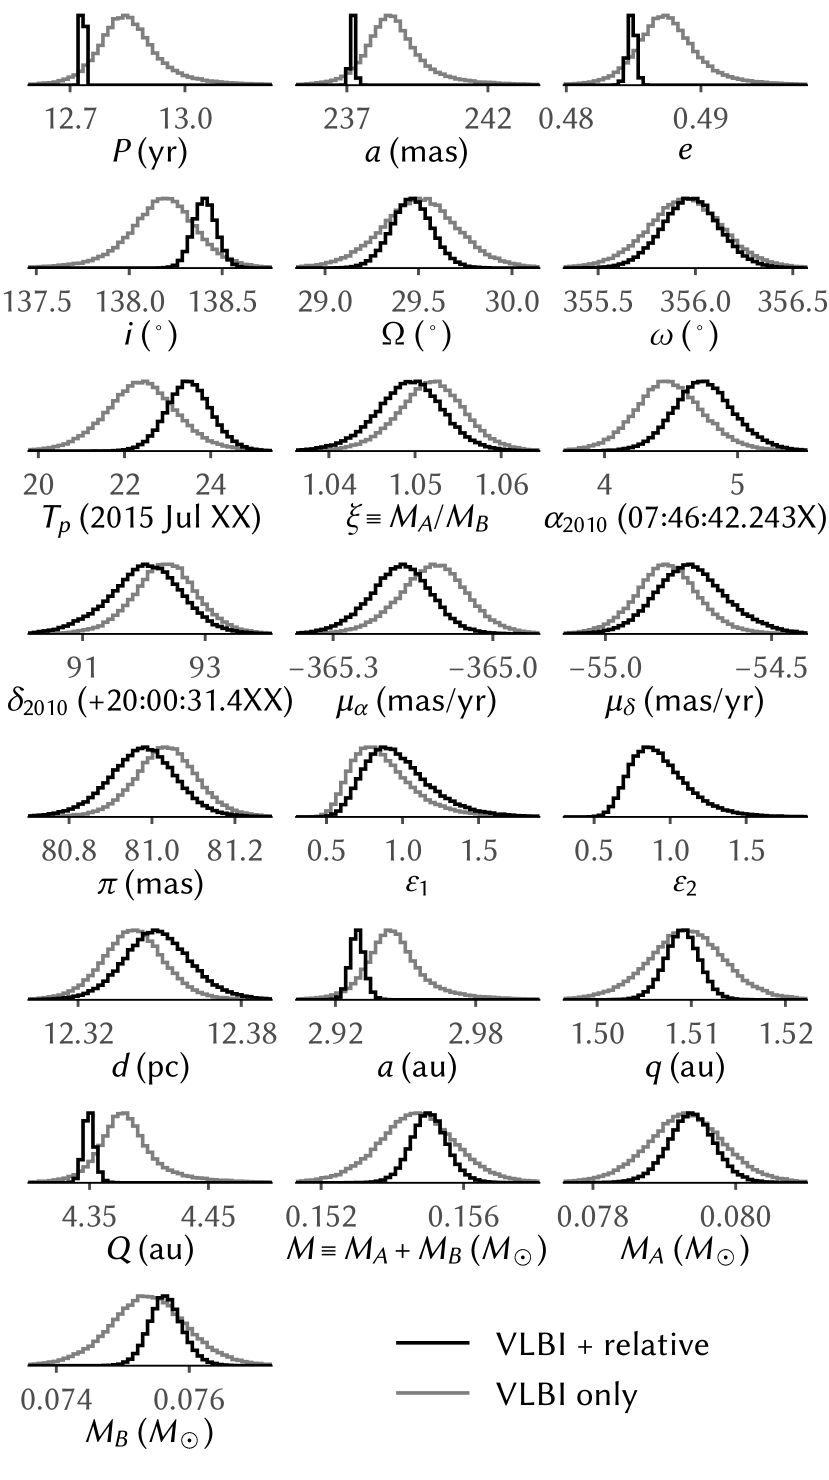
The emcee package (version 2.2.1; Foreman-Mackey et al., 2013) was then used to explore the parameter space through Markov-chain Monte Carlo sampling. First, the fit of Dupuy & Liu (2017) was used to locate a best fit solution maximizing the posterior function. One hundred walkers were then started with initial parameters concentrated in a tight ball surrounding this best fit with independent standard deviations one tenth the uncertainty stated by Dupuy & Liu (2017). The walkers appeared to reach a steady state after 1000 steps, and both these first 1000 steps and the following 1000 steps were discarded to ensure the thoroughness of the burn-in. The next 100 000 steps were then taken, with the parameters of every walker at every 100 step recorded as an MCMC sample, collectively representing the posterior distribution. Priors were selected to be isotropic in orientation (angles, restricted in range or wrapped as appropriate), uniform in time (periastron time) and volume (parallax), and log-uniform for other parameters bounded only to positive values. Characteristic statistics of this sample are presented for each of the fitted parameters in Table 5 along with the corresponding priors. Statistics for several related properties derived from the fitted parameters are also computed from the sample and included in the table. Histograms showing all of these parameters and derived properties are presented in Figure 6.
With the extensive observation arc provided by the combined optical/IR and VLBI astrometry, all of the Keplerian orbital elements are tightly constrained to a relative precision of 0.1% or better. The fitted mass ratio confirms that the primary A component is slightly more massive than the secondary B component. The total dynamical mass of 2M J0746+2000AB is calculated from these parameters to be , split between the primary and secondary. These fitted values are consistent with the bounds for the same properties determined by Dupuy & Liu (2017) with near IR photocenter astrometry.
4.2 Residuals Analysis
Astrometric residuals to the fitted two-body model can indicate or constrain the presence of additional unseen planets gravitationally perturbing the system. Forbrich et al. (2016) used the absence of systematic residuals in the corresponding LSPM 1314+1320AB data to constrain the size and orbit of planets in that system. Here, we present a similar analysis for 2M J0746+2000AB.
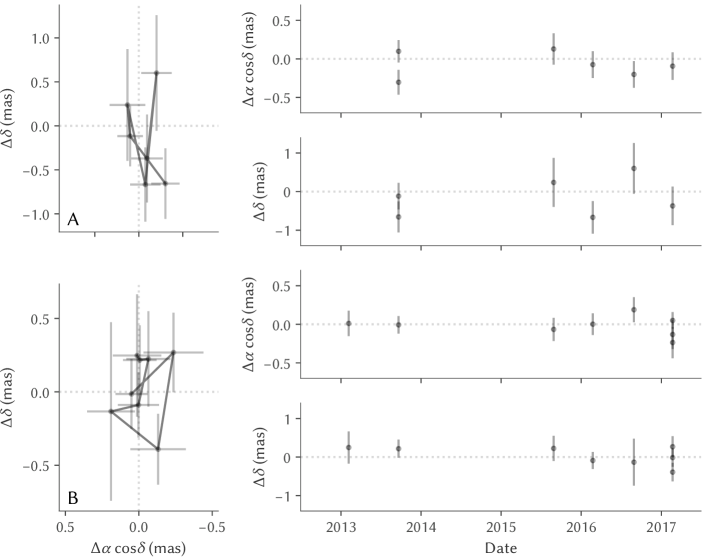
Figure 7 compares the VLBI astrometry of 2M J0746+2000AB against the positions predicted by the best fit solution at the corresponding epochs. The GH009A observation, which had been downweighted as a possible outlier, was confirmed to be one by its large residuals of mas in R.A. and mas in decl. The rms of the residuals of the remaining observations is 0.14 mas in the R.A. direction and 0.36 mas in the decl. direction, which is consistent with the mas and mas expected from the formal astrometric uncertainties. For further validation, a separate orbital solution was computed with the additional free parameters and scaling the formal astrometric uncertainties of the VLBI and relative optical/IR astrometry, respectively. The fitted factors and are, again, consistent with the formal astrometric uncertainties.
The absence of clear and systematic deviations from the assumed two-body model constrains the mass and orbit size of planets orbiting either of the two components by the reflex motion a planet would impart on its parent. For a planet of mass orbiting a star of mass at a distance , this reflex motion would have an amplitude . The 2D rms of 0.27 mas places a bound of au on the reflex motion, corresponding to au for a planet orbiting either the A or B component. The presence of circumbinary planets cannot yet be effectively constrained, and require further VLBI observations to extend the observation arc beyond one orbital period.
5 Conclusions
VLBI observations of the L dwarf binary system 2M J0746+2000AB conducted at seven epochs over 2010–2017 reveal both components to be radio emitters, with the B component responsible for the bulk of the emission at 5 GHz frequency. Circularly polarized burst emission—a characteristic of the ECMI mechanism—was observed from both sources, with the 2.07 h periodic bursts identified by Berger et al. (2009) confirmed to originate from the B component. A weak 3 h periodic signal was also detected from the A component, a value broadly consistent with the 3.3 h optical periodicity measured by Harding et al. (2013a).
This result marks the first instance of a UCD system observed with multiple radio emitting components. 2M J0746+2000AB is, moreover, only the second multiple UCD system probed with VLBI after the M7 binary LSPM J1314+1320AB, in which Dupuy et al. (2016) observed only a single radio emitter. With 10% of UCDs being appreciable radio sources, this finding hints at the possibility of a positive correlation in the presence of radio emission between the components of a multiple UCD system. VLBI investigation of additional radio emitting UCD systems will be necessary to robustly constrain any such correlation.
Additionally, VLBI astrometry anchors the system’s relative orbit to an inertial reference frame, enabling a precise measurement of the mass ratio of the two components, and thus, their individual masses. Jointly fitting the VLBI astrometry with previously published relative optical/IR astrometry gives masses and for the A and B components, respectively, suggesting that both components likely exceed the minimum stellar mass threshold. These measurements represent the most precise individual mass estimates of UCDs to date, which follows from the high spatial resolution of VLBI imagery together with a combined observation arc extending nearly two decades—well over an orbital period. Residuals of the best fit orbital solution are broadly consistent with formal astrometric uncertainties, placing a bound of au on the mass and semi-major axis of planets orbiting either component.
References
- Antonova et al. (2008) Antonova, A., Doyle, J., Hallinan, G., Bourke, S., & Golden, A. 2008, A&A, 487, 317
- Astropy Collaboration et al. (2013) Astropy Collaboration, Robitaille, T. P., Tollerud, E. J., et al. 2013, A&A, 558, A33
- Bailer-Jones & Mundt (2001) Bailer-Jones, C., & Mundt, R. 2001, A&A, 367, 218
- Baluev (2008) Baluev, R. V. 2008, MNRAS, 385, 1279
- Baraffe et al. (2015) Baraffe, I., Homeier, D., Allard, F., & Chabrier, G. 2015, A&A, 577, A42
- Batel (1997) Batel, M. R. 1997, MNRAS, 285, 16
- Bedin & Fontanive (2018) Bedin, L., & Fontanive, C. 2018, MNRAS, 481, 5339
- Berger (2002) Berger, E. 2002, ApJ, 572, 503
- Berger et al. (2009) Berger, E., Rutledge, R., Phan-Bao, N., et al. 2009, ApJ, 695, 310
- Bouy et al. (2004) Bouy, H., Duchêne, G., Köhler, R., et al. 2004, A&A, 423, 341
- Bowler et al. (2018) Bowler, B. P., Dupuy, T. J., Endl, M., et al. 2018, AJ, 155, 159
- Burgasser et al. (2012) Burgasser, A. J., Melis, C., Zauderer, B. A., & Berger, E. 2012, ApJL, 762, L3
- Burrows et al. (1997) Burrows, A., Marley, M., Hubbard, W. B., et al. 1997, ApJ, 491, 856
- Cardoso (2012) Cardoso, C. V. V. 2012, PhD thesis, University of Exeter
- Chabrier et al. (2000) Chabrier, G., Baraffe, I., Allard, F., & Hauschildt, P. 2000, ApJ, 542, 464
- Condon (1997) Condon, J. 1997, PASP, 109, 166
- Deller et al. (2011) Deller, A., Brisken, W. F., Phillips, C., et al. 2011, PASP, 123, 275
- Dieterich et al. (2018) Dieterich, S. B., Weinberger, A. J., Boss, A. P., et al. 2018, ApJ, 865, 28
- Dupuy et al. (2016) Dupuy, T. J., Forbrich, J., Rizzuto, A., et al. 2016, ApJ, 827, 23
- Dupuy & Liu (2017) Dupuy, T. J., & Liu, M. C. 2017, ApJS, 231, 15
- Forbrich et al. (2016) Forbrich, J., Dupuy, T. J., Reid, M. J., et al. 2016, ApJ, 827, 22
- Foreman-Mackey (2016) Foreman-Mackey, D. 2016, JOSS, 24
- Foreman-Mackey et al. (2013) Foreman-Mackey, D., Hogg, D. W., Lang, D., & Goodman, J. 2013, PASP, 125, 306
- Gagné et al. (2017) Gagné, J., Faherty, J. K., Burgasser, A. J., et al. 2017, ApJL, 841, L1
- Gaia Collaboration et al. (2018) Gaia Collaboration, Brown, A., Vallenari, A., et al. 2018, A&A, 616, A1
- Gelino et al. (2002) Gelino, C. R., Marley, M. S., Holtzman, J. A., Ackerman, A. S., & Lodders, K. 2002, ApJ, 577, 433
- Greisen (1990) Greisen, E. 1990, in Acquisition, Processing and Archiving of Astronomical Images, 125–142
- Hallinan et al. (2008) Hallinan, G., Antonova, A., Doyle, J., et al. 2008, ApJ, 684, 644
- Hallinan et al. (2007) Hallinan, G., Bourke, S., Lane, C., et al. 2007, ApJL, 663, L25
- Hallinan et al. (2015) Hallinan, G., Littlefair, S., Cotter, G., et al. 2015, Natur, 523, 568
- Harding et al. (2013a) Harding, L. K., Hallinan, G., Boyle, R. P., et al. 2013a, ApJ, 779, 101
- Harding et al. (2013b) Harding, L. K., Hallinan, G., Konopacky, Q. M., et al. 2013b, A&A, 554, A113
- Harris et al. (2015) Harris, H. C., Dahn, C. C., & Dupuy, T. J. 2015, in Proc. of Lowell Observatory, 18th Cambridge Workshop on Cool Stars, Stellar Systems, and the Sun, Vol. 18 (Flagstaff, AZ: Lowell Observatory), 413–418
- Hayashi & Nakano (1963) Hayashi, C., & Nakano, T. 1963, PThPh, 30, 460
- Hunter (2007) Hunter, J. D. 2007, Comput. Sci. Eng., 9, 90
- Jaeger (2008) Jaeger, S. 2008, in Astronomical Data Analysis Software and Systems XVII, Vol. 394, 623
- Kao et al. (2018) Kao, M. M., Hallinan, G., Pineda, J. S., Stevenson, D., & Burgasser, A. 2018, ApJS, 237, 25
- Kirkpatrick et al. (1997) Kirkpatrick, J. D., Henry, T. J., & Irwin, M. J. 1997, AJ, 113, 1421
- Konopacky et al. (2010) Konopacky, Q., Ghez, A., Barman, T., et al. 2010, ApJ, 711, 1087
- Konopacky et al. (2012) Konopacky, Q., Ghez, A., Fabrycky, D., et al. 2012, ApJ, 750, 79
- Kumar (1963) Kumar, S. S. 1963, ApJ, 137, 1121
- Littlefair et al. (2008) Littlefair, S., Dhillon, V., Marsh, T., et al. 2008, MNRAS, 391, L88
- Lomb (1976) Lomb, N. R. 1976, Ap&SS, 39, 447
- Lynch et al. (2015) Lynch, C., Mutel, R., & Güdel, M. 2015, ApJ, 802, 106
- Maiti et al. (2005) Maiti, M., Sengupta, S., Parihar, P., & Anupama, G. 2005, ApJL, 619, L183
- Mann et al. (2019) Mann, A. W., Dupuy, T., Kraus, A. L., et al. 2019, ApJ, 871, 63
- McLean et al. (2012) McLean, M., Berger, E., & Reiners, A. 2012, ApJ, 746, 23
- Nichols et al. (2012) Nichols, J., Burleigh, M. R., Casewell, S. L., et al. 2012, ApJ, 760, 59
- Phan-Bao et al. (2007) Phan-Bao, N., Osten, R. A., Lim, J., Martín, E. L., & Ho, P. T. 2007, ApJ, 658, 553
- Pineda et al. (2017) Pineda, J. S., Hallinan, G., & Kao, M. M. 2017, ApJ, 846, 75
- Reid et al. (2001) Reid, I. N., Gizis, J. E., Kirkpatrick, J. D., & Koerner, D. 2001, AJ, 121, 489
- Route & Wolszczan (2012) Route, M., & Wolszczan, A. 2012, ApJL, 747, L22
- Route & Wolszczan (2016) —. 2016, ApJL, 821, L21
- Saumon & Marley (2008) Saumon, D., & Marley, M. S. 2008, ApJ, 689, 1327
- Scargle (1982) Scargle, J. D. 1982, ApJ, 263, 835
- Schrijver (2009) Schrijver, C. J. 2009, ApJL, 699, L148
- Skrutskie et al. (2006) Skrutskie, M., Cutri, R., Stiening, R., et al. 2006, AJ, 131, 1163
- van Rossum (1995) van Rossum, G. 1995, Extending and embedding the Python interpreter, Report CS-R9527, Centrum voor Wiskunde en Informatica, Amsterdam, The Netherlands
- Yelda et al. (2010) Yelda, S., Lu, J. R., Ghez, A. M., et al. 2010, ApJ, 725, 331
- Zarka (1998) Zarka, P. 1998, JGR, 103, 20159
- Zarka (2007) —. 2007, P&SS, 55, 598