11email: lsbordon@eso.org 22institutetext: Max Planck Institute for Astronomy, Heidelberg, Königstuhl 17, D-69117 Heidelberg, Germany 33institutetext: Departamento de Ciencias Fisicas, Universidad Andres Bello, Fernandez Concha 700, Las Condes, Santiago, Chile 44institutetext: INAF - Osservatorio Astronomico d’Abruzzo, via Maggini snc, Teramo, Italy 55institutetext: INFN - Sezione di Perugia, via A. Pascoli, Perugia, Italy 66institutetext: GEPI, Observatoire de Paris, Université PSL, CNRS, Place Jules Janssen, 92195 Meudon, France 77institutetext: Departamento de Astronomía, Universidad de Concepción, Casilla 160-C, Concepción, Chile 88institutetext: Facultad de Ingeniería y Ciencias, Universidad Adolfo Ibáñez, Avenida Padre Hurtado 750, Viña del Mar, 2520000, Chile
A wide angle view of the Sagittarius dwarf spheroidal galaxy
We report on the discovery and chemical abundance analysis of the first CEMP-r/s star detected in the Sagittarius dwarf Spheroidal Galaxy, by means of UVES high resolution spectra. The star, found in the outskirts of Sgr dSph, along the main body major axis, is a moderately metal poor giant (=4753 K, =1.75, [Fe/H]=-1.55), with [C/Fe]=1.13 placing it in the so-called “high-carbon band”, and strong s-process and r-process enrichment ([Ba/Fe]=1.4, [Eu/Fe]=1.01). Abundances of 29 elements from C to Dy were obtained. The chemical pattern appears to be best fitted by a scenario where an r-process pollution event pre-enriched the material out of which the star was born as secondary in a binary system whose primary evolved through the AGB phase, providing C and s-process enrichment.
Key Words.:
Galaxy: abundances; Galaxies: individual: Sgr dSph; Galaxies: abundances; Stars: abundances; Stars: chemically peculiar1 Introduction
The Carbon Enhanced Metal-Poor stars (hereafter CEMP) are objects of low metallicity that show a high abundance of C, relative to iron. A thorough historical perspective of carbon enhanced stars is given by Caffau et al. (2018) and we refer the reader to that paper, and references therein for further details. Beers & Christlieb (2005) introduced a classification of the CEMP stars based on their abundances of neutron capture elements, in particular, for what is relevant here, they defined two classes of stars that appear to be enriched in neutron capture elements. They made a distinction whether only the elements produced in the slow neutron capture process (process) or also the nuclei produced in the rapid neutron capture process (process) are enhanced. Taking into account that most Ba isotopes are produced in the process and the vast majority of Eu nuclei are produced in the process, Beers & Christlieb (2005) defined CEMP-s stars as stars that satisfy [C/Fe], [Ba/Fe] , and [Ba/Eu] and CEMP-r/s as stars that satisfy [C/Fe] and [Ba/Eu] . Lucatello et al. (2005) and later Starkenburg et al. (2014) from repeated radial velocity measurements of CEMP stars argued that the binary frequency among CEMP-s stars is compatible with a population composed by 100% of binary stars. Spite et al. (2013) and Bonifacio et al. (2018) pointed out that the CEMP stars have a distinctly bi-modal distribution in carbon abundances A(C)111We adopt the notation for any element X, A(X) = log10(X/H) +12.: stars of the low-carbon band (A(C)) and stars of the high-carbon band (A(C)). The high-carbon band is populated almost exclusively by stars of the classes CEMP-s and CEMP-r/s. Recently Arentsen et al. (2019) revised the binary frequency among CEMP stars and estimated a lower frequency than those of Lucatello et al. (2005) and Starkenburg et al. (2014), yet they confirmed that the binary frequency among stars of the high-carbon band (47%) is much higher than that among those of the low-carbon band (18%). The simplest, and most widely adopted, interpretation of this observational picture is that the high-carbon band stars are the result of mass transfer in a binary system (Abate et al. 2018).
For CEMP-s stars it is straightforward to identify the companion that transferred mass as an Asymptotic Giant Branch (AGB) star, that can produce both the excess carbon and the neutron capture elements (see e.g. Cristallo et al. 2011; Bisterzo et al. 2012; Käppeler et al. 2011, and references therein). The situation for CEMP-r/s stars is less clear, since the neutron densities required for the process and the process differ by at least 10 orders of magnitude (see e.g. Hampel et al. 2016, and references therein), they likely form in different astrophysical sites. One model for explaining CEMP-r/s stars is to assume that the cloud out of which the star was formed had been previously enriched in process elements (see e.g. Bisterzo et al. 2012), by a different source, like a neutron-star merger (Thielemann et al. 2017, Watson et al. 2019), a magnetar (Siegel et al. 2019a) or a Magneto Hydro-Dynamic (MHD) Supernova (Nishimura et al. 2015). Other more contrived scenarios have been proposed and we refer the reader to Hampel et al. (2016) for a concise summary of the relevant literature. Recently, computations have been done to explore nucleosynthesis at intermediate neutron densities, in the range in AGB (Hampel et al. 2016) and Rapidly Accreting White Dwarfs (RAWDs, Denissenkov et al. 2019) to explain the origin of CEMP-r/s stars. The high end of this neutron density regime was originally investigated by Cowan & Rose (1977) to explain the production of 14C and neutrons in red giants, now it is usually referred to as the process.
In this paper we report the discovery and analysis of the first CEMP-r/s star found in the Sgr dSph galaxy. The significance of this discovery is to be able to compare the properties of this particular class of stars to those of the Galactic stars. Such a comparison could give information on how the galactic environment affects, or does not affect, the evolution of these exceptional objects.
2 Observations
The star GIU J190734.24-315102.1 (henceforth J1907) was catalogued as part of the Sgr dSph Wide Angle survey (Giuffrida et al. 2010; Hansen et al. 2018a; Sbordone et al. 2015). In Giuffrida et al. (2010) it was detected as a probable Sgr dSph member from VLT-VIMOS (Le Fèvre et al. 2003) V and I photometry and low-dispersion spectroscopy. Subsequently, it was followed up with FLAMES-GIRAFFE (Pasquini et al. 2000), which allowed to firmly establish it as a high-probability member, and to derive an overall metallicity of [Fe/H] -1.5 (Sbordone et al., in preparation). Finally, together with a group of low-metallicity Sgr dSph member stars, it was re-observed with UVES (Dekker et al. 2000) to obtain high-resolution, high-quality spectra for detailed chemical analysis. The other stars re-observed with UVES-slit together with J1907 have been presented in Hansen et al. (2018a).
Coordinates, photometry, proper motions and atmospheric parameters for J1907 are listed in Table 1. Coordinates and V, I magnitudes come from Giuffrida et al. (2010). J1907 is situated in the easternmost major-axis field described in Giuffrida et al. (2010), Sgr4, roughly 3 degrees away from the center of NGC6715 (M54), which coincides with the center of the Sgr dSph. While its radial velocity differs from the one of NGC6715 (143.06 km/s, Baumgardt et al. 2019) by roughly the amount of the cluster velocity dispersion (10.5 km/s, Harris 1996, 2010 revision), and its metallicity is quite close to the one of the cluster, its distance is vastly larger than the estimated NGC6715 tidal radius (7.5’, Trager et al. 1995), so it is unlikely that the star originated within NGC6715.
This work is mainly based on the analysis of the UVES-slit spectra of J1907, observed in two 3005s exposures starting on 2009-04-25, 07:28:27 and 08:25:22 UT. The spectra were obtained in Dichroic 1 mode, with central wavelengths of 390nm and 580nm in UVES blue and red arm respectively, at a low airmass (1.13 - 1.01). The slit was set to 1.4” on both arms, but seeing conditions were excellent ( 0.45”), thus increasing the resolution to about R=60000. The present analysis is based on science-ready reduced spectra released by ESO222http://archive.eso.org/wdb/wdb/adp/phase3_spectral/form. Coadding the two spectra a S/N80 per sample (1x1 binning) around 630nm is reached.

| GIU J190734.24-315102.1 | |
|---|---|
| RA (J2000) | 19h 07m 34.24s |
| DEC (J2000) | -31deg 51’ 02.05” |
| Mag (V, I) | 17.742, 15.466 |
| Vrad | 155.04 0.35 km/s |
| pm (RA, DEC) | -2.65 0.13, -1.32 0.12 mas/yr |
| 4753 K | |
| 1.75 cm s-2 | |
| Vturb | 1.51 km/s |
| [Fe/H] | -1.55 |
An additional spectrum was obtained on August 21, 2015 (23:22:55 UT) with the MIKE spectrograph at Magellan Clay telescope in Las Campanas observatory, under Chilean time. The single 1200s spectrum covers the 483-916nm range and was taken with the 0.7”x5” slit in mediocre transparency conditions, for the purpose of looking for radial velocity variations, and has S/N15 per sample (2x2 binning) around 650nm.
Radial velocities were determined by cross-correlating the spectra against a synthetic template of similar atmospheric parameters, employing the red arm spectra in the UVES case. The two UVES spectra gave 155.0 and 154.6 km/s, respectively. The MIKE spectra yield 155.3 km/s. As a consequence, there is no evidence that the star shows significant radial velocity variations. In Table 1 the weighted mean of the three measurements is given as reference. The radial velocity is compatible with a membership with Sgr. Bellazzini et al. (2008) derives a radial velocity for the core of Sgr dSph (up to 9’ from the center) of 141 km/s, with a dispersion of roughly 10 km/s. Majewski et al. (2013), covering larger distances from the center (up to about 2.5 degrees) detect a significant increase in velocity dispersion with increasing distance from the galaxy core, more pronounced for the more metal poor population. J1907 is even farther away from the Sgr dSph center, at the extreme of the covered range along the galaxy major axis, and its velocity is well compatible with the other Sgr dSph members observed in the same field (Sbordone et al., 2020, in prep.). Proper motions, as derived from Gaia DR2, also confirm a membership in Sgr dSph: J1907 shows =-2.654,-1.323 (RA, DEC, mas/year), versus a Sgr dSph average of -2.692,-1.359 (Gaia Collaboration et al. 2018). Since Sgr dSph proper motions are very tightly clustered, J1907 can be considered a bona fide member of Sgr dSph.
3 Parameters determination and abundance analysis
Stellar parameters (listed in Table 1) were determined spectroscopically by means of the MyGIsFOS automated abundance analysis code (Sbordone et al. 2014). The employed grid of synthetic spectra was the same used in Sbordone et al. (2015), and was based on ATLAS12 1D-LTE atmospheric models and SYNTHE synthetic spectra (Kurucz 2005; Sbordone et al. 2004; Sbordone 2005; Castelli 2005). The input list of features passed to MyGIsFOS was also used in Sbordone et al. (2015), but the code may have kept a different subset of them. Due to the high C abundance, and because MyGIsFOS is not designed to derive precise abundances for elements strongly deviating from a solar-scaled composition (see Sbordone et al. 2014, for details), a number of abundances (C, N, O, plus n-capture elements) were derived fitting relevant features manually.
| Wavelength | lower e. | [X/Fe] | |
|---|---|---|---|
| (nm) | (eV) | ||
| Sr ii | |||
| 4077.714 | 0.000 | 0.15 | 0.47 |
| Y ii | |||
| 485.4867 | 0.992 | -0.380 | 0.55 |
| 488.3684 | 1.083 | 0.070 | 0.45 |
| 520.5731 | 1.032 | -0.340 | 0.40 |
| Zr i | |||
| 535.0851 | 2.322 | -0.590 | 0.95 |
| Zr ii | |||
| 496.2310 | 0.971 | -2.000 | 0.90 |
| Ba ii | |||
| 585.3686 | 0.604 | -2.066 | 1.40 |
| La ii | |||
| 4970.383 | 0.321 | -1.683 | 1.30 |
| 4986.765 | 0.173 | -2.300 | 1.25 |
| 5259.380 | 0.173 | -1.950 | 1.30 |
| Ce i | |||
| 524.9605 | 0.410 | -0.630 | 1.40 |
| Ce ii | |||
| 488.2463 | 1.527 | 0.190 | 1.30 |
| 489.3952 | 1.326 | -0.538 | 1.30 |
| 491.4924 | 0.879 | -0.810 | 1.15 |
| 518.7458 | 1.211 | 0.170 | 1.30 |
| 523.7067 | 1.319 | -0.620 | 1.30 |
| Pr ii | |||
| 525.9614 | 0.633 | -3.727 | 1.30 |
| 532.2710 | 0.482 | -1.878 | 1.20 |
| 538.1260 | 0.508 | -0.461 | 1.20 |
| Nd ii | |||
| 406.1080 | 0.471 | 0.550 | 1.30 |
| 485.9030 | 0.320 | -0.440 | 1.50 |
| 487.6110 | 0.559 | -1.230 | 1.30 |
| 488.2880 | 0.742 | -1.410 | 1.20 |
| 494.2960 | 0.742 | -1.130 | 1.30 |
| 516.7920 | 0.559 | -1.180 | 1.30 |
| 517.6780 | 1.120 | -0.840 | 1.30 |
| 518.1169 | 0.859 | -0.600 | 1.17 |
| 525.5510 | 0.204 | -0.670 | 1.50 |
| Sm ii | |||
| 4913.260 | 0.659 | -0.93 | 1.28 |
| 4948.630 | 0.543 | -0.95 | 1.30 |
| 4952.370 | 0.333 | -1.25 | 1.06 |
| Gd ii | |||
| 517.6290 | 1.059 | -0.710 | 1.15 |
| Dy ii | |||
| 516.9690 | 0.100 | -1.950 | 1.20 |
Abundances for Na i, Mg i, Si i, Ca i, Sc ii, Ti i, Ti ii, Cr i, Mn i, Fe i, Fe ii, Co i, Ni i, and Zn i were obtained by MyGIsFOS. Features for C i, N i, O i, and Eu ii were fitted by means of FitProfile (Thygesen et al. 2016). All the remaining abundances were derived using MOOG (Sneden 1973, version 2014).
Table 2 lists the features used for the abundances measured with MOOG. Following Appendix A of Sbordone et al. (2015), details of the synthetic fits for all the lines measured by MyGIsFOS are made available online. Given the close affinity between MyGIsFOS and FitProfile, the lines fitted with the latter have been included as well.
-
•
Carbon, Nitrogen and Oxygen: The carbon abundance was derived by fitting the CH G-band. From the range between 422.9 nm and 423.2 nm, we also derived 12C/13C. The nitrogen abundance was derived by fitting four CN features around 648nm, accounting for the C and O abundances in the synthesis. The oxygen abundance was derived from the 630nm [O i] line. The blue wing of the line is marginally affected by a telluric line that does not compromise the fit, as it has been verified by means of Molecfit (Smette et al. 2015; Kausch et al. 2015).
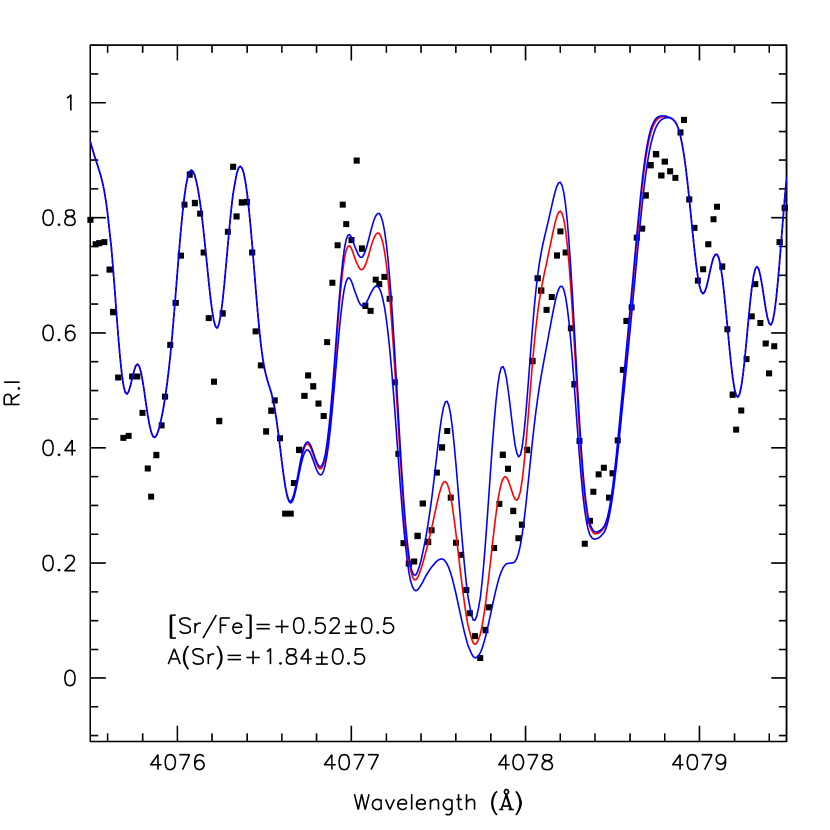
Figure 3: Fit of the 407.77 nm Sr ii feature: The best fit, A(Sr)=1.840.5 is represented by the red curve, while the two blue lines represent models corresponding to 0.5 dex. -
•
Strontium: the only viable Sr ii line in the spectrum is at 407.77 nm, and is extremely strong, to the point that it exceeds saturation and enters the damping part of the curve of growth. However, the wings are strongly blended. A manual fit, shown in Fig. 3, allows to derive the abundance quoted here, but we do not trust the estimate to better than 0.5 dex (the abundance difference of the two fits plotted around the best one in Fig. 3).
-
•
Europium: three Eu ii lines were analyzed in J1907, for all we adopted the Lawler et al. (2001) atomic data, hyperfine and isotopic splitting. The bluest, at 412.960 nm, is heavily saturated and strongly blended. It provides a tentative fit at [Eu/Fe]=+0.7. The 643.764 nm line is much weaker but provides an excellent fit at [Eu/Fe]=+0.97. This line is blended with a potentially problematic Si i line at 643.770nm. Jacobson & Friel (2013) derived an astrophysical of -2.3 for this line. In our linelist the transition is included with a higher (-2.053), but even so, due to the low metallicity of the star, the line is extremely weak and does not affect the Eu line. The 664.506 nm line, finally is one of the most frequently used to determine Eu abundances, and appear isolated and well fitted, giving [Eu/Fe]=+1.08. Due to the high uncertainty on Eu ii 412.960nm, we rejected that line and used the transitions at 643 and 664 nm only.
| Ion | Nlin | A(X)⊙ | A(X) | [X/H] | [X/Fe] | ||
|---|---|---|---|---|---|---|---|
| C i | 1 | 8.50 | 8.08 | -0.42 | 0.17 | 1.13 | 0.24 |
| N i | 4 | 7.86 | 6.82 | -1.04 | 0.21 | 0.51 | 0.26 |
| O i | 1 | 8.76 | 7.61 | -1.15 | 0.17 | 0.40 | 0.24 |
| Na i | 1 | 6.30 | 4.37 | -1.93 | 0.17 | -0.38 | 0.24 |
| Mg i | 1 | 7.54 | 6.28 | -1.26 | 0.17 | 0.29 | 0.24 |
| Si i | 2 | 7.52 | 6.12 | -1.40 | 0.08 | 0.15 | 0.18 |
| Ca i | 9 | 6.33 | 5.09 | -1.24 | 0.16 | 0.32 | 0.23 |
| Sc ii | 7 | 3.10 | 1.70 | -1.40 | 0.16 | 0.15 | 0.23 |
| Ti i | 6 | 4.90 | 3.60 | -1.30 | 0.18 | 0.25 | 0.24 |
| Ti ii | 3 | 4.90 | 3.44 | -1.46 | 0.48 | 0.09 | 0.51 |
| Cr i | 4 | 5.64 | 4.04 | -1.60 | 0.23 | -0.05 | 0.28 |
| Mn i | 6 | 5.37 | 3.62 | -1.75 | 0.50 | -0.19 | 0.52 |
| Fe i | 51 | 7.52 | 5.97 | -1.55 | 0.17 | – | – |
| Fe ii | 10 | 7.52 | 5.97 | -1.55 | 0.16 | – | – |
| Co i | 1 | 4.92 | 3.19 | -1.73 | 0.17 | -0.18 | 0.24 |
| Ni i | 2 | 6.23 | 4.67 | -1.56 | 0.22 | -0.01 | 0.28 |
| Zn i | 1 | 4.62 | 3.87 | -0.75 | 0.17 | 0.80 | 0.24 |
| Sr ii | 1 | 2.92 | 1.84 | -1.08 | 0.50 | 0.47 | 0.52 |
| Y ii | 3 | 2.21 | 1.13 | -1.08 | – | 0.47 | 0.08 |
| Zr i | 1 | 2.58 | 1.95 | -0.63 | 0.17 | 0.95 | 0.24 |
| Zr ii | 1 | 2.58 | 1.95 | -0.63 | 0.17 | 0.90 | 0.23 |
| Ba ii | 1 | 2.18 | 2.03 | -0.15 | 0.17 | 1.40 | 0.23 |
| La ii | 3 | 1.10 | 0.83 | -0.27 | 0.17 | 1.28 | 0.23 |
| Ce i | 1 | 1.58 | 1.32 | -0.26 | 0.17 | 1.40 | 0.24 |
| Ce ii | 5 | 1.58 | 1.32 | -0.26 | – | 1.27 | 0.06 |
| Pr ii | 3 | 0.72 | 0.40 | -0.32 | – | 1.23 | 0.06 |
| Nd ii | 9 | 1.42 | 1.19 | -0.23 | – | 1.32 | 0.11 |
| Sm ii | 3 | 1.00 | 0.66 | -0.34 | 0.13 | 1.21 | 0.20 |
| Eu ii | 2 | 0.52 | 0.00 | -0.52 | 0.08 | 1.03 | 0.17 |
| Gd ii | 1 | 1.07 | 0.67 | -0.40 | 0.17 | 1.15 | 0.23 |
| Dy ii | 1 | 1.10 | 0.75 | -0.35 | 0.17 | 1.20 | 0.23 |

In Table 3 the final abundances are listed, together with the assumed solar abundances and [X/H] and [X/Fe] ratios. This set of solar abundances is that of Caffau et al. (2011) or Lodders et al. (2009) for all elements not present in Caffau et al. (2011). Where multiple lines were used, the “” columns list the dispersion around the average for [X/H], and the propagation accounting for the [Fe i/H] or [Fe ii/H] (for the [O i] 630.03nm line, and ionized species) dispersion for the [X/Fe] values. Together with the abundances listed in Table 3, we also derived a carbon isotopic ratio of 12C/13C=12.
The 12C/13C ratio is generally of difficult interpretation in CEMP-s and -r/s, where carbon enhancement is believed to be due to mass accretion of heavily C-enhanced ejecta from an AGB primary. AGB ejecta are believed to be very rich in 12C (the models used in this work have 12C/13C comprised between 800 and 7600), while observed ratios in CEMP-s and -r/s are much lower (see Bisterzo et al. 2011, where values compiled from 50 stars span values of 412C/13C90). This is due to the dilution of the AGB ejecta within the secundary convective envelope, which is less rich in 12C. However, a quantitative prediction is complicated by the unknown degree of dilution, the variations in 13C abundance depending on the secundary evolutionary stage, and the generally uncertain theoretical preditions on said 13C abundances, where extra-mixing seems to be required to fit observations (Busso et al. 2010).
4 Discussion
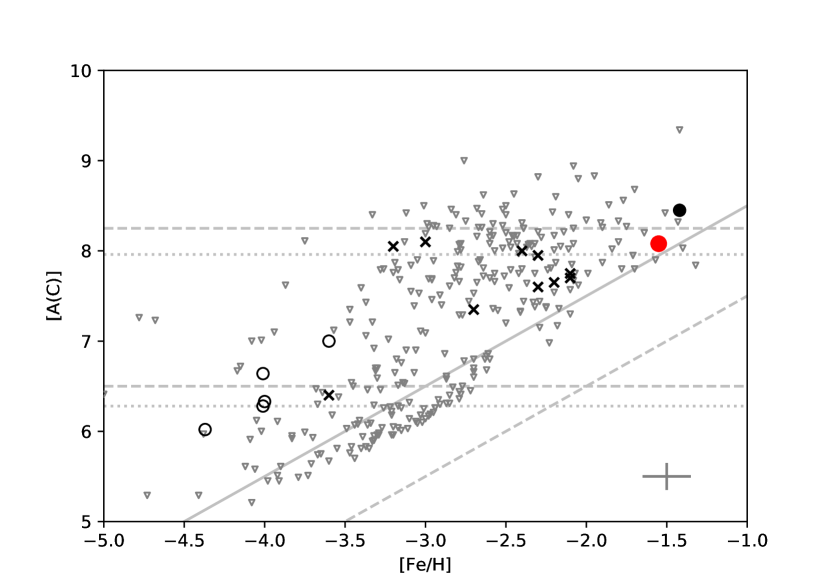
In Fig. 1 we plot [/Fe] vs. [Fe/H] for J1907 , together with literature MW samples, other Sgr dSph stars, and mean values for globular clusters associated with Sgr dSph. In this respect, J1907 behaves as a typical member of the metal poor population that dominates the outskirts of Sgr dSph: the very low [/Fe], and high [Fe/H], observed in the central part of the galaxy (Sbordone et al. 2007; Tolstoy et al. 2009; McWilliam et al. 2013; Hasselquist et al. 2017) give way to higher levels of -enhancement, with Sgr dSph being indistinguishable from the MW halo for metallicity below [Fe/H]-2 (Sbordone et al. 2015).

However, the abundances of J1907 allow to classify it as a typical CEMP-r/s (or CEMP-i) star, and to the best of our knowledge it is the first star of this kind identified in Sgr dSph.
The carbon abundance of J1907, plotted in Fig. 2 and 4, places it firmly in the “high-carbon band” defined by Spite et al. (2013) and Bonifacio et al. (2018) or the “Group I” defined by Yoon et al. (2016).
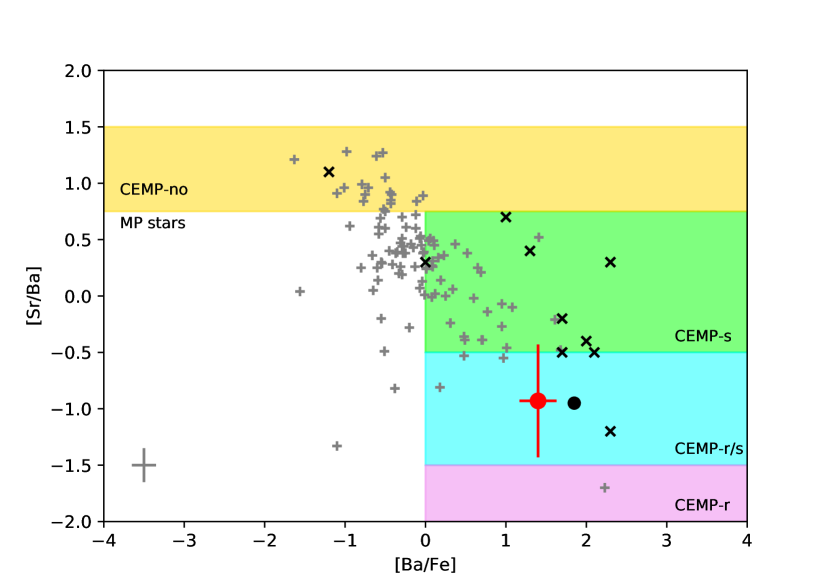
Its [Sr/Ba] ratio also supports a CEMP-r/s classification according to Hansen et al. (2019) (see Fig. 5), and the same is true according to the Beers & Christlieb (2005) classification scheme, with an [Eu/Fe]=+1.03, and consequently [Ba/Eu]=+0.37. Every measured element with atomic number 39 (Y) shows enhancements close to, or exceeding 1 dex with respect to iron ([X/Fe]).
In Fig. 6 we plot [Dy/Ba] and [Dy/Eu] against metallicity. Dysprosium abundances are rare in the literature. Out of the stars with n-capture enhancement (CEMP-r, -s, -rs) analyzed or collected from literature in Allen et al. (2012) a total of 19 have Dy abundances. To these we added 21 stars extracted from the SAGA database (Suda et al. 2011), and originally published in Jonsell et al. (2006), Behara et al. (2010), Cui et al. (2013), Placco et al. (2013), Roederer et al. (2014), Hansen et al. (2015), Hollek et al. (2015), Placco et al. (2015), Jorissen et al. (2016), Gull et al. (2018). It is common in the literature to study the [La/Eu] ratios of those stars to determine their relative s-process and/or r-process enrichments (see, e.g., Roederer et al. 2010). In order to perform such classification, we can alternatively use dysprosium surface abundances. In the left panel of Fig. 6 it clearly emerges that CEMP-s stars have the lowest [Dy/Ba] values (and CEMP-r stars the highest ones). Moreover, we can further refine such analysis by comparing dysprosium and europium, which are both typical r-process elements (85% and 95% of their solar abundances, respectively; see Prantzos et al. 2020). Thus, the expected [Dy/Eu] spread between different classes of CEMP stars should be lower, as demonstrated in the right panel of Fig. 6. Both Fig. 4 and 6 do not show signs that the n-capture nucleosynthesis that affected J1907 is remarkably different from the one in stars belonging to the Milky Way.
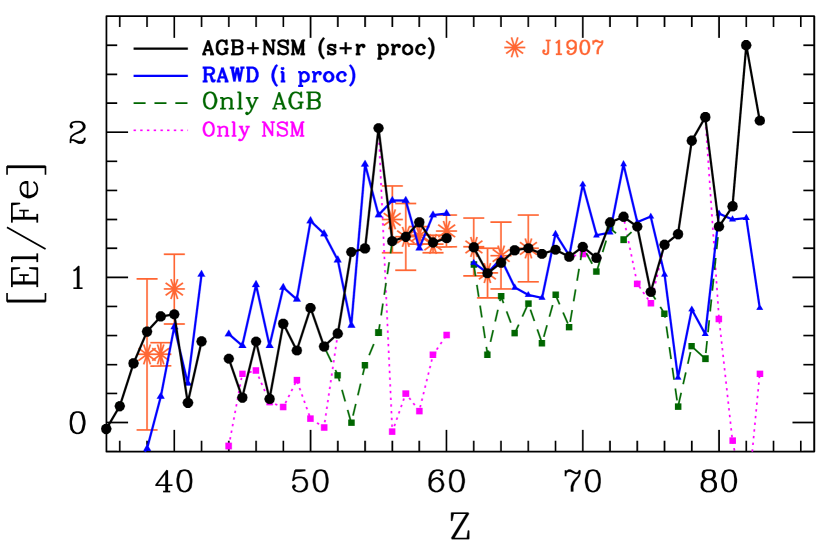
In Fig. 7 we compare the abundance pattern in J1907 with a number of theoretical enrichment yields. In particular, we explore two completely different nucleosynthesis paths: a case with contributions from the slow and the rapid neutron capture processes (s-process and r-process; for reviews see Straniero et al. 2006 and Cowan et al. 2019) and a case characterized by the i-process only. In Fig. 7 we report different models:
-
1.
Magenta dotted curve: a Neutron Star Merger (NSM) final surface element distribution (derived from element yields obtained using the SKYNET code with =0.1; Lippuner & Roberts 2017), normalized to the J1907 europium overabundance, which is assumed as a representative element for the r-process.
-
2.
Dashed green curve: final surface element distribution of a low-mass low-metallicity AGB star (M=2 M⊙, [Fe/H]=-1.67; Cristallo et al. 2015), normalized to the J1907 lanthanum overabundance, which is assumed as a representative element for the s-process.
-
3.
Dark solid curve: a combination of item 1 and 2, in which we assigned to each element the maximum abundance between the NSM and the AGB curves. Such a scenario sees in fact a pollution from two different sources: an AGB star providing the s-process enrichment and a NSM supplying elements typical of the r-process. Such an hypothesis has been largely explored in the past (Bisterzo et al. 2010, 2011, 2012).
-
4.
Blue solid curve: i-process nucleosynthesis resulting from Rapidly Accreting White Dwarfs (Denissenkov et al. 2019) with [Fe/H]=-1.55, normalized to the J1907 europium overabundance.
Interpretation of the observed abundance pattern of J1907 is not straightforward, as it is often the case for CEMP-r/s stars.
Before proceeding with such analysis, however, some important caveats have to raised.

Starting from AGB stars, it is worth to highlight that we find negligible variations by changing the metallicity (from [Fe/H]=-1.67 to [Fe/H]=-1.18, the nearest more metal-rich model available on the FRUITY database333http://fruity.oa-abruzzo.inaf.it/; Cristallo et al. 2015) or the initial mass (1.5M/M3.0). This is proven by Figure 8, where FRUITY models for different masses and metallicities are reported. Distributions with label ”norm” have been normalized to the lanthanum abundance of J1907. Models with initial masses between 2 M⊙ and 3 M⊙ show almost the same distribution: this is due to the fact that, at these metallicities, both the light-s (ls elements: Sr-Y-Zr) and heavy-s (hs elements: Ba-La-Ce-Pr-Nd) elements are saturated. The only appreciable variations are found for lead, which has not been measured in our star (see later in the text). It has to be stressed that the 1.3 M⊙ and the 4.0 M⊙ models are unable to attain the enrichment level of heavy-s elements found in J1907. While for the 1.3 M⊙ a slight increase in the mixing efficiency could solve the problem, the situation for the 4.0 M⊙ (and for more massive models) is different. In fact, a larger production of heavy elements would be compensated by a worsen fit to light-s elements. Thus, we can reasonably exclude massive AGBs from the polluters of J1907.
The high carbon content in a relatively metal rich star, the placement on the high-carbon-band, and the strong overabundance of s-process elements all point to J1907 having been affected by mass transfer from an AGB companion. The star does not show straightforward radial velocity variations, but the limited coverage and precision makes this merely an “absence of evidence”. The high Eu, Gd, and Dy abundances, however, are incompatible with an s-process-only source for neutron-capture elements.
As for other CEMP-r/s stars, the abundances of Eu, Gd, and Dy can be explained with a pre-enrichment of the gas from which J1907 was formed. We hypothesize that such an enrichment comes from a NSM. The infrared re-brightening of the electromagnetic transient AT2017gfo (Pian et al. 2017), following the
gravitational waves event GW170817 (Abbott et al. 2017), proved that NSM events are characterized by a rich r-process nucleosynthesis (Watson et al. 2019)
. A key parameter in those simulations is the electron-to-baryon ratio, the so-called Ye. Depending on its initial value, completely different final distributions can be obtained (for a recent review see Cowan et al. 2019). In our simulation we adopt a low Ye, needed to develop a full nucleosynthesis up to the third r-process peak. For the sake of clarity, it has to be noted that different components have been identified in a single NSM event, each of them marked by a different Ye. Moreover, additional r-process polluters have been suggested, as magneto-rotationally-driven SuperNovae (Nishimura et al. 2017) or magnetars (Siegel et al. 2019b): these stellar environments may in fact provide heavy element distributions similar to a NSM. A detailed comparison between those nucleosynthetic events is beyond the scope of our paper. We based our choice on the only (up-to-date) proven source for the r-process nucleosynthesis and thus we assume that a NSM event provided the r-process component of J1907.
An alternative explanation to a combined pollution from the s-process and the r-process may come from the i-process. Such a process is thought to originate from the sudden mixing of hydrogen to very hot layers (Cowan & Rose 1977).
One of the most uncertain ingredients characterizing i-process calculations is the stellar site hosting such a process. Up to date, three hypotheses have been explored with stellar evolutionary models:
-
1.
proton ingestions at the beginning of the thermally pulsing AGB phase of very low-metallicity low-mass stars: this process appears remote for J1907, due to its relatively high metallicity, which prevents the convective protons to be mixed in He-rich layers (see Cristallo et al. 2016 for details; see also Stancliffe et al. 2011 and Herwig et al. 2014 for very-low metallicity 3D hydrodynamical simulations). It has to be stressed that moderately metal-rich stars have been fitted with i-process calculations (Roederer et al. 2016; Koch et al. 2019). However, these papers presented network calculations only, without clearly identifying the stellar site hosting such a process.
-
2.
proton ingestions at the end of the thermally pulsing AGB phase (the so-called Very Late Thermal Pulse): this process has been proposed to explain the peculiar nucleosynthesis of Sakurai’s object (Herwig et al. 2011). However, available calculations are for solar metallicity only.
-
3.
RAWDs, which are able to simultaneously produce both s-process elements (as lanthanum) and r-process elements (as europium): simulations for these events are available at different metallicities (Denissenkov et al. 2019).
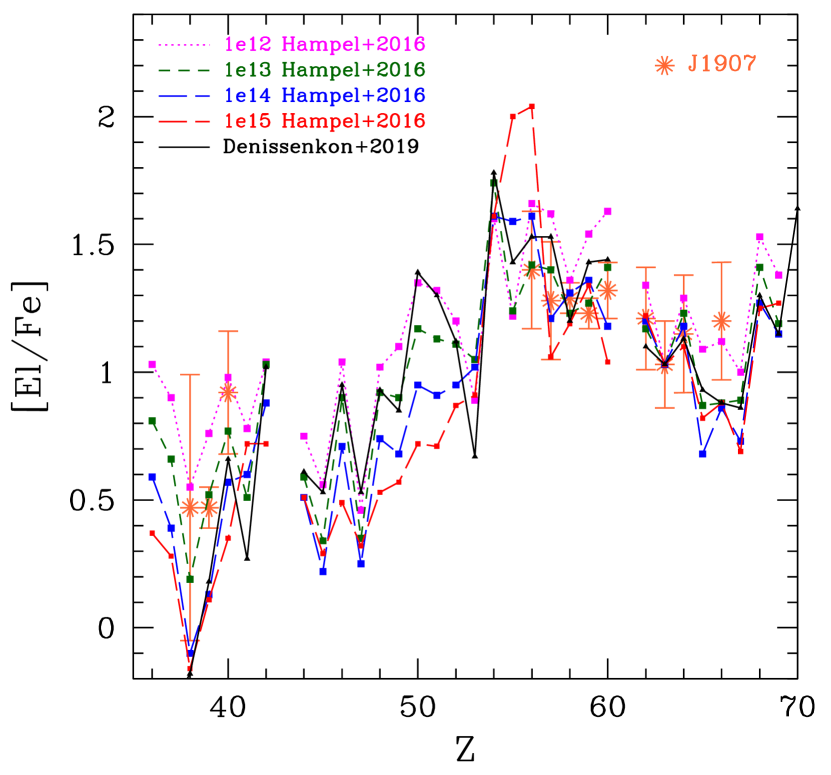
In addition to these stellar models, network calculations have been published by Hampel et al. (2016): even if performed at metallicities lower than J1907, they can be used to track its nucleosynthesis, due to the saturation effect of the ls and the hs component of the s-process (see above). In Figure 9 we report network calculations for different neutron densities (normalized to europium) and we compare them to the J1907 distribution. From a visual inspection, we can safely exclude the lowest ( cm-3) and the highest ( cm-3) neutron density cases. The first is not able to fit any of the hs elements, while the latter does not match ls elements and barium. Intermediate cases (i.e. between cm-3 and cm-3) provide a good enough fit, with the exclusion of gadolinium (this problem is shared with the calculation by Denissenkov et al. 2019, which also under-produces light-s elements). On the other hand, these network calculations provide a good fit to the large observed [Zr/Y], which is difficult to be obtained with s-process models.
In the comparison of Figure 7, we opt for discussing only distribution obtained with stellar evolutionary calculations, but in the future useful constraints can also be derived from the above-mentioned network calculations.
For the sake of clarity, it has to be stressed that both scenarios (RAWD vs. AGB+NSM) have difficulties in explaining from a statistical point of view the CEMP populations observed in the halo of our Galaxy (Abate et al. 2016, even if this analysis was performed for lower metallicities). With the current element list it is objectively difficult to disentangle between the two described scenarios. The situation would be completely different if at least one element belonging to the couples Pt-Au and Pb-Bi would be detected. For those elements, in fact, the i-process scenario shows definitely lower enhancements with respect to the s+r scenario, where they result largely abundant (the Pt-Au couple due to a pre-existing r-process, while the Pb-Bi couple from AGB pollution). Further observations dedicated to this star would be tremendously useful.
J1907 is fairly similar, from a chemical point of view, to SDSS J100714+160154, studied in the ultra-faint dwarf galaxy Segue 1 by Frebel et al. (2014), as can be seen in Fig. 2, 4, 5. However, SDSS J100714+160154 shows more pronounced s-process enrichment (e.g. [Sr/Fe]=0.9, [Zr/Fe]=1.4, [Ba/Fe]=1.85) and a measured Pb abundance, while Pb was not detectable in the available spectrum of J1906. The two stars share a high [hs/ls] ratio444This ratio defines the enrichment of the second peak of the s-process (hs elements) with respect to the first peak (ls elements) and it is defined as [hs/ls]=[hs/Fe]-[ls/Fe] in the usual spectroscopic notation.. On the other hand, r-process elements are less enhanced, with [Eu/Fe]=0.7. This would make it a CEMP-s star as per the Beers & Christlieb (2005) classification, while the Hansen et al. (2019) classification would indicate it as a CEMP-r/s (Fig. 5).
5 Conclusions
We present a chemical analysis for the star GIU J190734.24-315102.1 (J1907), a member of Sgr dSph. The star is a moderately metal poor ([FeH]=-1.55) giant, displaying strong carbon enhancement ([C/Fe]=+1.13), and n-capture enhancement of both s- and r-process elements ([Ba/Fe]=+1.4, [Eu/Fe]=+1.0).
To the best of our knowledge, J1907 is the first CEMP-r/s detected in the Sgr dSph. The situation is less obvious in other dwarf galaxies of the Local Group.
-
•
UMi K (Shetrone et al. 2001), Fornax 21 (Shetrone et al. 2003), and Sculptor 982 (Geisler et al. 2005) are the earliest reports we can find of Ba- and Eu- enhanced stars in Local Group dwarf Spheroidal galaxies. Their heavy element abundances would classify them as CEMP-r/s according to the Beers & Christlieb (2005) scheme, but their carbon abundance was never determined. Sculptor 982 is reported (Hill et al. 2019; Skúladóttir et al. 2019) to show very strong CN bands, a further hint in this direction.
-
•
The aforementioned SDSS J100714+160154 presented in Frebel et al. (2014) is borderline between CEMP-s and CEMP-r/s, to the extent a sharp threshold at [Ba/Eu]0.5 makes physical sense.
-
•
Chiti et al. (2018), in a search for CEMP stars in the Sculptor dSph, identifies 11 candidate CEMP-s / r/s, based on their high C abundance, placing them in the “high-carbon band” (see also Fig. 2). Only three of them have Ba abundances, and only one of these does indeed show a significant Ba overabundance. None have Sr or Eu abundances measured.
With the current available models, J1907 appears to be best explained as the product mass exchange from an AGB companion within a binary system pre-enriched at high concentration by the yields of a NS-NS merger.
It seems unlikely that this r-enrichment event had only affected one star that thus also underwent AGB mass tranfer. Other r-enriched stars should be present among Sgr dSph stars of similar metallicity, formed together with J1907. Given the star placement at the extreme of the Sgr dSph main body major axis, a good number of such stars could have since been stripped by the interaction with the MW, and reside currently in the Sgr dSph stream.
Acknowledgements.
This paper is dedicated to the dear memory of the late Fiorella Castelli, whose work in the modeling and analysis of stellar atmospheres has been a fundamental guidance for us. The authors thank Diego Vescovi for help in the use of the SKYNET code. EC and PB gratefully acknowledge support from the French National Research Agency (ANR) funded project “Pristine” (ANR-18-CE31-0017). EC and PB are thankful to ESO - Santiago for hosting them during the preparation of this manuscript. SV gratefully acknowledges the support provided by Fondecyt reg. n. 1170518. This work has made use of data from the European Space Agency (ESA) mission Gaia (https://www.cosmos.esa.int/gaia), processed by the Gaia Data Processing and Analysis Consortium (DPAC, https://www.cosmos.esa.int/web/gaia/dpac/consortium). This work has made use of data from APOGEE, part of SDSS IV. The SDSS web site is www.sdss.org.References
- Abate et al. (2018) Abate, C., Pols, O. R., & Stancliffe, R. J. 2018, A&A, 620, A63
- Abate et al. (2016) Abate, C., Stancliffe, R. J., & Liu, Z.-W. 2016, A&A, 587, A50
- Abbott et al. (2017) Abbott, B. P., LIGO Scientific Collaboration, & Virgo Collaboration. 2017, Phys. Rev. Lett., 119, 161101
- Allen et al. (2012) Allen, D. M., Ryan, S. G., Rossi, S., Beers, T. C., & Tsangarides, S. A. 2012, A&A, 548, A34
- Arentsen et al. (2019) Arentsen, A., Starkenburg, E., Shetrone, M. D., et al. 2019, A&A, 621, A108
- Baumgardt et al. (2019) Baumgardt, H., Hilker, M., Sollima, A., & Bellini, A. 2019, MNRAS, 482, 5138
- Beers & Christlieb (2005) Beers, T. C. & Christlieb, N. 2005, ARA&A, 43, 531
- Behara et al. (2010) Behara, N. T., Bonifacio, P., Ludwig, H. G., et al. 2010, A&A, 513, A72
- Bellazzini et al. (2008) Bellazzini, M., Ibata, R. A., Chapman, S. C., et al. 2008, AJ, 136, 1147
- Bisterzo et al. (2010) Bisterzo, S., Gallino, R., Straniero, O., Cristallo, S., & Käppeler, F. 2010, MNRAS, 404, 1529
- Bisterzo et al. (2011) Bisterzo, S., Gallino, R., Straniero, O., Cristallo, S., & Käppeler, F. 2011, MNRAS, 418, 284
- Bisterzo et al. (2012) Bisterzo, S., Gallino, R., Straniero, O., Cristallo, S., & Käppeler, F. 2012, MNRAS, 422, 849
- Bonifacio et al. (2018) Bonifacio, P., Caffau, E., Spite, M., et al. 2018, A&A, 612, A65
- Busso et al. (2010) Busso, M., Palmerini, S., Maiorca, E., et al. 2010, ApJ, 717, L47
- Caffau et al. (2018) Caffau, E., Gallagher, A. J., Bonifacio, P., et al. 2018, A&A, 614, A68
- Caffau et al. (2013) Caffau, E., Koch, A., Sbordone, L., et al. 2013, Astronomische Nachrichten, 334, 197
- Caffau et al. (2011) Caffau, E., Ludwig, H. G., Steffen, M., Freytag, B., & Bonifacio, P. 2011, Sol. Phys., 268, 255
- Carretta et al. (2014) Carretta, E., Bragaglia, A., Gratton, R. G., et al. 2014, A&A, 561, A87
- Carretta et al. (2010) Carretta, E., Bragaglia, A., Gratton, R. G., et al. 2010, A&A, 520, A95
- Castelli (2005) Castelli, F. 2005, Memorie della Societa Astronomica Italiana Supplementi, 8, 25
- Cayrel (1988) Cayrel, R. 1988, in IAU Symposium, Vol. 132, The Impact of Very High S/N Spectroscopy on Stellar Physics, ed. G. Cayrel de Strobel & M. Spite, 345
- Chiti et al. (2018) Chiti, A., Simon, J. D., Frebel, A., et al. 2018, ApJ, 856, 142
- Cohen (2004) Cohen, J. G. 2004, AJ, 127, 1545
- Cowan & Rose (1977) Cowan, J. J. & Rose, W. K. 1977, ApJ, 212, 149
- Cowan et al. (2019) Cowan, J. J., Sneden, C., Lawler, J. E., et al. 2019, arXiv e-prints, arXiv:1901.01410
- Cristallo et al. (2016) Cristallo, S., Karinkuzhi, D., Goswami, A., Piersanti, L., & Gobrecht, D. 2016, ApJ, 833, 181
- Cristallo et al. (2011) Cristallo, S., Piersanti, L., Straniero, O., et al. 2011, ApJS, 197, 17
- Cristallo et al. (2015) Cristallo, S., Straniero, O., Piersanti, L., & Gobrecht, D. 2015, ApJS, 219, 40
- Cui et al. (2013) Cui, W. Y., Sivarani, T., & Christlieb, N. 2013, A&A, 558, A36
- Dekker et al. (2000) Dekker, H., D’Odorico, S., Kaufer, A., Delabre, B., & Kotzlowski, H. 2000, in Optical and IR Telescope Instrumentation and Detectors, ed. M. Iye & A. F. Moorwood, Vol. 4008, 534–545
- Denissenkov et al. (2019) Denissenkov, P. A., Herwig, F., Woodward, P., et al. 2019, MNRAS, 488, 4258
- François et al. (2007) François, P., Depagne, E., Hill, V., et al. 2007, A&A, 476, 935
- Frebel et al. (2014) Frebel, A., Simon, J. D., & Kirby, E. N. 2014, ApJ, 786, 74
- Gaia Collaboration et al. (2018) Gaia Collaboration, Helmi, A., van Leeuwen, F., et al. 2018, A&A, 616, A12
- Geisler et al. (2005) Geisler, D., Smith, V. V., Wallerstein, G., Gonzalez, G., & Charbonnel, C. 2005, AJ, 129, 1428
- Giuffrida et al. (2010) Giuffrida, G., Sbordone, L., Zaggia, S., et al. 2010, A&A, 513, A62
- Gull et al. (2018) Gull, M., Frebel, A., Cain, M. G., et al. 2018, ApJ, 862, 174
- Hampel et al. (2016) Hampel, M., Stancliffe, R. J., Lugaro, M., & Meyer, B. S. 2016, ApJ, 831, 171
- Hansen et al. (2018a) Hansen, C. J., El-Souri, M., Monaco, L., et al. 2018a, ApJ, 855, 83
- Hansen et al. (2019) Hansen, C. J., Hansen, T. T., Koch, A., et al. 2019, A&A, 623, A128
- Hansen et al. (2015) Hansen, T., Hansen, C. J., Christlieb, N., et al. 2015, ApJ, 807, 173
- Hansen et al. (2018b) Hansen, T. T., Holmbeck, E. M., Beers, T. C., et al. 2018b, ApJ, 858, 92
- Harris (1996) Harris, W. E. 1996, AJ, 112, 1487
- Hasselquist et al. (2017) Hasselquist, S., Shetrone, M., Smith, V., et al. 2017, ApJ, 845, 162
- Herwig et al. (2011) Herwig, F., Pignatari, M., Woodward, P. R., et al. 2011, ApJ, 727, 89
- Herwig et al. (2014) Herwig, F., Woodward, P. R., Lin, P.-H., Knox, M., & Fryer, C. 2014, ApJ, 792, L3
- Hill et al. (2019) Hill, V., Skúladóttir, Á., Tolstoy, E., et al. 2019, A&A, 626, A15
- Hollek et al. (2015) Hollek, J. K., Frebel, A., Placco, V. M., et al. 2015, ApJ, 814, 121
- Jacobson & Friel (2013) Jacobson, H. R. & Friel, E. D. 2013, AJ, 145, 107
- Jonsell et al. (2006) Jonsell, K., Barklem, P. S., Gustafsson, B., et al. 2006, A&A, 451, 651
- Jorissen et al. (2016) Jorissen, A., Hansen, T., Van Eck, S., et al. 2016, A&A, 586, A159
- Käppeler et al. (2011) Käppeler, F., Gallino, R., Bisterzo, S., & Aoki, W. 2011, Reviews of Modern Physics, 83, 157
- Kausch et al. (2015) Kausch, W., Noll, S., Smette, A., et al. 2015, A&A, 576, A78
- Koch et al. (2019) Koch, A., Reichert, M., Hansen, C. J., et al. 2019, A&A, 622, A159
- Kurucz (2005) Kurucz, R. L. 2005, Memorie della Societa Astronomica Italiana Supplementi, 8, 14
- Lawler et al. (2001) Lawler, J. E., Wickliffe, M. E., den Hartog, E. A., & Sneden, C. 2001, ApJ, 563, 1075
- Le Fèvre et al. (2003) Le Fèvre, O., Saisse, M., Mancini, D., et al. 2003, in Proc. SPIE, Vol. 4841, Instrument Design and Performance for Optical/Infrared Ground-based Telescopes, ed. M. Iye & A. F. M. Moorwood, 1670–1681
- Lippuner & Roberts (2017) Lippuner, J. & Roberts, L. F. 2017, ApJS, 233, 18
- Lodders et al. (2009) Lodders, K., Palme, H., & Gail, H. P. 2009, Landolt Börnstein, 4B, 712
- Lucatello et al. (2005) Lucatello, S., Tsangarides, S., Beers, T. C., et al. 2005, ApJ, 625, 825
- Majewski et al. (2013) Majewski, S. R., Hasselquist, S., Łokas, E. L., et al. 2013, ApJ, 777, L13
- McWilliam et al. (2013) McWilliam, A., Wallerstein, G., & Mottini, M. 2013, ApJ, 778, 149
- Monaco et al. (2005) Monaco, L., Bellazzini, M., Bonifacio, P., et al. 2005, A&A, 441, 141
- Mottini et al. (2008) Mottini, M., Wallerstein, G., & McWilliam, A. 2008, AJ, 136, 614
- Nishimura et al. (2017) Nishimura, N., Sawai, H., Takiwaki, T., Yamada, S., & Thielemann, F. K. 2017, ApJ, 836, L21
- Nishimura et al. (2015) Nishimura, N., Takiwaki, T., & Thielemann, F.-K. 2015, ApJ, 810, 109
- Pasquini et al. (2000) Pasquini, L., Avila, G., Allaert, E., et al. 2000, in Optical and IR Telescope Instrumentation and Detectors, ed. M. Iye & A. F. Moorwood, Vol. 4008, 129–140
- Pian et al. (2017) Pian, E., D’Avanzo, P., Benetti, S., et al. 2017, Nature, 551, 67
- Placco et al. (2015) Placco, V. M., Beers, T. C., Ivans, I. I., et al. 2015, ApJ, 812, 109
- Placco et al. (2013) Placco, V. M., Frebel, A., Beers, T. C., et al. 2013, ApJ, 770, 104
- Prantzos et al. (2020) Prantzos, N., Abia, C., Cristallo, S., Limongi, M., & Chieffi, A. 2020, MNRAS, 491, 1832
- Reddy et al. (2006) Reddy, B. E., Lambert, D. L., & Allende Prieto, C. 2006, MNRAS, 367, 1329
- Roederer et al. (2010) Roederer, I. U., Cowan, J. J., Karakas, A. I., et al. 2010, ApJ, 724, 975
- Roederer et al. (2016) Roederer, I. U., Karakas, A. I., Pignatari, M., & Herwig, F. 2016, ApJ, 821, 37
- Roederer et al. (2014) Roederer, I. U., Preston, G. W., Thompson, I. B., et al. 2014, AJ, 147, 136
- Sbordone (2005) Sbordone, L. 2005, Memorie della Societa Astronomica Italiana Supplementi, 8, 61
- Sbordone et al. (2007) Sbordone, L., Bonifacio, P., Buonanno, R., et al. 2007, A&A, 465, 815
- Sbordone et al. (2004) Sbordone, L., Bonifacio, P., Castelli, F., & Kurucz, R. L. 2004, Memorie della Societa Astronomica Italiana Supplementi, 5, 93
- Sbordone et al. (2005) Sbordone, L., Bonifacio, P., Marconi, G., Buonanno, R., & Zaggia, S. 2005, A&A, 437, 905
- Sbordone et al. (2014) Sbordone, L., Caffau, E., Bonifacio, P., & Duffau, S. 2014, A&A, 564, A109
- Sbordone et al. (2015) Sbordone, L., Monaco, L., Moni Bidin, C., et al. 2015, A&A, 579, A104
- Shetrone et al. (2003) Shetrone, M., Venn, K. A., Tolstoy, E., et al. 2003, AJ, 125, 684
- Shetrone et al. (2001) Shetrone, M. D., Côté, P., & Sargent, W. L. W. 2001, ApJ, 548, 592
- Siegel et al. (2019a) Siegel, D. M., Barnes, J., & Metzger, B. D. 2019a, Nature, 569, 241
- Siegel et al. (2019b) Siegel, D. M., Barnes, J., & Metzger, B. D. 2019b, Nature, 569, 241
- Skúladóttir et al. (2019) Skúladóttir, Á., Hansen, C. J., Choplin, A., et al. 2019, arXiv e-prints, arXiv:1912.06671
- Smette et al. (2015) Smette, A., Sana, H., Noll, S., et al. 2015, A&A, 576, A77
- Sneden (1973) Sneden, C. A. 1973, PhD thesis, The University of Texas at Austin.
- Spite et al. (2013) Spite, M., Caffau, E., Bonifacio, P., et al. 2013, A&A, 552, A107
- Stancliffe et al. (2011) Stancliffe, R. J., Dearborn, D. S. P., Lattanzio, J. C., Heap, S. A., & Campbell, S. W. 2011, ApJ, 742, 121
- Starkenburg et al. (2014) Starkenburg, E., Shetrone, M. D., McConnachie, A. W., & Venn, K. A. 2014, MNRAS, 441, 1217
- Straniero et al. (2006) Straniero, O., Gallino, R., & Cristallo, S. 2006, Nuclear Physics A, 777, 311
- Suda et al. (2011) Suda, T., Yamada, S., Katsuta, Y., et al. 2011, MNRAS, 412, 843
- Thielemann et al. (2017) Thielemann, F. K., Eichler, M., Panov, I. V., & Wehmeyer, B. 2017, Annual Review of Nuclear and Particle Science, 67, 253
- Thygesen et al. (2016) Thygesen, A. O., Sbordone, L., Ludwig, H.-G., et al. 2016, A&A, 588, A66
- Tolstoy et al. (2009) Tolstoy, E., Hill, V., & Tosi, M. 2009, Annual Review of Astronomy and Astrophysics, 47, 371
- Trager et al. (1995) Trager, S. C., King, I. R., & Djorgovski, S. 1995, AJ, 109, 218
- Venn et al. (2004) Venn, K. A., Irwin, M., Shetrone, M. D., et al. 2004, AJ, 128, 1177
- Watson et al. (2019) Watson, D., Hansen, C. J., Selsing, J., et al. 2019, Nature, 574, 497
- Yoon et al. (2016) Yoon, J., Beers, T. C., Placco, V. M., et al. 2016, ApJ, 833, 20
Appendix A Estimation of errors on atmosphere parameters and abundances
Table 1 quotes MyGIsFOS internal parameters errors. These are computed as follows.
-
•
During calculation, the linear fit of the relationship between lower energy and and abundance given by individual Fe i lines is computed, and iteratively adjusted until its slope is (very close to) zero (see Sbordone et al. 2014). This populates a list of -slope couples, against which a second-order polynomial is fit. When the final is chosen, the error on the slope for that last fit is used together with this second-order polynomial to determine which temperatures would correspond to slopes equal to final_slopeslope_error and final_slopeslope_error.
-
•
Similarly, Vturb is determined by iteratively finding the value that zeroes the slope of the relationship between reduced equivalent width and abundance of individual Fe i lines. As the final value is found, the error of the slope and the stored Vturb/ slope couples are used to determine the Vturb uncertainty.
-
•
Gravity is determined by enforcing equal average abundance to be given by Fe i and Fe ii lines. The internal error (line-to-line dispersion) of Fe i and Fe ii average abundances are summed in quadrature, and the uncertainty in gravity is determined by deriving the gravity that produces A(Fe i) – A(Fe ii) offsets equal to final_offset quadrature_error and final_offset quadrature_error.
Given that the formal values of these uncertainties are sensitive to the way parameters changed during the actual parameter-search iteration, we conservatively round uncertainties to 10K, 0.1 km/s, and 0.1 cm s-2 for , Vturb, and , respectively.
Quoted errors on abundances are estimated in different fashions.
-
•
For abundances of species measured with MyGIsFOS and based on at least two lines, uncertainties on [X/H] are line-to-line scatter, while the [X/Fe] values are summed in quadrature with either Fe i or Fe ii line-to-line scatter (see Sbordone et al. 2014, for details). N i abundance, although determined with FitProfile, is based on multiple features and treated the same way.
-
•
Species measured with MOOG and based on multiple features also quote line-to-line scatter, however, since in this case [X/Fe] was measured directly, only the scatter on it is reported.
-
•
Species based on a single feature (with the exception of Sr ii, see above) do not allow to directly probe the main sources of uncertainty. For isolated lines formal measurement uncertainty on the equivalent width, according to Cayrel (1988) does not exceed 5-10% for unsaturated lines at the typical S/N of this spectrum, with a negligible (0.04 dex, see also Caffau et al. 2013, table 3 for a Montecarlo test on simulated, noise-injected spectra) impact on abundances. Line-to-line scatter in the best sampled species (Fe i and Fe ii) is around 0.16 dex, even on carefully selected lines, underscoring the well known fact that abundance measurements are dominated by systematics (appoximations on physics, uncertain atomic data, undetected or mis-estimated blends, poor continuum placement in crowded regions). We thus quote for all these species the Fe i line-to-line scatter as representative uncertainty on [X/Fe], and then sum it in quadrature with either the Fe i or the Fe ii line-to-line scatter for [X/Fe].
We do not present here an investigation of the dependence of the abundances from the chosen atmosphere parameters, however, as can be seen in François et al. (2007), parameter sensitivity for stars of similar characteristics (BS 17569-049, Tab. 2 in François et al. 2007), is small compared to the uncertainties we quote, and can thus be neglected.