Bayesian estimation and prediction for certain type of mixtures
Aziz LMouddena,b & Éric Marchanda, 111
a Université de
Sherbrooke, Département de mathématiques, Sherbrooke Qc,
CANADA, J1K 2R1
b Département de mathématiques, Université du Québec à Montréal, Montréal, Qc, CANADA, H2X 3Y7 e-mails: eric.marchand@usherbrooke.ca; aziz.lmoudden@usherbrooke.ca
Summary
For two vast families of mixture distributions and a given prior, we provide unified representations of posterior and predictive distributions. Model applications presented include bivariate mixtures of Gamma distributions labelled as Kibble-type, non-central Chi-square and F distributions, the distribution of in multiple regression, variance mixture of normal distributions, and mixtures of location-scale exponential distributions including the multivariate Lomax distribution. An emphasis is also placed on analytical representations and the relationships with a host of existing distributions and several hypergeometric functions of one or two variables.
AMS 2010 subject classifications: 62F15; 62E15; 62C10
Keywords and phrases: Bayesian analysis; Bivariate gamma; Kibble; Lomax; Mixtures, Non-central distributions; Posterior distribution; Predictive distribution.
1 Introduction
Mixture models are ubiquitous in probability and statistics. Such models, whether they are finite mixture models, mixtures of Poisson, exponential, gamma or normal distributions, etc., are quite useful and appealing for best representing data and heterogeneous environments. As well, distributional properties of mixture models are often quite elegant and instructive. However, analytical and numerical challenges are present and well documented, namely in terms of likelihood-based and Bayesian inference.
It is also the case that several familiar distributions are representable in terms of mixtures, and that such representation facilitates the derivation of various statistical properties and approaches to statistical inference. Prominent examples include the noncentral chi-square, Beta, and Fisher distributions, which arise typically in relationship to quadratic forms in normal linear models. Other important examples include the distribution of the square of a multiple correlation coefficient () in a standard multiple regression linear model with normally distributed errors, as well as the vast class of univariate or bivariate Gamma mixtures which include the Kibble distribution (see Example 1.1).
We consider mixture models for summary statistics which are of one of the following two types:
| (1.1) | |||||
| (1.2) |
The classification of these types will be adhered to and seems to be a natural way to present the various expressions and examples that make up this paper. In the above models, the mixing variables will typically be either a discrete or continuous univariate distribution, but more generally with a measurable space. The parameter is unknown and a prior density will be assumed. Otherwise the densities will be assumed known (except for the value of ) and absolutely continuous with respect to a finite measure . Similarly, the densities and for , as well as and for , will be assumed to be known and absolutely continuous with respect to a finite measure . Examples will include both discrete and continuous mixing for and , as well as discrete and continuous models for the conditional distributions of and .
With analytical expressions (Theorem 3.1 and Theorem 4.2) for Bayesian posterior distributions for based on , as well as Bayesian predictive densities for based on , we are particularly interested in eliciting the general structures driving these Bayesian solutions and illustrating the wide breadth of applications. In the illustrations, the solutions involve mixtures themselves and bring into play special functions such as Hypergeometric and Appell which are readily available in mathematical packages. They are also “exact’ and do not rely on stochastic approximations (e.g., MCMC) which are omnipresent in Bayesian computing.
Much focus is placed on identifying concise representations and informative connections between distributions. Model applications that we present include bivariate mixtures of Gamma distributions that we label as Kibble-type, non-central Chi-square and F distributions, the distribution of in multiple regression, variance mixture of normal distributions, and mixtures of location-scale exponential distributions including the multivariate Lomax distribution. For bivariate gamma mixtures, which we focus on in Section 4, we also consider bivariate prior distributions with dependence structures, in particular as occurring under an order restriction on the parameters. The posterior and predictive distribution decompositions in this work follow familiar paths, but the analytical representations provided are nevertheless unified, useful and insightful, and lead to simplifications in Bayesian posterior analyses. This is also the case where we purposely exploit the mixture representation of a familiar distribution.
Here is a first illustration of Type I and Type II mixtures, which will be studied more generally in Sections 3 and 4 respectively, and which borrows notations presented in Section 2.
Example 1.1.
The Kibble bivariate gamma distribution (Wicksell, 1933; Kibble, 1941) for , admits the following mixture representation:
| (1.3) |
Here , and Such a distribution originates for instance in describing the joint distribution of sample variances generated from a bivariate normal distribution with correlation coefficient . The cases reduce to . Now, observe that we have a Type I mixture if with known , and a Type II mixture for ; or again ; with known . A third type of mixture arises when is unknown, but will not be further addressed in this paper. The mixing representation of the Kibble distribution has been exploited in a critical fashion for Bayesian analysis by Iliopoulos et al. (2005).
2 Notations and definitions
Here are some notations and definitions used throughout concerning some special functions and various distributions that appear below, related either to the model, the mixing variables, the prior, the posterior, or the predictive distribution. We will write to indicate that the random variable has density (or p.m.f.) . We will also write to signify that density is associated with distribution . We will the use the symbol to represent equality in distribution and for equality in distribution with independent components.
In what follows, we denote as the Poisson distribution with mean and p.m.f. (or density) . We write , with and , to denote a negative binomial distribution with p.m.f. (or density) .
Throughout the paper, we define for positive real numbers , and , the generalized hypergeometric function as
with the Pochhammer function defined here for . We write , for , to denote a generalized hypergeometric distribution (e.g., Johnson et al., 1995) with p.m.f.
For these distributions, we will have positive ’s and ’s, and will be non negative and in the radius of convergence of the function. With such a notation for instance, we could write for , and for .
We denote , , and , for , as Gamma, Beta, and Beta type II distributions, and with densities , , and , respectively. The latter Beta type II family includes Pareto distributions on for .
The Kummer distribution of type II, denoted for parameters and , is taken with density
where is the confluent hypergeometric function of type II defined for and as: . This class of distributions include Gamma distributions with choices . The class can also be extended to include cases which correspond to distributions.
We will denote McKay’s bivariate gamma distribution with parameters as with p.d.f.
The distribution has a long history (e.g., McKay, 1934) and is a benchmark bivariate distribution to model durations that are ordered, It is easy to verify that the marginals are distributed as and , and that and are independently distributed, with . A generalization will be presented in Section 4.
3 Type I mixtures
We begin with Type I mixtures, providing general representations for the posterior distribution , as well as the predictive distribution , and following up with various examples and observations.
Theorem 3.1.
Let be conditionally independent distributed as in (1.1) and let have prior density for with respect to finite measure . Let and be the densities given by
with the density given by
Then,
-
(a)
The posterior distribution of admits the mixture representation:
(3.4) -
(b)
The Bayes predictive density of admits the representation:
(3.5) with
(3.6)
Proof. (a) We have indeed
(b) The predictive density of , i.e. the conditional density of , is given by:
where we have used (3.4). This establishes the result. ∎
Remark 3.1.
The posterior and predictive distribution representations of Theorem 3.1 are particularly appealing. Indeed, observe that posterior distribution (3.4) mixes the which correspond to the posterior density of as if one had actually observed . Moreover, the mixing density for is a weighted version of the marginal density for with weight proportional to .
The predictive distribution for mixes the same densities as the model density for , with the prior mixing density replaced by the posterior mixing density . Furthermore, this mixing density is itself a mixture of the predictive (or conditional) densities of as if one had observed .
The following examples concern posterior and predictive distribution illustrations of Theorem 3.1.
Example 3.2.
In model (1.1), consider Poisson mixing with a prior for . From this familiar set-up, we obtain as a density and as a NB p.m.f. Following (3.4), the posterior distribution is a mixture of the above ’s with mixing density on given by
Now, consider the cases: (i) , (ii) and (iii) . In the context of model (1.1), case (i) corresponds to a non-central chi-square distribution with degrees of freedom and non-centrality parameter (), case (ii) to a non-central Beta distribution with shape parameters , , and non-centrality parameter , and case (iii) to the density of , with distributed as a non-central distribution with degrees of freedom , and non-centrality parameter . The latter two cases are essentially equivalent though and related by the fact that in (ii) is distributed as is in (iii).
For (i), we obtain
| (3.7) |
Observe that the above generalized hypergeometric distribution reduces to a distribution for . The posterior expectation can be evaluated with the help its mixture representation and standard calculations involving the above p.m.f. One obtains
| (3.8) | |||||
| (3.9) |
with the case simplifying to as noted by Saxena and Alam (1982).
For the two other cases, we obtain the mixing power series densities:
| (3.10) |
Observe that the case reduces to a NB distribution for (ii) and a NB distribution for (iii). The posterior expectation may be computed from (3.8) with simplifications occurring for , yielding for instance in (ii) : . Finally, we point out that the above posterior distribution representation applies as well for the improper prior choice (i.e., ), with not a p.m.f., but given by .
Example 3.3.
Turning now to predictive densities with the same set-up as in Example 3.2, we consider distributed identically to (i.e, and ). For (i.e., case (i)), Theorem 3.1 tells us that the Bayes predictive density of admits the mixture representation: with given in (3.6). The latter admits itself the mixture representation
| (3.11) |
with the former being the Bayes predictive density of based on and prior . Alternatively represented, the mixing p.m.f. for may be expressed as
which also can be viewed directly as a weighted p.m.f.
The non-central Beta and Fisher distributions are similar. For instance, in the former case with and identically distributed with and , predictive densities associated with priors are also distributed as mixtures
For the mixing p.m.f. of , a development as above yields the expression:
Example 3.4.
A doubly non-central distribution is a type I mixture (e.g., Bulgren, 1971) with and admitting the representation
| (3.12) |
Such a distribution arises naturally as a multiple of the ratio of two independent noncentral chi-squared distributions, and reduces to a non-central for . Consider now the application of Theorem 3.1 for the prior with , where we have the familiar representations of as the joint density of independent distributions, and of as the joint p.m.f. of independent distributions. Representation (3.4) tells us that the posterior distribution of is a mixture of the ’s with mixing density
| (3.13) |
with , , and where is the Appell function of the second kind given by
The bivariate p.m.f. in (3.13) and how it is arisen here are of interest. It is a bivariate power series p.m.f. generated by the coefficients of the Appell function and will be bona fide p.m.f. for and . Appell’s function appears in a similar way, again in a Bayesian framework, as a bivariate discrete distribution called Bailey by Laurent (2012) (see also Jones & Marchand, 2019 for another derivation). For the particular case , the p.m.f. in (3.13) simplifies and the corresponding random pair , admits the stochastic representation: and with and .
Turning to the predictive density, consider distributed as and the same prior on as above. Similarly to Example 3.3, which shares the same Poisson mixing and gamma prior, we obtain from Theorem 3.1 and (3.5), that the predictive density for admits the representation
We point out that, if the distribution of is of the same type as that of (in 3.12) with associated degrees of freedom and instead of and , the only change in the previous expression is to replace the ’s by the ’s for the distribution of . When applicable, a similar observation applies to the other examples of this section.
Example 3.5.
Consider univariate Gamma mixtures with in model (1.1), with the mixing distribution and prior , with known . Theorem 3.1 applies and tells us that the posterior distribution is a mixture of making use of a familiar posterior distribution for gamma models with gamma priors. In evaluating the mixing density of given in (3.4), it is easy to verify that and one thus obtains
which corresponds to a Kummer distribution as defined in Section 2.
Now consider the Bayesian predictive density for the Gamma mixture and , which includes the particular case of identically distributed and for and . Observe that the density is that of for the set-up , independently distributed, and with . A calculation (e.g., Aitchison & Dunsmore, 1975) yields . With the above, it follows from Theorem 3.1 that the predictive distribution for admits the representation:
An alternative representation comes from simply evaluating the marginal density of . A calculation gives:
with the confluent hypergeometric function of type II as defined in Section 2.
The final application of Theorem 3.1 concerns the coefficient of determination in a standard multiple regression context.
Example 3.6.
Consider a coefficient of determination , or square of a multiple correlation coefficient, that arises for a sample of size from , with , and the regression of based on . For more details on the underlying distributional theory, see for instance Muirhead (1982). It is well known that the distribution of is a Type I mixture (1.1) with
with is the theoretical squared multiple correlation coefficient. As in Marchand (2001), a convenient prior on is a Beta prior and it leads along with the negative binomial distributed to a conjugate posterior. Specifically, we obtain for the posterior density , as well as the marginal p.m.f.
Theorem 3.1 tells us that the posterior distribution is a mixture of the ’s with mixing
| (3.14) |
The result, which we have derived from the general context of Theorem 3.1 was obtained by Marchand (2001) in this specific set-up. In doing so, he defined such Beta mixtures as HyperBeta and also provided several graphs of prior-posterior densities for varying prior parameters , sample size , and observed values of .
For the predictive density of a future distributed as but allowing for a possibly different sample size , expression (3.5) tells us that such a predictive density admits the mixture representation:
| (3.15) |
the predictive density for based on and prior . An evaluation of (3.6) yields
It is worth noting that the above belongs to the class of p.m.f.’s of the form with , , and as .
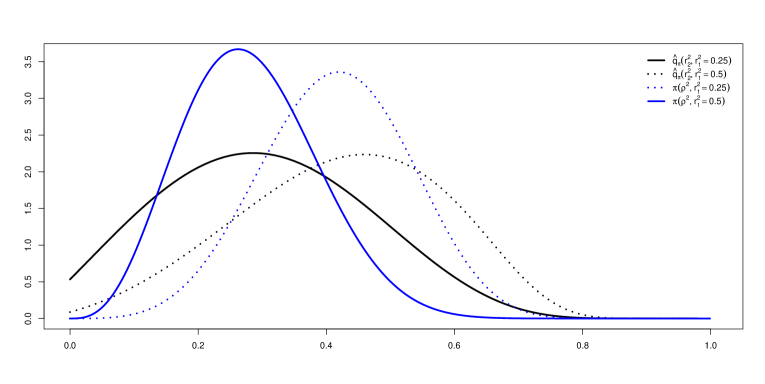
As a complement to the above, we briefly illustrate the usefulness of the predictive density (3.15) for visualizing how concordant or discordant the sample coefficients of determination and can be when arising from studies set under the same conditions. Such a comparison also relates to the degree to which a second study replicates or not the results of an initial study when focusing on the summaries. Consider Figure 1 where both posterior densities for and predictive densities for are drawn for , a prior, and sample sizes . The variability in the Bayesian predictive distributions is indeed quite significant, stemming of course from posterior uncertainty as well as model uncertainty. Further illustrating and for further interpretation of Figure 1, we record the expectations and standard deviations under the predictive densities: and , as well as the selected probabilities and .
4 Type II mixtures
We consider now Type II mixtures, provide general representations for the posterior distribution , as well as the predictive distribution , and continue with various examples and observations.
Theorem 4.2.
Let be conditionally independent distributed as in (1.2) and let have prior density for with respect to finite measure . Let and be respectively the conditional distribution densities of and given by
with given by
Then,
-
(a)
The posterior distribution admits the mixture representation:
(4.16) -
(b)
The Bayes predictive density of admits the representation:
(4.17) with
(4.18) An alternative equivalent representation is:
with
Proof. (a) We have indeed
with
which establishes (4.16).
(b) The Bayes predictive density of , i.e. the conditional density of , is given by:
where we have used (4.16). This establishes the result. ∎
Remark 4.2.
Again, the posterior and predictive distributions have noteworthy representations. Namely, while the model distribution for mixes the ’s with mixing marginal density of , the posterior distribution (4.16) mixes the ’s, which represents for fixed the posterior density of as if one had actually observed as well , with mixing density which is the marginal posterior distribution of . Similarly, the density is the marginal density of as if had been observed.
In the second representation of the predictive distribution for , we have a mixture with the same mixing density as of the model distribution of . The distributions mixed are themselves mixtures of the densities, which represent Bayes predictive densities for as if one had actually observed and . With the first representation, we have bivariate mixing of the densities with independently distributed components and .
Example 4.7.
As a first illustration of the above Theorem, consider variance mixture of normal distributions with summaries with on , as well as with on . Such a class includes not only finite mixtures with the mixing variables and discrete with finite support, but also several familiar distributions such as multivariate Student, Logistic and Laplace, among others.
Now, consider the prior with known . In applying Theorem 4.2 for the posterior distribution of , it is well known that
Theorem 4.2 thus implies that admits the representation
| (4.19) |
Alternatively, we can express the above in terms of , , and , yielding the mixture representation
being the density of . The above posterior distribution for is an example of a variance-mean mixture of normal distributions popularized by Barndorff-Nielson et al. (1982), and much studied since in terms of theoretical and practical issues. For the improper prior , it is not too difficult to evaluate directly the posterior, but Theorem 4.2 also applies. Indeed in this case, we have , and the posterior distribution admits the representation of with , which is a variance (only) mixture of normal distributions.
For the predictive distribution of , one can verify the Bayesian normal model predictive density calculation
With this, it follows from Theorem 4.2 that the Bayes predictive density of is a mixture of normal densities with and given in (4.19). Observe that the result applies if either or is normally distributed by taking the corresponding mixing variable or to be degenerate. Finally, for the improper prior , the above becomes with and , a result given by Kubokawa et al. (2015).
The next example deals with a mixture of exponential distributions (denoted ) model which has garnered much over the years much interest in reliability.
Example 4.8.
We now consider here the following mixture of exponential distributions model:
| (4.20) |
with , and with unknown location and scale parameters and . Here, the densities being mixed are exponential distributions such that . The above is a type II mixture and we set with . Quite generally, model (4.20) is representative of system components with a common environment, the case having been put forth by Lindley & Singpurwalla (1986). A notable choice of occurs for with known , and leads to the multivariate Lomax distribution (e.g., Nayak, 1987) which has generated much interest over the years.
It is reasonable to consider the summary with , (e.g., Petropoulos, 2017). The pair is, namely, a jointly sufficient and complete statistic for degenerate . Conditional on , and are independently distributed as:
| (4.21) |
We thus have a Type II mixture for with
| (4.22) |
Consider now a gamma prior for and a flat prior for so that
| (4.23) |
In fact, the posterior distribution exists as well for , and for . Evaluating the density of Theorem 4.2. we obtain
| (4.24) |
which implies the posterior distribution representation:
| (4.25) |
where we have set . Now, evaluating the marginal density222As a function of , it is not a true density here as we have used an improper prior. of , we have from (4.22) and (4.23):
as a function of . Finally, putting the above elements together, we have for as in (4.21) with and prior density (4.23), the following representation for the posterior distribution of :
From this, we obtain for the Kummer density
| (4.26) |
with corresponding to the multivariate Lomax case. Alternatively, for an inverse Gamma density with density proportional to , we obtain that the mixing density of is such that .
Now, for deriving a predictive density via Theorem 4.2, based on distributed as above in (4.21) with , consider predicting such that:
| (4.27) |
These statistics arise naturally, just as the case for , as jointly complete and sufficient conditional for the observables with and . Following Theorem 4.2, based on a prior density for , we have that the Bayes predictive density of admits representation (4.17), which is with and . There thus remains and we now seek to evaluate
| (4.28) |
with
and
After some calculations, setting and , one obtains
with . This provides an explicit expression for the sought-after (4.28), but a more appealing decomposition of the distribution of under , easily derived from the above, is:
| (4.29) | |||||
with , , and . Finally, we point out that the above distribution for can be described as bilateral Pareto since, conditional on :
| (4.30) |
Summarizing for the multivariate Lomax case with , the predictive density of given and prior in (4.23) may be generated as:
and then and as the bilateral Pareto and Beta type II respectively defined in (4.30) and (4.29) respectively.
There are many other potential applications of Theorem 4.2, including mixtures of Gamma distributions with , but we will focus hereafter on bivariate gamma mixtures, which we define as follows and which is inspired by the Kibble distribution mixture representation (see Example 1.1).
Definition 4.1.
A Kibble-type bivariate gamma mixture with parameters (all ) and mixing distribution , which we denote , is defined through the representation:
In the above definition, one recovers the original Kibble distribution in (1.3) for , and , but many other interesting cases are generated including Poisson mixtures with and continuous mixing as well. Of course, one requires such that . An application of Theorem 4.2 to such bivariate gamma mixtures yields the following.
Corollary 4.1.
Consider type II mixtures as in (1.2) with and , and prior distribution , Then,
-
(a)
The posterior distribution of based on is with a density (or p.m.f.) such that
(4.31) -
(b)
The predictive distribution for admits the representation
(4.32)
Proof. (a) We have and , which implies that is the density of . It thus follows from (4.16) that the posterior distribution of is . Finally, a direct calculation yields
| (4.33) |
as a function of , and the result follows.
(b) This follows from (4.17), (4.31), and the evaluation of the predictive density of based on , which has independently distributed B2 marginals as given in (4.32) and previously encountered in Example 3.5. ∎
Remark 4.3.
Corollary 4.1 applies quite generally with respect to the type of mixing, and include “degenerate” cases with and-or corresponding to independent components of and respectively. The results of Corollary 4.1 apply as well to some choices of the ’s and ’s that lead to an improper prior, as long as the densities exist. These include for instance the choices , with such that . Observe as well that the choice , which is typically taken as the usual non-informative prior, leads to the simplification in (4.31) and (4.32).
Example 4.9.
Corollary 4.1 applies for any mixing distributions and , such as Poisson mixing: (a) and , and negative binomial mixing: (b) and , with only the mixing density varying. We obtain
for the Poisson case (a), and
for the negative binomial case (b). Case (b) reduces and applies to the original Kibble distribution, as in Example 1.1, for , , . Finally, it is immediate to extend the example to cases where the density is that of a generalized hypergeometric distribution, obtaining .
Our next example and application of Theorem 4.2 relates again to Kibble-type bivariate gamma mixtures, but with a prior on adapted to situations where there exists an order restriction. Many such situations are plausible. An interesting case concerns queues and the estimation of the arrival () and service () rates for independent gamma observables, and in particular the ratio , whenever a steady-state distribution exists, i.e. (Armero & Bayarri, 1994). In doing so, it seems natural to consider a McKay distribution as a prior. Another interesting prior choice, which was analyzed by Armero & Bayarri (1994) for independent gamma observables, is to start with two independent gamma distributions for and truncated to the ordering set . Before presenting how Theorem 4.2 applies, we catalog some information about a generalized version of the McKay distribution which contains both the above-mentioned prior choices, which will appear below in the posterior analyses, and which is of interest on its own.
Definition 4.2.
The generalized McKay distribution with parameters , with , , , and , denoted is a bivariate distribution with p.d.f.
| (4.34) |
| (4.35) |
Observe that the above distribution reduces to a McKay distribution () for and . As well, the case with is generated by two independently distributed and truncated to the region . We have collected some technical observations and properties, including the computation of the normalization constant , of such distributions in the Appendix.
Example 4.10.
Consider the application of Theorem 4.2 for and combined with the prior . From expressions below for the posterior density of and the predictive density for , we will be able to extract expressions for Gamma observables with and degenerate, as well as for both McKay prior and the truncated Gamma prior considered by Armero & Bayarri (1994). Combining the density of with the likelihood, we obtain that
| (4.36) |
We also have
which implies that
| (4.37) |
with defined in (4.35) and given in (4.36). From (3.4), we therefore infer that the posterior distribution admits the representation
| (4.38) |
as given by (4.36) and (4.37). As mentioned above, the above representation applies to McKay distributed priors (taking ), as well as the truncated Gamma priors of Armero & Bayarri (taking ). However, despite its conciseness, this last representation (4.38) remains rather unwieldy due to the density term.
Degenerate case of the mixtures , i.e., with in Definition 4.1, are not particularly interesting when the joint prior distribution for and factorizes into independent components (e.g., as in Corollary 4.1), since the inference problem separates completely into two univariate independent problems. It is also not admittedly the focus of the mixture models considered in this paper. However, for non-independent components and such as the situation here, the Bayesian analysis is also interesting in the degenerate case. And, the above results applied to
yield immediately the posterior . This further connects to the McKay prior by taking and , and to the Armero & Bayarri prior by taking and . Furthermore, the latter work considers the change of variables for reasons of ease of interpretation, and properties of these transformed variables are briefly outlined in the Appendix below.
Turning now to the Bayesian predictive distribution for , still based on and prior , we have for (4.18), and making use of (4.36),
| (4.39) |
for , and with , and We thus infer that the predictive distribution of admits representation (4.17) with given in (4.39), and given in (4.37). Finally, the same remarks as above applies for the degenerate case with , In particular, the Bayesian predictive density for is given by , i.e., expression (4.39) with .
We now turn to a further illustration for models and priors that are bivariate gamma mixtures. A motivation for this is the flexibility to have prior components that are non-independent in addressing inference for the Kibble distribution parameters or more generally for Kibble type gamma mixtures (Definition 4.1). But, in contrast to the previous example, the dependence among the prior components arises not through an order constraint, but by the presence of a hierarchical commonality.
Corollary 4.2.
Consider type II mixtures as in (1.2) with and , and prior distribution . Then,
-
(a)
The posterior distribution of based on is , with the mixing density (or p.m.f.) is that of where has joint density (or p.m.f.) given by
(4.40) -
(b)
The predictive distribution for admits the representation
with (4.41) and
Proof. (a) From Theorem 4.2, we have
which is the density of a distribution having mixing density
This along with Theorem 4.2 tell us that the posterior distribution admits the representation
with , , and . Finally, we have by collecting terms and with an interchange in the order of integration:
| (4.42) | |||||
which is indeed (4.40).
(b) As in the proof of part (b) of Corollary 4.1, the result follows with the evaluation obtained in (4.42) and yielding (4.41). ∎
Remark 4.4.
The results of Corollary 4.2 are quite general and many particular cases follow, namely depending on the choices of mixing densities for the model and the prior. For degenerate mixing under the prior, i.e., , one recovers Corollary 4.1. For independent Gamma distributed observables with , Corollary 4.2 applies for the posterior distribution, but with and having density in (4.40). In this last case, Poisson or negative binomial distributed leads to results similar to those of Example 4.9. Finally, again with degenerate at , the predictive distribution in part (b) of Corollary 4.2 applies with under .
Example 4.11.
We consider Kibble models and priors as a particular application of Corollary 4.2. Namely, take , , as well as , as the mixing variables associated with and respectively. With p.m.f.’s and , we obtain in applying part (a) of Corollary 4.2 that
with , , and where is the Appell function of the fourth kind given by
Part (b) of Corollary 4.2 applies directly for the Bayesian predictive distribution with and derived from (4.41) or equivalently as the marginal p.m.f. of for the , which is given by
| (4.43) |
Remark 4.5.
The posterior distribution in Corollary 4.1 is conveniently expressed in terms of a mixture distribution with mixing variable based on joint density (or p.m.f.) given in (4.40). The previous example gives a more precise form for a negative binomial mixture. The properties of remain to be explored in general or for other specific choices of and . In terms of the posterior expectation, it follows readily from the above that:
In the context of Example 4.11, one obtains with standard manipulations that
with , , and .
Appendix
Here are some observations on the generalized McKay distribution with p.d.f. given in (4.34).
-
A.
With the transformation , one obtains the density
(4.44) From this, it follows immediately that
and then using the value of given in (4.35), we obtain the marginal density
Observe that we have independence between and iff , which includes the McKay case, and that whenever . We point out that, for , the above density for matches a generalized Beta distribution given by Chen & Novick (1984) with parameters , and p.d.f. . More generally, the density has appeared in Exton (1976), as well as in Armero & Bayarri (1994) where it is referred to as a Gauss hypergeometric distribution.
-
B.
The given expression for the normalization constant can be checked by integrating (4.44) via an expansion of the term in its MacLaurin series, and interchanging integrals and sum.
-
C.
The marginals densities of , which are gamma distributed for the McKay distribution, are given as follows:
for , using the identity which holds for and . Observe that for , as for , and that the additional specification leads us back to the McKay case.
For the marginal density of , we have
for , and with the change of variables , as well as the confluent hypergeometric identity , . Observe that for , while for using the identity for and .
-
D.
The moments are readily expressible in terms of the constant of normalization . For instance, it is easy to obtain the mixed moments
for and .
-
E.
For McKay distributed , the variables and are independently distributed. For the general case, it is easy to verify that we obtain conditional distributions that are Kummer type II, namely:
with independence iff .
Concluding remarks
For two common types of mixtures, we have provided analytical, novel and practical representations of Bayesian posterior and predictive distributions corresponding to a given prior distribution. By doing so, we have added to the catalogue of such Bayesian solutions which require little computation except recourse to some special but familiar functions and distributions. Specific model and prior distribution choices have been put to the forefront for illustrative purposes and for their practicality. These include inference for common non-central distributions (chi-square, Beta, Fisher), the distribution of the coefficient of determination in multiple regression models, mixtures of normal and exponential distributions, and bivariate gamma mixtures including the Kibble distribution.
Acknowledgements
Éric Marchand gratefully acknowledges the research support from the Natural Sciences and Engineering Research Council of Canada.
References
- [1] Aitchison, J. & Dunsmore, I.R. (1975). Statistical Prediction Analysis. Cambridge University Press.
- [2] Armero, C. & Bayarri, M. J. (1994). Prior assessments for prediction in queues. Journal of the Royal Statistical Society. Series D (The Statistician), 43, 139–153.
- [3] Amaral, M.A. & Dunsmore, I.R. (1980). Optimal estimates of predictive distributions. Biometrika, 67, 685-689.
- [4] Barndorff-Nielsen, O.E., Kent, J. & Sørensen, M. (1982). Normal variance-mean mixtures and z-distributions. International Statistical Review, 50, 145–159
- [5] Bulgren, W. G. (1971). On representations of the doubly non-central F distribution. Journal of the American Statistical Association, 66, 184–186.
- [6] Chen, J.J. & Novick, M.R. (1984). Bayesian analysis for binomial models with generalized Beta prior distributions. Journal of Educational and Behavioral Statistics, 9, 163–175.
- [7] Exton, H. (1976). Multiple Hypergeometric Functions and Applications. Horwood.
- [8] Hamza, M. & Vallois, P. (2016). On Kummer’s distribution of type two and a generalized beta distribution. Statistics & Probability Letters, 118, 60–69.
- [9] Iliopoulos, G., Karlis, D. & Ntzoufras, I. (2005). Bayesian estimation in Kibble’s bivariate gamma distribution. Canadian Journal of Statistics, 33, 571-589.
- [10] Johnson, N.L., Kotz, S. & Balakrishnan, N. (2000). Continuous multivariate distributions, Volume 1: Models and Applications, 2nd edition, John Wiley & Sons, New York.
- [11] Johnson, N.L., Kotz, S. & Kemp, A. (1995). Discrete univariate distributions, 2nd edition, John Wiley & Sons, New York.
- [12] Jones, M. C. & Marchand, É. (2019). Multivariate discrete distributions via sums and shares. Journal of Multivariate Analysis, 171, 83-93.
- [13] Kibble, W. F. (1941). A two-variate gamma-type distribution. Sankhya, 5, 137–150.
- [14] Kubokawa, T., Marchand, É. & Strawderman, W.E. (2017). A unified approach to estimation of noncentrality parameters, the multiple correlation coefficient, and mixture models. Mathematical Methods of Statistics, 26, 134-148.
- [15] Kubokawa, T., Marchand, É. & Strawderman, W.E. (2015). On predictive density estimation for location families under integrated squared error loss. Journal of Multivariate Analysis, 142, 57–74.
- [16] Landriault, D., Moutanabbir, K. & Willmot, G. (2015). A note on order statistics in the mixed Erlang case. Statistics & Probability Letters, 106, 13–18.
- [17] Laurent, S. (2012). Some Poisson mixtures distributions with a hyperscale parameter. Brazilian Journal of Probability and Statistics, 26, 265–278.
- [18] Lindley, D. & Singpurwalla (1986). Multivariate distributions for the life lengths of a system sharing a common environment. Journal of Applied Probability, 23, 418–431.
- [19] Marchand, É. (2001). Point estimation of the coefficient of determination. Statistics & Decisions, 19, 137–154.
- [20] McKay, A.T. (1934). Sampling from batches. Supplement to the Journal of the Royal Statistical Society, 1, 207–216.
- [21] Muirhead, R.J. (1982). Aspects of multivariate statistical theory. Wiley, New York.
- [22] Nayak, T.P. (1987). Multivariate Lomax Distribution: Properties and Usefulness in Reliability Theory. Journal of Applied Probability, 24, 170–177.
- [23] Ong, S. H. & Lee, P. A, (1979). The noncentral negative binomial distribution. Biometrical Journal, 7, 611–627.
- [24] Patnaik, P.B. (1949). The noncentral chi-square and F distributions and their applications. Biometrika, 36, 202–232.
- [25] Petropoulos, C. (2017). Estimation of the order restricted scale parameters for two populations from the Lomax distribution. Metrika, 80, 483–502.
- [26] Saxena, K.M. & Alam, K. (1982). Estimation of the non-centrality parameter of a chi-squared distribution. Annals of Statistics, 10, 1012–1016.
- [27] Tiwari, R., Chib, S. & Jammalamadaka, S. R. (1989). Bayes estimation of the multiple correlation coefficient. Communications in Statistics: Theory and Methods, 18, 1401–1413.
- [28] Wicksell, S.D. (1933). On correlation functions of type III. Biometrika, 25, 121–133.