Anisotropic relaxation in NADH excited states studied by polarization-modulation pump-probe transient spectroscopy
Abstract
We present the results of experimental and theoretical studies of fast anisotropic relaxation and rotational diffusion in the first electron excited state of biological coenzyme NADH in water-ethanol solutions. The experiments have been carried out by means of a novel polarization-modulation transient method and fluorescence polarization spectroscopy. For interpretation of the experimental results a model of the anisotropic relaxation in terms of scalar and vector properties of transition dipole moments and based on the Born-Oppenheimer approximation has been developed. The results obtained suggest that the dynamics of anisotropic rovibronic relaxation in NADH under excitation with 100 fs pump laser pulses can be characterised by a single vibration relaxation time laying in the range 2–15 ps and a single rotation diffusion time laying in the range 100–450 ps a subject of ethanol concentration. The dependence of the times and on the solution polarity (static permittivity) and viscosity has been determined and analyzed. Limiting values of an important parameter describing the rotation of the transition dipole moment in the course of vibrational relaxation has been determined from experiment as function of the ethanol concentration and analyzed.
I Introduction
Transient absorption spectroscopy is widely used nowadays as a powerful tool for investigation of ultrafast photoinduced processes of electron and proton transfer, isomerization, and excited state dynamics. These studies have received considerable interest within broad scientific community because the dynamics of elementary physical and chemical processes in the gas and condensed phases can be followed in real time by femtosecond pump-probe spectroscopy Mukamel95 ; Berera09 ; Henriksen14 ; Zhu15 ; Fisher16 . Ultrafast transient absorption spectroscopy of biologically relevant molecules allows to reach a previously inaccessible level of understanding of dynamics of intra- and intermolecular interactions including relaxation in the ground and excited states, nonradiative recombination, electron and energy transfer, etc Fleming96 ; Cohen03 ; Ewing14 ; Heiner13 ; Heiner17 .
Excited state dynamics in biologically relevant molecules is closely related to fast anisotropic relaxation and rotation diffusion processes, that can be successfully studied by multiphoton polarized fluorescence spectroscopy Lakowicz97a ; Couprie94 ; Vishwasrao06 ; Denicke10 ; Blacker13 ; Herbrich15 ; Sasin18 , or by polarization-resolved pump-probe ultrafast spectroscopy Levenson79 ; Hochstrasser96 ; Beck98 ; Jonas01 ; Wiersma01 ; Fayer05 ; Jonas08 ; Fenn09 ; Jonas11 ; Tros15 ; Corrales16 ; Rumble19 ; Hunger19 . In both cases a linearly polarized pump pulse resonantly promotes ground state molecules to an excited electronic/vibrational state thus producing an anisotropic distribution of excited molecular axes/bonds that becomes isotropic as a function of time due to random orientational motion of the molecules and relaxation processes. Within the pumpe-probe procedure a real time anisotropy decay is measured by absorption change of a delayed probe pulse that is polarized either parallel, or perpendicularly to the pump pulse:
| (1) |
where is the anisotropy and is a delay time between the pump and probe pulses. The nominator in eq.(1) is the linear absorption dichroism of the probe beam.
Anisotropic relaxation and rotation diffusion decay times that can be determined in these experiments are of great importance for understanding of complicated biochemical processes in living cells and tissues. For instance, the rotation diffusion times under certain conditions are proportional to solution viscosity ZEWAIL79 and therefore can be used for determination of local intracellular and extracellular viscosity Wiersma01 . Moreover, the decay times and other fluorescence/probe signal parameters depend in general on the location of a fluorophore inside or outside cells and on intracellular processes occurring and therefore can be used as noninvasive markers of cellular energy metabolism Schaefer19 .
An important problem in recording of the excited state absorption dichroism in eq.(1) is a relatively small signal-to-noise ratio because transient probe beam intensity transmitting through the experimental sample and pointing a photodetector is usually much larger than each of the absorption intensities and and moreover than their difference . Due to relatively high amplitude fluctuations of a femtosecond laser output the noise in a recording system caused by the probe beam detection can become comparable with the absorption intensities and even larger.
As absorption signal is proportional to the absorbing molecules concentration and to the laser pulse energies, the major number of the transient spectroscopy experiments have been carried out till now either used relatively high energy laser pulses of several tens, or hundreds of and more (see, e.g. Hochstrasser96 ; Ewing14 ; Corrales16 ; Hunger19 , or probed condense state or ground state molecules Fleming96 ; Beck98 ; Jonas01 ; Wiersma01 ; Jonas08 ; Fenn09 ; Tros15 .
As pointed out by Jonas et al Fleming96 a low pump and probe pulse energies (typically less than a ) are required in experiments with biological samples to prevent sample bleaching and damaging by laser light. The problem of decreasing of signal-to-noise ratio was solved by several groups for various pump-probe experimental schemes.
Jonas et al. Fleming96 used a balanced detection scheme included probe and reference beam channels combined with the pump beam amplitude modulation by a chopper and detection of the modulated transient signal with a lock-in detector. Fenn et al Fenn09 successively measured and using a polarizer placed in the probe beam, and averaged many successive parallel and perpendicular measurements. Tros et al Tros15 suggested an improvement of the approach Fenn09 by measuring and alternately on a shot-to-shot basis. In this way, the IR fluctuations at much smaller frequencies than the pulse repetition rate (about 1 kHz Tros15 ) effectively canceled out, resulting in a better signal-to-noise ratio. However, in that case a higher frequency noise still contributes to the measured anisotropy in eq.(1).
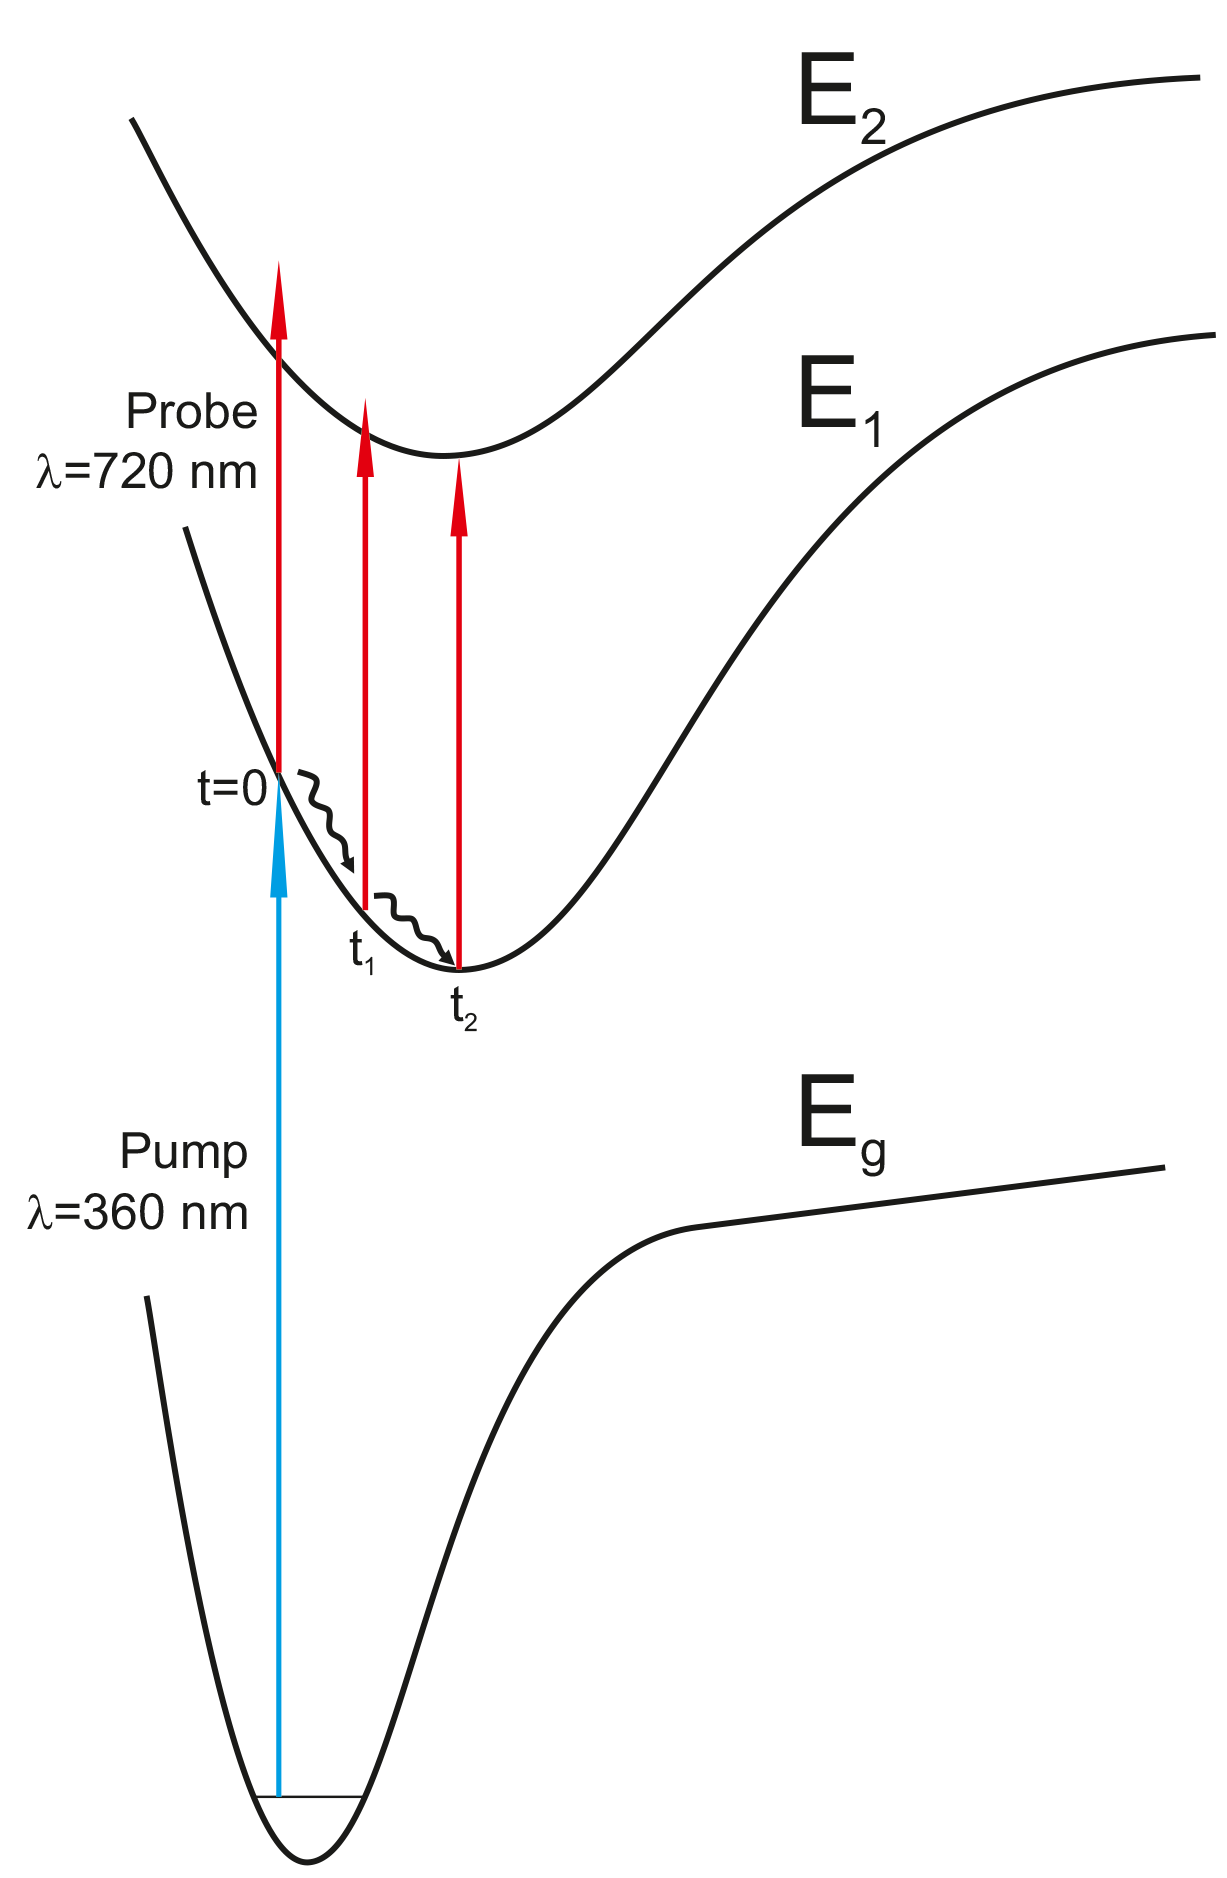
This paper presents the results of our study of anisotropic relaxation in the first excited state of biological coenzyme NADH (reduced nicotinamide adenine dinucleotide) in ethanol-water solutions by means of fluorescence polarization spectroscopy and a novel polarization-modulation transient method. The method utilizes the geometry of the optical Kerr effect (OKE) experiments Levenson79 ; Wiersma01 where the pump and probe beams pass collinearly through the sample with their linear polarizations directed at 45∘ to each other. Unlike most of the OKE studies reported till now in our experiment both pump and probe beams optical frequencies were in resonance with molecular transitions and therefore the interpretation of the results obtained could be done in a way similar to that used for conventional pump-probe polarization experiments Fleming96 . Linearly polarized pump beam resonantly promoted ground state NADH molecules to the first electronic excited state and produced the excited state axes/bonds alignment that was detected by recording of the absorption linear dichroism of the probe beam on the optical transition from the first to the second excited state as shown in Fig.1.
The method significantly enhances the accuracy of transient polarization-sensitive measurements and can be used for investigation of excited state dynamics in biological molecules at a less than nJ level of pump pulse energy.
Coenzyme NADH is one of the most important biological molecules, since it plays an active role in redox reactions in living cells. Possessing intense fluorescence NADH is widely used as a natural fluorescence marker for studying biochemical processes in living cells. Up to now, a number of time-resolved fluorescence studies have been carried out in NADH in solutions and cells (see e.g. Freed67 ; Hull01 ; Vishwasrao06 ; Blacker13 ; Sasin19 ; Vasyutinskii17 ; Blacker19 ; Schaefer19 ). NADH has complicated excited state photodynamics possessing two chromophore groups: nicotinamide and adenine that can interact with each other under certain conditions Schaefer19 . This dynamics was investigated recently by Heiner et al Heiner13 ; Heiner17 using the transient absorption spectroscopy.
However, despite of numerous studies, energy transfer processes in the excited states of NADH are currently far from clear understanding. To the best of our knowledge no transient polarization-sensitive studies have been carried out till now.
In this paper the fluorescence polarization spectroscopy and the polarization-modulation transient method were used for studying of fast anisotropic relaxation and rotational diffusion in the first electronic excited state of biological coenzyme NADH (nicotinamide-adenine-dinucleotide) in aqueous-ethanol solutions in a temporal range from sub-picoseconds to several nanoseconds. The results obtained suggest that anisotropic ro-vibronic relaxation under excitation with 100 fs pump laser pulses can be characterised by a single vibration relaxation time laying in the range 2–15 ps and a single rotation diffusion time laying in the range 100–450 ps a subject of ethanol concentration. A model of the anisotropic relaxation in terms of scalar and vector properties of transition dipole moments and based on the Born-Oppenheimer approximation has been developed.
The paper is organised as follows. Section II describes the quantum mechanics-based expressions for experimental signals that justify the physical interpretation of the polarization-modulation transient method developed. Section III describes the details of the experimental procedure used. The experimental results obtained are collected in Sec. IV. Discussion of the results obtained and their interpretation are given in Section V. The conclusions are given in Sec. VI. The calculation details are collected in Appendix.
II Theory
An expression describing the transient polarization signals observed in our experiments is based on the excitation scheme shown in Fig.1 suggesting that linearly polarized pump beam resonantly promotes ground state molecules to the first electronic excited state and produces the excited state axes/bonds alignment that is detected by recording of the probe beam absorption linear dichroism on resonant transitions from the first to the second excited state. In the case of NADH, the first excited state refers to the excitation of the nicotinamide chromophore group via the absorption band centered at about 340 nm and the second excited state refers to the excitation of the adenine chromophore group via the absorption band centered at about 260 nm.
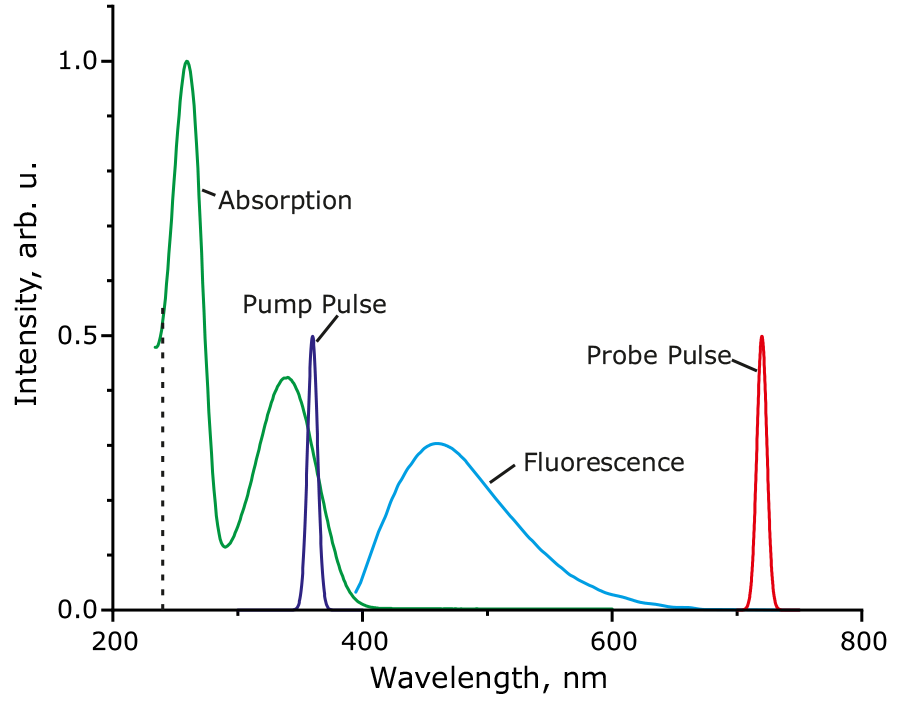
Absorption and emission spectra of NADH are given in Fig.2. The fluorescence band in this Fig.2 centered at about 460 nm occurs due to spontaneous emission from the excited nicotinamide group to the ground electronic state Schaefer19 . Sharp spectral profiles at 360 and 720 nm in Fig.2 represent the pump and probe pulses, respectively and the vertical dashed line indicates the maximum available energy achieved by two-photon excitation from the ground state at the delay time . At the delay times the wave packet in the first excited state moves down toward the equilibrium nuclear configuration point due to vibration relaxation processes as schematically shown in Fig.1 and the available excitation energy is shifted down below the dashed line in Fig.2.
According to the analysis of Jonas et al Fleming96 the signal in pump-probe spectroscopy can be presented as a sum of signals from three sources: signals from ground state depletion, signals from excited state stimulated emission, and signals from excited state absorption. As can be shown in the conditions of our experiments only the signals from excited absorption contribute to the experimental signals. Indeed, one can conclude from Fig.2 that the probe beam at 720 nm does not have enough energy to excite the ground state molecules alone and therefore, could not probe the ground state depletion at the times when the pump and probe pulses do not overlap. Also, as can be seen in Fig.2 the probe beam locates well outside of the fluorescence band and therefore contribution from excited state stimulated emission can also be not accounted for.
Therefore, the theoretical treatment presented below takes into account only probe beam absorption from the first to the second excited states in Fig.1. The theory is restricted to the relatively large delay times when overlap between the pump and probe pulses can be neglected.
The proposed theoretical model is essentially quantum mechanical and based on the spherical tensors approach Blum96 . A general case of excitation of an ensemble of asymmetric top molecules by two laser pulses has been considered.
We denote and the molecular total angular momenta of the ground, first, second excited states and their projections onto the laboratory axis Z, respectively. Interaction between the molecular electric dipole moment and the incident pump and probe laser beams can be written in a usual form as scalar products: , , where and are ground and excited state molecular dipole moments, and and are pump and probe light polarization vectors, respectively.
In the Born-Oppenheimer approximation the molecular wave functions can be presented as a product of the electronic , vibration , and rotation wave functions:
| (2) |
| (3) |
where and
| (4) |
are asymmetric top rotation wave functions Zare88b where is a Wigner -function, the Euler angles specify the direction of a molecular general axis, is a body frame projection of the angular momentum , and is an expansion coefficient.
Combining the density matrix expressions for single photon transitions Blum96 and after some transformations of the angular momentum algebra the expression for the probe beam absorption can be presented in the form (see Appendix A):
| (5) | |||||
where is a constant proportional to the pump beam intensity, is a first excited state lifetime, is a weighting coefficient, is a spherical component of the molecular dipole moment onto the body axis with , and is a Clebsch-Gordan coefficient Zare88b .
The term in eq.(5) is the ground state molecular population defined as:
| (6) |
The term in parenthesis in the first line in eq.(5) is a scalar product, where are light polarization density matrices Zare88b of the pump and probe light:
| (7) |
The function in eq.(5) describes rotation diffusion of anisotropic distribution of excited molecule axes and can be written in the form Shternin10 :
| (8) |
where are are the expansion coefficients of the diffusion operator eigenfunctions over the Wigner -functions and is a rotation diffusion time.
Equation (5) was derived assuming that duration of the laser pulses is much shorter than the characteristic time of nuclear evolution and that the time of the pump pulse is and the time of the probe pulse is .
Sum over in the first line in eq.(5) takes into consideration several different possible excited state lifetimes that is common for big organic and biological molecules Lakowicz97a . Sum over in eq.(8) takes into account several possible different rotation diffusion times . The number of rotation diffusion times depends on the molecular symmetry and can be as much as Shternin10 . In case of NADH, the results of fluorescence experiments Couprie94 ; Vishwasrao06 ; Blacker13 ; Vasyutinskii17 suggest that the fluorescence decay in solutions can usually be characterized satisfactory with two isotropic decay times , and a single rotation diffusion time .
Transition dipole moments matrix elements in the last line in eq.(5) with electron and vibration wave functions shown in eq.(3) contain integration over all electron and nuclear coordinates and over the spectral profiles of the pump and probe pulses and . Assuming ”instant” optical excitation with short laser pulses from the ground state to the first excited state PES as shown in Fig.1 the matrix elements of the dipole moment are independent of time and calculated at . Within the model used that assumes the validity of the Born-Oppenheimer approximation the evolution time of the electron wave functions is neglected, while the evolution time of the relaxed nuclear wave functions in the matrix elements of the dipole moment is accounted for. Therefore we assumed that the wave functions in eq.(5) depend on nuclear coordinates and time : with boundary condition . The vibration wave function can be expanded over the state 1 vibrational eigenfunctions as follows:
| (9) |
where are expansion coefficients and the indices label the vibrational energy states of the electronic state 1 that form the vibrational density matrix .
The diagonal elements of the density matrix describe the population of the corresponding vibration energy levels during vibrational relaxation and the off-diagonal matrix elements describe quantum beats that we not observed in this experiment. Therefore, in the following we will neglect the off-diagonal density matrix elements for simplicity, however if needed they can be readily taken into account.
If the transition matrix elements in eq.(5) are written in the ”pump” frame where the body frame axis Z is parallel to the dipole moment , then , and the indices can in general take all possible values .
The probe transition matrix elements in eq.(5) can be also calculated in the ”probe” frame where the body frame axis Z is parallel to the dipole moment . If the direction of the transition dipole moment is specified by the polar angles with respect to the transition dipole moment , the in eq.(5) is given by:
| (10) |
where is the dipole moment component in the ”probe” frame and is a complex conjugated Wigner -function.
Using eq.(10) and combining two -functions and a Clebsch-Gordan coefficient in eq.(5) one can readily show that:
| (11) | |||||
where is a Legendre polynomial of the order =0, or 2.
The expression in eq.(11) is valid if and the Wigner -function does not depend on the angle assuming that the interaction with surrounding molecules is isotropic.
After substitution of eq.(9) into eq.(5) and taken into account eq.(10) the time-dependent expression for the probe beam absorption intensity in eq.(5) can be presented in the form:
| (12) |
where
| (13) |
and
| (14) | |||||
The matrix elements of the dipole moment in eq.(14) are written in the ”pump” frame and the matrix elements of the dipole moment in eq.(13) are written in the ”probe” frame. The -functions in eqs. (13) and (14) indicate the validity of the energy conservation in optical transitions, they appear due to presentation of the transition dipole moment matrix elements with respect to the Fermi golden rule Messiah63 .
The term in eq.(13) describing the anisotropy of a two-photon process as function of the angle between the pump and probe transition dipole moments is well known and widely used for interpretation of the fluorescence Lakowicz97a , and pump-probe Fleming96 experimental results. In this paper it was derived as a result of formal quantum mechanical treatment, where the angle depends on time as function of the nuclear configuration. The angular brackets in mean averaging over the molecular excited state vibronic distribution.
Using the particular values of the light polarization matrix Zare88b in eq.(12) the expression for probe beam linear absorption dichroism in NADH can be presented in the usual form:
| (15) |
where the pump light is assumed to be linearly polarized along axis X, is the isotropic component of the absorption intensity, are the lifetimes of the excited state of the molecule, and is the anisotropy coefficient.
For symmetric top molecules, the coefficient can be written in the form:
| (16) |
The anisotropy coefficient in eq.(16) depends on time due to contribution from two effects. The first one is rotational diffusion, which is due to dispersion of the distribution of molecular axis directions:
| (17) |
and the second effect is due to a change in the direction of the molecular dipole moment caused by vibrational relaxation described by the time-dependence of the angle .
In general for calculating the probe beam dichroism in eq.(15) having in mind eq.(13) one should perform quantum chemical computations of electronic and vibrational distributions in the first three electron energy states of NADH in solution and to solve the corresponding Liouville equation for the vibration density matrix .
In this paper for interpretation of the experimental results we use a simple model based on the quantum relaxation theory Blum96 . Within this model temporal evolution of the nuclear subsystem occurs due to interaction with a thermostat containing the electron molecular subsystem and collision interactions. The model based on the Born-Oppenheimer approximation suggests that an excited electron configuration produced by absorption of a very short laser pulse ”instantly” forms the molecular state 1 potential energy surface and that following nuclear relaxation occurs within under the action of internal interaction between molecular vibration modes and external interactions in solution.
The total Hamiltonian of the system can be written as , where is the Hamiltonian of the nuclear subsystem, in the Hamiltonian of the thermostat, and is interaction between them. The interaction operator is: , where is the PES of the electronic state 1 calculated in a standard way within the Born-Oppenheimer approximation, is the average potential of intramolecular vibrational interactions and is the average potential of interaction with external molecules.
We assume that the excitation to the state 1 at results in vibrational wave packet described by the density matrix and the following relaxation occurs as shown schematically in Fig.1. Within the Markovian approximation that is appropriate in our experimental conditions the relaxation of the multi-level vibration system in state 1 can be characterised by the relaxation time that is assumed to be much longer than fast vibrations of the molecular system. The vibrational relaxation time is determined both by the dephasing of vibrational modes and the damping due to interaction with the surrounding solvent. Within this approximation the term in eqs.(13) and (16) can be presented in an approximate form:
| (18) |
where the time-independent terms and specify the values of the term at the nuclear configurations refer to the initial molecular state at and state 1 (at ), respectively: , .
The developed model allows for characterisation of the dichroism signal temporal dependence with the times of rotational diffusion and vibrational relaxation .
III Experimental section
III.1 Experimental approach
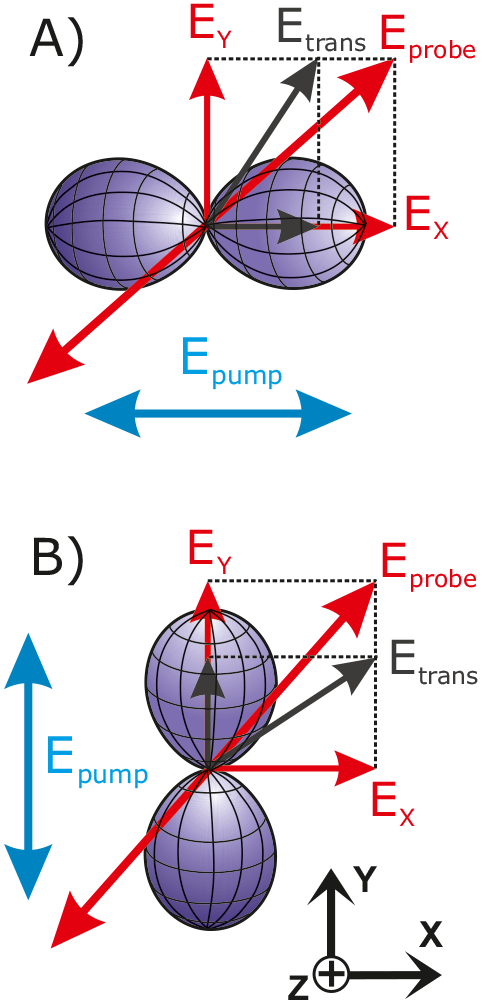
A) Pump beam is linearly polarized along axis X.
B) Pump beam is linearly polarized along axis Y.
The pump-probe experimental geometry used in this paper is shown schematically in Fig.3 where the pump and probe beams are both linearly polarized and propagate collinearly along axis Z. The duration of the pump and probe pulses was about 100 fs with a repetition rate of 80 MHz. The pump beam at 360 nm resonantly promoted ground state NADH molecules to the first electronic excited state referred to the nicotinamide chromophore group and produced the excited state axes/bonds alignment. The pump pulse train polarization was modulated by a photoelastic modulator at 100 kHz and oscillated between vertical (Y) and horizontal (X) positions shown in Figs.3A and 3B.
The alignment was detected by recording of the linear dichroism of the probe beam at 720 nm that was linearly polarized on 450 to the axis Y. The probe beam transferred the molecule to the higher laying electronic excited states related to the adenine chromophore group as shown in Figs.1 and 2. No probe beam absorption was detected in the absence of the pump beam.
As can be seen in Fig.3 the alignment of the excited state molecular axes produced by the pump beam led to different absorption of the and probe beam polarization components. Therefore, the polarization of the probe beam passed through the experimental sample oscillated about its initial position at 450 with the frequency of 100 kHz with respect to the oscillation of the pump beam polarization. The difference absorption at the frequency of 100 kHz was recorded by a sensitive balanced detection scheme.
Therefore, in the conditions of our experiment the scalar product of two light polarization matrices in eq.(12) oscillated as the modulation frequency 100 kHz. As shown in Appendix B the pump beam polarization modulated as:
| (19) |
where the phase results in the following transformation of eq.(15):
According to eq.(III.1) the dichroism signal was recorded in our experiments at the modulation frequency oscittating in quadrature to the reference modulation signal .
Significant efforts have been undertaken to achieve the best-possible sensitivity of the method. The peculiar features of the method realization were: high-frequency modulation of the pump pulse train polarization at 100 kHz following by the separation of the anisotropic contribution to the signal using a highly-sensitive balanced detection scheme, a differential integrator, and a lock-in amplifier recording the absorption change at the modulation frequency of 100 kHz in a very narrow frequency bandwidth of a few Hz. As a result, the method allowed for investigation of excited state dynamics in NADH at a less than nJ level of pump pulse energy.
III.2 Materials
-NADH (reduced nicotinamide adenine dinucleotide) disodium salt was shipped from Sigma–Aldrich. NADH was deluted in water-ethanol mixture at thirteen different volume proportions from 0 to 95%. The ethanol purity was 96% as determined by refractive index measurements. NADH powder was dissolved in distilled water in concentration of about 20-30 mM and then added to a previously prepared water-ethanol mixture. NADH concentration in solution was in all cases maintained at 0.1 mM that resulted in less than 10% absorption of the pump light thus preventing saturation effect. Each solution were prepared fresh daily at room temperature.
III.3 Steady-state measurements
The absorption and fluorescence spectra of NADH (see Fig.2) were recorded with a spectrophotometer and spectrofluorimeter before to monitor the optical density and chemical stability of the solutions. The optical density of the solution was monitored during the entire measurement. The change in the pump beam absorption was negligible during the course of the measurements.
III.4 Pump-probe spectroscopy measurements
The schematic of the experimental setup used for our pump-probe polarization experiments that was already discussed in our recent publication Gorbunova20 is shown in Fig.4. A femtosecond Ti:Sapphire oscillator (MaiTai HP, Spectra Physics) without an optical amplifier tunable in the spectral range 720 - 800 nm was used as a light source. The laser pulse duration was about 100 fs and a 8 nm bandwidth. The pulse repetition rate was 80 MHz. The fundamental laser output with intensity of 2 W passed through an attenuator to set the pump power and then was split into pump and probe beams.
The pump beam at 360-400 nm was produced by frequency doubling by a second harmonic generator (SHG) (Inspire Blue, Spectra Physics). After SHG the pump beam travelled through a photoelastic modulator (PEM) (PEM-100, Hinds Instruments) operating at the frequency of 50 kHz, that periodically switched the direction of the pump pulse train polarization plane from vertical (Y) to horizontal (X) positions at the frequency of 100 kHz. After PEM the pump beam was focused by a lens through a dichroic mirror (DM) onto the center of a 1 mm passlength quartz cuvette to a 10 m spot size. NADH solution circulated through the cuvette by a peristaltic pump at a flow speed of 0.2 m/s to prevent NADH photobleaching. The energy of the pump pulses entering the cuvette was about 2 nJ.
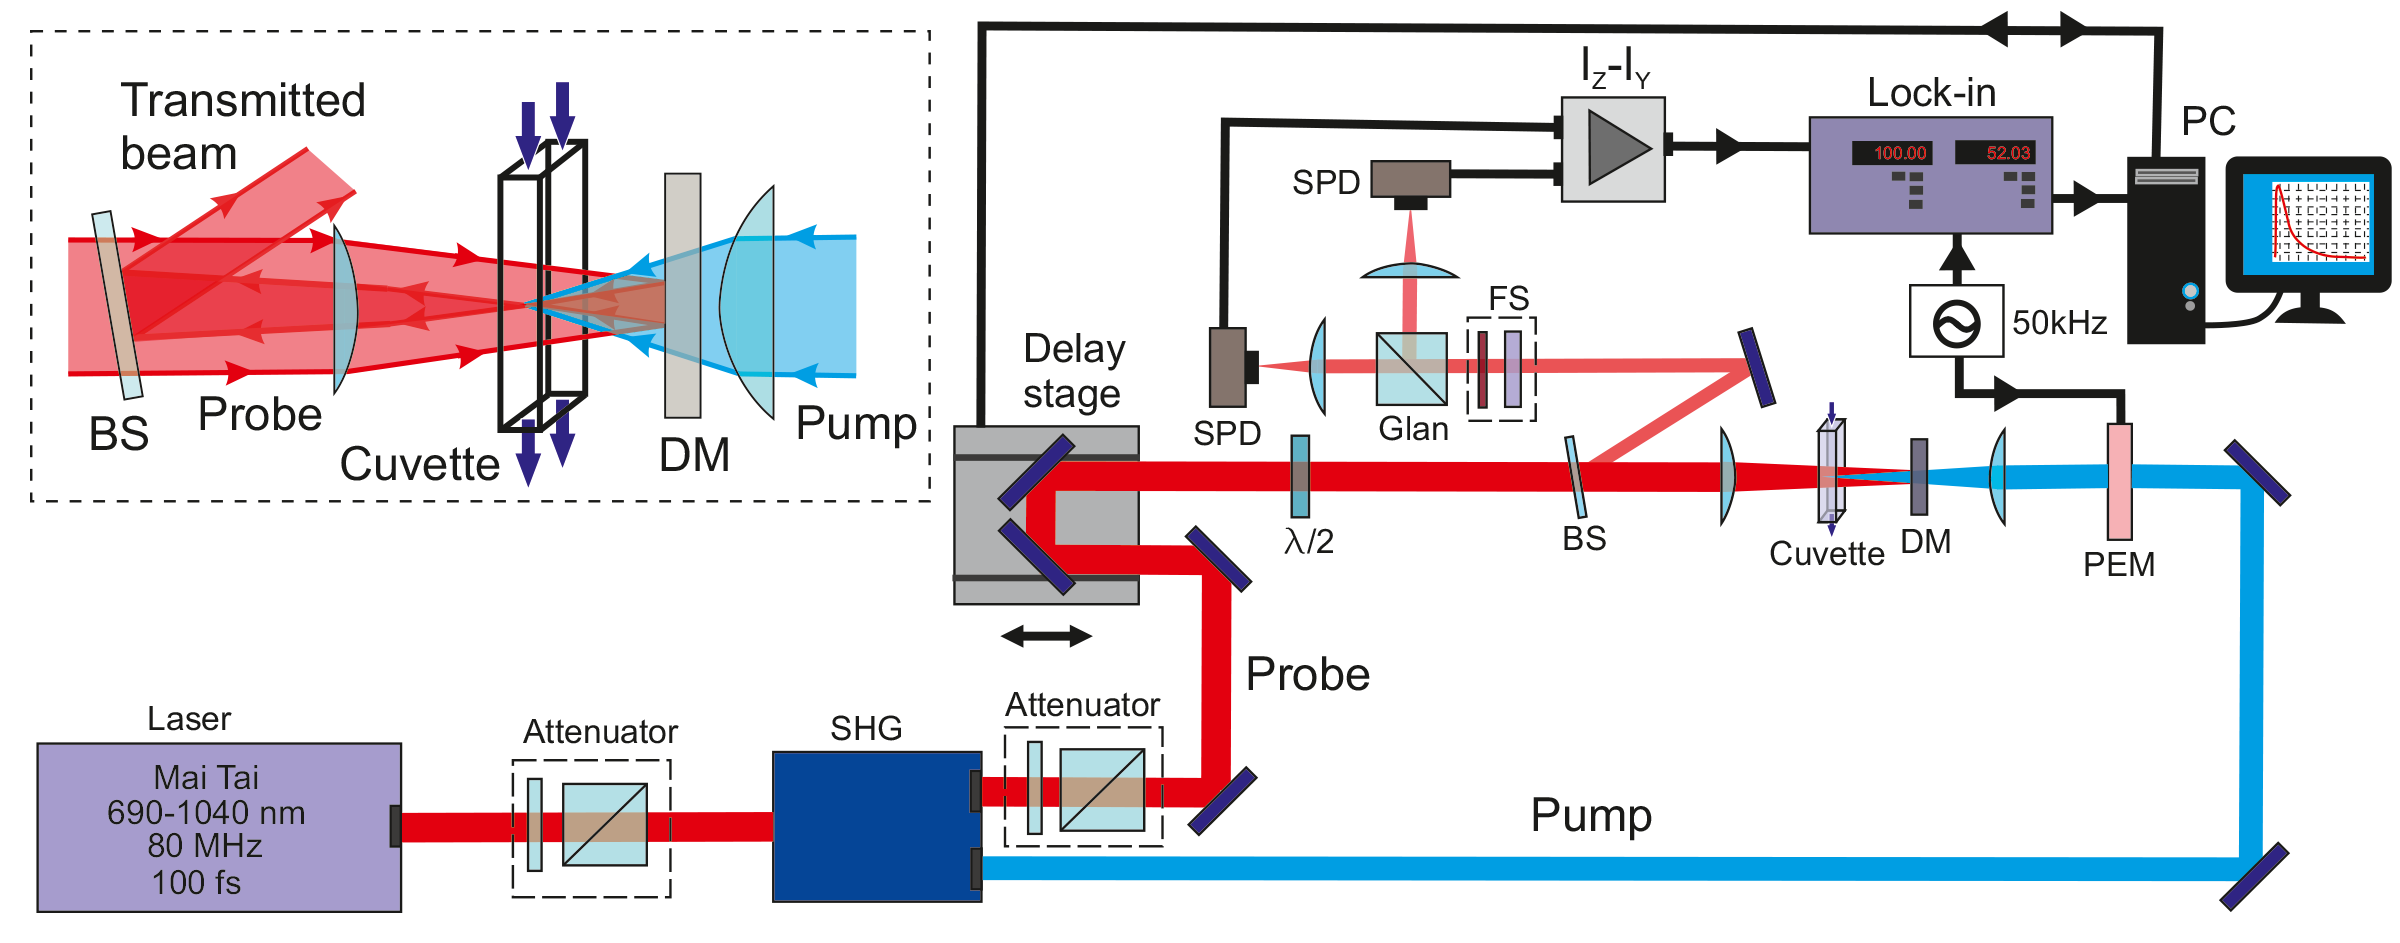
The fundamental output of the laser at 720-800 nm was used as a probe beam. The probe beam passed successively through an attenuator and a motorized delay stage producing the probe pulse delay of the time with respect to the pump pulse. The probe light polarization plane was fixed at 45∘ to Y axis by a zero-order phase plate and then passed through a beamsplitter (BS) and was focused by a lens. As shown in inset in Fig.4 the probe beam passed through the absorption cuvette and then was reflected back by DM and focused onto the cuvette center. The probe beam spot size on the cuvette was about 20 m. The focal regions of the beams overlapped considerably only when the probe beam was reflected back from the DM, therefore the beams interacted with NADH molecules mainly when they propagated inside the absorption cuvette in parallel to each other. The probe pulses energy on the cuvette was about 0.5 nJ.
The transient probe beam exited the cuvette was reflected by a BS and then directed to a Glan prism (Glan) that separated two orthogonally polarized polarization components and . To avoid the pump light scattering into the detection channel, a filtration system (FS) consisted of a dichroic mirror and an absorption filter was placed in front of Glan.
The probe beam polarization components and separated by Glan were recorded by a balanced detection scheme consisted of two identical silicon photodiodes (SPD) (DET10A/M, ThorLabs) and a differential integrator (DI) with a passband of 0-–4 MHz. The balanced scheme was adjusted to have zero output electric signal when the pump beam was tuned off and therefore effectively cancelled fluctuations in the probe beam amplitude and in the solution density. The output differential signals of DI amplitude-modulated at 100 kHz were fed to a lock-in amplifier (LOCK-IN) (SR844 RF, Stanford Instruments) with a narrow frequency bandwidth of 3 Hz and then collected and analysed by a computer.
III.5 Polarised fluorescence spectroscopy measurements
The method of polarized fluorescence spectroscopy was also used in this paper for complementary determination of the isotropic delay times and , corresponding weighting coefficients and , and the rotation diffusion time at large time scales. These experiments were carried out with the experimental setup discussed in detail in our recent publications Herbrich15 ; Sasin18 .
IV Experimental results
IV.1 Experimental signals
A typical experimental signal observed in NADH in water solution at 0.1 mM concentration is shown in Fig. 5. As can be seen the signal contains a high narrow peak at relatively small delay times less than with a wing having a much wider and smaller maximum at lager delay times. The narrow peak is shown in the inset in Fig. 5 in an extended scale.
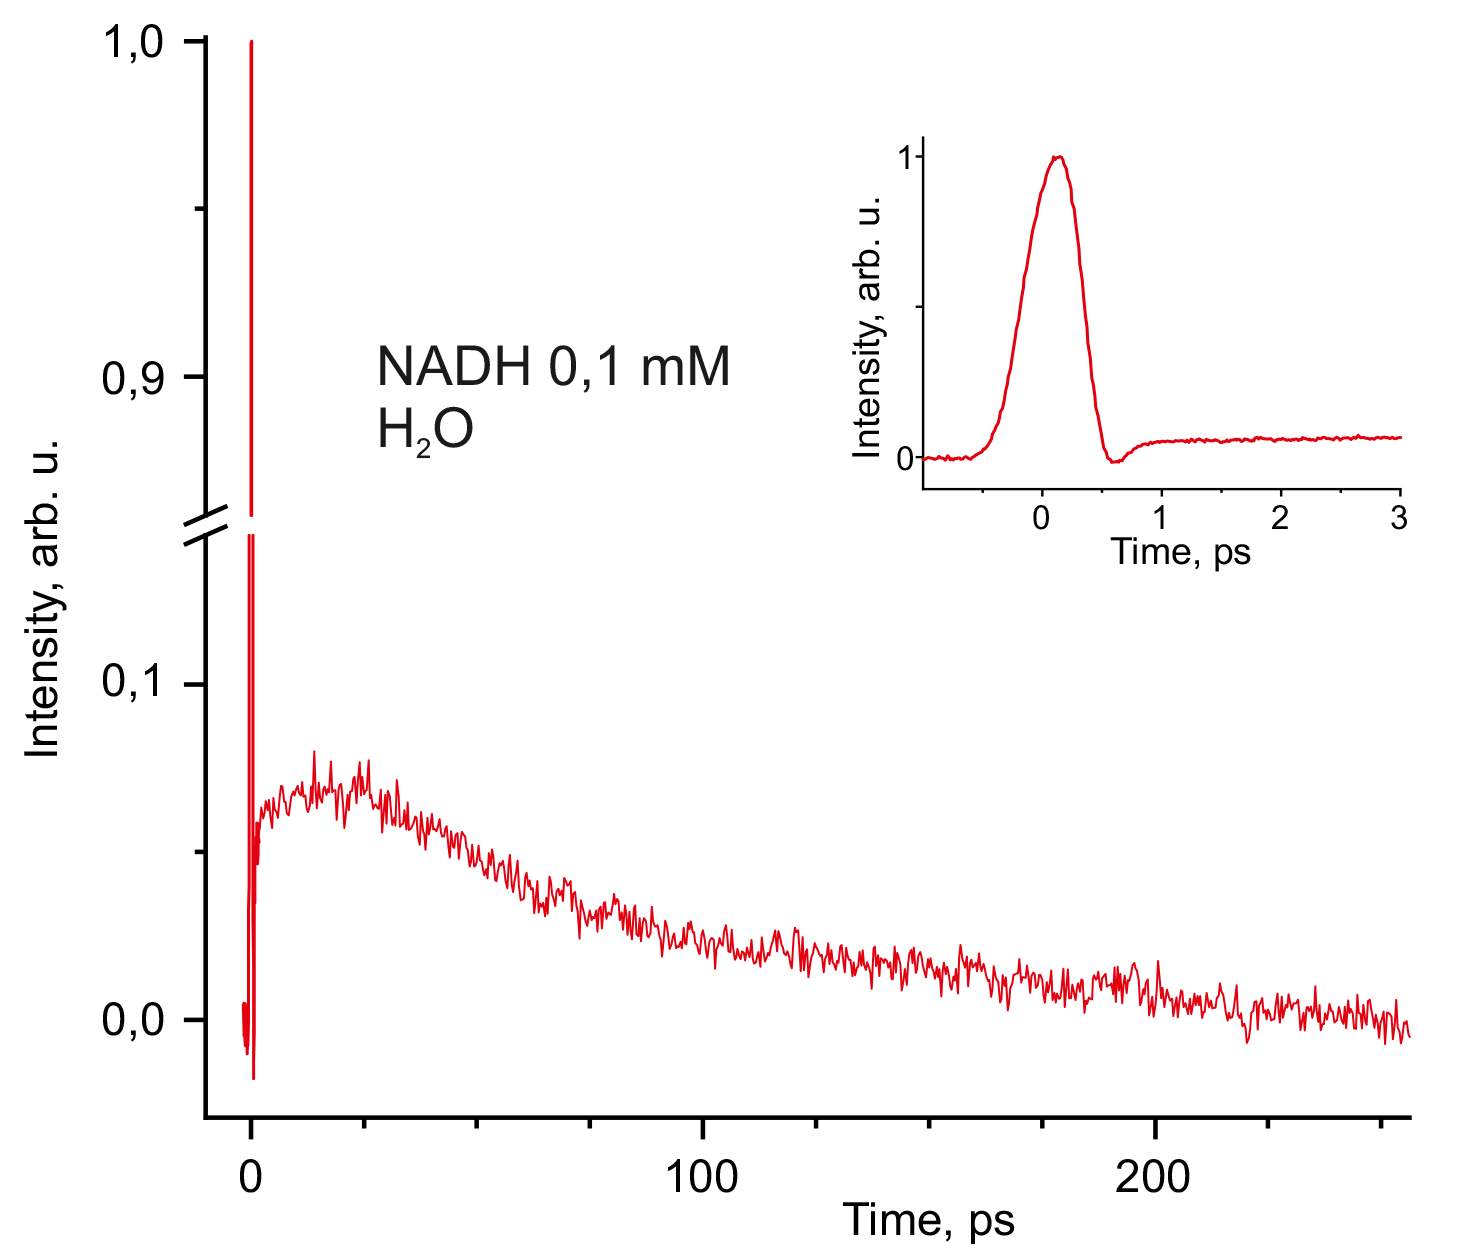
Similar peaks were also observed in pure water and all water-ethanol solutions did not containing NADH. The corresponding peak recorded in water is shown in Fig.6. As can be seen in Fig.6 and was proved in our experiments in ethanol-containing solutions, these peaks contain no longer-time wing, the wing was observed in NADH-containing solutions only.
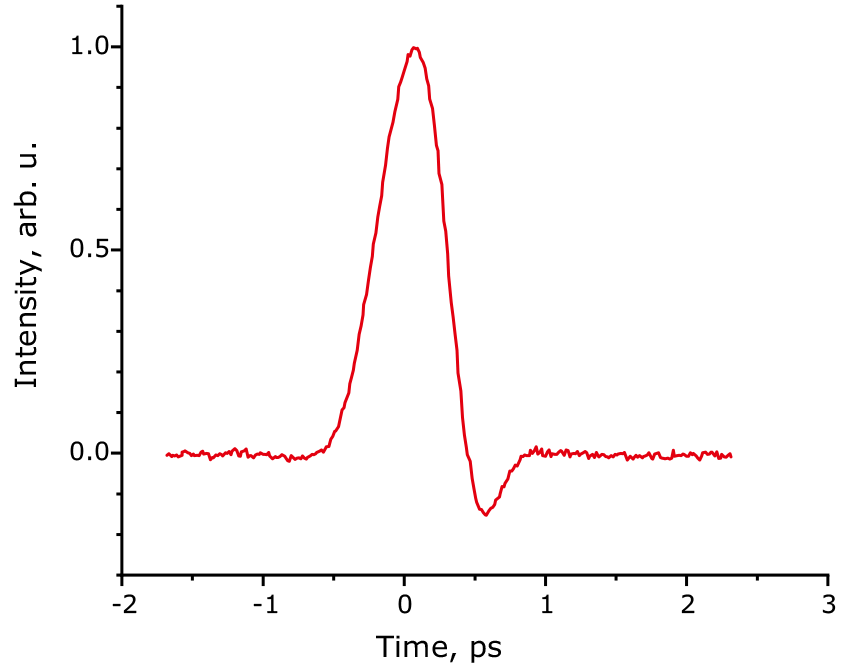
We suggest that the peak reflects a complicated cross-phase modulation dynamics occurring in water and other liquid phases during the time of overlap between the pump and probe pulses similar to that reported elsewhere Miller94 ; Wiersma01 . The study of these effects is out of the scope of this paper.
At larger delay times (approximately ps) the signal in Fig.5 reflects the dynamics of anisotropic vibrational and rotational relaxation in NADH. The interpretation of the shape of this part of the signal in terms of linear dichroism of the probe beam is presented in Sec.II. With respect to the model developed in Sec.II the growing part of the anisotropy signal in Fig.5 at ps is mostly reflects vibration relaxation in the first electronic excited state in NADH resulting in rotation of the molecular transition dipole moment, and the decaying part of the anisotropy signal at ps can be explained by rotation diffusion of excited NADH molecules in solution.
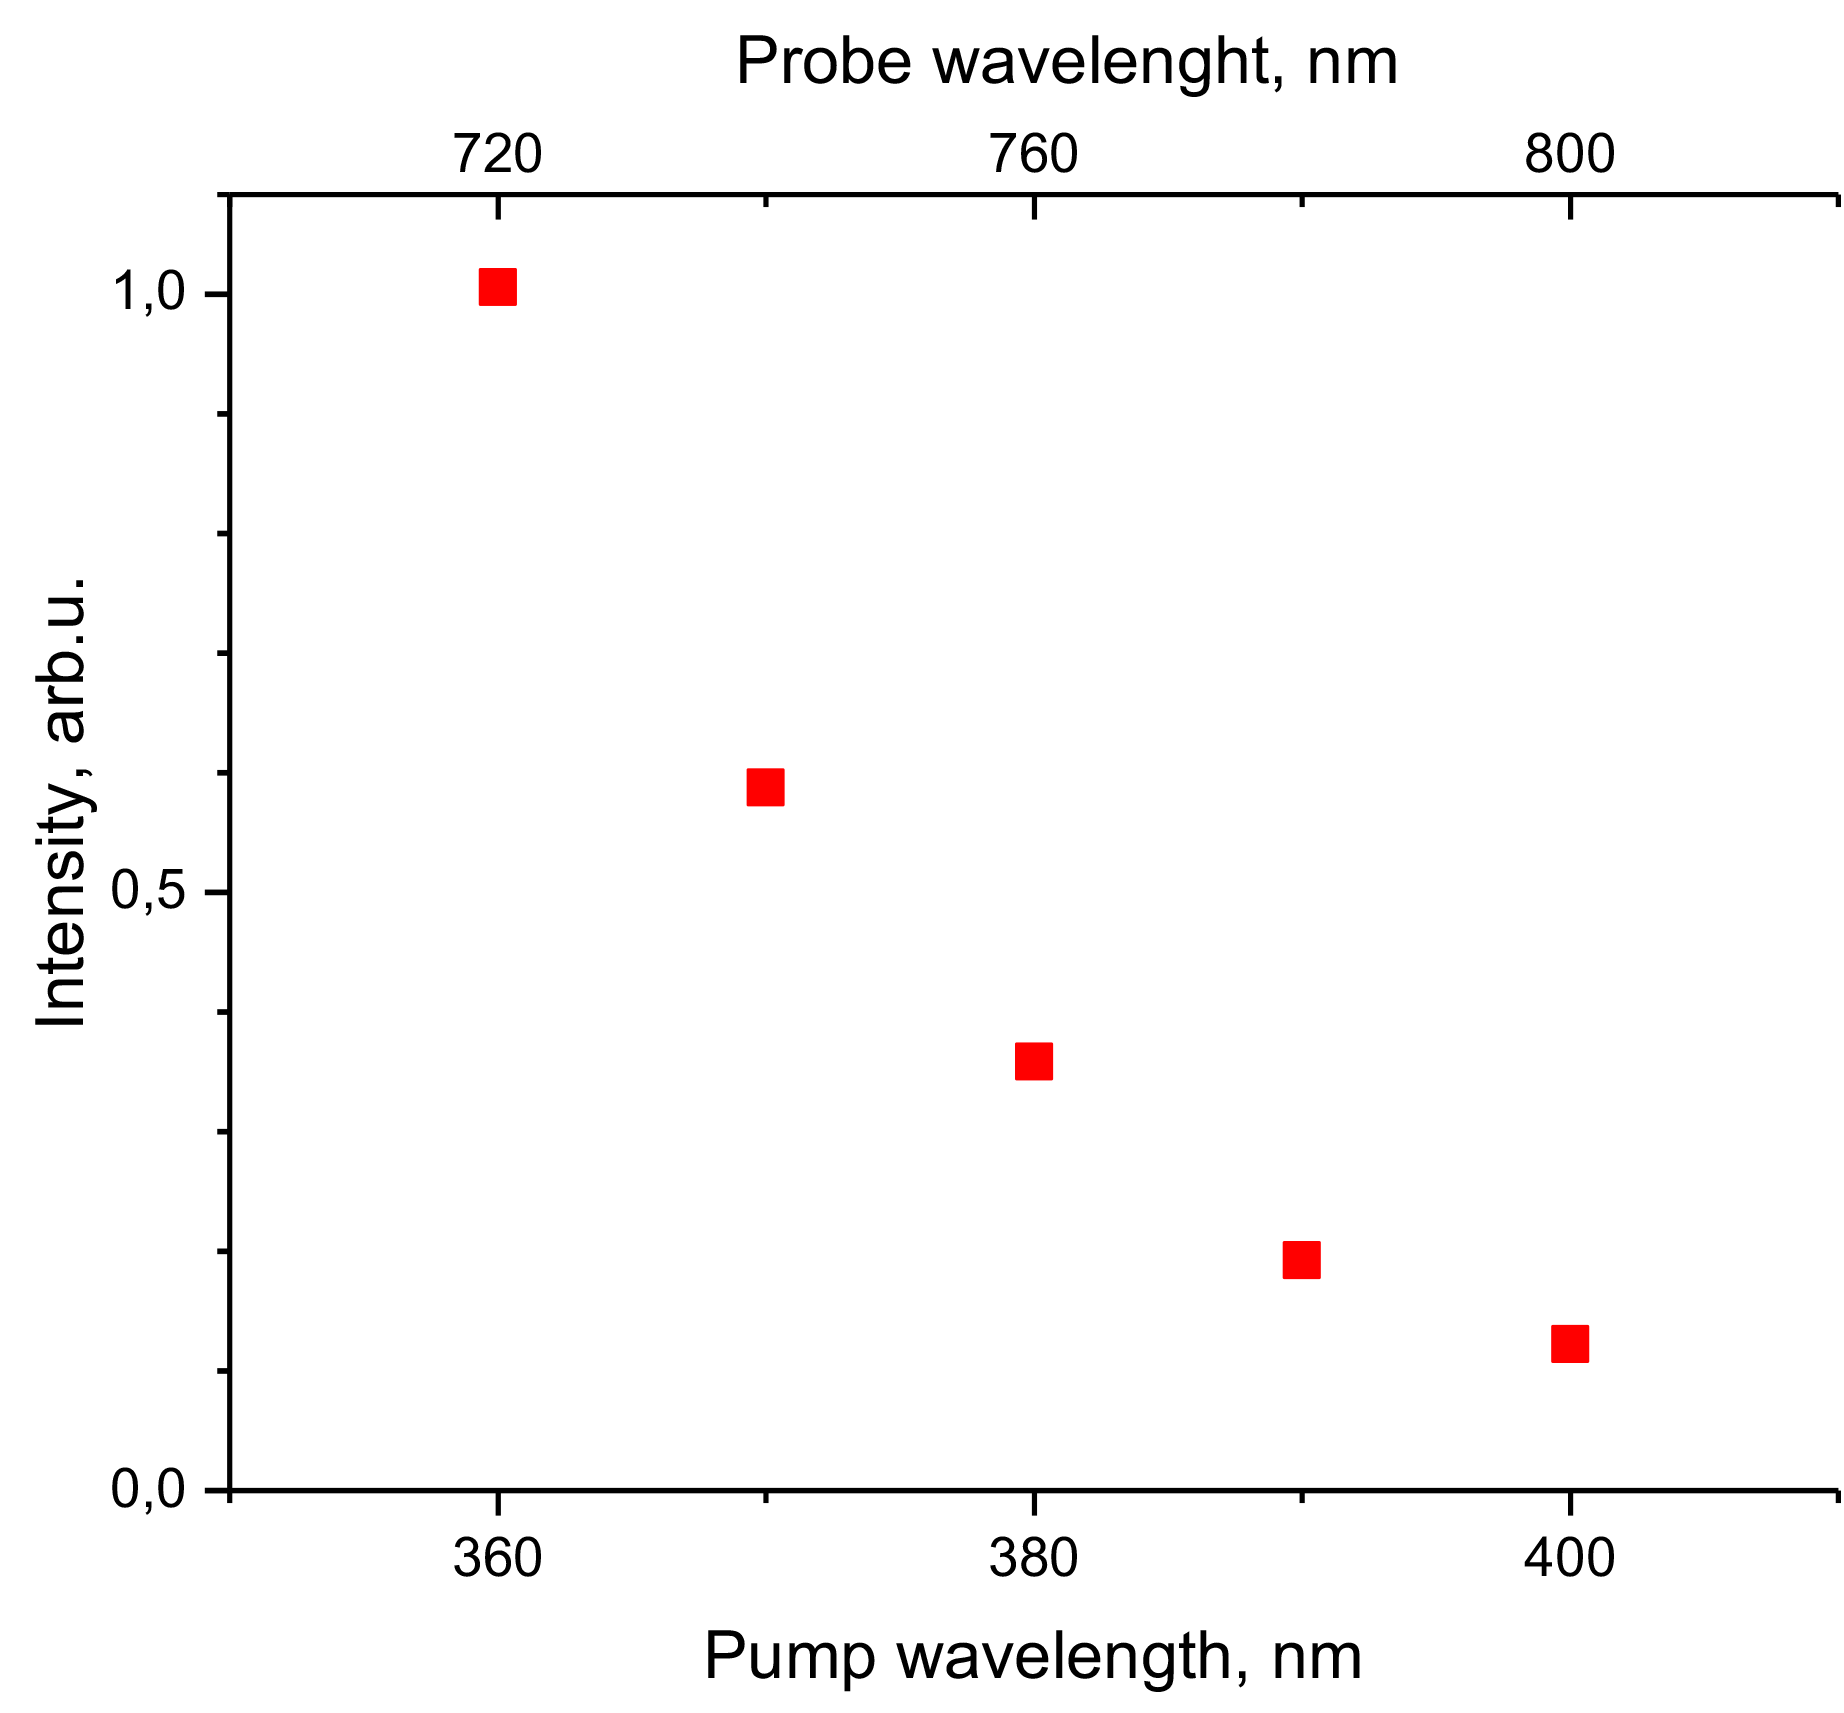
For proving the resonance behavior of the anisotropic signal in NADH we investigated the maximum signal amplitude at ps as function of the pump beam wavelength. The result obtained is shown in Fig.7. As can be seen in Fig.7 the signal amplitude decreases dramatically when the pump beam wavelength increases from =360 nm to =400 nm. This observation is in a good agreement with the resonance excitation scheme in Fig.1 and the NADH absorption band shown in Fig.2.
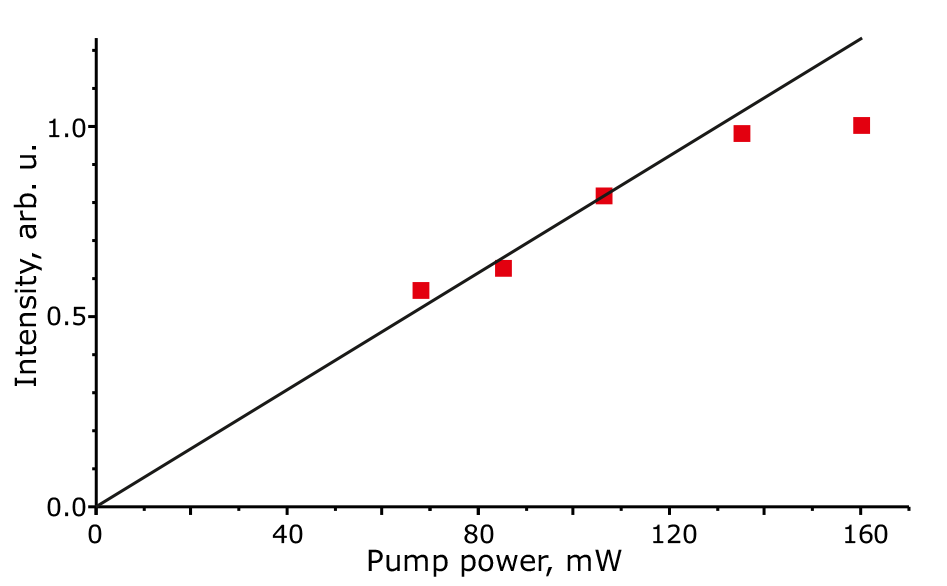
The dependence of the signal maximum amplitude on the pump beam intensity is presented in Fig.8. As can be seen, at relatively small pump beam intensities the signal amplitude increases linearly with pump intensity as expected for a one-photon absorption and only at large intensities the signal deviates from the linear behaviour manifesting saturation.
IV.2 Experimental data processing
According to eqs.(15), (16), and (18) the experimental pump-probe signal can be described by the expression:
| (21) |
where the lifetime decay has a form
| (22) |
Using eq.(21) we determined the best estimation for vibrational relaxation time , rotational diffusion time , and coefficients by fit as function of the ethanol concentration in the sample, while the lifetimes and the weighting coefficients were determined independently in polarized fluorescence spectroscopy experiments. The experimental values of the lifetimes and the ratio of the coefficient are collected in Table 1.
| EtOH, % vol | , ps | , ps | |
|---|---|---|---|
| 0 % | 230 40 | 590 50 | 0.34 0.02 |
| 16 % | 245 35 | 600 40 | 0.38 0.02 |
| 27% | 280 30 | 680 40 | 0.31 0.01 |
| 45% | 280 20 | 670 10 | 0.43 0.03 |
| 64% | 300 30 | 720 30 | 0.48 0.07 |
| 92% | 300 30 | 830 20 | 0.71 0.14 |
The experimental signals recorded at different ethanol concentrations are presented in Figs. 10 and 9 at two different timescales, where the dots are our experimental data and solid lines are our fit.
The noise in the measured signal can be assumed as an additive Gaussian noise with equal variance. Therefore, we use a simple objective function to find fitting parameters , and . For solving the nonlinear optimization problem we used differential evolution to find the global minimum of the objective function Storn1997 . Unlike local optimization schemes, this procedure is robust to an initial guess of the fitting parameters.
Experimental data in Figs. 9 and 10 manifest rapid increase of the signal due to vibrational relaxation and slow decay due to rotational diffusion. Since the characteristic times were found to be much longer than , for accurate determination of we used shorter delays in Fig. 9 and for determination of we used longer delays in Fig. 10.
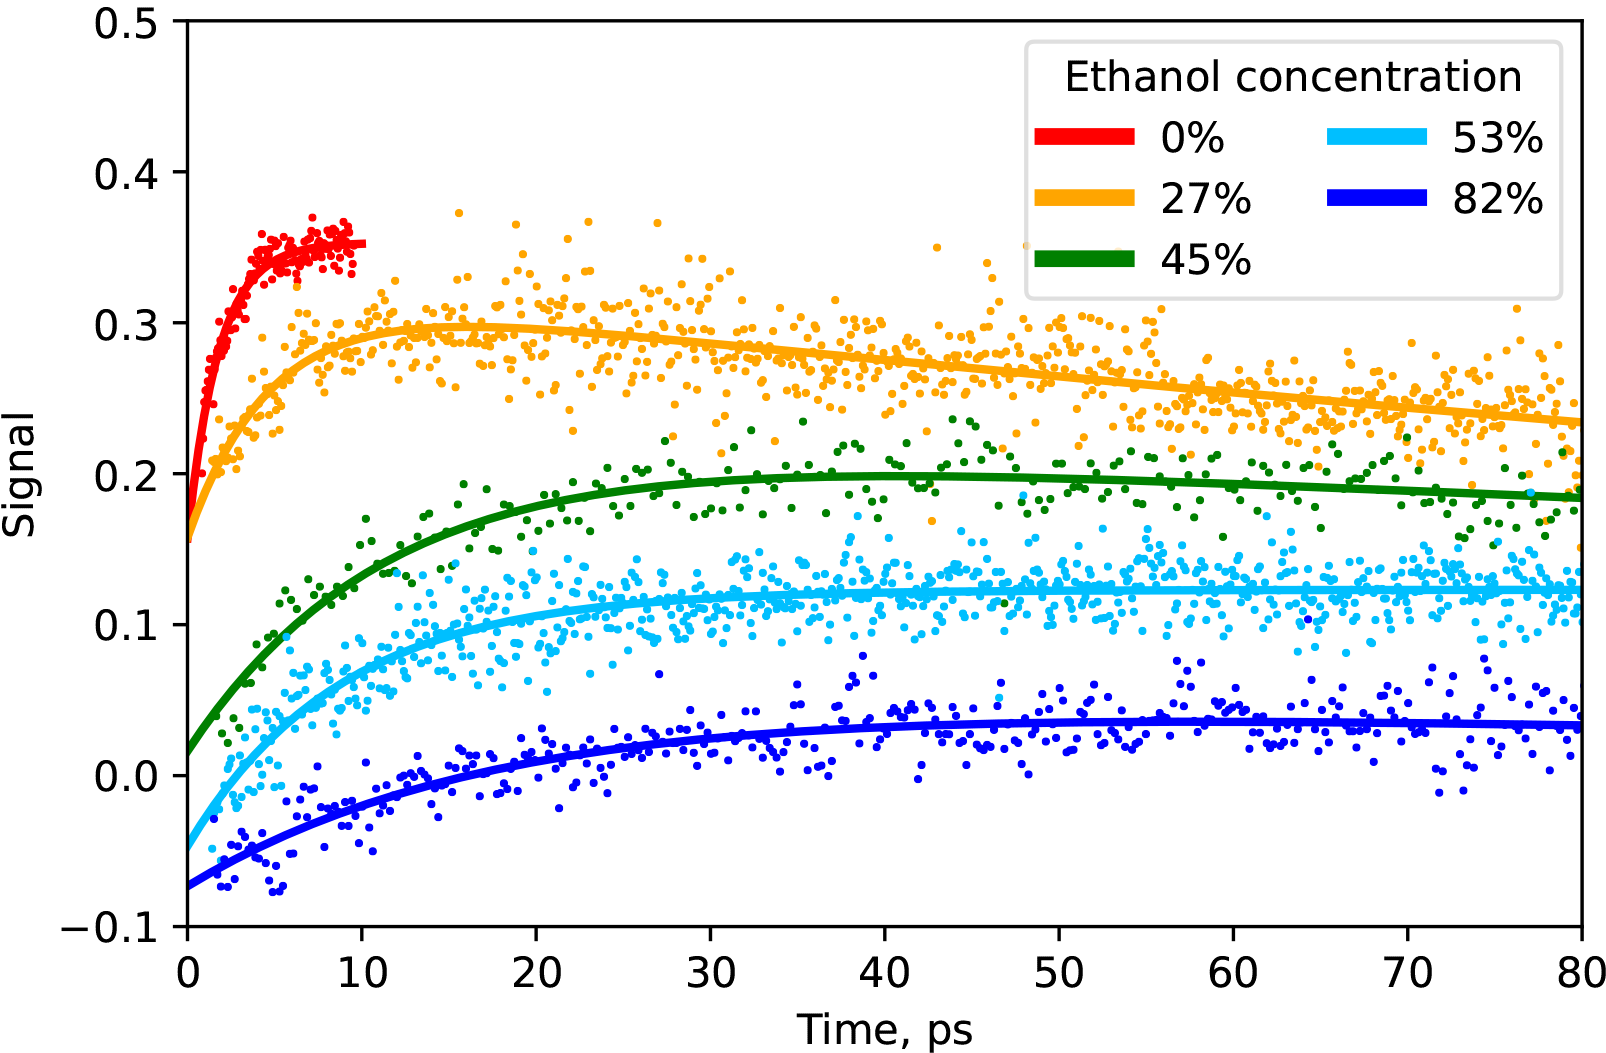
Dots are experimental data and solid lines are fit.
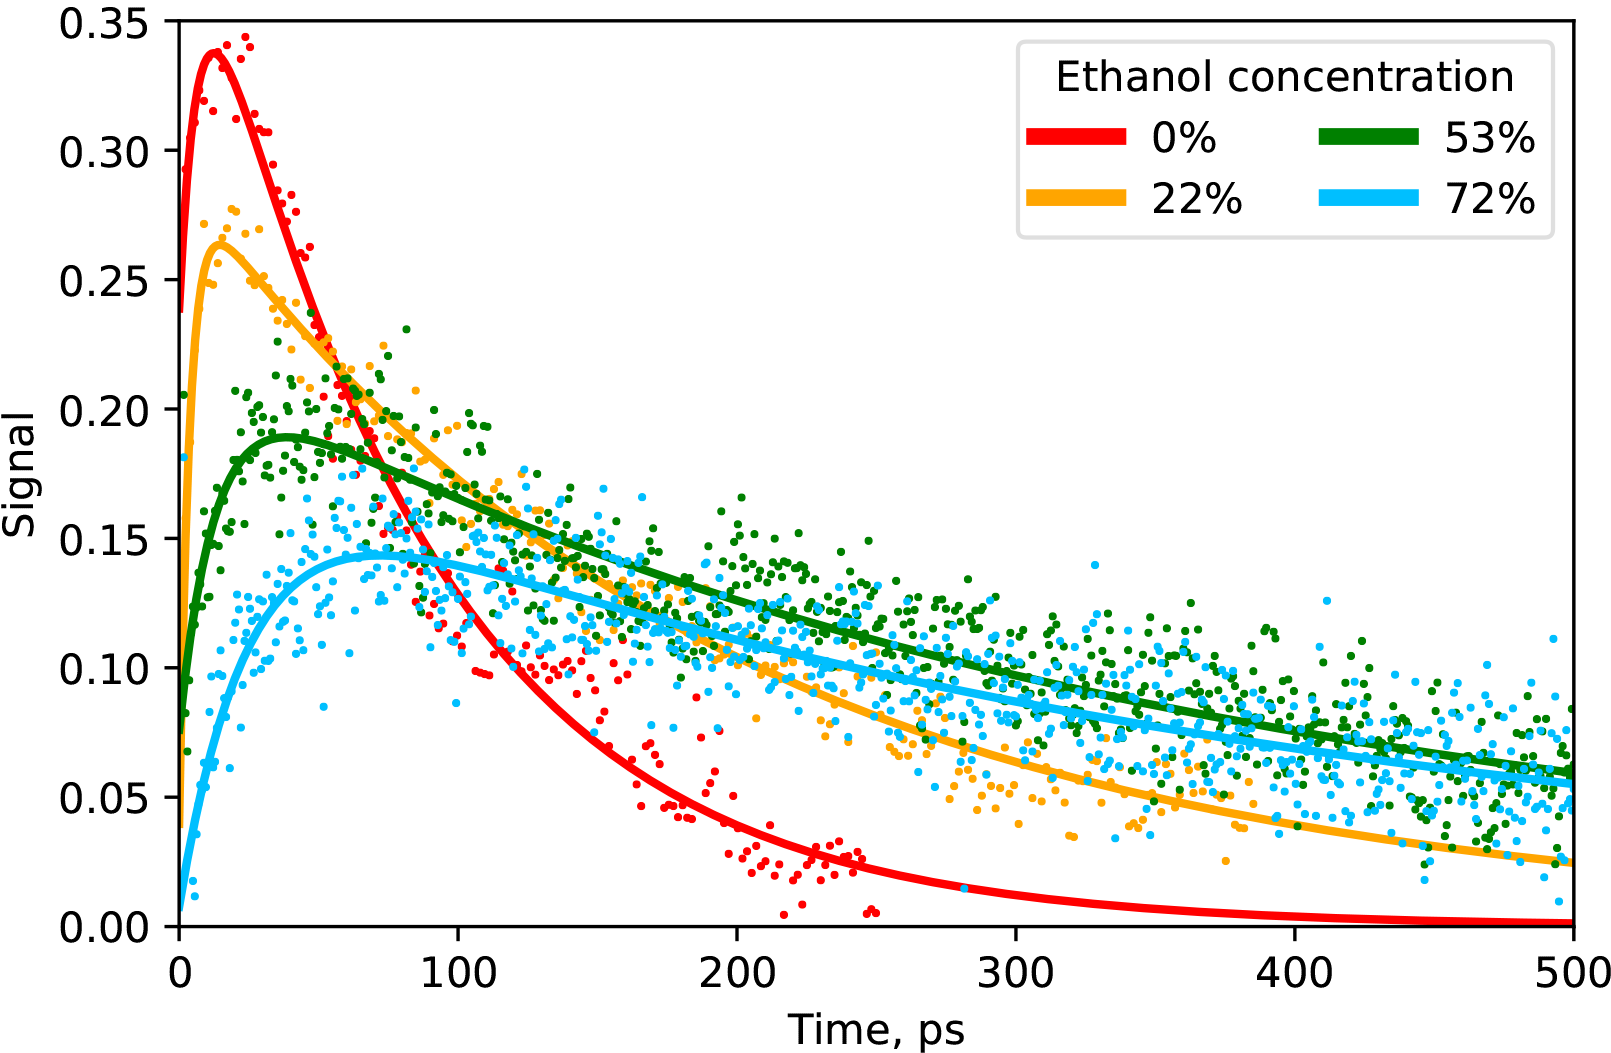
Dots are experimental data and solid lines are fit.
V Discussion
The relaxation time in eqs. (15)-(18) and (21) characterizes the velocity of vibrational relaxation in NADH first excited state schematically shown in Fig. 1. The value determined from experiment as function of ethanol concentration in water-ethanol solution is given in Fig. 11. As can be seen in Fig. 11, increases linearly with ethanol concentration within the experimental error bars. This relationship can be attributed to interaction of excited state NADH with surrounding solution molecules. Water molecules are more polar than ethanol and therefore more strongly perturb NADH wave functions. Therefore NADH-water interactions leads to faster vibrational relaxation and to stronger influence on NADH nuclear configuration Hull01 ; Smith00 .
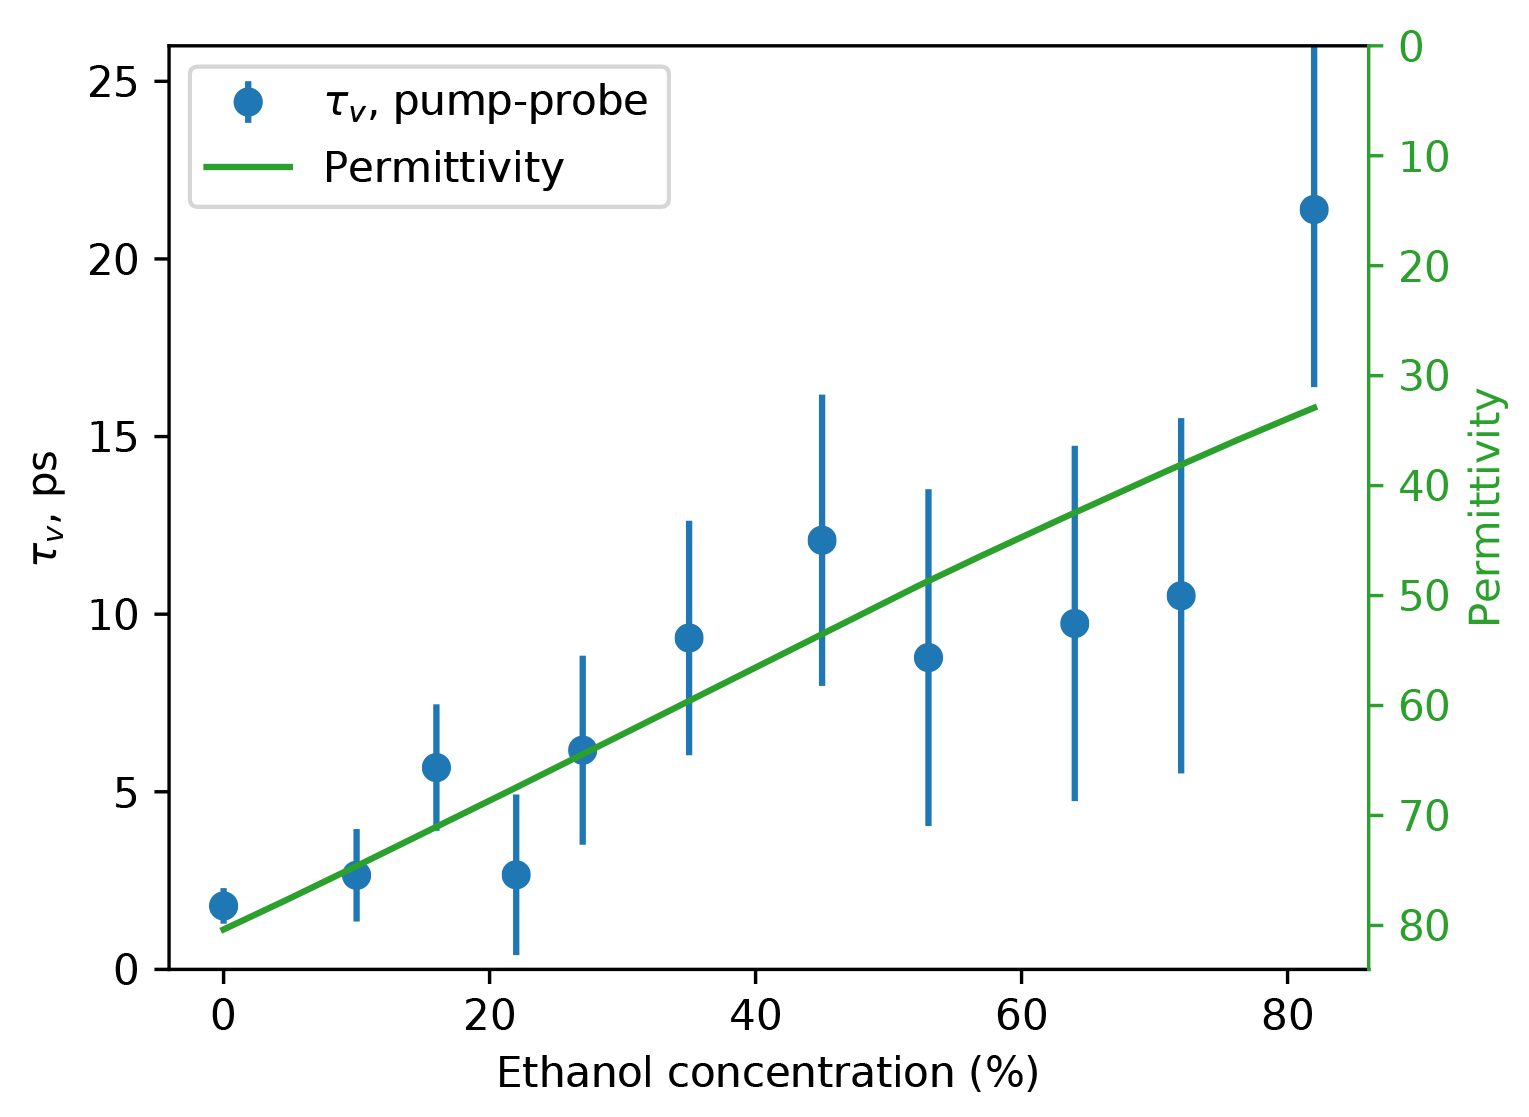
The solid line is solution permittivity.
The solvent static permittivity of water-ethanol solution Akerlof32 as a relative measure of chemical polarity is plotted in Fig. 11 with a solid straight green line in an inverse scale given in the right. As can be seen in Fig. 11 the vibration relaxation time is inverse proportional to the solution permittivity within the experimental error bars.
According to the results of the theory given in Sec. II the coefficients and in eqs.(15)-(18) have important physical meaning being the limiting values of the term , where is the angle between the directions of dipole moments and on the optical transitions and in Fig. 1, respectively. Therefore the coefficients and characterise the rotation of the molecular transition dipole moment during excited state vibrational relaxation. The coefficient is equal to at the time of the pump pulse excitation where the angle refers to the ground state equilibrium nuclear configuration for both and optical transitions. In the course of vibrational relaxation the excited state nuclear configuration of NADH transforms to a new equilibrium position schematically indicated as the minimum on PES 1 in Fig. 1. The coefficient is equal to where the angle refers to the ground state equilibrium nuclear configuration for optical transition and to the excited state 1 nuclear configuration for the optical transition.
The coefficients and as function of ethanol concentrations are plotted in Fig. 12.
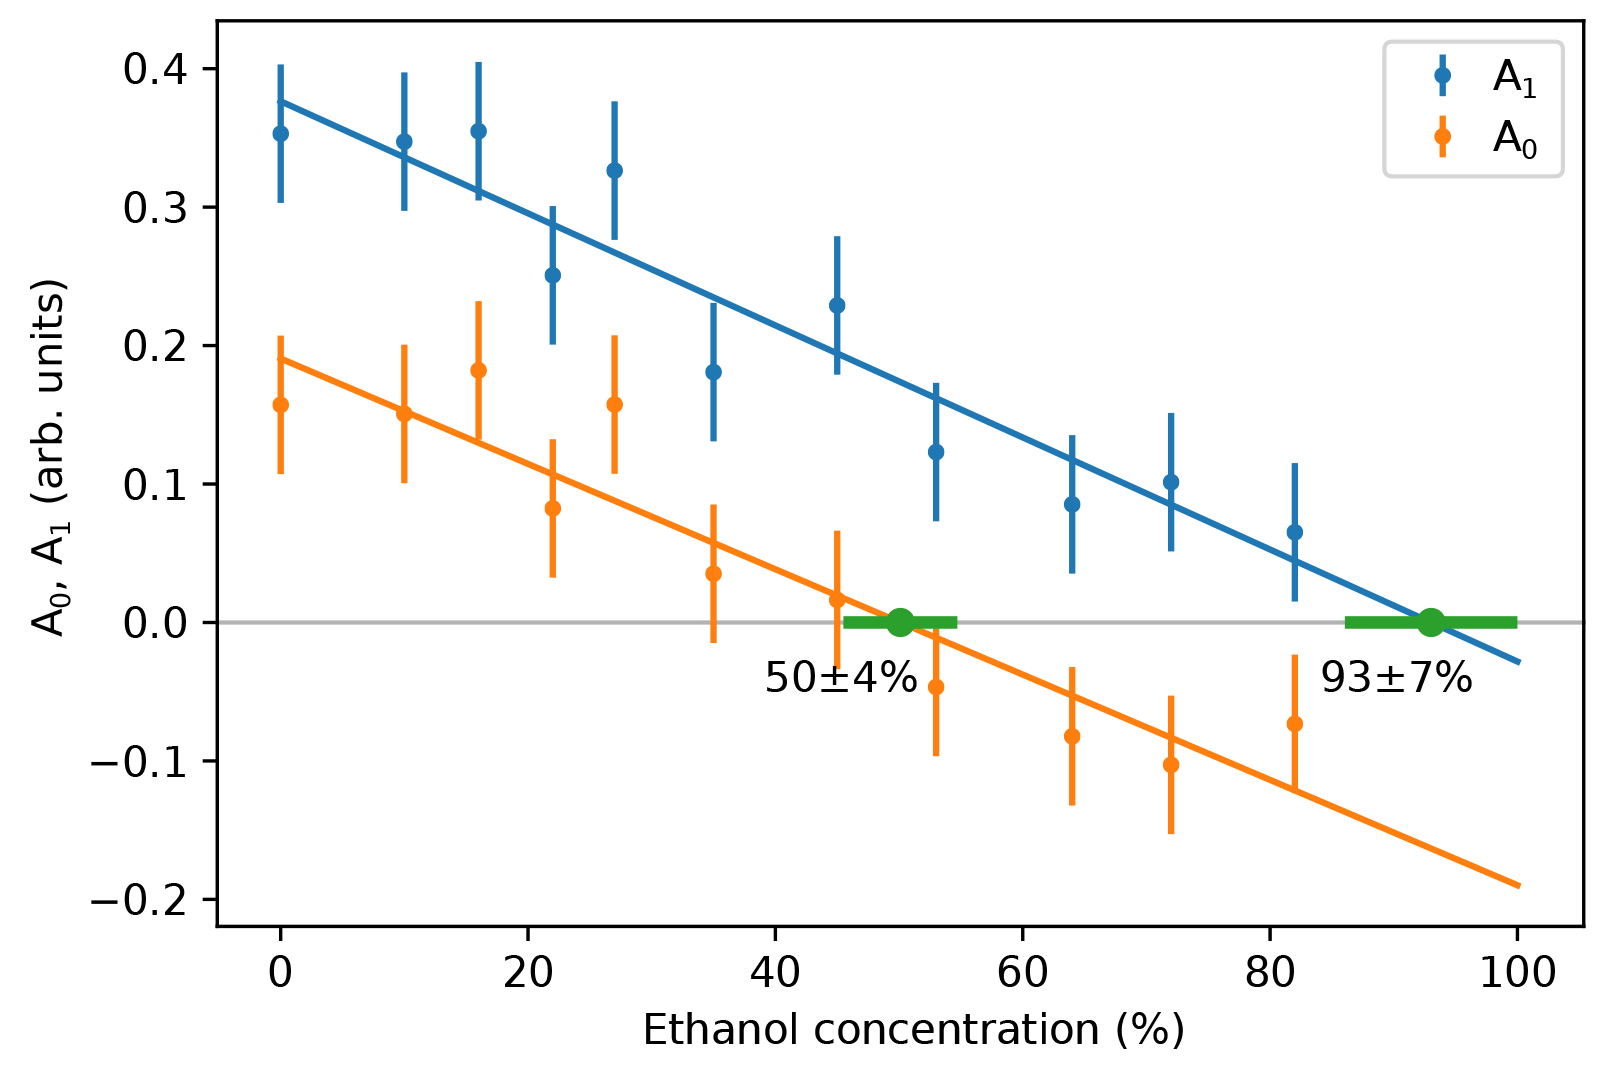
Solid lines are linear fit.
According to the definitions below eq.(18) the coefficients may in general have either positive, or negative values in the range where the maximum value refers to the case when the transition moments and on the transitions and are parallel to each other and the minimum value refers to the case when these transitions are perpendicular to each other.
One can conclude from Fig. 12 that the coefficient is always larger than the coefficient . This result can be interpreted within two scenarios that may be complementary to each other: (i) the angle between the transition dipole moments and is larger at time than at time and (ii) the overlap vibrational integrals and/or modulus of the dipole moments and in eqs.(13) and (14) are greater for the probe optical transition than for the pump one. The mechanisms (i) and (ii) cannot be isolated with the methods used in this paper, the isolation needs the assistance of intensive quantum chemical computations.
As can be seen in Fig. 12 both coefficients decrease linearly with ethanol concentration within the experimental error bars and at certain concentrations change their sign. This behavior of the coefficients and suggests that the angle increases with ethanol concentration due to change of equilibrium nuclear configurations as function of the solution polarity. The coefficients and change their sign at the magic angle . According to Fig. 12 this point is achieved by the coefficient at about 504% ethanol concentration and by the coefficient at 937% ethanol concentration.
The rotation diffusion time in eqs. (15)-(18) and (21) characterizes the blurring of the distribution of excited NADH axes due to interaction with surrounding solvent molecules. The rotation diffusion time determined by the polarization-modulation transient and by the fluorescence polarization method as a function of ethanol concentration in water-ethanol solution is given in Fig. 13 with symbols.
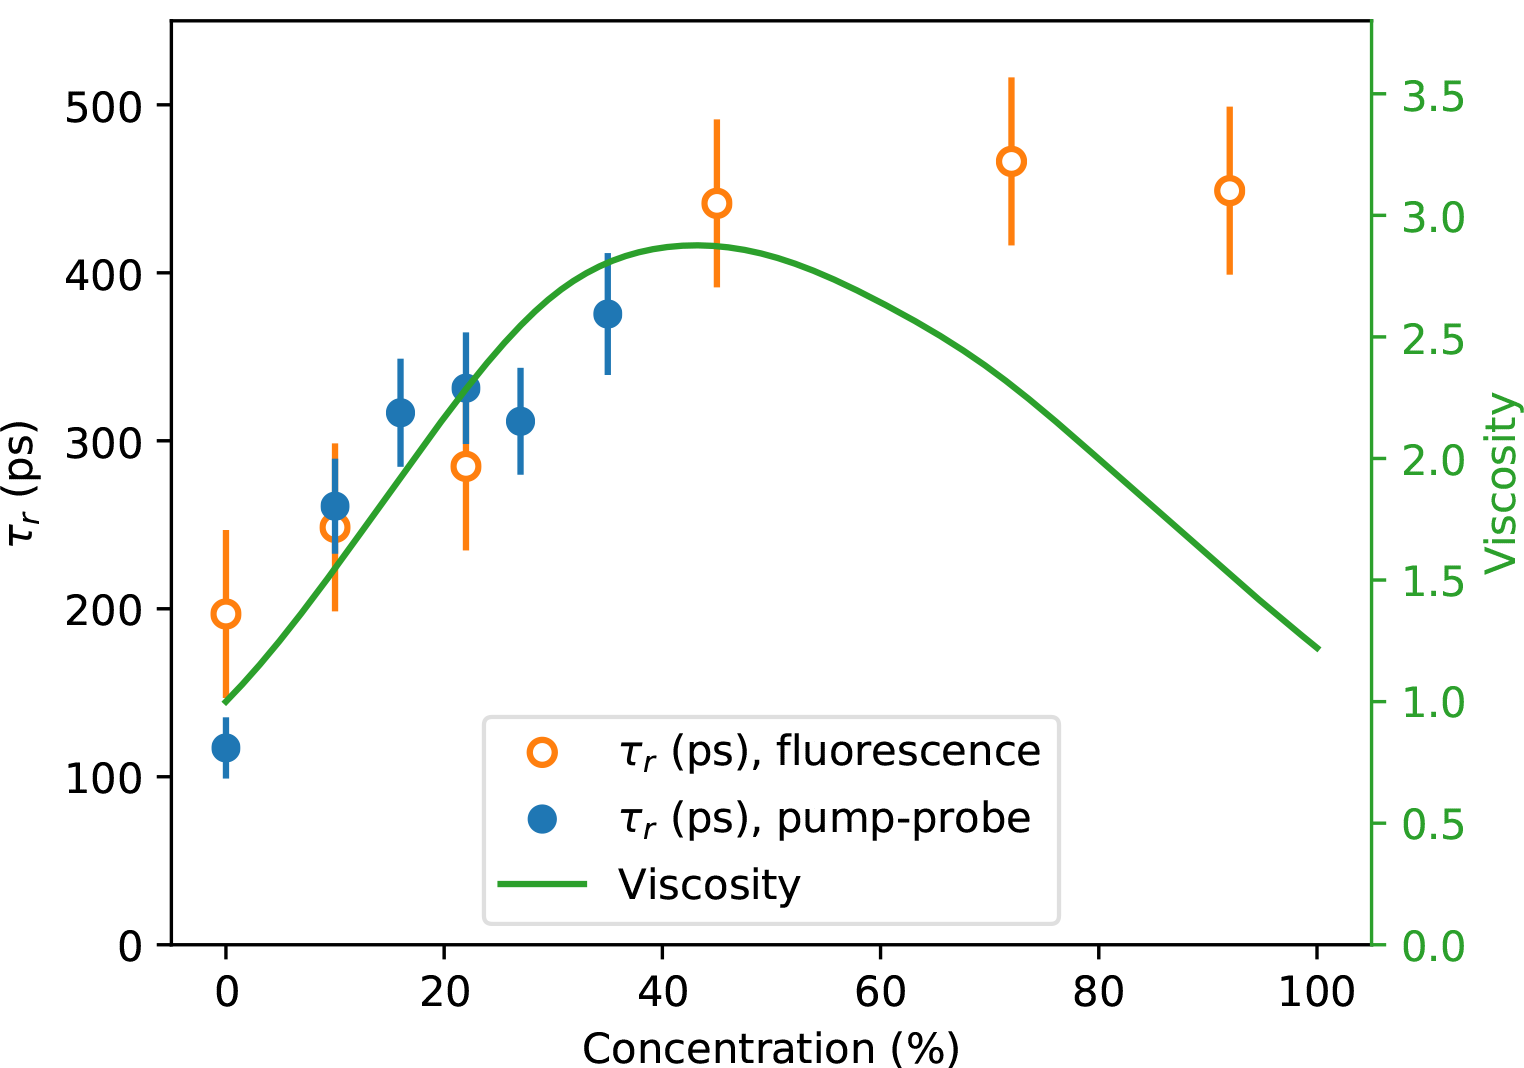
Symbols are experimental data and the solid curve is solution viscosity.
In contrast to , the dependence of on ethanol concentration has a non-linear behavior. As reported by Millar et al ZEWAIL79 and by Potma et al Wiersma01 in certain liquids the rotation diffusion time is directly proportional to the solution viscosity.
Our results show that in water-ethanol solution it is not exactly the case. For comparison, the water-ethanol solution viscosity Jouyban12 is plotted in Fig. 13 with a solid red curve with a maximum. As can be seen in Fig. 13 the rotation diffusion time is proportional to the solution viscosity at the methanol concentrations less than 40% only, while at higher concentrations deviation from the direct proportionality is observed. This behavior can be attributed to the change of the NADH nuclear configuration and redistribution of different NADH conformers population at high ethanol concentrations.
VI Conclusions
The paper presents the results of the study of fast anisotropic relaxation and rotational diffusion in the first electronic excited state of biological coenzyme NADH in water-ethanol solutions at various ethanol relative concentrations. Novel polarization-modulation transient method has been used for detailed study of anisotropic vibrational relaxation. The method combines high-frequency modulation of the pump pulse train polarization at 100 kHz following by the separation of the anisotropic contribution to the signal using a highly-sensitive balanced detection scheme, a differential integrator, and a lock-in amplifier recording the linear dichroism of the probe beam at the modulation frequency in a narrow frequency bandwidth of a few Hz. As a result, the method allows for investigation of sub-picosecond excited state dynamics at a less than nJ level of pump pulse energy. Interpretation of the experimental results was done by a model expressions based on the full quantum mechanical treatment using the state multipole representation of the molecular density matrix. It was shown that the dynamics of anisotropic relaxation in NADH under excitation with 100 fs pump laser pulses can be characterised by a single vibration relaxation time laying in the range 2–15 ps and a single rotation diffusion time laying in the range 100–450 ps. The vibration relaxation time was found to be proportional to the solvent polarity in the entire range of ethanol concentrations. The rotation diffusion time was found to be proportional on the solvent viscosity at the ethanol concentrations less then 40%, however at higher concentration the deviation from the proportionality was observed. The rotation of the transition dipole moment in the course of vibrational relaxation has been analyzed by exploring the experimental parameter .
VII Conflict of interests
There are no conflicts to declare.
Acknowledgements.
The study was supported by the Russian Foundation for Basic Researches under the grant No 18-03-00038. YMB, AAS, and OSV are grateful to BASIS Foundation for financial support under the grant No 19-1-1-13-1. The authors are grateful to the Ioffe Institute for providing the equipment used in the experiments.Appendix A Derivation of eq.(5).
In the first order of the perturbation theory the probe beam absorption intensity in the optical transition can be described by the expression Blum96 :
| (23) | |||||
where is the incident probe beam intensity, is the molecular first excited state density matrix, is a spectral profile of the probe pulse, and the terms in angular brackets are transition dipole moment matrix elements.
We assume that the density matrix in eq.(23) depends on time due to energy transfer and relaxation processes in the excited state. In general, the density matrix in eq. (23) depends also on other quantum numbers which are dropped for brevity.
If the duration of the excitation laser pulse at is much shorter than the characteristic time of excited state vibrational relaxation the expression for the first excited state density matrix can be written in the form:
| (24) | |||||
where is a spectral profile of the pump pulse and is the population of the distribution of the ground state energy levels that is assumed to be isotropic.
We formulate eqs. (23) and (24) in terms of the covariant state multipole components of the density matrix:
| (25) |
The inverse transformation is given by:
| (26) |
where and are the rank () and its component on the laboratory frame axis Z (), respectively Zare88b .
Combining eqs. (23)-(26) and proceeding the transformations of the angular momentum algebra similar to that used in refs. Denicke10 ; Shternin10 one comes to eq.(5).
Appendix B Derivation of eq.(III.1).
Assuming that the pump beam polarization is modulated by an photo-acoustic modulator according to eq.(19), where we calculate the spherical pump light components:
| (27) | |||
| (28) |
and then consider the matrix elements of the pump light polarization matrix with respect to eq.(7).
| (29) | |||||
| (30) | |||||
| (31) |
As can be seen in eds.(29)-(31) only the pump light matrix elements and are modulated in time and can contribute to the experimental signal.
Substituting eds.(29)-(31) and the probe light polarization matrix elements related to and polarization components Zare88b to the scalar product in eq.(12) the linear dichroism signal cane be presented in the form:
| (32) | |||||
where the anisotropy is given in eq.(16).
Expanding the function into the Fourier series one can readily prove that it oscillates in quadrature to the doubled frequency modulation signal .
References
- [1] S. Mukamel. Principles of Nonlinear Optical Spectroscopy. Oxford University Press, Oxford, New York, 2 edition, 1995.
- [2] R. Berera, R. van Grondelle, and J. T. M. Kennis. Ultrafast transient absorption spectroscopy: principles and application to photosynthetic systems. Photosynthesis Research, 101(101):105–118, July 2009.
- [3] N. E. Henriksen and V. Engel. Femtosecond pump± probe spectroscopy: a theoretical analysis of transient signals and their relation to nuclear wave-packet motion. Int. Rev. Phys. Chem., 20(2):93–126, September 2014.
- [4] J. Zhu, D. M. Shcherbakova, Y. Hontani, V. V. Verkhusha, and J. T. M. Kennis. Ultrafast excited-state dynamics and fluorescence deactivation of near–infrared fluorescent proteins engineered from bacteriophytochromes. Scientific Reports, 5(1):1–8, August 2015.
- [5] M. C. Fischer, J. W. Wilson, F. E. Robles, and W. S. Warren. Invited review article: Pump-probe microscopy. Rev. Sci. Instr., 87:031101, 2016.
- [6] D. M. Jonas, M. J. Lang, Yu. Nagasawa, T. Joo, and G. R. Fleming. Pump−-probe polarization anisotropy study of femtosecond energy transfer within the photosynthetic reaction center of Rhodobacter sphaeroides r26. J. Phys. Chem., 100(30):12660–12673, July 1996.
- [7] B. Cohen, P. M. Hare, and B. Kohler. Ultrafast excited-state dynamics of Adenine and Monomethylated adenines in solution: Implications for the nonradiative decay mechanism. J. Am. Chem. Soc., 125:13594–13601, 2003.
- [8] G. M. Roberts, H. J. B. Marroux, M. P. Grubb, M. N. R. Ashfold, and A. J. Orr-Ewing. On the participation of photoinduced n–h bond fission in aqueous Adenine at 266 and 220 nm: A combined ultrafast transient electronic and vibrational absorption spectroscopy study. J. Phys. Chem. A, 118:11211–11225, 2014.
- [9] Z. Heiner, T. Roland, J. Léonard, S. Haacke, and G. I. Groma. Ultrafast absorption kinetics of NADH in folded and unfolded conformations. EPJ Web of Conferences, 41:1–3, 2013.
- [10] Z. Heiner, T. Roland, J. Leonard, S. Haacke, and G. I. Groma. Kinetics of light–induced intramolecular energy transfer in different conformational states of NADH. J. Phys. Chem. B, 121(34):8037–8045, July 2017.
- [11] J. R. Lakowic. Topics in Fluorescence Spectroscopy, volume 5. Plenum Press, New York, 1997.
- [12] M. E. Couprie, F. Mkola, P. Taut, D. Garzella, A. Delboulbé, T. Hara, and M. Billardon. First use of the uv superaco free electron laser: Fluorescence decays and rotational dynamics of the NADH coenzyme. Rev. Sci. Instrum., 65:1485–1495, February 1994.
- [13] H. D. Vishwasrao, A. A. Heikal, K. A. Kasischke, and W. W. Webb. Conformational dependence of intracellular NADH on metabolic state revealed by associated fluorescence anisotropy. J. Biol. Chem., 208(26):25119–25126, April 2005.
- [14] S. Denicke, K.-H. Gericke, A. G. Smolin, P. S. Shternin, and O. S. Vasyutinskii. Dynamics of two–color two–photon excited fluorescence of p–Terphenyl: Determination and analysis of the molecular parameters. J. Phys. Chem. A, 114:9681–9692, August 2010.
- [15] T. S. Blacker, R. J. Marsh, M. R. Duchen, and A. J. Bain. Activated barrier crossing dynamics in the non–radiative decay of NADH and NADPH. Chem. Phys., 422:184–184, February 2013.
- [16] S. Herbrich, T. Al-Hadhuri, K.-H. Gericke, P. S. Shternin, A. G. Smolin, and O. S. Vasyutinskii. Two-color two–photon excited fluorescence of indole: Determination of wavelength–dependent molecular parameters. J. Chem. Phys., 142:024310, January 2015.
- [17] M. E. Sasin, A. G. Smolin, K.-H. Gericke, E. Tokunaga, and O. S. Vasyutinskii. Fluorescence anisotropy in indole under two–photon excitation in the spectral range 385-–510 nm. Phys. Chem. Chem. Phys., 20:19922–19931, July 2018.
- [18] M. D. Levenson and G. L. Eesley. Polarization selective optical heterodyne detection for dramatically improved sensitivity in laser spectroscopy. Appl. Phys., 19:1–17, 1979.
- [19] G. Haran, K. Wynne, C. C. Moser, P. L. Dutton, and R. M. Hochstrasser. Level mixing and energy redistribution in bacterial photosynthetic reaction centers. J. Phys. Chem., 100:5562–5569, 1996.
- [20] W. M. Diffey, B. J. Homoelle, M. D. Edington, and W. F. Beck. Excited-state vibrational coherence and anisotropy decay in the Bacteriochlorophyll a dimer protein B820. J. Phys. Chem. B, 102:2776–2786, March 1998.
- [21] A. A. Ferro and D. M. Jonas. Pump–-probe polarization anisotropy study of doubly degenerate electronic reorientation in silicon naphthalocyanine. J. Chem. Phys., 115(14):6281–6284, October 2001.
- [22] E. O. Potma, W. P. de Boeij, and D. A. Wiersma. Femtosecond dynamics of intracellular water probed with nonlinear optical Kerr effect microspectroscopy. Biophys. Journal, 80:3019––3024, 2001.
- [23] H.-S. Tan, I. R. Piletic, and M. D. Fayer. Polarization selective spectroscopy experiments: methodology and pitfalls. J. Opt. Soc. Am. B, 22(9):2009–2017, September 2005.
- [24] D. A. Farrow, W. Qian, E. R. Smith, A. A. Ferro, and D. M. Jonas. Polarized pump–probe measurements of electronic motion via a conical intersection. J. Chem. Phys., 128:144510, 2008.
- [25] E. E. Fenn, D. B. Wong, and M. D. Fayer. Water dynamics at neutral and ionic interfaces. PNAS, 106(36):15243––15248, September 2009.
- [26] E. R. Smith and D. M. Jonas. Alignment, vibronic level splitting, and coherent coupling effects on the pump–probe polarization anisotropy. J. Phys. Chem. A, 115:4101––4113, 2011.
- [27] M. Tros and S. Woutersen. Polarization–modulation setup for ultrafast infrared anisotropy experiments to study liquid dynamics. Opt. lett., 40(11):2607–2609, June 2015.
- [28] M. E. Corrales, P. S. Shternin, L. Rubio-Lago, R. de Nalda, O. S. Vasyutinskii, and L. Banares. Femtosecond time–resolved photofragment rotational angular momentum alignment in electronic predissociation dynamics. J. Phys. Chem. Lett., 7:4458–4463, October 2016.
- [29] C. Rumble and E. Vauthey. Structural dynamics of an excited donor–-acceptor complex from ultrafast polarized infrared spectroscopy, molecular dynamics simulations, and quantum chemical calculations. Phys. Chem. Chem. Phys., 21:11797–11908, May 2019.
- [30] J. Hunger, S. Roy, M. Grechko, and M. Bonn. Dynamics of Dicyanamide in ionic liquids is dominated by local interactions. J. Phys. Chem. B, 123:1831–1839, 2019.
- [31] D. P. Millar, R. Shah, and A. H. Zewail. Picosecond saturation spectroscopy of cresyl violet: rotational diffusion by a ”sticking” boundary condition in the liquid phase. Chem. Phys. Lett., 66(3):435–440, 1979.
- [32] P. M. Schaefer, S. Kalinina, A. Rueck, C. A. F. von Arnim, and B. von Einem. NADH autofluorescence–a marker on its way to boost bioenergetic research. Cytometry Part A, 95A:34––46, 2019.
- [33] S. Freed, E. A. Neyfakh, and L. A. Tumerman. Influence of solvents on the intramolecular energy transfer in NADH and NADPH. Biochim. Biophys. Acta, 143:432–434, May 1967.
- [34] R. V. Hull, P. S. Conger III, and R. J. Hoobler. Conformation of NADH studied by fluorescence excitation transfer spectroscopy. Biophys. Chem., 90:9–16, 2001.
- [35] M. E. Sasin, I. A. Gorbunova, N. O. Bezverkhnii, Y. M. Beltukov, O. S. Vasyutinskii, and J. Rubayo-Soneira. Polarized fluorescence in NADH two–photon excited by femtosecond laser pulses in the wavelength range of 720-–780 nm. Tech. Phys. Lett., 45(7):672–674, 2019.
- [36] O. S. Vasyutinskii, A. G. Smolin, C. Oswald, and K.-H. Gericke. Polarized fluorescence in NADH under two–photon excitation with femtosecond laser pulses. Opt. and Spectr., 122(4):622–626, September 2017.
- [37] T. S. Blacker, N. Nicolaou, M. R. Duchen, and A. J. Bain. Influence of solvents on the intramolecular energy transfer in NADH and NADPH. J.Phys.Chem. B., 123:4705–4717, Aplril 2019.
- [38] K. Blum. Density Matrix Theory and Applications. Plenum, New York, 2 edition, 1996.
- [39] R. N. Zare. Angular Momentum. Wiley, New York, 1988.
- [40] P. S. Shternin, K.-H. Gericke, and O. S. Vasyutinskii. The polarisation of two-photon excited fluorescence in rotating molecules. Mol. Phys., 108:813–825, 2010.
- [41] A. Messiah. Quantum Mechanics, Vol. II. North Holland Publishing Company, Oxford, New York, 1963.
- [42] M. E. Sasin, I.A. Gorbunova, and O. S. Vasyutinskii. Observation of anisotropic relaxation in biological molecules with subpicosecond temporal resolution. Tech. Phys. Lett., 46(2):158––160, 2020.
- [43] S. Pales, L. Schilliig, R. J. D. Miller, P. R. Staver, and W. T. Lotshaw. Femtosecond optical Kerr effect studies of water. J. Phys. Chem., 98:6308–6316, 1994.
- [44] R. Storn and K. Price. Differential evolution–a simple and efficient heuristic for global optimization over continuous spaces. Journal of global optimization, 11(4):341–359, 1997.
- [45] P. E. Smith and J. J. Tanner. Conformations of nicotinamide adenine dinucleotide (NAD+) in various environments. Journal of Molecular Recognition, 13(1):27–34, 2000.
- [46] G. Åkerlöf. Dielectric constants of some organic solvent–water mixtures at various temperatures. J. Am. Chem. Soc., 54(11):4125–4139, November 1932.
- [47] I. S. Khattab, F. Bandarkar, M. A. A. Fakhree, and A. Jouyban. Density, viscosity, and surface tension of water+ethanol mixtures from 293 to 323K. Korean J. Chem. Eng., 29(6):812–817, 2012.