Update of the CLRP TG-43 parameter database for low-energy brachytherapy sources
Habib Safigholi, Marc J. P. Chamberlanda), Randle E. P. Taylorb), Christian H. Allen, Martin P. Martinov, D. W. O. Rogers, and Rowan M. Thomson
Carleton Laboratory for Radiotherapy Physics (CLRP), Department of Physics,
Carleton University, Ottawa, Ontario, K1S 5B6, Canada
a) Present address, Medical Physics, The University of
Vermont Medical Center, Burlington, Vermont, 05401, USA
b) Present address, Multi Leaf Consulting, Port Elgin, ON, Canada, N0H
2C3
Abstract
Purpose: To update the
Carleton Laboratory for Radiotherapy Physics (CLRP) TG-43 dosimetry database for
low-energy ( keV) photon-emitting low-dose rate (LDR) brachytherapy sources utilizing
the open-source EGSnrc application egs_brachy rather than the BrachyDose application used
previously for 27 LDR sources in the 2008 CLRP version (CLRPv1).
CLRPv2 covers 40 sources (103Pd, 125I, and 131Cs). A comprehensive set of
TG-43 parameters is calculated, including dose-rate constants, radial dose
functions with functional fitting parameters, 1D and 2D anisotropy
functions, along-away dose-rate tables, Primary-Scatter separation dose
tables (for some sources), and mean photon energies at the surface of
the sources.
The database
also documents the source models which will become part of
the egs_brachy distribution.
Acquisition and Validation Methods: Datasets are calculated after a
systematic recoding of the source geometries using the
egs++ geometry package and its egs_brachy extensions.
Air-kerma strength per history is calculated for
models of NIST’s Wide-Angle Free-Air chamber (WAFAC) and for a point detector
located at 10 cm on the source’s transverse axis. Full scatter water phantoms
with varying voxel resolutions in cylindrical coordinates are used for dose
calculations. New statistical uncertainties of source volume corrections
for phantom voxels which overlap with brachytherapy sources are implemented
in egs_brachy, and all CLRPv2 data include these uncertainties.
For validation, data are compared to CLRPv1 and other data in the literature.
Data Format and Access:
Data are available
at https://physics.carleton.ca/clrp/egs_brachy/seed_database_v2. As
well as being presented graphically in comparisons to previous calculations, data
are available in Excel (.xlsx) spreadsheets for each
source.
Potential Applications: The database
has applications in
research, dosimetry, and brachytherapy planning. This comprehensive update
provides the medical physics community with more accurate TG-43 dose
evaluation parameters, as well as fully-benchmarked and described
source models which are distributed with egs_brachy.
Key words: Low-energy brachytherapy, CLRP, TG-43, database, EGSnrc, Monte Carlo egs_brachy
I. Introduction
The TG-43 protocol[1] presented a worldwide standard dosimetry formalism for brachytherapy sources and has led to an estimated 5% uncertainty on brachytherapy dosimetry[2]. Presently, brachytherapy dosimetry and planning is widely based on the single source consensus data published in reports: TG-43 (1995) [1], the 2004 update (TG-43U1) [3, 4], the supplements in 2007 (TG-43U1S1) [5] and 2017 (TG-43U1S2) [6, 7], and the AAPM/ESTRO TG-152 report for High-Energy Brachytherapy source Dosimetry (HEBD) [8]. Monte Carlo (MC) calculations are the predominant method of determining consensus values for the radial dose function, , and the 2D anisotropy function, , for both low- and high-energy sources. Consensus dose-rate constants (DRCs or ) for low-energy sources are currently taken as averages of the mean of MC calculations and the mean of measurements since historically there was a systematic difference between the two (see ref [9] for a summary). In contrast, consensus DRCs for high-energy sources are based solely on MC calculations[8].
In 2008, version 1 of the Carleton Laboratory for Radiotherapy Physics TG-43 database (CLRPv1) was published. [10, 11, 12]. It was compiled using the EGSnrc MC application BrachyDose and contains DRCs, , and values for 42 low- and high-energy brachytherapy sources. These data were extensively used in the TG-43U1S2 report [6, 7]. Since the 2008 CLRPv1 version of the TG-43 database, several low- and high-energy photon-emitting brachytherapy sources have become available and are on the AAPM/IROC Houston Registry of Brachytherapy Sources (http://rpc.mdanderson.org/rpc/). Also, various minor errors in modelling the source geometries and in MC simulations reported in CLRPv1 have been uncovered. Furthermore, a fast, versatile, and open source EGSnrc application, called egs_brachy, was developed within the CLRP [13] and recently released as open-source software. [14]
The goal of the present work is to perform a comprehensive update of the CLRPv1 TG-43 database parameters for low-energy, low-dose rate (LDR) brachytherapy sources with a single consistent approach using egs_brachy. This “CLRPv2” update includes an independent recalculation of the datasets with more precision and is based on the egs package (Kawrakow et al., 2018[15]) with some extensions created for the egs_brachy application[13]. The CLRPv2 dataset includes a total of 40 low-energy sources for radionuclides 103Pd, 125I, and 131Cs; higher energy brachytherapy sources will be added in future work. Some of these sources are no longer in production; however, they are included to provide dosimetry parameters for retrospective analyses and research. The brachytherapy source geometry models described and benchmarked by the comparisons in the CLRPv2 database will be released for use with the open source egs_brachy application.
II. Acquisition and Validation Methods
II.A. Computational tools and Monte Carlo simulations
All calculations are performed with the EGSnrc application egs_brachy[13] (GitHub commit hash 4f3ecac version with additions regarding the statistical uncertainties in the volume corrections described below). This is free and open-source software for doing rapid MC brachytherapy dose calculations available via https://physics.carleton.ca/clrp/egs_brachy/. Electron transport, although available in egs_brachy, is not modelled in the current calculations. The photon cutoff energy is set to 1 keV, except for air-kerma strength calculations for which the photon cutoff energy is 5 keV to eliminate the characteristic x rays from Ti as required by the definition[3]. Rayleigh scattering, bound Compton scattering, photoelectric absorption, and fluorescent emission of characteristic x rays are all simulated. Photon cross sections are taken from the XCOM database [16] and mass energy absorption coefficients are calculated with the application g as distributed with the EGSnrc package before 2017. Recent improvements[17] in the EGSnrc code and the application g mean that these mass energy absorption coefficient values would change by up to a maximum of 0.2% using the newer releases of EGSnrc. There is ambiguity in whether renormalized or unrenormalized Scofield photoelectric cross sections are in better agreement with experimental data [18]; the current work employs the unrenormalized cross sections (consistent with EGSnrc default [15]). Initial photon energies and probabilities are sampled from the NNDC [19] spectra for 103Pd, and 131Cs sources. For 125I, the photon spectrum from the NCRP Report 58 [20] is used since Rodriguez and Rogers [21] demonstrated that using the NCRP spectrum leads to better agreement with measured spectra for many seeds and it is consistent with the spectrum recommended by the BIPM for use by primary standards labs [22].
Dose calculations are done in a full scattering cylindrical water phantom (30 cm long, 15 cm radius). In addition, for three representative sources, a larger water phantom is modelled (40 cm long, 20 cm radius). For efficiency purposes, collision kerma and hence absorbed dose is scored in concentric cylindrical shells, as sources are cylindrically symmetric and there is charged particle equilibrium for low-energy brachytherapy sources. As discussed previously[23], to increase accuracy and reduce bin size artifacts, the radial () and length () resolutions of the cylindrical shells are 0.1 mm for 1 cm, 0.5 mm for 1 cm 5 cm, 1 mm for 5 cm 10 cm and 2 mm for cm where is the radial distance from the cylinder’s axis (and source is aligned along the -axis). All calculations employ egs_brachy’s tracklength scoring of collision kerma.
Air-kerma strength per history, , is scored in vacuo, using a scoring voxel located on the transverse axis 10 cm away from the source and of size 0.10.10.05 cm3 when approximating a point detector, or 2.662.660.05 cm3 when representing the solid angle subtended by the primary collimator of the NIST WAFAC [24] detector. The two voxel sizes are referred to as ‘Point’ and ‘WAFAC’ detectors, respectively, on the CLRP TG-43 website. In both cases, corrections are made to determine the air-kerma on the axis at the front of the detector using the same correction factors as used for CLRPv1[23]. The factors used are 1.0050 and 1.0168 for the point and WAFAC detectors respectively. Strictly speaking, the formula for these correction factors has been shown to be wrong in general[25]. However, for the geometries of the detectors used here, they have been shown to be highly accurate[25].
For most LDR sources, the point and WAFAC estimates of the air-kerma strength are the same. However for some low-energy sources in which the radioactivity is deposited on high-Z radio-opaque surfaces with sharp corners, the on-axis point estimate is lower because the high-Z materials attenuate photons from the end surfaces aimed on the axis[26]. This leads to a well-known dependence on the scoring voxel size when determining the air-kerma strength[23] and hence the dose-rate constant. The geometry of the detector’s sensitive region for air-kerma calculations is filled with a very low-density dry air, as recommend by TG-43.
Enough histories are simulated to ensure that , and results have a k=1 statistical uncertainty at cm, and DRC results have statistical uncertainties 0.2% for point detectors or 0.02% for WAFAC detectors.
II.A.1. Dealing with long sources
The corrections required to convert the average kerma in the WAFAC detector’s volume or front surface to the kerma on the axis as required for determining the air-kerma strength are usually derived analytically assuming that the source is an on-axis isotropically radiating point source. However, these assumptions break down for the long CivaTech sources. Paxton et al[27] showed that the NIST WAFAC cannot, in principle, directly measure the air-kerma strength for long sources because some photons would create charge outside the charge-collecting region. This issue does not affect the University of Wisconsin’s (UW’s) variable-aperture free-air chamber (VAFAC)[27]. However, that still leaves the issue of determining the corrections for non-point sources. We have done that by calculating the average air kerma per history in a thin (0.001 cm thick) circular detector (radius 1.333 cm) at 10 cm from the axis for a series of point sources off-axis and comparing that average to the air kerma per history in a small on-axis voxel ( cm3). The detector subtended the same solid angle as the NIST WAFAC or UW VAFAC detectors at 30 cm. The values of for line sources is then determined by integrating the corrections as a function of the point source’s distance off-axis. The values varied from 1.0094 for a point source to 1.0084 for a 5 cm line source. These values agree within 0.05% with those calculated by Paxton et al[27] of 1.0089 to 1.0087 for the same range of source lengths. The point source on axis compares well with the analytic value for detectors of the same area of 1.0094 (square detector) or 1.0090 (circular detector)[25]. On the assumption that there should be no difference in the air-kerma strength based on the WAFAC geometry or the point-source geometry, the ratio of the point to WAFAC geometry raw calculations for the CivaTech sources can also be used to estimate factors; on average, they agree within % with the values calculated based on integration of the point-source calculations.
II.B. Source Volume Correction
It was observed that dose values in voxels overlapping a source were affected by the sometimes large statistical variations in the source volume corrections which correct the voxel volume to account for this overlap. Thus, the statistical uncertainty on the source volume correction needs to be quantified and minimized for those phantom voxels which contain part of the source. The source volume correction calculations in egs_brachy are performed with a MC calculation in one of two source boundary shapes (cylinder or box) around a brachytherapy source. Random points within the boundary shape are generated with a specified random point density (cm-3). The number of points which fall inside both the source and the voxel of interest are tallied and also the total number within the boundary shape is known. The ratio of these two counts, i.e., the fraction of the volume of the bounding shape occupied by the source within the voxel of interest, is used to determine the source volume correction. The density of random points is specified in the input to egs_brachy and a range from 103 to 1012 cm-3 can be relevant. Figure 1 shows a typical source which overlaps 4 phantom voxels and is surrounded by a boundary shape (dashed line).
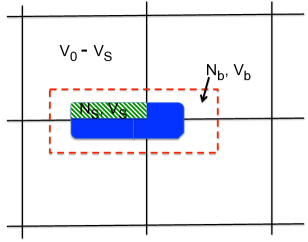
For each voxel overlapping the source, egs_brachy calculates the volume by tracking , the number of random points generated in that fall in the source region and within the voxel under consideration. Since the total boundary volume and the total number of points generated by egs_brachy within the source boundary volume, are known, then the source volume, , is calculated as:
| (1) |
where with (cm-3) being the density of random points used. The corrected volume () is then calculated as:
| (2) |
As the nature of MC target finding is binary (i.e., a point generated in is either in or not), it can be represented by a discrete Bernoulli distribution [28]. Therefore, if the mean fraction is /, the standard deviation of the mean would be
| (3) |
Using the error propagation law on the relationship between and / in equation (2), the final fractional uncertainty on can be written as:
| (4) |
or writing in terms of the volumes involved by using and :
| (5) |
where k is a constant depending only on and .
If a source volume correction is needed, its statistical uncertainty can play an important role and must be included in the statistical uncertainty on the voxel’s dose. Therefore, source volume correction uncertainties have been implemented in egs_brachy for voxels containing all or part of a source. The random point density,, is a user input.
Figure 2a presents the source volume correction, , as a function of different point densities () after the above statistics are implemented in egs_brachy for a specific region very close to a 6711 source ( cm, cm). These values are compared to the analytic volume correction. The error bars are statistical uncertainties generated by egs_brachy. When the point density is very low ( cm-3 with a seed volume of roughly 4 cm3), it is possible that no random points fall in (i.e., =0) and hence no volume correction is made. When the point density is increased ( cm-3), random points are generated in both parts of the voxel. As point density continues to increase, the code eventually calculates the correct phantom volume compared to the analytic calculation for a point density of within 0.2% (0.08%) where the calculated uncertainty is 0.5% (0.09%).
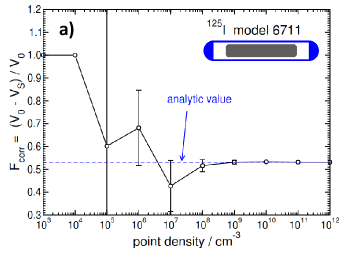
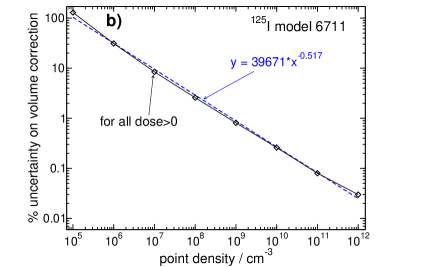
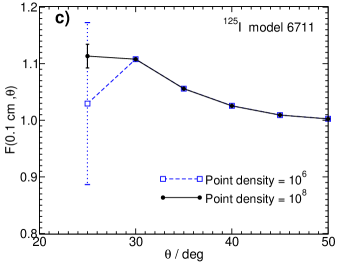
Figure 2b shows, as a function of point density, the average uncertainty on the volume correction for all voxels which overlap with a typical brachytherapy source (125I model 6711), have doses 0 (i.e., are not completely covered by the source), and have more than 2% of the voxel volume outside of the source. This last condition is to avoid the very occasional extreme fluctuation in uncertainty for these very small regions outside the source. As the point density is increased, the dose uncertainties decrease proportional to as seen in equation 5.
Figure 2c presents the calculated TG-43 anisotropy function for two different point densities ( vs ). Values are the same for cases in which volume corrections are not needed, but differ (albeit within statistical uncertainties) for regions close to the source (e.g., r= 0.1 cm, cm or ), where the voxel overlaps with the source. Such large differences explain why there are often large differences outside statistics between CLRPv1 (BrachyDose) and CLRPv2 (egs_brachy) results for voxels overlapping the source since the CLRPv1 data did not include the uncertainties on the volume correction. Fortunately, since the CLRPv1 data were only wrong in very high-dose regions or very small regions close to the source, they would have no practical effects on clinical dose evaluations using these data.
When the point density is increased 10 times (e.g., from to ), the volume correction calculation time increases approximately tenfold (e.g., from 0.09 to 0.93 sec for a single seed case). For the database calculations a point density of cm-3 was used which implies sub-1% average uncertainty on the volume corrections for voxels overlapping the sources.
II.C. TG-43 dosimetry parameters calculations
Following the 1995 TG-43 protocol [1, 3], the 2D dose-rate distribution around a sealed brachytherapy source is determined as:
| (6) |
where is the distance from the center of the source’s radioactivity to the point of interest, is the reference point which is defined at (1 cm, 90∘) on the transverse source axis, and denotes the polar angle determining the point of interest. Other quantities and functions are defined elsewhere in this paper, and are discussed in more detail in the TG-43 reports.
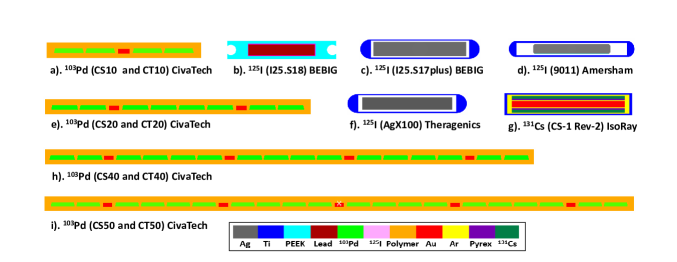
TG-43 dosimetry parameters are calculated for 40 low-energy LDR photon-emitting brachytherapy sources. The 13 sources added to the CLRPv2 database are shown in Figure 3. A detailed description of all 40 sources is available online in the database.
Each source is modelled using the egs++ class library [15] geometry module. The egs++ geometry models of all sources will be distributed freely with egs_brachy. For each source, the results of three 3D MC dose calculations in full-scatter water phantoms with different voxel resolutions (0.1, 0.5, and 1 mm3) and the results of two MC simulations of air-kerma strength measurements (Point and WAFAC detectors) are imported into an in-house Python software tool, which extracts all TG-43 data. The same Python suite was used to produce the CLRPv1 database. [10, 11] Dose values are tabulated as a function of distance from the source and polar angle relative to the long (Z) axis of the source. Dose values are interpolated bilinearly using the nearest neighboring voxels when the point of interest does not fall at the center of a voxel. The database specifies the effective active length of each source, , which accounts for the effect of the physical shape of the radioactive material distribution inside the source. It is calculated using the TG-43U1 effective line source length approximation [3, 29], and in some complicated cases (e.g.,103Pd Best Medical model 2335) the maximum distance between proximal and distal aspects of the radioactivity distribution is used. [29]
The radial dose function, , is calculated using point , and line source geometry functions, and is tabulated at intervals of 0.01 cm for cm, 0.1 cm for cm, and 0.5 cm for cm. Values at , 0.25, and 0.75 cm are also reported. Fitting coefficients for the following fifth-order polynomial functional form for as proposed by Taylor and Rogers [30] are also calculated.
| (7) |
For each source’s , the mean residual deviations from the actual data for the best fit functions are also reported (all ). The closest radius included in the fit is specified and varies between 0.03 and 0.2 cm. It varies since the very closest points sometimes ruin the entire fit and/or are inside the source.
Results from extrapolating values at larger radial distances from 10 to 15 cm using the above fitting coefficients agreed well with MC results from egs_brachy simulations in a larger water phantom (40 cm height and 20 cm radius) for a representative source for each isotope (mean differences in values for cm). Changes in cm) and cm, ) values were insignificant () when we performed calculation in the larger 40 cm phantom rather than the standard 30 cm phantom.
The 2D anisotropy function, , describes the variation in dose distribution in polar angle due to photon scattering and attenuation, as well as self-absorption and oblique filtration in source encapsulation. values are calculated using the line source approximation and tabulated at radii of 0.1, 0.15, 0.25, 0.5, 0.75, 1, 2, 3, 4, 5, 7.5 and 10 cm and at 32 polar angles with a minimum resolution of . For some sources (e.g., 103Pd CivaThin sources, and 125I model 9011) with smaller diameters (cm) than conventional brachytherapy sources, values at radii such as 0.05 or 0.07 cm are included.
The 1D anisotropy function (anisotropy factor), [3], is defined as the ratio of the solid-angle-weighted dose-rate averaged over 4 steradians, to the dose-rate at the same r distance on the transverse plane. These values are calculated by integrating the solid angle weighted dose-rate over . The factor is used in treatment planning when the source orientation is being ignored.
II.D. Data additional to TG-43 parameters
In addition to TG-43 parameters, the database provides along and away dose-rate per air-kerma strength data (cGy h-1 U-1), mean photon energy (; keV) for all LDR sources, as well as primary and scatter-separated (PSS) dose data for several sources.
Along and away dose-rate data in Cartesian coordinate are normalized to , air-kerma strength, and are tabulated at 12 away distances from 0 to 10 cm and 13 along points from 0 to 10 cm. The along and away tables can be used as part of the needed quality assurance checks while commissioning a specific source in a brachytherapy treatment planning system [7].
PSS data [31] are provided for the following representative sources: 103Pd TheraSeed 200, 125I 6711 and 130.002 models, and Isoray 131Cs Rev2 model. The data are tabulated at 24 radii from 0.10 to 10 cm and 24 polar angles with a minimum resolution of . High resolution ( r = 1 mm, ) PSS data are also provided. For the purposes of these calculations, scatter within the source is not considered as scatter so that any photon escaping the source encapsulation is considered a primary. Doses are normalized to the total photon energy escaping the encapsulation.
Photon energy spectra for each LDR source model are calculated using egs_brachy’s surface count scoring option. These were calculated in a water phantom with the egs_brachy spectrum-scoring routines ignoring photons scattered back across the surface from the water and so effectively are the spectra in vacuum. Although these back-scattered photons do have a small effect on the spectrum they have no effect on the spectrum’s mean energy. The mean photon energy, , for each source is in column 1 of Tables 1 and 2. The statistical uncertainty on the mean energy is less than 0.01%. Representative photon energy spectra for the 103Pd TheraSeed 200, 125I OncoSeed 6711, and 131Cs Cs-1 Rev2 sources are presented on the main page of the CLRPv2 database.
II.E. Data validation
Data are validated by comparisons to previously published measurements and calculations with other MC codes. DRC values are compared primarily to BrachyDose results from Rodriguez and Rogers [9, 21] or from Taylor and Rogers [10], as well as values from other codes and sources in the literature - see Tables 1 and 2. These comparisons give percent differences as:
| (8) |
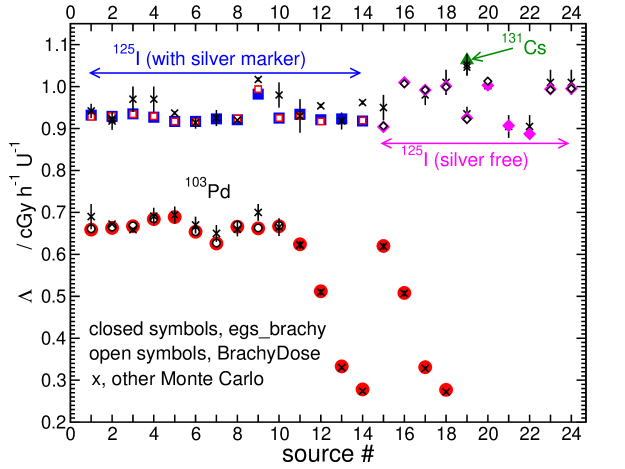
DRC values separated by radionuclide are shown in Figure 4. Due to the large amount of data, detailed comparisons of and are omitted here, but the comparisons are available in the database along with further DRC comparisons when available.
In general, the CLRPv2 DRC values show excellent agreement with the BrachyDose results which modelled the same geometry with a maximum difference of 0.6% from the data of Rodriguez and Rogers [9] and/or Taylor and Rogers [10]. This excludes the differences due to changes in how the source geometry was modelled as discussed below. The average difference is % for 125I sources and % for 103Pd sources which is excellent agreement given the statistical uncertainty of 0.3% on the earlier BrachyDose results.
The mean DRC value for most 103Pd sources is 0.664 (cGy h-1 U-1) with a sample standard deviation of 0.017. The exceptions are the plastic encapsulated CivaTech source families of CivaString (CS10–CS50) and CivaThin (CT10–CT50) with values ranging from 0.624 to 0.277 (Table 1 and Figure 4). As the source length is increased from 1 cm (CS10 or CT10 sources) to 5 cm (CS50 or CT50 sources), the DRC values decrease. This is due to the increase in the average photon pathlength from the source to the reference point on the axis at 1 cm and hence the increased attenuation in the water phantom.
The corresponding mean DRC value for all 125I sources is 0.943 (cGy h-1 U-1) with a sample standard deviation of 0.037 (Table 2). The DRC value for the 131Cs Rev2 source is 1.06 and larger than the average values for 103Pd and 125I due its to relatively higher-energy spectrum, which leads to less photon attenuation in the water phantom. The mean photon energies calculated for all 103Pd, 125I, and 131Cs sources are 20.55, 27.68, and 30.29 keV respectively (Tables 1 and 2, column 1).
For all 125I source models containing a silver marker (indicated by a superscript ‘a’ in Table 2), the average DRC is 0.929 cGy h-1 U-1 which is about 3.5% lower than the average DRC of 0.962 cGy h-1 U-1 for sources without a silver marker. This is due to the lower-energy (22, 25 keV) characteristic x rays from silver [32, 21, 9, 33, 34] which reduce the average energy of the spectrum from the source. The mean energy of 125I sources with a silver marker is 27.35 keV which is 0.8 keV lower than the average energy of 28.14 keV from sources without a silver marker (Table 2, column 1). The IPlant 3500 with a silver marker (source 9) is an outlier, with a higher DRC value of 0.982 cGy h-1 U-1. This is because the radioactive material is not directly distributed on the silver marker’s surface [35], leading to a higher mean photon energy and DRC value. The silver marker in 103Pd sources has virtually no effect since the initial 103Pd photons do not excite the silver x rays. In Figure 4, those 125I sources with DRCs are silver-free but not all silver-free sources have higher DRCs (i.e., sources 15, 19, 21 and 22). The BT-125-1 model (source 15) has a palladium marker and the LS-1 model (source 19) has a platinum/iridium marker. These high-Z markers mainly generate x-ray spectral components similar to sources containing a silver marker [34]. The spectra of S18 sources [36] (sources 21 and 22) have a small number of low-energy x rays (10 to 15 keV) due to the composition of their lead-glass marker. There are not enough low-energy x rays to significantly decrease the average energy of the spectrum. However they do increase the air-kerma strength (due to the large mass energy absorption coefficient of air at these lower energies) but do not affect the dose at the reference point since they are attenuated in the water. Together these effects result in a lower DRC value.
There are some sources that show a significant DRC discrepancy when comparing egs_brachy and earlier BrachyDose values[10, 21, 9]. These are denoted by a superscript ’f’ in Tables 1 and 2. For these four sources, the original BrachyDose air-kerma calculations mistakenly included a thin cylindrical shell of water around the sources which decreased the air-kerma strength and hence increased the DRC values. After the source geometries were fixed the mean DRC value deviations between BrachyDose and egs_brachy values is reduced to 0.1% with differences ranging from -0.6% to 0.4%. A source with different geometry models in egs_brachy and BrachyDose (source 13, Table 2) is omitted from these differences.
Sources for which no BrachyDose results are available have DRCs which are within the statistical uncertainties of other published values.
[ (eb,TG43con)]. The mean emitted photon energy () of each source determined by egs_brachy is indicated.
| Dose-rate constant (cGy h-1 U-1) | |||||||
| Source model (/keV) | This | RR [9] | TR [10] | Other | TG-43con | ||
| work(eb) | BD | BD | (eb,BD) | MC | (eb,TG43con) | ||
| 103Pd | |||||||
| 1 IAPd-103Aa (20.51) | 0.659 | 0.661 | 0.687f | -0.3 | 0.69(3) [37] | 0.693(31) [6] | -5.2 |
| 2 Med3633a (20.50) | 0.663b | 0.665g | 0.650 | -0.3 | 0.672 [38] | 0.688 [3] | -3.8 |
| 3 BT-103-3a (20.50) | 0.667 | 0.668e | 0.671 | 0.1 | 0.659(5) [39] | n/a | n/a |
| 4 TheraSeed 200c,i (20.51) | 0.684 | 0.685g | 0.694 | -0.1 | 0.691(20) [40] | 0.686 [3] | -0.3 |
| 5 TheraSeed 200d,i (20.55) | 0.689 | n/a | n/a | n/a | 0.694(20) [40] | n/a | n/a |
| 6 BestPd-103 2335 (20.54) | 0.654b | 0.654 | 0.650 | 0.0 | 0.67(20) [41] | 0.685 [5] | -4.7 |
| 7 BrachySeed Pd-1 (20.55) | 0.626 | 0.627 | 0.632h | -0.2 | 0.65(20) [42] | n/a | n/a |
| 8 BEBIG Pd-103 (20.50) | 0.666b | 0.670e | 0.685f | -0.60 | 0.660(17) [43] | n/a | n/a |
| 9 1031Li (20.47) | 0.662b | 0.663 | 0.663 | -0.1 | 0.70(20) [44] | 0.701(20) [6] | -5.9 |
| 10 1032Pi (20.54) | 0.667b | 0.669j | 0.669 | -0.3 | 0.665(21) [45] | 0.671(19) [6] | -0.6 |
| 11 CivaString CS10 (20.59) | 0.624 | n/a | n/a | n/a | 0.623(8) [46] | 0.641(17) [6] | -2.7 |
| 0.622(9) [47] | |||||||
| 12 CivaString CS20 (20.58) | 0.512 | n/a | n/a | n/a | 0.510(7) [46] | n/a | n/a |
| 13 CivaString CS40 (20.59) | 0.333 | n/a | n/a | n/a | 0.330(4) [46] | n/a | n/a |
| 14 CivaString CS50 (20.58) | 0.279 | n/a | n/a | n/a | 0.274(4) [46] | n/a | n/a |
| 15 CivaThin CT10 (20.58) | 0.620 | n/a | n/a | n/a | 0.619(8) [46] | n/a | n/a |
| 16 CivaThin CT20 (20.58) | 0.509 | n/a | n/a | n/a | 0.507(7) [46] | n/a | n/a |
| 17 CivaThin CT40 (20.58) | 0.331 | n/a | n/a | n/a | 0.328(4) [46] | n/a | n/a |
| 18 CivaThin CT50 (20.58) | 0.277 | n/a | n/a | n/a | 0.272(4) [46] | n/a | n/a |
| 131Cs | |||||||
| 19 CS-1 Rev2 (30.29) | 1.063 | n/a | n/a | n/a | 1.046(19) [48] | 1.056(13) [6] | 0.7 |
| 1.052(26) [49] | |||||||
a Sources which include silver marker
b There is a change in the model of the source described in the database
c 103Pd Theragenics ‘Light seed’: thickness of Pd radioactive
coating layer on graphite surface is 2.2 m
d 103Pd Theragenics ‘Heavy seed’: thickness of Pd radioactive
coating layer on graphite surface is 10.5 m
e BrachyDose values recalculated for this work after correcting the geometry
f BrachyDose values differ from egs_brachy values because of water envelope geometry known to be the cause of change
g There were some geometry changes reported in RR[9]
but the exact difference is unknown since the TR[10] geometry file
is lost
h There is an unexplained change since we do not have the MC input
file of TR[10]
i Considering air and water in the central ‘empty’ region of the source,
there is a negligible difference (0.05%) in DRC
j This value is taken from ref. RR[21]
| Dose-rate constant (cGy h-1 U-1) | |||||||
| Source model (/keV) | This | RR [9] | TR [10] | Other | TG-43con | ||
| work(eb) | BD | BD | (eb,BD) | MC | (eb,TG43con) | ||
| 1 OncoSeed 6711a (27.34) | 0.932b | 0.928 | 0.924 | 0.4 | 0.942(17) [50] | 0.965 [3] | -3.5 |
| 2 ThinSeed 9011a (27.26) | 0.929 | 0.930 | n/a | -0.1 | 0.923(4) [51] | 0.933(28) [6] | -0.4 |
| 3 EchoSeed 6733a,c (27.24) | 0.935 | 0.934 | n/a | 0.1 | 0.97(3) [52] | 0.980 [5] | -4.8 |
| 4 EchoSeed 6733a,d (27.29) | 0.927 | n/a | 0.929 | -0.2 | 0.97(3) [52] | n/a | |
| 5 Braquibaca (27.42) | 0.917 | n/a | 0.917 | 0.0 | 0.937(4) [53] | n/a | n/a |
| 6 I25.S17a (27.28) | 0.917 | 0.915 | 0.916 | 0.1 | 0.914(14) [54] | 0.933(25) [6] | -1.7 |
| 7 I25.S17plusa (27.30) | 0.923 | n/a | n/a | n/a | 0.925(19) [55] | 0.940(25) [6] | -1.8 |
| 8 IS-12501a (27.19) | 0.921b | 0.924 | 0.924 | -0.3 | 0.92 [56] | 0.940 [3] | -2.1 |
| 9 IPlant 3500a,l (28.30) | 0.982b | 0.987e | 0.994f | -0.5 | 1.017(5) [35] | 1.014 [5] | -3.3 |
| 10 IAI-125Aa (27.27) | 0.925b | 0.925 | 0.925 | 0.0 | 0.98(3) [57] | 0.981 [5] | -6.1 |
| 11 125SLa (27.17) | 0.934 | 0.931 | 0.93 | 0.3 | 0.93(4) [58] | 0.953 [5] | -2.0 |
| 12 130.002a (27.23) | 0.921 | 0.917 | 0.917 | 0.4 | 0.954(5) [59] | 0.954(43) [6] | -3.6 |
| 13 AgX100 (27.29) | 0.923 | 0.900 | n/a | 2.5 | 0.918(20) [60] | 0.952(43) [6] | -2.5 |
| 14 BT-125-2a (27.35) | 0.918b | na | 0.916 | 0.2 | 0.962(5) [61] | n/a | n/a |
| 15 BT-125-1 (27.28) | 0.904b | 0.906 | 0.901 | -0.2 | 0.95(3) [62] | n/a | n/a |
| 16 OncoSeed 6702 (28.36) | 1.010 | 1.007 | 1.000 | 0.3 | 1.009 [63] | 1.036 [3] | -2.6 |
| 17 STM1251 (28.44) | 0.992b | 0.992g | 1.012 | 0.0 | 0.98(2.4) [64] | 1.018 [5] | -2.6 |
| 18 Best 2301 (28.39) | 1.001 | 0.999 | 0.998 | 0.2 | 1.01(3) [65] | 1.018 [3] | -1.7 |
| 19 LS-1 (27.83) | 0.925 | 0.922 | 0.922 | 0.3 | 0.935(17) [66] | 0.972 [5] | -5.1 |
| 20 I25.S06 (.S16) (28.16) | 1.003b | 1.004e | 1.011f | -0.1 | 1.002 [67] | 1.012 [3] | -0.9 |
| 21 BEBIG I25.S18j (28.17) | 0.907 | n/a | n/a | n/a | 0.905(27) [36] | 0.893(32) [6] | 1.5 |
| 22 BEBIG I25.S18k (28.12) | 0.887 | n/a | n/a | n/a | 0.905(27) [36] | n/a | n/a |
| 23 1251Li (28.32) | 0.994 | 0.991 | 0.992 | 0.2 | 1.01(3) [68] | 1.038 [5] | -4.4 |
| 24 Med3631 (28.36) | 0.995 | 0.995h | 0.978 | 0.0 | 1.01(3) [69] | 1.036 [3] | -4.1 |
a Sources which include silver marker.
b There is a change in the model of the source described in the database
c 125I coating layer in EchoSeed 6733 is assumed to have a
thickness of 10m on surface of silver marker
d 125I coating layer in EchoSeed 6733 is assumed to have a
thickness of 2 m on surface of silver marker
e BrachyDose values recalculated for this work after correcting the geometry
f BrachyDose values differ from egs_brachy values due to water envelope geometry
causing the change
gThere were some geometry changes in RR[9] but the
original TR[10] geometry coding is lost.
h There is an unexplained change since we do not have the MC input file of RR [9]
i Considering air and water in hole portion of the source, there is a negligible difference (0.05%) in DRC
j with minimum available %18 Lead-glass (PbO) as a marker
in Bebig I25.S18 source
k with maximum available %32 Lead-glass (PbO) as a marker
in Bebig I25.S18 source
l Radioactive material in IPlant3500 source is far away from
silver marker, which causes a higher mean energy and also DRC value
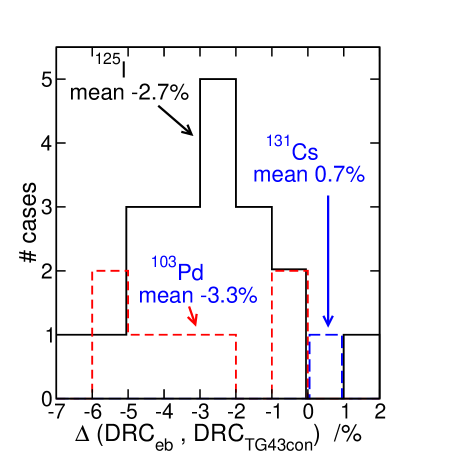
As mentioned above, the TG-43 consensus DRC values for low-energy brachytherapy sources have been determined by taking an average of the average of MC calculations results and the average of the experimental measurements. Figure 5 plots the data listed in the last column in Tables 1 and 2. It shows that the Monte Carlo DRC values are generally lower than consensus values. This is primarily due to errors in the measured DRCs caused by ignoring the intrinsic energy dependence of TLD detectors and the generally large systematic uncertainties in the measurements[9]. The mean (range) differences between CLRPv2 and TG-43con DRC values for 103Pd, 125I, and 131Cs sources are -3.3% (-6%, -0.3%), -2.7% (-6.1%, 1.5%), and 0.7%, respectively. As suggested before[9], this indicates there is a need to revise many of the consensus values of DRCs for LDR sources and possibly to base these solely on the Monte Carlo calculated values.
In general, values are in agreement with BrachyDose results within statistical uncertainties for all sources studied, except for some regions very close to the source where differences outside statistical uncertainties and up to 3% were found. This is because the statistical uncertainties in the source volume correction needed for small values were not accounted for in the BrachyDose calculations.
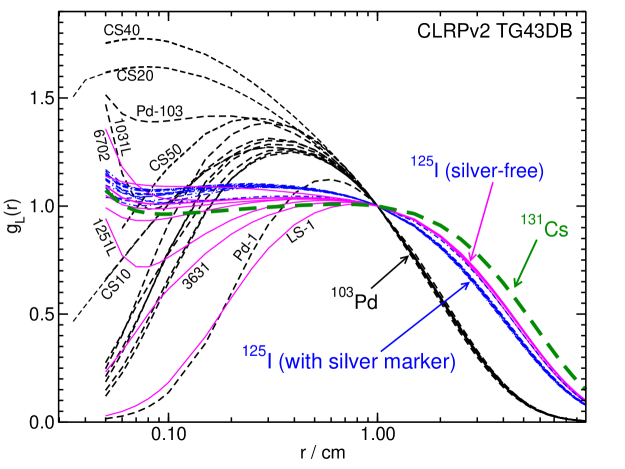
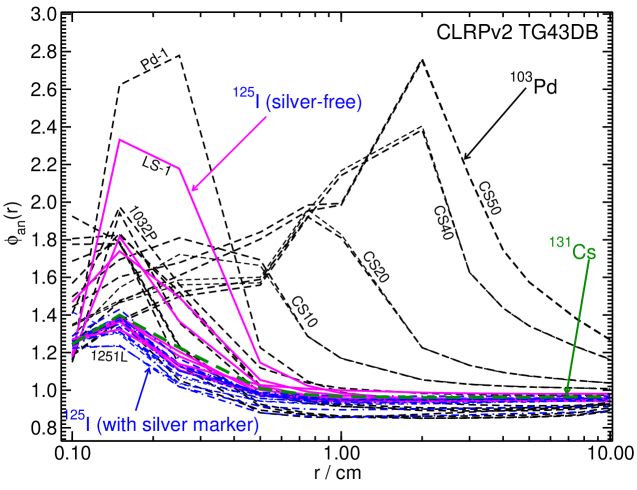
Figure 6 presents values as a function of for all the sources. For sources of the same radionuclide, 1 cm) values are nearly indistinguishable except for differences between silver-marker and silver-free 125I sources, for the same reasons outlined in section II.E..
For cm, as discussed previously[30] the behaviour is quite different depending on whether they are a class A source (two or more sources of radiation separated by a radio-opaque marker) or a class B source (radioactive material distributed along the length of the source including at the center). For class A sources, there is a dose build-up along the transverse source axis (103Pd CS(CT)10, CS(CT)50, Pd-1, and 125I LS-1, 3631 sources in Figure 6) because there is no radioactivity on the transverse axis. This, in turn, causes the dose to be low very close to the source. For class B sources (103Pd CS(CT)20, CS(CT)40, Pd-103, and all 125I sources with a silver marker in Figure 6) 1 cm) values are roughly flat, with a slight upturn at the smallest values, except for the much longer CivaTech sources. In class B sources, the radioactivity is uniformly distributed and very close to the source. In this case the simple geometry factor, , breaks down and only the radioactivity directly on the axis matters, thus attenuation in the walls of the source has a relatively smaller impact.
Plots in the database of for each source show that most 2D anisotropy function values agree within statistical uncertainties with those calculated using BrachyDose. There are a few exceptions. For all CLRPv2 LDR sources, the anisotropy functions for regions very close to the source show differences vs CLRPv1, up to 46% due to unspecified and presumably large statistical uncertainties in the source volume correction used with CLRPv1. The CLRPv2 values include this uncertainty and are thus more reliable (see the effects in Figure 2c). There are other differences which are traceable to changes in the geometric models of the seeds and these changes are specified in the database.
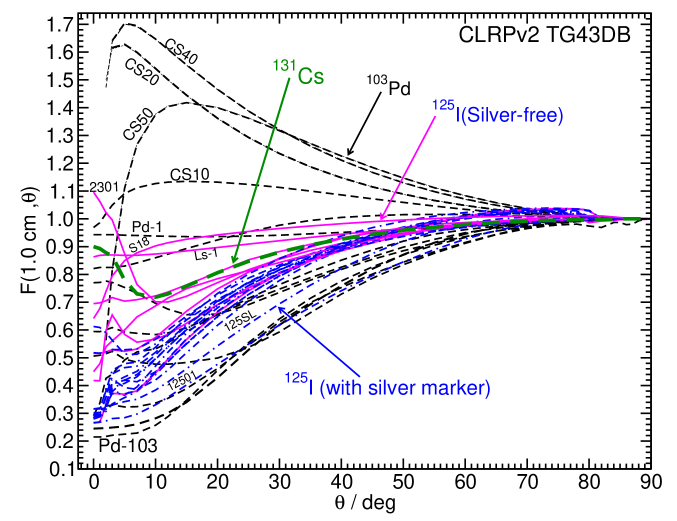
Figure 7 presents values for all the
sources in the database. Generally it is seen that the end caps attenuate
the doses near 0 degrees. Sources with beads at either end separated by a
marker (e.g., Pd-1 and Ls-1 sources) maintain anisotropy values close to
unity even close to 0 degrees. The long CivaTech sources can have very
high values at 5 to 10 degrees because those points are close to the
radioactivity in the longer sources.
Some brachytherapy treatment planning systems use a 1D dosimetry formalism
by replacing the 2D anisotropy function in Equation 6,
F(), with a 1D anisotropy factor, [3].
Values of for each source are included in the database and
are shown in Figure 8.
Values of varied between 0.85 and 1.0 for cm,
except for the longer CivaTech sources where the low value of the DRC, and
hence dose at the reference position (1 cm, 90∘), led to higher values
at larger distances due to source length.
III. Data Format and Access
The CLRPv2 TG-43 parameter database is available online at https://physics.carleton.ca/clrp/egs_brachy/seed_database_v2 with a digital object identifier (DOI) at http://doi.org/10.22215/clrp/tg43v2. The website is hosted by Carleton University, in Ottawa, Canada. The main page of the database lists all sources for which datasets are available, information on the radionuclide source spectra and the half-lives used, and information about spectrum average energies.
The CLRPv2 TG-43 database for low-energy LDR brachytherapy sources contains roughly 315 data tables and 235 figures which include approximately 65,000 data points. These datasets include available and discontinued source models (for retrospective analysis).
For each source model, the following information is available in the CLRPv2 database:
-
•
A to-scale image showing a longitudinal cross-section of the source model created using an egs_view image of the actual egs++ model of the source.
-
•
A description of the source’s geometric model according to the literature and manufacturer information, as implemented in egs++. These models will be released for use with the open-source egs_brachy application.
- •
- •
-
•
A table of fitting coefficients for using the Taylor and Rogers modified polynomial function [30]. Extrapolating the values using the current fitting coefficients was validated for larger distances (10 cm cm) with average differences of % from values based on MC simulations in a larger phantom (40 cm height and diameter) .
- •
-
•
Tabulated along-away dose data (normalized to the air-kerma strength).
-
•
Low resolution PSS (primary-scatter separated) tabulated data for 103Pd TheraSeed 200, 125I 6711 and 130.002, and 131Cs Rev2 models, along with plots of representative PSS data for these sources at different angles and radial distances. High resolution PSS data files for these sources are also provided in CSV (comma-separated values) format.
-
•
A complete set of tabulated data for each individual source (DRC, and fitting coefficients, , and along and away tables) in Microsoft Excel .xlsx format.
IV. Potential Impact
Despite growing momentum towards adoption of model-based dose calculation algorithms (MBDCAs) [70], clinical brachytherapy dose prescriptions remain, for the time being, based on the AAPM TG-43 dose calculation formalism [1, 3, 4, 5, 6, 7, 8]. Given that the vast majority of the TG-43 DRC consensus values are underestimated (on average by 3%), the more accurate MC-calculated datasets may, in future, be used directly. The CLRPv2 data may be used for research related to TG-43 dosimetry and brachytherapy planning, and may be considered in future updates to the TG-43 consensus data. Additional brachytherapy sources may be added to the database in the future, as new source models are released. A few typos and inaccuracies in the source geometry descriptions on the CLRPv1 database have also been corrected in the v2 database. Those corrections are noted in the text on the database. Finally, the complete brachytherapy source geometry models described in the CLRPv2 database will be released for use with the egs_brachy EGSnrc application. Release of all benchmarked source models will enable egs_brachy’s use for patient-specific model-based dose calculations, thus supporting further research and clinical adoption of MBDCAs as recommended by AAPM-ESTRO-ABG TG-186 [70].
V. Conclusion
This database provides an update to the CLRP TG-43 dosimetry parameters (CLRPv2) using the EGSnrc egs_brachy application for 40 low-energy photon-emitting LDR brachytherapy sources (22 125I, 17 103Pd, and 1 131Cs ), as well as source models to be distributed with egs_brachy. Overall, the results are in good agreement with the previous CLRP TG-43 database (CLRPv1) which used the BrachyDose application to extract the TG-43 parameters for 18 125I and 9 103Pd sources. Statistical uncertainties, source volume corrections, and modelling of several source geometries are all improved in comparison to CLRPv1 calculations. The 22 125I sources are categorized into two groups: with and without silver marker. The general trends show clearly that 125I sources with silver markers have lower DRC values than those without. This is due to the contribution of lower-energy silver x rays which reduce the mean energy of the source spectrum. With a silver marker, the mean DRC value is 0.929 with a sample deviation of 0.016 cGy h-1 U-1 and for silver-free 125I sources the mean DRC is 0.962 0.049 cGy h-1 U-1. For 103Pd sources, the mean DRC value is 0.664 0.017 cGy h-1 U-1 except for the plastic encapsulated CivaString and CivaThin source families. The DRC value for the 131Cs source is larger (1.06 cGy h-1 U-1) due to the relatively high-energy spectrum compared to the other two radionuclides. More details of other TG-43 parameters are extensively presented in the CLRPv2 database which is hosted at Carleton University website (https://physics.carleton.ca/clrp/egs_brachy/seed_database_v2).
VI. Acknowledgements
This work was supported by the Natural Sciences and Engineering Research Council of Canada, the Canada Research Chairs program, the Ministry of Research and Innovation of Ontario, and a Compute Canada National Resource Allocation. The authors thank Mark Rivard for clarification of source descriptions, as well as Wes Culberson, and Larry DeWerd for providing information on the CivaString sources.
References
- 1 R. Nath, L. L. Anderson, G. Luxton, K. A. Weaver, J. F. Williamson, and A. S. Meigooni, Dosimetry of interstitial brachytherapy sources: Recommendations of the AAPM Radiation Therapy Committee Task Group No. 43, Med. Phys. 22, 209 – 234 (1995).
- 2 L. A. DeWerd et al., A dosimetric uncertainty analysis for photon-emitting brachytherapy sources: Report of AAPM Task Group No. 138 and GEC-ESTRO, Med. Phys. 38, 782 – 801 (2011).
- 3 M. J. Rivard et al., Update of AAPM Task Group No. 43 Report: A revised AAPM protocol for brachytherapy dose calculations, Med. Phys. 31, 633 – 674 (2004).
- 4 M. J. Rivard et al., Erratum: “Update of AAPM Task Group No. 43 Report: A revised AAPM protocol for brachytherapy dose calculations” [Med. Phys. 31, 633–674 (2004)], Med. Phys. 31, 3532 – 3533 (2004).
- 5 M. J. Rivard et al., Supplement to the 2004 update of the AAPM Task Group No. 43 Report, Med. Phys. 34, 2187 – 2205 (2007).
- 6 M. J. Rivard et al., Supplement 2 for the 2004 update of the AAPM Task Group No. 43 Report: Joint recommendations by the AAPM and GEC-ESTRO, Med. Phys. 44, e297 – e338 (2017).
- 7 M. J. Rivard et al., Erratum: “Supplement 2 for the 2004 update of the AAPM Task Group No. 43 Report: Joint recommendations by the AAPM and GEC-ESTRO”[Med. Phys. Vol44(9),e297-e338(2017)], Med. Phys. 45, 971 – 974 (2018).
- 8 J Perez-Calatayud et al., Dose calculation for photon-emitting brachytherapy sources with average energy higher than 50keV: Report of the AAPM and ESTRO, Med. Phys. 39, 2904 – 2929 (2012).
- 9 M. Rodriguez and D. W. O. Rogers, Effect of improved TLD dosimetry on the determination of dose rate constants for 125I and 103Pd brachytherapy seeds, Med. Phys. 41, 114301 (15pp) (2014).
- 10 R. E. P. Taylor and D. W. O. Rogers, An EGSnrc Monte Carlo-calculated database of TG-43 parameters, Med. Phys. 35, 4228 – 4241 (2008).
- 11 R. E. P. Taylor and D. W. O. Rogers, EGSnrc Monte Carlo calculated dosimetry parameters for 192Ir and 169Yb brachytherapy sources, Med. Phys. 35, 4933 – 4944 (2008).
- 12 R. E. P. Taylor and D. W. O. Rogers, The Carleton Laboratory for Radiotherapy Physics TG-43 Parameter Database, http://physics.carleton.ca/clrp/seeddatabase .
- 13 M. Chamberland, R. E. P. Taylor, D. W. O. Rogers, and R. M. Thomson, egs_brachy: a versatile and fast Monte Carlo code for brachytherapy, Phys. Med. Biol. 61, 8214 – 8231 (2016).
- 14 R. M. Thomson, R. E. P. Taylor, M. J. P. Chamberland, and D. W. O. Rogers, Reply to Comment on ’egs_brachy: a versatile and fast Monte Carlo code for brachytherapy’, Phys. Med. Biol. 63, 038002(5pp) (2018).
- 15 I. Kawrakow, E. Mainegra-Hing, F. Tessier, R. Townson, and B. Walters, EGSnrc C++ class library, Technical Report PIRS–898, National Research Council Canada, Ottawa, Canada,http://nrc-cnrc.github.io/EGSnrc/doc/pirs898/index.html, 2018.
- 16 M. J. Berger and J. H. Hubbell, XCOM: Photon cross sections on a personal computer, Report NBSIR87–3597, National Institute of Standards Technology (NIST), Gaithersburg, MD 20899, U.S.A., 1987.
- 17 D. W. O. Rogers and R. W. Townson, On calculating kerma, collision kerma and radiative yields, Med. Phys. 46, 5173 – 5184 (2019).
- 18 ICRU, ICRU Report Committee Activities, in ICRU News(ICRU, Bethesda MD), June , 20 (1990).
- 19 Brookhaven National Laboratory, National Nuclear Data Center, http://www.nndc.bnl.gov/nudat2.
- 20 NCRP Report 58, A Handbook of Radioactivity Measurements Procedures, NCRP Publications, 7910 Woodmont Avenue, Bethesda, MD. 20814 USA (1985).
- 21 M. Rodriguez and D. W. O. Rogers, On determining dose rate constants spectroscopically, Med. Phys. 40, 011713 (10pp) (2013).
- 22 BIPM, Monographie BIPM-5: Table of Radionuclides: Vol 6, Technical report, BIPM, Sevres, France: http://www.bipm.org/en/publications/scientific-output/monographie-ri-5.html, 2011.
- 23 R. E. P. Taylor, G. Yegin, and D. W. O. Rogers, Benchmarking BrachyDose: voxel-based EGSnrc Monte Carlo calculations of TG–43 dosimetry parameters, Med. Phys. 34, 445 – 457 (2007).
- 24 S. M. Seltzer, P. J. Lamperti, R. Loevinger, M. G. Mitch, J. T. Weaver, and B. M. Coursey, New National Air-Kerma-Strength Standards for 125I and 103Pd Brachytherapy Seeds, J. Res. Natl. Inst. Stand. Technol. 108, 337 – 358 (2003).
- 25 D. W. O. Rogers, Inverse square corrections for FACs and WAFACs, Appl. Radiat. Isot. 153, 108638(8pp) (2019).
- 26 J. F. Williamson, Monte Carlo modeling of the transverse-axis dose distribution of the Model 200 103Pd interstitial brachytherapy source, Med. Phys. 27, 643 – 654 (2000).
- 27 A. B. Paxton, W. S. Culberson, L. A. DeWerd, and J. A. Micka, Primary calibration of coiled brachytherapy sources, Med. Phys. 35, 32–38 (2008).
- 28 W. Feller, An introduction to probability theory and its applications, Wiley, New York, 1967.
- 29 M. J. Rivard, W. M. Butler, L. A. DeWerd, M. S. Huq, G. S. Ibbott, C. S. Melhus, M. G. Mitch, R. Nath, and J. J. Williamson, Response to “Comment on ‘Update of AAPM Task Group No. 43 Report: A revised AAPM protocol for brachytherapy dose calculations”, Med. Phys. 32, 1822 – 1824 (2005).
- 30 R. E. P. Taylor and D. W. O. Rogers, More accurate fitting of 125I and 103Pd radial dose functions, Med. Phys. 35, 4242 – 4250 (2008).
- 31 K. R. Russell, A. K. Carlsson-Tedgren, and A. Ahnesjö, Brachytherapy source characterization for improved dose calculations using primary and scatter dose separation, Med. Phys. 32, 2739 – 2752 (2005).
- 32 J. Cygler, J. Szanto, M. Soubra, and D. W. O. Rogers, Effects of gold and silver backings on the dose rate around an 125I seed, Med. Phys. 17, 172 – 178 (1990).
- 33 R. Nath and Z. J. Chen, Silver fluorescent x-ray yield and its influence on the dose rate constant for nine low-energy brachytherapy source models, Med. Phys. 34, 3785 – 3793 (2007).
- 34 B. H. Heintz, R. E. Wallace, and J. M. Hevezi, Comparison of I-125 sources used for permanent interstitial implants, Med. Phys. 4, 671 – 682 (2001).
- 35 M. J. Rivard, Comprehensive Monte Carlo calculations of AAPM Task Group Report No. 43 dosimetry parameters for the Model 3500 I-Plant 125I brachytherapy source, Appl. Radiat. Isot. 57, 381 – 389 (2002).
- 36 F. Abboud, M. Hollows, P. Scalliet, and S. Vynckier, Experimental and theoretical dosimetry of a new polymer encapsulated iodine-125 source SmartSeed: Dosimetric impact of fluorescence x rays, Med. Phys. 37, 2054 – 2062 (2010).
- 37 A. S. Meigooni, S. A. Dini, S. B. Awan, K. Dou, and R. A. Koona, Theoretical and experimental determination of dosimetric characterictics for ADVANTAGE Pd-103 brachytherapy source, Appl Radiat Isot. 64, 881 – 887 (2006).
- 38 M. J. Rivard, A discretized approach to determining TG-43 brachytherapy dosimetry parameters: case study using Monte Carlo calculations for the MED3633 103Pd source, Appl. Radiat. Isot. 55, 775–782 (2001).
- 39 J. J. DeMarco, G. Hugo, and T. D. Solberg, Dosimetric characteristics for three low-energy brachytherapy sources using the Monte Carlo N-Particle code, Med. Phys. 29, 662 – 668 (2002).
- 40 J. I. Monroe and J. F. Williamson, Monte Carlo-aided dosimetry of the Theragenics TheraSeed Model 200 103Pd interstitial brachytherapy seed, Med. Phys. 29, 609 – 621 (2002).
- 41 A. S. Meigooni, Z. Bharucha, M. Yoe-Sein, and K. Sowards, Dosimetric characteristics of the Best double-wall 103Pd brachytherapy source, Med. Phys. 28, 2567–2575 (2001).
- 42 A. S. Meigooni, H. Zhang, C. Perry, S. A. Dini, and R. A. Koona, Theoretical and experimental determination of dosimetric characteristics for brachyseed Pd-103, model Pd-1, source, Appl. Rad. and Isotopes 58, 533–541 (2003).
- 43 G. M. Daskalov and J. F. Williamson, Monte Carlo-aided dosimetry of the new Bebig IsoSeed 103Pd interstitial brachytherapy seed, Med. Phys. 28, 2154 – 2161 (2001).
- 44 A. S. Meigooni, K. Sowards, and M. Soldano, Dosimetric characteristics of InterSource103 palladium brachytherapy source, Med. Phys. 27, 1093–1100 (2000).
- 45 Z. Wang and N. Hertel, Determination of dosimetric characteristics of OptiSeed a plastic brachytherapy 103Pd source, Appl. Radiat. Isot. 63, 311–321 (2005).
- 46 M. J. Rivard, J. L. Reed, and L. A. DeWerd, 103-Pd strings: Monte Carlo assessment of a new approach to brachytherapy source design, Med. Phys. 41, 011716 (11pp) (2014).
- 47 M. Reynolds, B. G. Fallone, and S. Rathee, Dose response of selected solid state detectors in applied homogeneous transverse and longitudinal magnetic fields, Med. Phys. 41, 092103 (12pp) (2014).
- 48 M. J. Rivard, Brachytherapy dosimetry parameters calculated for a 131Cs source, Med. Phys. 34, 754 – 762 (2007).
- 49 C. S. Melhus and M. J. Rivard, COMS eye plaque brachytherapy dosimetry simulations for 103Pd, 125I, and 131Cs, Med. Phys. 35, 3364 – 3371 (2008).
- 50 J. Dolan, Z. Li, and J. F. Williamson, Monte Carlo and experimental dosimetry of an 125I brachytherapy seed, Med. Phys. 33, 4675 – 4684 (2006).
- 51 R. M. Kennedy, S. D. Davis, J. A. Micka, and L. A. DeWerd, Experimental and Monte Carlo determination of the TG-43 dosimetric parameters for the model 9011 THINSeed brachytherapy source, Med. Phys. 37, 1681 – 1688 (2010).
- 52 K. Sowards and A. S. Meigooni, A Monte Carlo evaluation of the dosimetric characteristics of the EchoSeed™Model 6733 125I brachytherapy source, Brachytherapy 1, 227–232 (2002).
- 53 R. Pirchio, E. Galiano, M. Saravi, D. Banchik, and C. Muñoz, On the physical, spectra, and dosimetric characteristics of a new 125I brachytherapy source, Med. Phys. 34, 2801–2806 (2007).
- 54 G. Lymperopoulou, P. Papagiannis, A. Angelopoulos, L. Sakelliou, P. Karaiskos, P. Sandilos, A. Przykutta, and D. Baltas, Monte Carlo and thermoluminescence dosimetry of the new IsoSeed model I125.S17 125I interstitial brachytherapy seed, Med. Phys. 32, 3313 – 3317 (2005).
- 55 E. Pantelis, P. Papagiannis, G. Anagnostopoulos, and D. Baltas, New 125I brachytherapy source IsoSeed I25.S17 plus: Monte Carlo dosimetry simulation and comparison to sources of similar design, J. Contemp. Brachytherapy 5, 240 – 249 (2013).
- 56 G. S. Ibbott, A. S. Meigooni, and D. M. Gearheart, Monte Carlo determination of dose rate constant, Med. Phys. 29, 1637 – 1638 (2002).
- 57 A. S. Meigooni, J. L. Hayes, H. Zhang, and K. Sowards, Experimental and theoretical determination of dosimetric characteristics of IsoAid ADVANTAGE™ 125I brachytherapy source, Med. Phys. 29, 2152 – 2158 (2002).
- 58 Z. Li, Monte Carlo calculations of dosimetry parameters of the Urocor Prostaseed 125I source, Med. Phys. 29, 1029–1034 (2002).
- 59 Karaiskos, P. Papagiannis, L. Sakelliou, G. Anagnostopoulos, and D. Baltas, Monte Carlo dosimetry of the selectSeed 125I interstitial brachytherapy seed, Med. Phys. 28, 1753–1760 (2001).
- 60 F. Mourtada, J. Mikell, and G. Ibbott, Monte Carlo calculations of AAPM Task Group Report No. 43 dosimetry parameters for the 125I I-Seed AgX100 source model, Brachytherapy 11, 237 – 244 (2012).
- 61 T. D. Solberg, J. J. DeMarco, G. Hugo, and R. E. Wallace, Dosimetric parameters of three new solid core I-125 brachytherapy sources, J. Appl. Clin. Med. Phys 3, 119–134 (2002).
- 62 C. C. Popescu, J. Wise, K. Sowards, A. S. Meigooni, and G. S. Ibbott, Dosimetric characteristics of the PharmaSeed model BT-125-1 source, Med. Phys. 27, 2174 – 2181 (2000).
- 63 E. Mainegra, R. Capote, and E. Lopez, Dose rate constants for 103Pd, 125I, 196Yb, 192Ir, brachytherapy sources: an EGS4 Monte Carlo Study, Phys. Med. Biol. 43, 1557 – 1566 (1998).
- 64 A. S. Kirov and J. F. Williamson, Monte Carlo-aided dosimetry of the Source Tech Medical Model STM1251 I-125 interstitial brachytherapy source, Med. Phys. 28, 764 – 772 (2001).
- 65 K. Sowards and A. S. Meigooni, A Monte Carlo evaluation of the dosimetric characteristics of the Best Model 2301 125I brachytherapy source, Appl. Radiat. Isot. 57, 327 – 333 (2002).
- 66 J. F. Williamson, Dosimetric characteristics of the DRAXIMAGE model LS-1 interstitial brachytherapy source design: A Monte Carlo investigation, Med. Phys. 29, 509 – 521 (2002).
- 67 H. Hedtjärn, G. A. Carlsson, and J. F. Williamson, Monte Carlo-aided dosimetry of the symmetra model I25.S06 I125, interstitial brachytherapy seed, Med. Phys. 27, 1076–1085 (2000).
- 68 A. S. Meigooni, M. M. Yoe-Sein, A. Y. Al-Otoom, and K. Sowards, Determination of the dosimetric characteristics of InterSource 125I brachytherapy source, Int’l. J. Applied Radiation and Isotopes 56, 589–599 (2002).
- 69 M. J. Rivard, Monte Carlo calculations of AAPM Task Group Report No. 43 dosimetry parameters for the MED3631-A/M 125I source, Med. Phys. 28, 629–637 (2001).
- 70 L. Beaulieu et al., Report of the Task Group 186 on model-based dose calculation methods in brachytherapy beyond the TG-43 formalism: Current status and recommendations for clinical implementation, Med. Phys. 39, 6208 – 6236 (2012).