[1] \cormark[2] \cortext[cor1]Corresponding author \cortext[cor2]Principal corresponding author
Age and Metallicity of galaxies in different environments of the Coma supercluster
Abstract
We analyse luminosity-weighted ages and metallicity (Z ) of galaxies in a continuous range of environments, i.e. clusters, filaments and voids prevalent in the Coma supercluster ( Mpc). Specifically, we employ two absorption line indices, H and as tracers of age and metallicity of galaxies. We find that the stellar-phase metallicity of galaxies declines with increasing age as a function of stellar mass () as well as environment. On the filaments, metallicity of galaxies varies as a function of their distance from the spine of the filament, such that galaxies closer to the centre of the filaments have lower metallicity relative to their counterparts 1 Mpc away from it. The mean age of intermediate mass galaxies () galaxies is statistically significantly different in different environments such that, the galaxies in clusters are older than the filament galaxies by 1-1.5 Gyr, while their counterparts in the voids are younger than filament galaxies by Gyr. The massive galaxies (), on the other hand show no such difference for the galaxies in clusters and filaments, but their counterparts in voids are found to be younger by Gyr. At fixed age however, Z of galaxies is independent of their in all environments, except the most massive (), oldest galaxies ( Gyr) which show a sharp decline in their Z with . Our results support a scenario where galaxies in the nearby Universe have grown by accreting smaller galaxies or primordial gas from the large-scale cosmic web.
keywords:
galaxies: abundances \sepgalaxies: clusters: general \sepgalaxies: evolution \sepgalaxies: fundamental parameters1 Introduction
Metallicity (Z) is a fundamental attribute which provides clues to the star formation history of a galaxy. Just like other global properties such as colour, Z is also strongly correlated with the stellar mass of galaxy (Lequeux et al., 1979). The observed trend is such that the Z increases linearly with stellar mass (Caldwell et al., 2003; Ogando et al., 2008; Trager et al., 2008) or luminosity (Skillman et al., 1989; Brodie and Huchra, 1991; Bell and de Jong, 2000) at low masses, but saturates for massive galaxies (). Literature (Panter et al., 2008; Leethochawalit et al., 2018) on the evolution history of Z through cosmic time shows that this trend holds well for stellar (e.g. Gallazzi et al., 2005) as well as gas phase metallicity (e.g. Tremonti et al., 2004; Cooper et al., 2008) in galaxies. The observed trend is also well established for galaxies at low (; e.g. Gallazzi et al., 2005) and high redshift (Erb et al., 2006) alike.
The analysis of metallicity in galaxies is, however, complicated by the fact that observables such as broadband colours and spectral line indices which are sensitive to chemical enrichment, also respond in a similar way to changes in luminosity-weighted age. For instance, colours of the dominant stellar population become redder not only with increasing age but also with stellar Z. The variation due to age occurs because more stars move to the giant branch, while an increase in the Z leads to an increase in the stellar opacity. In such a situation the dust in the interstellar medium (ISM) re-emits the blue photons absorbed from stars at longer wavelengths, making a galaxy appear red. Since the optical colours may redden due to age or Z, or both, two galaxies with different age and chemical enrichment may exhibit similar colours and spectral features of comparable strengths. This is famously known as the age-metallicity degeneracy (Worthey, 1994).
There are several ways to break this age-Z degeneracy. While some studies employ pairs of colours in different wavebands (Li et al., 2007; Li, 2013), others use narrowband continuum photometry (Rakos et al., 2007, 2008; Sreedhar et al., 2012) or strength of different age-sensitive and Z-sensitive absorption line indices (Jørgensen, 1997, 1999; Poggianti et al., 2001). One such set of absorption line indices was defined on the Lick/IDS system (named after the Lick Image Dissector Scanner, Faber et al., 1985).
The H index is a widely adopted age-sensitive spectral index (Kuntschner and Davies, 1998; Kuntschner, 2000; Poggianti et al., 2001; Caldwell et al., 2003), while Iron (111Throughout this paper we use to represent the average of the and Å lines.) and Magnesium (Mg2222The Mg2 index is measured in the wavelength band 5154.125-5196.625 Å.) line indices are commonly used as a proxy for stellar Z (Jørgensen, 1997, 1999; Poggianti et al., 2001; Proctor et al., 2004; Sánchez-Blázquez et al., 2006b). A popular method to estimate stellar age and Z involves plotting an age-sensitive index versus a Z-sensitive index together with a Single Stellar Population (SSP) model grid which translates the observed line strengths into mean age and Z of the galaxy, respectively. Several such SSP models are available in the literature (Bruzual A. and Charlot, 1993; Buzzoni, 1995; Weiss et al., 1995; Bressan et al., 1996; Vazdekis et al., 1996; Bruzual and Charlot, 2003; Maraston, 2005; Vazdekis et al., 2010), and have been used to study the correlation of age and metallicity with other galaxy properties, such as stellar mass.
The mass-metallicity relation extends across at least three orders of magnitude in stellar mass and a factor of 10 in gas-phase metallicity, though with a significant scatter (Tremonti et al., 2004). Various studies have explored the physical causes of the scatter in the mass-Z relation, and the obvious culprit is found to be the observational uncertainty in estimating these quantities. Nevertheless, Cooper et al. (2008) used a sample of more than 57,000 star-forming galaxies from the Sloan Digital Sky Survey (SDSS), data release 4 to show that environment of galaxies can contribute of the observed scatter to the mass-Z relation (also see Mouhcine et al., 2007). The local density of galaxies dubbed “environment" is known to have a strong impact on the evolution of galaxies, such that the optically-red, passively-evolving galaxies are found to preferentially reside in dense environments. Their disky, blue, star-forming counterparts on the other hand prefer intermediate or low density environments. This dichotomy is manifested in the well known morphology-density (Dressler, 1980), colour-density (e.g. Blanton et al., 2005) or star formation-density (e.g. Balogh et al., 2004) relations.
Galaxies in cluster cores are found to be more enriched relative to their counterparts in less dense environments (Skillman et al., 1996; Carter et al., 2002; Ellison et al., 2009; Peng and Maiolino, 2014; Wu et al., 2017). Using data from the SDSS it has been shown that at a given stellar mass the gas-phase metallicity of star-forming satellite galaxies is higher than star-forming central galaxies (Pasquali et al., 2012; Peng and Maiolino, 2014). Strangulation of low-mass galaxies, stripping of gas from the outer parts of the disk and external pressure of the intra-cluster medium (ICM) are the likely causes for these observations (Pasquali et al., 2012).
Peng and Maiolino (2014), however find that while the high-Z satellites are found in denser environments relative to their low-Z counterparts, no such trends are evident for star-forming central galaxies. Based on their findings, Peng and Maiolino (2014) suggest that the observed trends are a consequence of enriched gas inflowing into satellite galaxies in dense environments. Analogous conclusions were drawn by Darvish et al. (2015) who studied a filamentary structure () in the COSMOS field. Darvish et al. (2015) find that galaxies in the filament are more metal-enriched ( 0.1-0.15 dex) than a control sample of galaxies in voids.
Enhanced rate of star formation in dense environments can also augment chemical enrichment in cluster galaxies at high redshift (), but little correlation is observed between stellar Z and environment at (Sheth et al., 2006; Panter et al., 2008). On the contrary, using a sample of galaxies from the SDSS data release 7, Wu et al. (2017) showed that the gas-phase Z is weakly dependent on environment below the turnover stellar mass () upto which the metallicity is linearly correlated with the environment. Beyond the turnover mass, the metallicity saturates, therefore becoming independent of environment. In light of the existence of mass-Z relation, this observation of Wu et al. (2017) agrees well with the results of Peng and Maiolino (2014).
For galaxies in the Coma cluster (), Carter et al. (2002) find a gradient in the Mg2 and indices, which they attribute to pressure confinement of the supernova ejecta by the ICM (also Pasquali et al., 2012). Their suggestion is loosely supported by the ram-pressure stripping (RPS) model of Gupta et al. (2017), who show that gas removal by RPS will primarily remove low-mass cluster galaxies from the star-forming population, leading to a cluster-scale metallicity gradient of -0.03 dex Mpc-1 at . Gupta et al. (2017), therefore hypothesize that RPS is insufficient in explaining the observed Z gradient in cluster, which would require “self-enrichment due to gas strangulation”. In a study of galaxies in the nearby universe, Hughes et al. (2013) came to similar conclusions by studying the oxygen abundances and HI gas mass and gas fraction in 260 star-forming galaxies. Based on their analysis, Hughes et al. (2013) conclude that the mass-Z relation is invariant to environment and originate only due to the internal evolutionary processes in galaxies.
Just like metallicity, the luminosity-weighted age of galaxies is also found to correlate with their environment. While older galaxies preferentially inhabit dense regions of space such as cluster cores, younger galaxies are abundantly found in the low-density environment of voids (Sánchez-Blázquez et al., 2006a; Annibali et al., 2007; Collobert et al., 2006; Trager et al., 2008; Pasquali et al., 2010). Several studies of clusters of galaxies have observed a trend of younger mean ages with increasing cluster-centric radius in the Coma (; Poggianti et al., 2001; Smith et al., 2008, 2009) and Virgo (; Michielsen et al., 2008; Toloba et al., 2009) clusters.
Despite progress being made in understanding the impact of environment on the mass-Z as well as age-Z relations in the last few decades, a gap remains in the literature because of the availability of limited suitable samples. Most of the literature cited above either analyses the trends in over-dense cluster cores or in the almost empty void regions (e.g. Jørgensen, 1999; Kuntschner, 2000; Moore et al., 2001; Poggianti et al., 2001; Caldwell et al., 2003). While the studies sampling the cluster core are biased towards passively-evolving galaxies populating dense environments, the ones using gas-phase metallicities often sample the star-forming galaxies only. But with the availability of wide-angle spectroscopic dataset from the SDSS it is now possible to cover these gaps and explore properties of galaxies covering a large range in stellar mass in a continuous range of environments.
In this work we employ data for the Coma supercluster spanning 480 square degrees (Mahajan et al., 2010, 2018) on the sky to explore trends in luminosity-weighted age and stellar metallicity of galaxies with stellar mass and environment. The Coma supercluster is one of the largest structures in the nearby Universe comprising two rich galaxy clusters: Coma (Abell 1656) and Abell 1367, connected by a network of large-scale filaments (Fontanelli, 1984) and several small galaxy groups, making it an excellent site to investigate the age and Z of its constituent galaxies.
This paper is organised as follows. The observational data and procedure for selection of sample are described in the following section. In Sec. 3 we describe the methodology to estimate the luminosity-weighted age and stellar Z of galaxies. In Sec. 4, we explore the various factors affecting the age and metallicity of galaxies, discussing our observations in the context of existing literature in Sec. 5, and finally concluding in Sec. 6. Throughout this paper we use cold dark matter concordance cosmology parameterised by m=0.3, Λ=0.7 and H0=70 km s-1 Mpc-1 for determining distances and magnitudes.
2 Data
The data used in this paper are drawn from the data release 8 of the Sloan Digital Sky Survey Data (York et al., 2000; Aihara et al., 2011). The spectroscopic catalogue of the SDSS galaxies is complete to mag. We therefore implement this criteria together with the following to select galaxies for our sample:
-
•
170∘ RA 200∘,
-
•
17∘ Dec 33∘, and
-
•
radial velocity, such that km s-1 ().
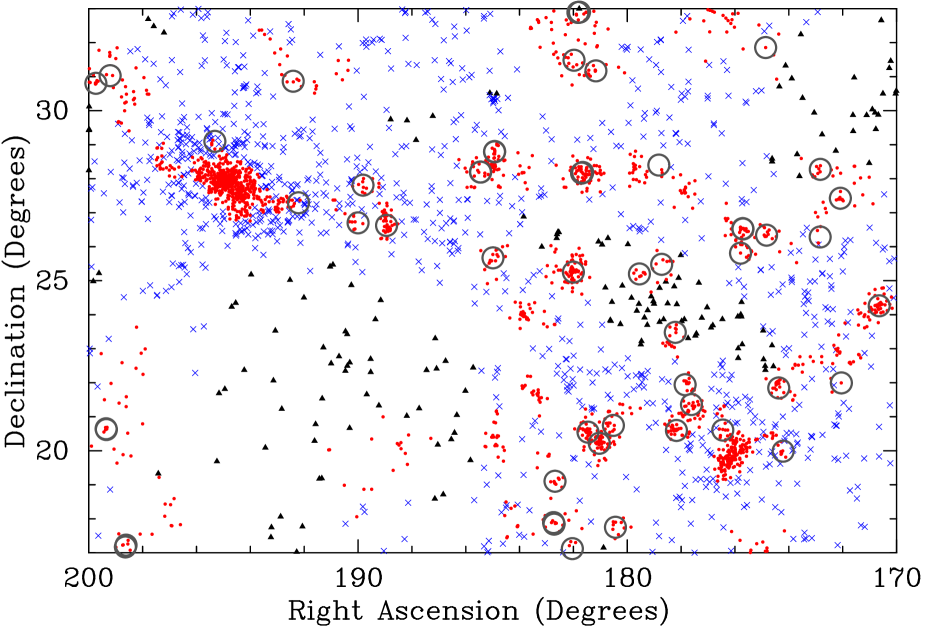
The latter is chosen so as to include all galaxies within of the mean redshift of the Coma and the Abell 1367 clusters (6973 and 6495 km s-1, respectively; Rines et al., 2003). These data, covering square degrees on the sky are shown in Figure 1. For this sample, we adopt the stellar mass completeness limit of log (following fig. 8 of Weigel et al., 2016).
| Environment | Red sample | Complete sample |
| Cluster/group | 837 | 1810 |
| Filament | 364 | 963 |
| Voids | 57 | 161 |
2.1 Properties of galaxies
The physical properties of galaxies as well as their metallicity (Z) and age in this work are drawn from the catalogues provided by the Max Planck Institute for Astrophysics (MPA) and Johns Hopkins University (JHU) group. The MPA-JHU catalogues make use of the spectra obtained using the diameter fibre. Model spectra are fitted to the emission-line free regions of the observed spectrum. The residuals obtained after subtracting the fitted spectrum from the observed spectrum are then modelled as gaussians giving emission line measurements (Tremonti et al., 2004). In order to produce an absorption-line only spectrum, the fitted emission lines are subtracted from the observed spectrum. This work makes use of absorption line data only. The stellar masses in the MPA-JHU catalogue are calculated based on the methodology described in Kauffmann et al. (2003), with the difference that the MPA-JHU pipeline makes use of the ugriz galaxy photometry instead of spectral indices. The within the SDSS spectroscopic fibre aperture is estimated using fibre magnitudes whereas the total stellar mass uses model magnitudes. A Kroupa IMF is assumed. The output is provided as 2.5, 16, 50, 84 and 97.5 percentiles of the probability distribution function (PDF) of the logarithm of the stellar mass. In this work we make use of the median value of the stellar mass PDF. SDSS photometry catalogues list several different measures of magnitudes. Of these, model magnitudes, which are estimated by fitting a surface brightness profile to the two-dimensional image of a galaxy, usually provide the best available colour for extended objects. In this work we use the extinction corrected and band model magnitudes.
2.2 Environment
Environment of galaxies can be broadly classified into two regimes: ‘local environment’ ( Mpc), which is often well quantified by measuring the local projected density using nearest neighbours, and the ‘large-scale’ environment which quantifies the Mpc density field around galaxies. Using a large sample of clusters, Rines et al. (2005) showed that beyond the virial radius, the local density at a given projected distance from the centre of the cluster can vary by as much as two orders of magnitude (their fig. 12). Muldrew et al. (2012) showed that environment metrics based on nearest neighbour density are well suited to measure the local environment in large halos, where as aperture-based methods are better representations of the large-scale environment of galaxies. Since we are interested in exploring the relation between galaxy properties and their large-scale environment in this paper, we adopt a method based on the latter methodology to quantify environment.
In a recent paper, Mahajan et al. (2018) classified galaxies in the Coma supercluster into different environments. Here we use the same scheme to classify our galaxies into three distinct environments: clusters/group, filament or voids333Since our data is sampled from DR8 unlike Mahajan et al. (2018), environment information is missing for 19 galaxies of which 5 belong to the red sample.. The number of galaxies inhabiting different environments for the giant and dwarf galaxies are presented in Table 1. For completeness, we summarise the definition of different environments below:
-
•
Cluster/group galaxies: all galaxies identified to lie in groups or clusters.
-
•
Filament galaxies: all galaxies that are within a radius of 1 Mpc of the filamentary spine.
-
•
Void galaxies: all other galaxies in our sample which are not selected in either of the above two categories.
The distribution of galaxies in different environments in the Coma Supercluster is shown in Fig. 1.
2.3 Age and Z of galaxies
The Lick system (Worthey, 1994) is a set of twenty-one atomic and molecular absorption features which were initially measured in a sample of 460 nearby galactic stars in the 4000-6000 Å waveband, and later updated with further observations by Worthey and Ottaviani (1997). All the stars were observed at Lick Observatory between 1972 and 1984 using the 3m Shane telescope and spectra obtained with the Cassegrain spectrograph and image dissector scanner (IDS) at moderate-resolution ( FWHM Å). The first eleven Lick indices were defined using a sample of stars which were primarily K giants and subgiants in the solar-neighborhood (Faber et al., 1985). Gorgas et al. (1993) extended that sample to include dwarf stars (F and G type) in the field and clusters to measure the eleven indices. Worthey (1994, W94 henceforth) further extended the stellar sample to include M type dwarfs and giants, and several hot stars to span the old, metal-rich populations along with the young stars 0.5-2 Gyr old. W94 also supplemented the original list of eleven absorption line indices with ten new features, thus constituting the whole Lick/IDS system.
In this work we adopt three line indices, H (4847.875 Å- 4876.625 Å) as an indicator of age, and mean of Fe5270 (5245.650 Å- 5285.650 Å) and Fe5335 (5312.125 Å- 5352.125 Å) indices, as an indicator for Z of galaxies in our sample. We note that all absorption line indices are measured from galaxy spectra after subtracting all emission-lines with signal-to-noise ratio (SNR) . The reader is directed to Brinchmann et al. (2004) and Tremonti et al. (2004) for a detailed description of the methodology adopted for the measurement of spectral indices from the SDSS spectra.
Although these indices have been used in the literature to analyse populations of galaxies, especially in the passively-evolving galaxies in galaxy clusters, our work is distinguishable because we have analysed ‘all’ types of galaxies i.e. emission-line and absorption-line systems, spanning a wide range in stellar mass and environmental density homogeneously. This uniform treatment of data allows us to get an insight into the evolution of galaxies not just in dense clusters, but in the much larger supercluster. In order to meet our science goals it is therefore essential to include all types of galaxies even if some of them may have high uncertainties. However, in order to test for biases in our results arising due to high observational uncertainties, we perform the analysis by segregating our data into two sub-samples:
-
•
Complete sample of 2,953 galaxies, and
-
•
Red sample: A reduced subset of the complete sample comprising 1,263 galaxies with per cent uncertainty in all the three absorption line indices used in this work.
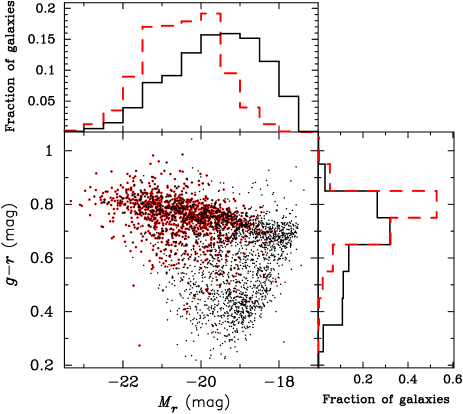
The distribution of all the galaxies used for analysis in this paper in the colour-magnitude plane is shown in Fig. 2. As expected, most of the galaxies on the red sequence are strong absorption line systems, and therefore belong to the lower-uncertainty red sub-sample.
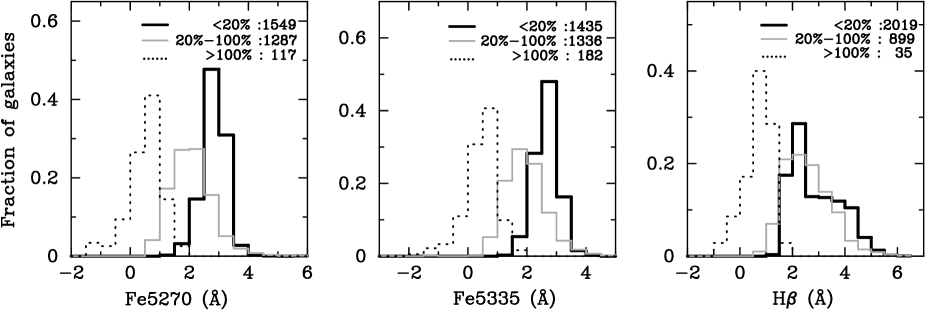
In Fig. 3 we show that the smaller ‘red’ sub-sample is dominated by massive red galaxies, which are passively-evolving systems with low uncertainty in absorption line measurements. A corollary of this observation is that the star-forming galaxies with spectra dominated by emission lines are found to have the highest uncertainty in the absorption line indices required to estimate their age and metallicity. Specifically, the typical uncertainty in the H and indices are 0.4 Å (0.25 Å) and 0.3 Å (0.2 Å) in the complete (red) sub-samples, respectively. Furthermore, per cent of the galaxies in the complete (red) sub-sample have per cent ( per cent) and per cent ( per cent) uncertainty in the H and indices, respectively.
3 Estimation of age and metallicity
In this work we use Single Stellar Population (SSP) models, which transform the observed line indices into luminosity-weighted mean age and mean metal content of galaxies. In particular, we use the SSP models described in Vazdekis et al. (2010, hereafter V10). V10 make use of the solar-scaled theoretical isochrones of Girardi et al. (2000, hereafter Padova isochrones) and cover a wide range of parameters and initial mass functions (IMFs). The Padova isochrones are based on theoretical stellar evolutionary tracks for many low and intermediate mass stars () covering a wide range in metallicity (). The stellar tracks are presented at very small mass intervals which allows for a detailed mapping of the Hertzsprung-Russell Diagram, which results in a detailed derivation of isochrones (Girardi et al., 2000).
V10 compute the SSP spectral energy distributions (SED) by integrating the spectra of stars along the isochrone taking into account their number per mass bin in accordance with the adopted IMF. They make use of stars in the Medium-resolution Isaac Newton Telescope Library of Empirical Spectra (MILES)
database, which have a good stellar atmospheric parameter coverage, and compute their predictions for different IMFs.
Here we use the predicted line strengths based on the work of V10 from the MILES database. We have employed fourteen constant age (0.79, 0.89, 1.00, 1.12, 1.78, 2.82, 3.16, 4.47, 5.01, 5.62, 6.31, 7.08, 7.94 and 14.12 Gyr) and six constant metallicity isochrones (-1.71, -1.31, -0.71, -0.4, 0.0, 0.22 [M/H]). The bimodal IMF (slope ) closely resembles the Kroupa IMF (Kroupa, 2001), and the SSP SEDs obtained for these IMFs do not show significant differences (V10). Furthermore, the effects of varying the slope of the IMF on the SSP SEDs are far less significant for the bimodal IMF relative to those arising from varying the slope of the unimodal IMF (V10). We therefore adopt the bimodal IMF (Vazdekis et al., 1996) in this work.
The age and Z of galaxies are estimated by interpolating from the nearest model points. However, for 98 (503) galaxies in the red (complete) sub-sample which lie outside the model grid, the age and metallicity of galaxies are estimated by extrapolating the constant age and Z isochrones. In regions where the isochrones cannot be extended, i.e. Gyr and Gyr in age, and and for metallicity, galaxies are assigned an age of 0.05 Gyr and 20 Gyr, and a metallicity value of 4, respectively. In order to draw statistically valid results, these galaxies are excluded from further analysis.
In order to compute the uncertainty in the age and Z due to the measurement error in the H and indices, the index values are perturbed with their uncertainties and age and Z are recomputed. This gives us the upper and lower bounds in both the quantities for each galaxy. We note that several perturbed index values fall outside the model grid, either due to the measured value being very close to the grid boundary or having large uncertainty associated with it. In such cases, age and Z bounds are estimated via extrapolation by extending the model isochrones where possible. The galaxies for which the isochrones can not be extended, are excluded from further error analysis.
Following Jørgensen (1999) and Poggianti et al. (2001), the uncertainties in age and Z are then calculated by taking half of the difference between the upper and lower limits for each galaxy. In the complete (red) sub-sample, age and Z bounds are well estimated for per cent ( per cent) and per cent ( per cent) of the galaxies, respectively. The fractions are naturally higher for the red sub-sample, owing to smaller uncertainty in the indices and the sub-sample consisting mainly of those galaxies which lie well within the model grid. Based on these galaxy fractions, the median absolute uncertainty in age is found to be 1.7 Gyr (2.4 Gyr), and in Z is 0.26 dex (0.2 dex) for the complete (red) sub-sample, respectively. These uncertainties are comparable to those found by Poggianti et al. (2001) for the central region of the Coma cluster using data from the William Herschel Telescope. We present the age and Z , and the respective uncertainties obtained for them for all the galaxies in our sample in Table 2, which is available online in its entirety. The columns are: (i) Right Ascension (J2000), (ii) Declination (J2000), (iii) redshift, (iv) age (Gyr), (v) and (vi) upper and lower limits of age (Gyr), (vii) Z (dex), (viii) and (ix) upper and lower limits of Z (dex), respectively.
We note however, that the uncertainty in age varies with the age of the population, due to the logarithmic nature of the grid used to compute the ages and Z (Fig. 4; also see fig. 8 of Poggianti et al., 2001). The typical uncertainty in age is found to be 1 Gyr (0.7 Gyr) for galaxies Gyr old for the complete (red) sub-sample. For older populations, the uncertainty is Gyr for both the sub-samples. The red sub-sample, chosen to have lesser uncertainty in the indices, is largely dominated by older systems with age Gyr (Fig. 4). On the other hand, per cent of the galaxies in the complete sub-sample are Gyr old, consequently giving slightly higher age uncertainty of 2.4 Gyr for the red sub-sample when all galaxy populations are taken into account.
| Right Ascension | Declination | Redshift | Age | Age Upper limit | Age lower limit | Z | Z upper limit | Z lower limit |
| (J2000) | (J2000) | (Gyr) | (Gyr) | (Gyr) | (dex) | (dex) | (dex) | |
| 178.312 | 20.736 | 0.0252 | 2.2 | 3.1 | 1.4 | -0.12 | - | -0.39 |
| 191.190 | 27.500 | 0.0314 | 1.8 | 2.6 | 1.2 | -0.25 | - | -0.55 |
| 197.003 | 28.081 | 0.0192 | 2.7 | 5.1 | 1.9 | -0.36 | -0.07 | -0.64 |
| 189.744 | 27.564 | 0.0224 | 2.1 | 2.9 | 1.4 | -0.16 | - | -0.45 |
| 179.050 | 21.394 | 0.0255 | 2.1 | 2.9 | 1.5 | -0.34 | 0.04 | -0.61 |
| 180.642 | 20.815 | 0.0223 | 1.7 | 2.7 | 1.1 | -0.07 | - | -0.44 |
| 195.960 | 28.054 | 0.0210 | 2.4 | 4.1 | 1.5 | -0.12 | - | -0.42 |
| 181.856 | 28.530 | 0.0303 | 1.9 | 2.9 | 1.2 | 0.04 | - | -0.31 |
| 181.500 | 27.639 | 0.0285 | 2.4 | 4.1 | 1.6 | -0.31 | 0.08 | -0.61 |
| 177.888 | 27.669 | 0.0290 | 1.8 | 3.1 | 1.1 | 0.20 | - | -0.23 |
| 182.909 | 19.845 | 0.0223 | 2.5 | 4.0 | 1.8 | -1.12 | -0.85 | -1.34 |
4 Analysis and results
It is well known that massive, passively-evolving galaxies reside in dense environments. Therefore, in order to analyse the trends in age and metallicity with environment and stellar mass, it is essential to decouple the latter two properties of galaxies. In this work we accomplish this by splitting each sub-sample into bins of and environment, assuming insignificant evolution of galaxies within each sub-sample.
We split our data into two bins of , viz. ‘dwarfs’ are defined as galaxies having and for the ‘giant’ galaxies, respectively. While 24 per cent of galaxies in the red sample are classified as dwarfs, almost 62 per cent of galaxies in the complete sample appear in this class. Fig. 2 shows the distributions of the colour for the complete and the red sub-sample, respectively. As expected, galaxies in both the sub-samples become redder with increasing -band luminosity, which is a good proxy for . In particular, the lack of low-mass, blue galaxies, especially in the red sub-sample is evident, once again justifying the need to analyse the complete sample including galaxies with higher measurement uncertainties in the spectral indices.
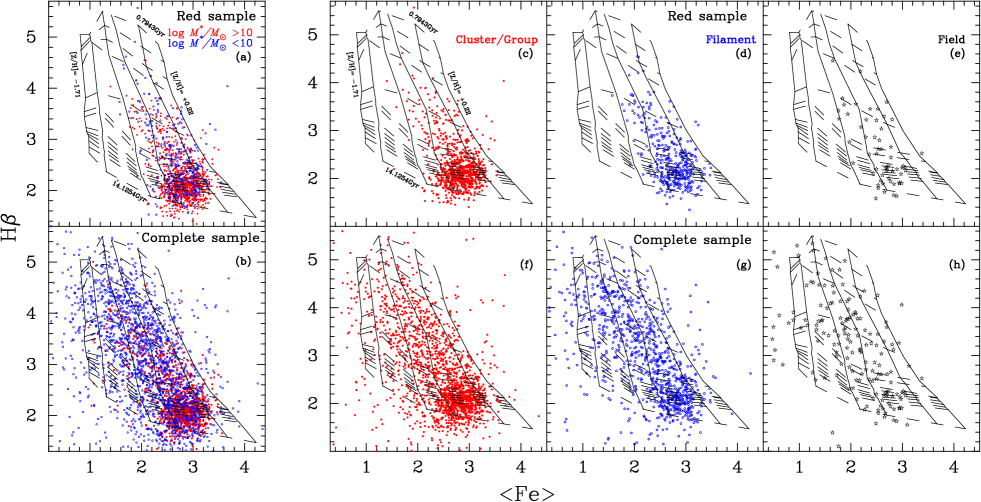
In Fig. 4 we show the distribution of galaxies for the red and complete sub-samples in the H- plane, along with the constant age and Z isochrones mentioned in Sec. 3. Most of the passively-evolving giant systems have large absorption in and lower absorption in H, indicating high metallicity and lower star formation in the recent past, respectively. The dwarfs in the red sample follow the giants. However, the dwarfs in the complete sample span the entire H- plane, suggesting a wide range of star formation histories.
Segregation with environment (panels (c)-(h) in Fig. 4) shows that most of the cluster galaxies are concentrated in the bottom-right quadrant dominated by massive, passively-evolving systems with a small but non-negligible fraction of the remaining galaxies spanning the rest of the H- plane. In filaments and voids however, galaxies span the entire H- plane with some traces of an excess in the bottom-right quadrant in the filaments. The consequence of such a distribution in the context of the distribution and environment of galaxies is discussed in the following sections.
4.1 Disentangling the effects of age and on Z
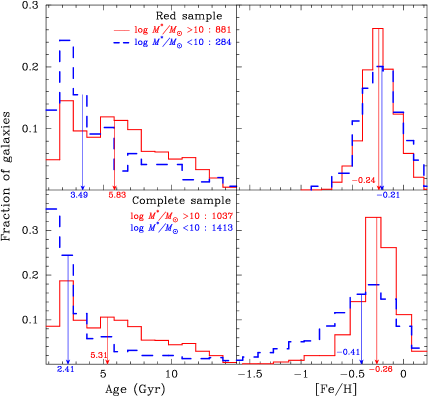
In this section we study the metallicity of galaxies as a function of their stellar mass and luminosity-weighted age. In Fig. 5 we show the distributions of age and Z for the dwarf and giant galaxies along with the median for each distribution. Both samples show statistically significant differences in the distribution of the age of the dwarf and giant galaxies, but negligible differences in the distribution of their Z. These inferences are drawn on the basis of the outcome of the Kolmogorov-Smirnov (KS) statistical test, which tests for the likelihood that the two samples being compared originate from the same parent distribution. The KS test probabilities in favour of the hypothesis for the red and the complete samples for age and Z of galaxies in different mass bins and environments are shown in Tables 3 and 4, respectively.
| Age | [Fe/H] | |
| Dwarfs & Giants | 2.3E-12 | 8.0E-02 |
| Environment | ||
| Cluster/Group | ||
| & Filament | 5.9E-05 | 8.8E-01 |
| Cluster/Group | ||
| & voids | 3.0E-03 | 8.0E-02 |
| Filaments & voids | 2.5E-01 | 1.9E-01 |
| Age | [Fe/H] | |
| Dwarfs Giants | 4.8E-62 | 5.8E-47 |
| Environment | ||
| Cluster/Group | ||
| Filament | 3.2E-14 | 7.7E-05 |
| Cluster/Group | ||
| voids | 6.3E-07 | 1.3E-05 |
| Filaments voids | 3.0E-01 | 2.0E-02 |
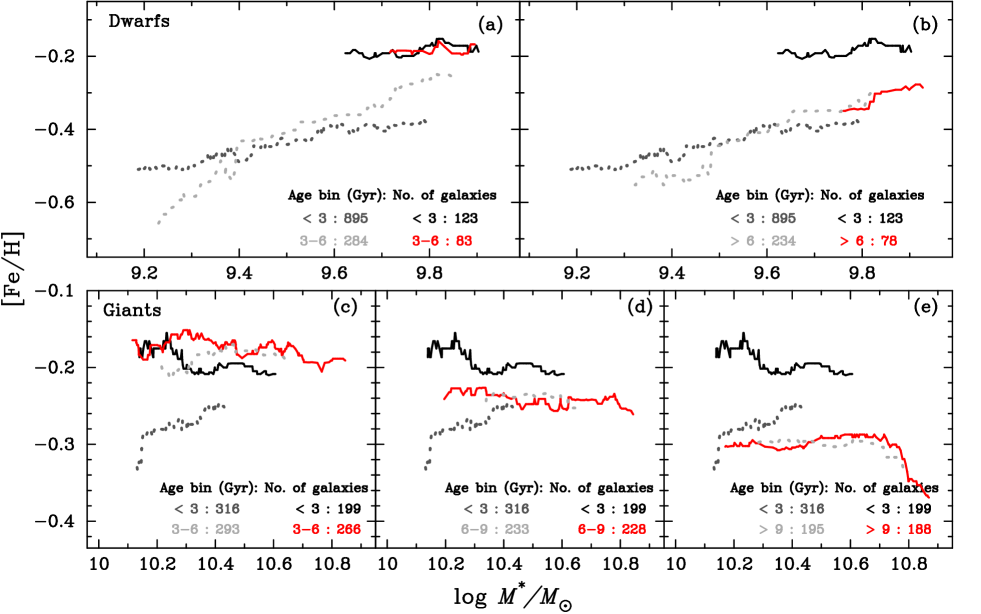
Taking inspiration from Poggianti et al. (2001), we split our sample into four bins in age: < 3 Gyr (very young galaxies), 3-6 Gyr (intermediate), 6-9 Gyr (intermediate old) and >9 Gyr (very old). In Fig. 6 we show the median trend in metallicity as a function of stellar mass for the dwarf and giant galaxies in each bin of age for the red and the complete sub-samples, respectively. For the dwarf galaxies we have combined the intermediate-old and very old galaxy populations due to low number statistics. Both the dwarf and giant galaxies show a continuous decline in metallicity with increasing age. Although counter-intuitive, this result is explainable in a scenario where galaxies grow by accreting smaller satellites and cold gas from the large-scale structure in which they are embedded. Such cold-mode accretion will feed low metallicity gas, thereby reducing the mean metallicity of the progenitor galaxy (e.g. D’Souza and Bell, 2018).
Galaxies can lose enriched inter-stellar medium (ISM) via galactic outflows, for instance, in supernovae explosion, resulting in a decline of the mean metallicity of galaxies (Chisholm et al., 2018). This hypothesis is clearly observed for the red sub-sample, where the Z of galaxies is found to decline with increasing age, irrespective of their . This trend is duplicated for the complete sample of giant galaxies, and albeit with some scatter, also for the complete sample of dwarf galaxies. At fixed age however, Z is mostly independent of for the dwarf and giant galaxies alike, except for the most-massive, oldest galaxies which show a sharp decline in their Z, likely caused by excessive cold-mode accretion in the central dominant galaxies in clusters and groups.
4.2 Age and Z of dwarfs and giants in different environment
| Red sub-sample | ||
| Old | Metal rich | |
| (>5Gyr) | ([Fe/H]>-0.3) | |
| Dwarfs | 36.3 | 65.8 |
| Giants | 59.8 | 66.6 |
| Galaxy Cluster/Group | 58.3 | 67.6 |
| Filament | 47.1 | 65.2 |
| Field | 40.4 | 55.8 |
| Complete sample | ||
| Old | Metal rich | |
| (>5Gyr) | ([Fe/H]>-0.3) | |
| Dwarfs | 22.6 | 36.4 |
| Giants | 52.6 | 59.8 |
| Galaxy Cluster/Group | 40.7 | 49.5 |
| Filament | 27.5 | 42.7 |
| Field | 23.9 | 32.8 |
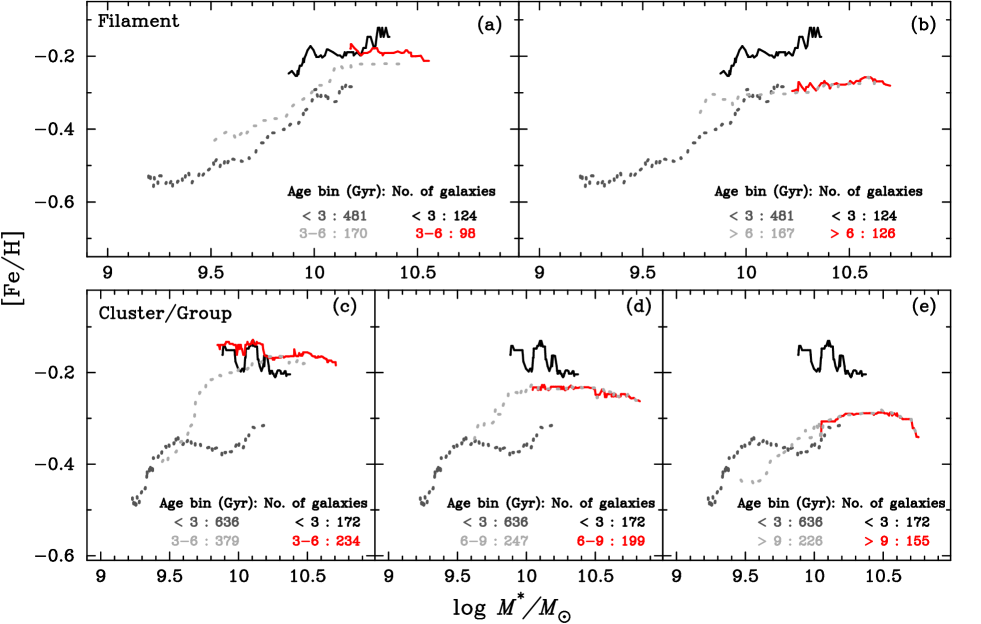
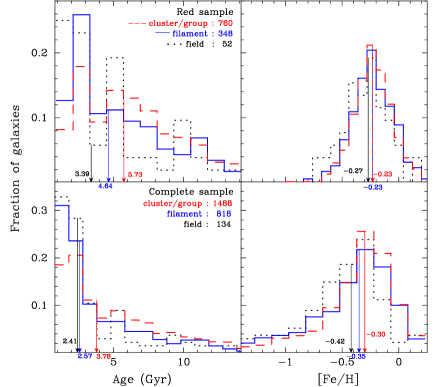
In Fig. 7 we show the median trend in metallicity as a function of stellar mass for galaxies in clusters and filaments in each bin of age for the red and the complete sub-samples, respectively. The void galaxies could not be shown here due to low number statistics. Just like Fig. 6, the intermediate-old and very old populations are combined together for the filament galaxies due to low number of galaxies in these bins. Fig. 8 shows the distribution of age and Z of galaxies in different environments for the two sub-samples. The previously observed trend of decreasing Z with increasing age is seen in all sub-samples, except the complete sub-sample of filament galaxies. Specifically, while 56 per cent of galaxies in voids are metal-rich ([Fe/H]), the fraction increases to 65 per cent for filaments, and further to 68 per cent for the cluster galaxies in the red sub-sample, suggesting that dense environments rich in passively-evolving galaxies also have more metal-rich galaxies. However, we must also consider the fact that dense environments comprise of more massive galaxies. In order to test the effect of environment on Z of galaxies independent of stellar mass, we create sub-samples of galaxies in two stellar mass ranges for different environments. For massive galaxies () the median Z is found to be -0.26 (-0.26), -0.25 (-0.24) and -0.28 (-0.28) in clusters, filaments and field for the complete (red) sub-samples, respectively. Similarly, for the intermediate mass galaxies () the same is -0.24 (-0.22), -0.26 (-0.22) and -0.36 (-0.27), respectively. This analysis implies that the Z of void galaxies is statistically different from the Z of galaxies in clusters or filaments.
We also performed a similar analysis for the age of galaxies in different environments in the two mass-matched sub-samples. The median age for galaxies in clusters, filaments and voids is found to be 6.79 (6.91), 6.01 (6.17) and 5.58 (5.28) Gyr for the massive galaxies, and 4.74 (5.45), 3.31 (4.55) and 2.76 (2.55) Gyr for the intermediate mass galaxies in the complete (red) sub-samples, respectively. Based on these data, statistically there is no age difference in the massive galaxies in clusters or filaments, but the void galaxies are younger by Gyr. The less massive galaxies on the other hand are clearly different in their age, such that the cluster galaxies are older than the filament galaxies by 1-1.5 Gyr, which in turn are older than their counterparts in the voids by Gyr. In general, we find that about two-thirds of all giant and dwarf galaxies have [Fe/H], but even though 64 per cent of the dwarfs are younger than 5 Gyr, the same applies to 40 per cent of the giant galaxies only (Table 5).
Together with these analyses and Figs. 6 and 7, we conclude that the Z of galaxies in the Coma supercluster is primarily dictated by their age. and environment have a second order effect on the Z such that younger, lower mass galaxies also have lower Z as found by other studies as well (e.g. Poggianti et al., 2001).
5 Discussion
We use the Lick indices’ measurements for galaxies to study the correlation between age, stellar Z, stellar mass and environment of galaxies in the Coma supercluster. While the giant galaxies are mostly old and metal-rich, their dwarf counterparts are relatively younger and metal-poor (Table 5, Fig. 5 and 9). These observations are a manifestation of the downsizing scenario observed elsewhere (Heavens et al., 2004; Gallazzi et al., 2005; Jimenez et al., 2005; Thomas et al., 2005; Neistein et al., 2006; Cid Fernandes et al., 2007; Panter et al., 2007; Fontanot et al., 2009; Thomas et al., 2010), viz. galaxies at fixed are found to be forming fewer stars with decreasing redshift. In the following we analyse our results in the light of information from the existing literature, also describing the shortcomings of the analyses presented in this paper.
5.1 Age-Z anticorrelation
In agreement with the literature (e.g. Jørgensen, 1999; Poggianti et al., 2001; Kuntschner, 2000; Price et al., 2011), we find that the (luminosity-weighted) age and stellar Z of galaxies are anti-correlated, such that the younger galaxies tend to be more metal-rich than their older counterparts. These trends are observed in all environments (Fig. 7), and for the dwarf () and giant galaxies (; Fig. 5) alike. This trend was previously observed for the passively-evolving elliptical and S0s in clusters. In our work presented here, we observe the same even after incorporating the late-type galaxies and sampling a continuous range of environments present in the Coma supercluster.
Such an anticorrelation where errors in both age and Z are correlated (Kuntschner et al., 2001), is difficult to assess because an underestimation in one leads to an overestimation of the other (Trager et al., 2000). Hence this trend may conspire to give a tight correlation between age or Z sensitive indices and other global properties such as the stellar mass (Fig. 5; Tremonti et al., 2004; Gallazzi et al., 2005) or luminosity of galaxies (Bell and de Jong, 2000; Poggianti et al., 2001). Although it is worth noting that if correlated errors were the only cause, such a relation would have been more apparent in low S/N galaxies, i.e. the ones with the highest errors. But the fact that the anticorrelation is unambiguously observed for the red sub-sample (i.e. high S/N galaxies), at all masses and environments implies that for our sample the age-Z anticorrelation is not an artefact, in agreement with Poggianti et al. (2001) who employed data for two physically separated regions in the Coma cluster.
5.2 The mass-Z relation
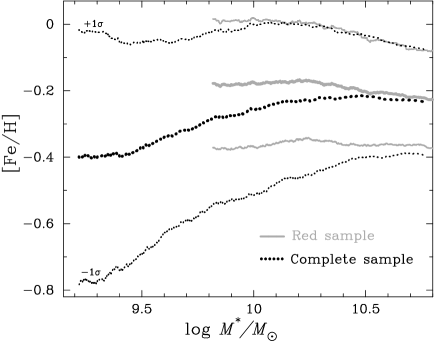
In Fig. 9 we show the Z of galaxies as a function of their for the complete and red sub-samples, along with 1- deviations in the relation of running median. The observed trend is similar to that observed elsewhere (e.g. Bell and de Jong, 2000; Tremonti et al., 2004; Gallazzi et al., 2005), i.e. the metallicity increases with stellar mass or luminosity, and then saturates for the massive galaxies (). This relation reflects the importance of stellar mass in determining the composition of galaxies. Also, the scatter in the -Z relation decreases with increasing mass. The large scatter in the lower mass galaxies is partly due to the larger uncertainties in the age and Z of low-mass galaxies. However, even at fixed stellar mass the scatter is larger than the uncertainties in Z (Gallazzi et al., 2005).
In a sample which spans a range of environments, such scatter is expected due to the variety of galaxies contributing to the relation (Cooper et al., 2008). For instance, despite having very different metallicities, dwarf elliptical galaxies and irregulars will both contribute to the -Z relation at log , thereby adding to the scatter caused by the variations in the intrinsic properties of galaxies (at fixed mass).
The mass-Z relation also has a strong dependence on the star formation rate (SFR) of galaxies. These quantities form the “fundamental metallicity relation (FMR)" (Lara-López et al., 2010; Mannucci et al., 2010). Furthermore, using data from the ALFALFA atomic gas survey, Bothwell et al. (2013) showed that galaxies in the nearby Universe obey an HI FMR, between stellar mass, gas-phase metallicity and the HI mass. Bothwell et al. (2013) hypothesize that the HI FMR relation is more fundamental and drives the relation between SFR, and metallicity because the dependence of Z on HI mass does not saturate like it does for the SFR. Bothwell et al. (2013) also find that at fixed stellar mass, galaxies with higher atomic gas mass have relatively lower gas-phase Z.
5.3 Metallicity of galaxies in different environments
In Sec. 4.2 we observed that environment and stellar mass play a secondary role in determining the Z of galaxies. The Z of galaxies is primarily determined by their age, such that the older galaxies have lower Z than their younger counterparts. We now explore the impact of environment on the metallicity of galaxies.
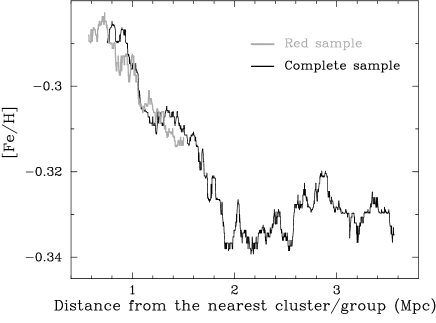
In Fig. 10 we show the variation in the [Fe/H] ratio as a function of distance from the centre of the nearest cluster for the red and complete sub-samples. The median [Fe/H]ratio of galaxies decreases dex between the centre and the virial radius (1-2 Mpc) of a typical galaxy cluster at . Thereafter, the [Fe/H] assumes a constant value of to upto twice that radius.
With the general knowledge that galaxies in dense environments are more evolved (Blanton et al., 2005), it is not surprising to see that on an average the [Fe/H] ratio declines moving away from the cluster centre. Analogous results have previously been obtained for general samples of star-forming galaxies from the SDSS. For instance, Cooper et al. (2008) not only observed the metallicity-density relation, but showed that it was as strong as the colour-density and luminosity-density relation observed for galaxies in the nearby Universe. These authors also suggest that as much as 15 per cent of the scatter found in the mass-metallicity relation discussed in the previous section can be contributed by differences in the environment.
Using optical spectroscopic data from the SDSS and UV photometric data from the Galaxy Evolution
(GALEX) surveys we have shown that broadband colours (g-r, FUV-NUV) and equivalent width of H emission line varies as a function of the distance from centre of the filaments in the Coma supercluster (Mahajan et al., 2018). These observations imply the critical role played by large-scale cosmic filaments in the evolution of galaxies much before they encounter the hostile cluster-related environmental processes. We now provide further support to these observations in Fig. 11. This figure shows the observed trend in the [Fe/H] ratio of filament galaxies as a function of the distance from the spine of the filament, where spine is the central axis of the filament assuming they are uniform cylinders444The reader is directed to sec. 3 of Mahajan et al. (2018) for a detailed description of the procedure used to define filaments. . The observed trends although mild, suggests that the [Fe/H] ratio is 0.02-0.03 dex lower for galaxies at the spine of the filament relative to their counterparts Mpc away from it.
In line with the literature (Alpaslan et al., 2015; Chen et al., 2015; Mahajan et al., 2018), these observations also suggest that galaxies closer to the spine of the filaments either experience greater infall of gas due to the depth of the potential well, or accrete more smaller satellites which aide in lowering the [Fe/H] value. The former scenario seems to be in agreement with the studies of galaxies in galaxy groups (Janowiecki et al., 2017), where environment is similar to filaments. Janowiecki et al. (2017) found that low-mass () central galaxies in small groups have higher atomic gas fraction, molecular gas content and star formation activity relative to similar galaxies in isolation. In particular, Janowiecki et al. (2017) found that the atomic gas fraction in low-mass centrals is dex higher than their counterparts in isolation. These authors attribute their findings to the inflow of cold gas from the cosmic web and gas-rich mergers.
Our results are also in broad agreement with the work of Liao and Gao (2019), who used simulations to show that the gas accreted at high redshift (, ) on the cosmic-web gets shock heated and then cools at the centre of the filaments. These authors find that per cent of this gas gets accreted on to the halos on the filaments. Thereafter, this accreted gas will not only lower the metallicity of the halos, but also provide fuel for star formation.

5.4 Caveats
In this section we describe some shortcomings of the data and analyses presented in this paper.
-
•
Fibre-spectroscopy: In SDSS, galaxy spectra are obtained by observing each galaxy through a diameter fibre. This means that at the distance of Coma we are essentially receiving light from the central kpc of a galaxy and the line indices are measured for the core region of the galaxy only. The SDSS Lick indices are not corrected for this aperture bias. Therefore, ages and Z estimated using these indices, may not be representative of the whole galaxy. The effects of such an aperture bias are described in Gallazzi et al. (2005). In the context of the work presented here it is particularly important that even though the age and Z may be overestimated for some galaxies, the mean trends in age and Z observed as a function of stellar mass are not significantly affected (Gallazzi et al., 2005).
-
•
Completeness: SDSS being a fibre-based survey is limited by the physical size of fibres, such that no two fibres can be closer than or within of the plate centre. As a consequence repeated observations of each region on the sky are essential in order to obtain high completeness.
-
•
Luminosity-weighted age and Z: When interpreting trends in luminosity-weighted, model-based age and Z it is important to remember that averaging over all stellar populations masks the true complexities in both these quantities. For instance, even a small fraction of very young population together with very old populations can dramatically change the strength of Balmer lines, thus making the galaxy appear much younger than its mass-weighted age (Worthey et al., 1995, their fig. 1).
-
•
Sample and data: Given the limitations of our sample size, data quality and methodology adopted to estimate the age and metallicity of galaxies, it has not been possible to disentangle the effect of stellar mass and environment completely by refining bin sizes (e.g. Peng et al., 2010), or splitting our sample into mass bins every where (e.g. Figs. 10 and 11). Despite these drawbacks, we present our complete analysis in this paper in the hope that future studies on galaxy properties in the cosmic-web will draw inspiration from this work and better constrain the statistical observational trends seen here.
6 Summary
In this paper we have explored the statistical trends in age and stellar Z of galaxies in the Coma supercluster as a function of their and environment. To do so, we studied the luminosity-weighted mean ages and metallicity of galaxies using the SDSS Lick absorption line indices for two samples - a complete sample of 2,953 galaxies, many of which have large errors in the absorption line indices and a smaller sub-sample of 1,263 galaxies where every absorption line index is subject to an error of less than per cent. We have also examined the dependence of luminosity-weighted mean ages and metallicity on and large-scale environment of galaxies. Further, we have made an attempt to identify the factor (age, or environment) which governs the metallicity of galaxies, and trends on top of the generic observation that on average, dwarf galaxies have lower metallicity than their massive counterparts. Our key results are as follows:
-
•
At fixed (luminosity-weighted) age, stellar metallicity of all galaxies, dwarfs and giants, is independent of stellar mass except the most massive (), oldest galaxies ( Gyr) for which the Z declines sharply with .
-
•
At fixed (luminosity-weighted) age, metallicity of galaxies declines with age in cluster and filament environments alike. Our complete sample, including galaxies with higher measurement uncertainty suggests that the Z may increase with , but no such trend is observed for the low uncertainty sub-sample.
-
•
Massive galaxies () in clusters and filaments have similar distribution for the luminosity-weighted age of galaxies, where as their counterparts in the voids are younger by Gyr. The age distributions for the intermediate mass galaxies () on the other hand show statistically significant differences, such that the galaxies in clusters are older than the filament galaxies by 1-1.5 Gyr, while their counterparts in the voids are younger than filament galaxies by Gyr.
-
•
The median stellar Z of filament galaxies declines towards the central spine of the cylinder. This result indicates that some mechanism, most likely the infall of new gas on the cosmic web being accreted by the filament galaxies, is leading to a lower Z .
Our observations support a scenario where galaxies are born in the voids, and then assemble into clusters through filaments. During the course of their passage, as these galaxies evolve they will accumulate metals as well as stellar mass, thus explaining the observed mass-density, age-density and metallicity-density correlations, along with the trends observed for the Z and age of galaxies as a function of their and environment. It would be interesting to explore this hypothesis in simulations and test its impact on the observed properties of galaxies at . In our knowledge, this is the first study of the age and Z of galaxies in a supercluster providing a continuous range of environments. If confirmed, the statistical trends observed here would help refine recipes for the evolution of galaxies in different environments in simulations.
We believe deeper spectroscopic data for a range of environments is critical to confirm the observations made in this work. Although the Coma supercluster provides a unique laboratory where galaxies spanning almost three orders of magnitude in stellar mass could be explored in a continuous range of environments, it may not be a fair representative of the nearby Universe because it is times denser than the surrounding space (Hogg et al., 2004; Gavazzi et al., 2010). Future large facilities such as the Large Synoptic Survey Telescope (LSST), combined with spectroscopic follow-up and 21-cm data will be a key to confirming such trends, and understanding their origin. Large radio surveys planned for the near future may be able to confirm how, and how much of the cold gas is accreted by galaxies from the cosmic-web.
7 Acknowledgements
Funding for SDSS-III has been provided by the Alfred P. Sloan Foundation, the Participating Institutions, the National Science Foundation, and the U.S. Department of Energy Office of Science. The SDSS-III web site is http://www.sdss3.org/.
SDSS-III is managed by the Astrophysical Research Consortium for the Participating Institutions of the SDSS-III Collaboration including the University of Arizona, the Brazilian Participation Group, Brookhaven National Laboratory, Carnegie Mellon University, University of Florida, the French Participation Group, the German Participation Group, Harvard University, the Instituto de Astrofisica de Canarias, the Michigan State/ Notre Dame/JINA Participation Group, Johns Hopkins University, Lawrence Berkeley National Laboratory, Max Planck Institute for Astrophysics, Max Planck Institute for Extraterrestrial Physics, New Mexico State University, New York University, Ohio State University, Pennsylvania State University, University of Portsmouth, Princeton University, the Spanish Participation Group, University of Tokyo, University of Utah, Vanderbilt University, University of Virginia, University of Washington, and Yale University.
Mahajan acknowledges funding from the DST-SERB INSPIRE Faculty award (DST/INSPIRE/04/2015/002311), Department of Science and Technology (DST), Government of India.
References
- Aihara et al. (2011) Aihara, H., Allende Prieto, C., An, D., Anderson, S.F., Aubourg, É., Balbinot, E., Beers, T.C., Berlind, A.A., Bickerton, S.J., Bizyaev, D., Blanton, M.R., Bochanski, J.J., Bolton, A.S., Bovy, J., Brandt, W.N., Brinkmann, J., Brown, P.J., Brownstein, J.R., Busca, N.G., Campbell, H., Carr, M.A., Chen, Y., Chiappini, C., Comparat, J., Connolly, N., Cortes, M., Croft, R.A.C., Cuesta, A.J., da Costa, L.N., Davenport, J.R.A., Dawson, K., Dhital, S., Ealet, A., Ebelke, G.L., Edmondson, E.M., Eisenstein, D.J., Escoffier, S., Esposito, M., Evans, M.L., Fan, X., Femenía Castellá, B., Font-Ribera, A., Frinchaboy, P.M., Ge, J., Gillespie, B.A., Gilmore, G., González Hernández, J.I., Gott, J.R., Gould, A., Grebel, E.K., Gunn, J.E., Hamilton, J.C., Harding, P., Harris, D.W., Hawley, S.L., Hearty, F.R., Ho, S., Hogg, D.W., Holtzman, J.A., Honscheid, K., Inada, N., Ivans, I.I., Jiang, L., Johnson, J.A., Jordan, C., Jordan, W.P., Kazin, E.A., Kirkby, D., Klaene, M.A., Knapp, G.R., Kneib, J.P., Kochanek, C.S., Koesterke, L., Kollmeier, J.A., Kron, R.G., Lampeitl, H., Lang, D., Le Goff, J.M., Lee, Y.S., Lin, Y.T., Long, D.C., Loomis, C.P., Lucatello, S., Lundgren, B., Lupton, R.H., Ma, Z., MacDonald, N., Mahadevan, S., Maia, M.A.G., Makler, M., Malanushenko, E., Malanushenko, V., Mandelbaum, R., Maraston, C., Margala, D., Masters, K.L., McBride, C.K., McGehee, P.M., McGreer, I.D., Ménard, B., Miralda-Escudé, J., Morrison, H.L., Mullally, F., Muna, D., Munn, J.A., Murayama, H., Myers, A.D., Naugle, T., Neto, A.F., Nguyen, D.C., Nichol, R.C., O’Connell, R.W., Ogando, R.L.C., Olmstead, M.D., Oravetz, D.J., Padmanabhan, N., Palanque-Delabrouille, N., Pan, K., Pandey, P., Pâris, I., Percival, W.J., Petitjean, P., Pfaffenberger, R., Pforr, J., Phleps, S., Pichon, C., Pieri, M.M., Prada, F., Price-Whelan, A.M., Raddick, M.J., Ramos, B.H.F., Reylé, C., Rich, J., Richards, G.T., Rix, H.W., Robin, A.C., Rocha-Pinto, H.J., Rockosi, C.M., Roe, N.A., Rollinde, E., Ross, A.J., Ross, N.P., Rossetto, B.M., Sánchez, A.G., Sayres, C., Schlegel, D.J., Schlesinger, K.J., Schmidt, S.J., Schneider, D.P., Sheldon, E., Shu, Y., Simmerer, J., Simmons, A.E., Sivarani, T., Snedden, S.A., Sobeck, J.S., Steinmetz, M., Strauss, M.A., Szalay, A.S., Tanaka, M., Thakar, A.R., Thomas, D., Tinker, J.L., Tofflemire, B.M., Tojeiro, R., Tremonti, C.A., Vandenberg, J., Vargas Magaña, M., Verde, L., Vogt, N.P., Wake, D.A., Wang, J., Weaver, B.A., Weinberg, D.H., White, M., White, S.D.M., Yanny, B., Yasuda, N., Yeche, C., Zehavi, I., 2011. The Eighth Data Release of the Sloan Digital Sky Survey: First Data from SDSS-III. ApJS 193, 29. doi:10.1088/0067-0049/193/2/29.
- Alpaslan et al. (2015) Alpaslan, M., Driver, S., Robotham, A.S.G., Obreschkow, D., Andrae, E., Cluver, M., Kelvin, L.S., Lange, R., Owers, M., Taylor, E.N., Andrews, S.K., Bamford, S., Bland-Hawthorn, J., Brough, S., Brown, M.J.I., Colless, M., Davies, L.J.M., Eardley, E., Grootes, M.W., Hopkins, A.M., Kennedy, R., Liske, J., Lara-López, M.A., López-Sánchez, Á.R., Loveday, J., Madore, B.F., Mahajan, S., Meyer, M., Moffett, A., Norberg, P., Penny, S., Pimbblet, K.A., Popescu, C.C., Seibert, M., Tuffs, R., 2015. Galaxy And Mass Assembly (GAMA): trends in galaxy colours, morphology, and stellar populations with large-scale structure, group, and pair environments. MNRAS 451, 3249–3268. doi:10.1093/mnras/stv1176, arXiv:1505.05518.
- Annibali et al. (2007) Annibali, F., Bressan, A., Rampazzo, R., Zeilinger, W., Danese, L., 2007. Stellar Populations in Field Early--Type Galaxies, in: Vallenari, A., Tantalo, R., Portinari, L., Moretti, A. (Eds.), From Stars to Galaxies: Building the Pieces to Build Up the Universe, p. 469. arXiv:astro-ph/0702451.
- Balogh et al. (2004) Balogh, M., Eke, V., Miller, C., Lewis, I., Bower, R., Couch, W., Nichol, R., Bland-Hawthorn, J., Baldry, I.K., Baugh, C., Bridges, T., Cannon, R., Cole, S., Colless, M., Collins, C., Cross, N., Dalton, G., de Propris, R., Driver, S.P., Efstathiou, G., Ellis, R.S., Frenk, C.S., Glazebrook, K., Gomez, P., Gray, A., Hawkins, E., Jackson, C., Lahav, O., Lumsden, S., Maddox, S., Madgwick, D., Norberg, P., Peacock, J.A., Percival, W., Peterson, B.A., Sutherland, W., Taylor, K., 2004. Galaxy ecology: groups and low-density environments in the SDSS and 2dFGRS. MNRAS 348, 1355--1372. doi:10.1111/j.1365-2966.2004.07453.x, arXiv:astro-ph/0311379.
- Bell and de Jong (2000) Bell, E.F., de Jong, R.S., 2000. The stellar populations of spiral galaxies. MNRAS 312, 497--520. doi:10.1046/j.1365-8711.2000.03138.x, arXiv:astro-ph/9909402.
- Blanton et al. (2005) Blanton, M.R., Eisenstein, D., Hogg, D.W., Schlegel, D.J., Brinkmann, J., 2005. Relationship between Environment and the Broadband Optical Properties of Galaxies in the Sloan Digital Sky Survey. ApJ 629, 143--157. doi:10.1086/422897, arXiv:astro-ph/0310453.
- Bothwell et al. (2013) Bothwell, M.S., Maiolino, R., Kennicutt, R., Cresci, G., Mannucci, F., Marconi, A., Cicone, C., 2013. A fundamental relation between the metallicity, gas content and stellar mass of local galaxies. MNRAS 433, 1425--1435. doi:10.1093/mnras/stt817, arXiv:1304.4940.
- Bressan et al. (1996) Bressan, A., Chiosi, C., Tantalo, R., 1996. Probing the age of elliptical galaxies. A&A 311, 425--445. arXiv:astro-ph/9602032.
- Brinchmann et al. (2004) Brinchmann, J., Charlot, S., White, S.D.M., Tremonti, C., Kauffmann, G., Heckman, T., Brinkmann, J., 2004. The physical properties of star-forming galaxies in the low-redshift Universe. MNRAS 351, 1151--1179. doi:10.1111/j.1365-2966.2004.07881.x, arXiv:astro-ph/0311060.
- Brodie and Huchra (1991) Brodie, J.P., Huchra, J.P., 1991. Extragalactic globular clusters. III - Metallicity comparisons and anomalies. ApJ 379, 157--167. doi:10.1086/170492.
- Bruzual and Charlot (2003) Bruzual, G., Charlot, S., 2003. Stellar population synthesis at the resolution of 2003. MNRAS 344, 1000--1028. doi:10.1046/j.1365-8711.2003.06897.x, arXiv:astro-ph/0309134.
- Bruzual A. and Charlot (1993) Bruzual A., G., Charlot, S., 1993. Spectral evolution of stellar populations using isochrone synthesis. ApJ 405, 538--553. doi:10.1086/172385.
- Buzzoni (1995) Buzzoni, A., 1995. Evolutionary Population Synthesis in Stellar Systems. II. Early-Type Galaxies. ApJS 98, 69. doi:10.1086/192155.
- Caldwell et al. (2003) Caldwell, N., Rose, J.A., Concannon, K.D., 2003. Star Formation Histories of Early-Type Galaxies. I. Higher Order Balmer Lines as Age Indicators. AJ 125, 2891--2926. doi:10.1086/375308, arXiv:astro-ph/0303345.
- Carter et al. (2002) Carter, D., Mobasher, B., Bridges, T.J., Poggianti, B.M., Komiyama, Y., Kashikawa, N., Doi, M., Iye, M., Okamura, S., Sekiguchi, M., Shimasaku, K., Yagi, M., Yasuda, N., 2002. A Photometric and Spectroscopic Study of Dwarf and Giant Galaxies in the Coma Cluster. V. Dependence of the Spectroscopic Properties on Location in the Cluster. ApJ 567, 772--780. doi:10.1086/338667, arXiv:astro-ph/0111189.
- Chen et al. (2015) Chen, Y.C., Ho, S., Freeman, P.E., Genovese, C.R., Wasserman, L., 2015. Cosmic web reconstruction through density ridges: method and algorithm. MNRAS 454, 1140--1156. doi:10.1093/mnras/stv1996, arXiv:1501.05303.
- Chisholm et al. (2018) Chisholm, J., Tremonti, C., Leitherer, C., 2018. Metal-enriched galactic outflows shape the mass-metallicity relationship. MNRAS 481, 1690--1706. doi:10.1093/mnras/sty2380, arXiv:1808.10453.
- Cid Fernandes et al. (2007) Cid Fernandes, R., Asari, N.V., Sodré, L., Stasińska, G., Mateus, A., Torres-Papaqui, J.P., Schoenell, W., 2007. Uncovering the chemical enrichment and mass-assembly histories of star-forming galaxies. MNRAS 375, L16--L20. doi:10.1111/j.1745-3933.2006.00265.x, arXiv:astro-ph/0610815.
- Collobert et al. (2006) Collobert, M., Sarzi, M., Davies, R.L., Kuntschner, H., Colless, M., 2006. Central stellar populations of early-type galaxies in low-density environments. MNRAS 370, 1213--1222. doi:10.1111/j.1365-2966.2006.10538.x, arXiv:astro-ph/0605622.
- Cooper et al. (2008) Cooper, M.C., Tremonti, C.A., Newman, J.A., Zabludoff, A.I., 2008. The role of environment in the mass-metallicity relation. MNRAS 390, 245--256. doi:10.1111/j.1365-2966.2008.13714.x, arXiv:0805.0308.
- Darvish et al. (2015) Darvish, B., Mobasher, B., Sobral, D., Hemmati, S., Nayyeri, H., Shivaei, I., 2015. Spectroscopic Study of Star-forming Galaxies in Filaments and the Field at z 0.5: Evidence for Environmental Dependence of Electron Density. ApJ 814, 84. doi:10.1088/0004-637X/814/2/84, arXiv:1510.05009.
- Dressler (1980) Dressler, A., 1980. Galaxy morphology in rich clusters - Implications for the formation and evolution of galaxies. ApJ 236, 351--365. doi:10.1086/157753.
- D’Souza and Bell (2018) D’Souza, R., Bell, E.F., 2018. The masses and metallicities of stellar haloes reflect galactic merger histories. MNRAS 474, 5300--5318. doi:10.1093/mnras/stx3081, arXiv:1705.08442.
- Ellison et al. (2009) Ellison, S.L., Simard, L., Cowan, N.B., Baldry, I.K., Patton, D.R., McConnachie, A.W., 2009. The mass-metallicity relation in galaxy clusters: the relative importance of cluster membership versus local environment. MNRAS 396, 1257--1272. doi:10.1111/j.1365-2966.2009.14817.x, arXiv:0903.4684.
- Erb et al. (2006) Erb, D.K., Shapley, A.E., Pettini, M., Steidel, C.C., Reddy, N.A., Adelberger, K.L., 2006. The Mass-Metallicity Relation at z 2. ApJ 644, 813--828. doi:10.1086/503623, arXiv:astro-ph/0602473.
- Faber et al. (1985) Faber, S.M., Friel, E.D., Burstein, D., Gaskell, C.M., 1985. Old stellar populations. II - an analysis of K-giant spectra. ApJS 57, 711--741. doi:10.1086/191024.
- Fontanelli (1984) Fontanelli, P., 1984. The Coma/A 1367 filament of galaxies. A&A 138, 85--92.
- Fontanot et al. (2009) Fontanot, F., De Lucia, G., Monaco, P., Somerville, R.S., Santini, P., 2009. The many manifestations of downsizing: hierarchical galaxy formation models confront observations. MNRAS 397, 1776--1790. doi:10.1111/j.1365-2966.2009.15058.x.
- Gallazzi et al. (2005) Gallazzi, A., Charlot, S., Brinchmann, J., White, S.D.M., Tremonti, C.A., 2005. The ages and metallicities of galaxies in the local universe. MNRAS 362, 41--58. doi:10.1111/j.1365-2966.2005.09321.x, arXiv:astro-ph/0506539.
- Gavazzi et al. (2010) Gavazzi, G., Fumagalli, M., Cucciati, O., Boselli, A., 2010. A snapshot on galaxy evolution occurring in the Great Wall: the role of Nurture at z = 0. A&A 517, A73. doi:10.1051/0004-6361/201014153, arXiv:1003.3795.
- Girardi et al. (2000) Girardi, L., Bressan, A., Bertelli, G., Chiosi, C., 2000. Evolutionary tracks and isochrones for low- and intermediate-mass stars: From 0.15 to 7 Msun, and from Z=0.0004 to 0.03. A&AS 141, 371--383. doi:10.1051/aas:2000126, arXiv:astro-ph/9910164.
- Gorgas et al. (1993) Gorgas, J., Faber, S.M., Burstein, D., Gonzalez, J.J., Courteau, S., Prosser, C., 1993. Old stellar populations. IV - Empirical functions for features in the spectra of G and K stars. ApJS 86, 153--198. doi:10.1086/191774.
- Gupta et al. (2017) Gupta, A., Yuan, T., Martizzi, D., Tran, K.V.H., Kewley, L.J., 2017. Survival of Massive Star-forming Galaxies in Cluster Cores Drives Gas-phase Metallicity Gradients: The Effects of Ram Pressure Stripping. ApJ 842, 75. doi:10.3847/1538-4357/aa74ea, arXiv:1705.08452.
- Heavens et al. (2004) Heavens, A., Panter, B., Jimenez, R., Dunlop, J., 2004. The star-formation history of the Universe from the stellar populations of nearby galaxies. Nature 428, 625--627. doi:10.1038/nature02474, arXiv:astro-ph/0403293.
- Hogg et al. (2004) Hogg, D.W., Blanton, M.R., Brinchmann, J., Eisenstein, D.J., Schlegel, D.J., Gunn, J.E., McKay, T.A., Rix, H.W., Bahcall, N.A., Brinkmann, J., Meiksin, A., 2004. The Dependence on Environment of the Color-Magnitude Relation of Galaxies. ApJL 601, L29--L32. doi:10.1086/381749, arXiv:astro-ph/0307336.
- Hughes et al. (2013) Hughes, T.M., Cortese, L., Boselli, A., Gavazzi, G., Davies, J.I., 2013. The role of cold gas and environment on the stellar mass-metallicity relation of nearby galaxies. A&A 550, A115. doi:10.1051/0004-6361/201218822, arXiv:1207.4191.
- Janowiecki et al. (2017) Janowiecki, S., Catinella, B., Cortese, L., Saintonge, A., Brown, T., Wang, J., 2017. xGASS: gas-rich central galaxies in small groups and their connections to cosmic web gas feeding. MNRAS 466, 4795--4812. doi:10.1093/mnras/stx046, arXiv:1701.01754.
- Jimenez et al. (2005) Jimenez, R., Panter, B., Heavens, A.F., Verde, L., 2005. Baryonic conversion tree: the global assembly of stars and dark matter in galaxies from the Sloan Digital Sky Survey. MNRAS 356, 495--501. doi:10.1111/j.1365-2966.2004.08469.x, arXiv:astro-ph/0403294.
- Jørgensen (1997) Jørgensen, I., 1997. Stellar populations of cluster E and S0 galaxies. MNRAS 288, 161--188. doi:10.1093/mnras/288.1.161, arXiv:astro-ph/9702076.
- Jørgensen (1999) Jørgensen, I., 1999. E and S0 galaxies in the central part of the Coma cluster: ages, metal abundances and dark matter. MNRAS 306, 607--636. doi:10.1046/j.1365-8711.1999.02555.x, arXiv:astro-ph/9902250.
- Kauffmann et al. (2003) Kauffmann, G., Heckman, T.M., Tremonti, C., Brinchmann, J., Charlot, S., White, S.D.M., Ridgway, S.E., Brinkmann, J., Fukugita, M., Hall, P.B., Ivezić, Ž., Richards, G.T., Schneider, D.P., 2003. The host galaxies of active galactic nuclei. MNRAS 346, 1055--1077. doi:10.1111/j.1365-2966.2003.07154.x, arXiv:astro-ph/0304239.
- Kroupa (2001) Kroupa, P., 2001. On the variation of the initial mass function. MNRAS 322, 231--246. doi:10.1046/j.1365-8711.2001.04022.x, arXiv:astro-ph/0009005.
- Kuntschner (2000) Kuntschner, H., 2000. The stellar populations of early-type galaxies in the Fornax cluster. MNRAS 315, 184--208. doi:10.1046/j.1365-8711.2000.03377.x.
- Kuntschner and Davies (1998) Kuntschner, H., Davies, R.L., 1998. The ages and metallicities of early-type galaxies in the Fornax cluster. MNRAS 295, L29--L33. doi:10.1046/j.1365-8711.1998.01262.x, arXiv:astro-ph/9710176.
- Kuntschner et al. (2001) Kuntschner, H., Lucey, J.R., Smith, R.J., Hudson, M.J., Davies, R.L., 2001. On the dependence of spectroscopic indices of early-type galaxies on age, metallicity and velocity dispersion. MNRAS 323, 615--629. doi:10.1046/j.1365-8711.2001.04263.x, arXiv:astro-ph/0011234.
- Lara-López et al. (2010) Lara-López, M.A., Cepa, J., Bongiovanni, A., Pérez García, A.M., Ederoclite, A., Castañeda, H., Fernández Lorenzo, M., Pović, M., Sánchez-Portal, M., 2010. A fundamental plane for field star-forming galaxies. A&A 521, L53. doi:10.1051/0004-6361/201014803, arXiv:1005.0509.
- Leethochawalit et al. (2018) Leethochawalit, N., Kirby, E.N., Moran, S.M., Ellis, R.S., Treu, T., 2018. Evolution of the Stellar Mass-Metallicity Relation. I. Galaxies in the z 0.4 Cluster Cl0024. ApJ 856, 15. doi:10.3847/1538-4357/aab26a, arXiv:1802.09560.
- Lequeux et al. (1979) Lequeux, J., Peimbert, M., Rayo, J.F., Serrano, A., Torres-Peimbert, S., 1979. Chemical composition and evolution of irregular and blue compact galaxies. A&A 80, 155--166.
- Li (2013) Li, Z., 2013. Using colours to determine the stellar ages and metallicities of distant galaxies. ArXiv e-prints arXiv:1302.0100.
- Li et al. (2007) Li, Z., Han, Z., Zhang, F., 2007. Potential of colors for determining age and metallicity of stellar populations. A&A 464, 853--857. doi:10.1051/0004-6361:20066337, arXiv:astro-ph/0611158.
- Liao and Gao (2019) Liao, S., Gao, L., 2019. Impact of filaments on galaxy formation in their residing dark matter haloes. MNRAS 485, 464--473. doi:10.1093/mnras/stz441, arXiv:1805.10944.
- Mahajan et al. (2010) Mahajan, S., Haines, C.P., Raychaudhury, S., 2010. Star formation, starbursts and quenching across the Coma supercluster. MNRAS 404, 1745--1760. doi:10.1111/j.1365-2966.2010.16432.x.
- Mahajan et al. (2018) Mahajan, S., Singh, A., Shobhana, D., 2018. Ultraviolet and optical view of galaxies in the Coma supercluster. MNRAS 478, 4336--4347. doi:10.1093/mnras/sty1370, arXiv:1805.09029.
- Mannucci et al. (2010) Mannucci, F., Cresci, G., Maiolino, R., Marconi, A., Gnerucci, A., 2010. A fundamental relation between mass, star formation rate and metallicity in local and high-redshift galaxies. MNRAS 408, 2115--2127. doi:10.1111/j.1365-2966.2010.17291.x, arXiv:1005.0006.
- Maraston (2005) Maraston, C., 2005. Evolutionary population synthesis: models, analysis of the ingredients and application to high-z galaxies. MNRAS 362, 799--825. doi:10.1111/j.1365-2966.2005.09270.x, arXiv:astro-ph/0410207.
- Michielsen et al. (2008) Michielsen, D., Boselli, A., Conselice, C.J., Toloba, E., Whiley, I.M., Aragón-Salamanca, A., Balcells, M., Cardiel, N., Cenarro, A.J., Gorgas, J., Peletier, R.F., Vazdekis, A., 2008. The relation between stellar populations, structure and environment for dwarf elliptical galaxies from the MAGPOP-ITP. MNRAS 385, 1374--1392. doi:10.1111/j.1365-2966.2008.12846.x, arXiv:0712.2017.
- Moore et al. (2001) Moore, S.A.W., Lucey, J.R., Kuntschner, H., Davies, R.L., Colless, M., 2001. The fundamental properties of early-type galaxies in the Coma Cluster. Astrophysics and Space Science Supplement 277, 429--432. doi:10.1023/A:1012717320471, arXiv:astro-ph/0111047.
- Mouhcine et al. (2007) Mouhcine, M., Baldry, I.K., Bamford, S.P., 2007. The environmental dependence of the chemical properties of star-forming galaxies. MNRAS 382, 801--808. doi:10.1111/j.1365-2966.2007.12405.x, arXiv:0709.3794.
- Muldrew et al. (2012) Muldrew, S.I., Croton, D.J., Skibba, R.A., Pearce, F.R., Ann, H.B., Baldry, I.K., Brough, S., Choi, Y.Y., Conselice, C.J., Cowan, N.B., Gallazzi, A., Gray, M.E., Grützbauch, R., Li, I.H., Park, C., Pilipenko, S.V., Podgorzec, B.J., Robotham, A.S.G., Wilman, D.J., Yang, X., Zhang, Y., Zibetti, S., 2012. Measures of galaxy environment - I. What is ’environment’? MNRAS 419, 2670--2682. doi:10.1111/j.1365-2966.2011.19922.x, arXiv:1109.6328.
- Neistein et al. (2006) Neistein, E., van den Bosch, F.C., Dekel, A., 2006. Natural downsizing in hierarchical galaxy formation. MNRAS 372, 933--948. doi:10.1111/j.1365-2966.2006.10918.x, arXiv:astro-ph/0605045.
- Ogando et al. (2008) Ogando, R.L.C., Maia, M.A.G., Pellegrini, P.S., da Costa, L.N., 2008. Line Strengths of Early-Type Galaxies. AJ 135, 2424--2445. doi:10.1088/0004-6256/135/6/2424, arXiv:0803.3477.
- Panter et al. (2007) Panter, B., Jimenez, R., Heavens, A.F., Charlot, S., 2007. The star formation histories of galaxies in the Sloan Digital Sky Survey. MNRAS 378, 1550--1564. doi:10.1111/j.1365-2966.2007.11909.x, arXiv:astro-ph/0608531.
- Panter et al. (2008) Panter, B., Jimenez, R., Heavens, A.F., Charlot, S., 2008. The cosmic evolution of metallicity from the SDSS fossil record. MNRAS 391, 1117--1126. doi:10.1111/j.1365-2966.2008.13981.x, arXiv:0804.3091.
- Pasquali et al. (2010) Pasquali, A., Gallazzi, A., Fontanot, F., van den Bosch, F.C., De Lucia, G., Mo, H.J., Yang, X., 2010. Ages and metallicities of central and satellite galaxies: implications for galaxy formation and evolution. MNRAS 407, 937--954. doi:10.1111/j.1365-2966.2010.17074.x, arXiv:0912.1853.
- Pasquali et al. (2012) Pasquali, A., Gallazzi, A., van den Bosch, F.C., 2012. The gas-phase metallicity of central and satellite galaxies in the Sloan Digital Sky Survey. MNRAS 425, 273--286. doi:10.1111/j.1365-2966.2012.21454.x, arXiv:1206.3458.
- Peng et al. (2010) Peng, Y.j., Lilly, S.J., Kovač, K., Bolzonella, M., Pozzetti, L., Renzini, A., Zamorani, G., Ilbert, O., Knobel, C., Iovino, A., Maier, C., Cucciati, O., Tasca, L., Carollo, C.M., Silverman, J., Kampczyk, P., de Ravel, L., Sanders, D., Scoville, N., Contini, T., Mainieri, V., Scodeggio, M., Kneib, J.P., Le Fèvre, O., Bardelli, S., Bongiorno, A., Caputi, K., Coppa, G., de la Torre, S., Franzetti, P., Garilli, B., Lamareille, F., Le Borgne, J.F., Le Brun, V., Mignoli, M., Perez Montero, E., Pello, R., Ricciardelli, E., Tanaka, M., Tresse, L., Vergani, D., Welikala, N., Zucca, E., Oesch, P., Abbas, U., Barnes, L., Bordoloi, R., Bottini, D., Cappi, A., Cassata, P., Cimatti, A., Fumana, M., Hasinger, G., Koekemoer, A., Leauthaud, A., Maccagni, D., Marinoni, C., McCracken, H., Memeo, P., Meneux, B., Nair, P., Porciani, C., Presotto, V., Scaramella, R., 2010. Mass and Environment as Drivers of Galaxy Evolution in SDSS and zCOSMOS and the Origin of the Schechter Function. ApJ 721, 193--221. doi:10.1088/0004-637X/721/1/193, arXiv:1003.4747.
- Peng and Maiolino (2014) Peng, Y.j., Maiolino, R., 2014. The dependence of the galaxy mass-metallicity relation on environment and the implied metallicity of the IGM. MNRAS 438, 262--270. doi:10.1093/mnras/stt2175, arXiv:1311.1816.
- Poggianti et al. (2001) Poggianti, B.M., Bridges, T.J., Mobasher, B., Carter, D., Doi, M., Iye, M., Kashikawa, N., Komiyama, Y., Okamura, S., Sekiguchi, M., Shimasaku, K., Yagi, M., Yasuda, N., 2001. A Photometric and Spectroscopic Study of Dwarf and Giant Galaxies in the Coma Cluster. III. Spectral Ages and Metallicities. ApJ 562, 689--712. doi:10.1086/323217, arXiv:astro-ph/0107158.
- Price et al. (2011) Price, J., Phillipps, S., Huxor, A., Smith, R.J., Lucey, J.R., 2011. The stellar populations of bright coma cluster galaxies. MNRAS 411, 2558--2585. doi:10.1111/j.1365-2966.2010.17862.x, arXiv:1010.3864.
- Proctor et al. (2004) Proctor, R.N., Forbes, D.A., Hau, G.K.T., Beasley, M.A., De Silva, G.M., Contreras, R., Terlevich, A.I., 2004. Ages and metallicities of Hickson compact group galaxies. MNRAS 349, 1381--1396. doi:10.1111/j.1365-2966.2004.07617.x, arXiv:astro-ph/0401096.
- Rakos et al. (2007) Rakos, K., Schombert, J., Odell, A., 2007. Age and Metallicities of Cluster Galaxies: A1185 and Coma. ApJ 658, 929--940. doi:10.1086/511808, arXiv:astro-ph/0611587.
- Rakos et al. (2008) Rakos, K., Schombert, J., Odell, A., 2008. The Age of Cluster Galaxies from Continuum Colors. ApJ 677, 1019--1032. doi:10.1086/533513, arXiv:0801.3665.
- Rines et al. (2003) Rines, K., Geller, M.J., Kurtz, M.J., Diaferio, A., 2003. CAIRNS: The Cluster and Infall Region Nearby Survey. I. Redshifts and Mass Profiles. AJ 126, 2152--2170. doi:10.1086/378599, arXiv:astro-ph/0306538.
- Rines et al. (2005) Rines, K., Geller, M.J., Kurtz, M.J., Diaferio, A., 2005. CAIRNS: The Cluster and Infall Region Nearby Survey. III. Environmental Dependence of H Properties of Galaxies. AJ 130, 1482--1501. doi:10.1086/433173, arXiv:astro-ph/0506660.
- Sánchez-Blázquez et al. (2006a) Sánchez-Blázquez, P., Gorgas, J., Cardiel, N., González, J.J., 2006a. Stellar populations of early-type galaxies in different environments. I. Line-strength indices. Relations of line-strengths with . A&A 457, 787--808. doi:10.1051/0004-6361:20064842, arXiv:astro-ph/0604565.
- Sánchez-Blázquez et al. (2006b) Sánchez-Blázquez, P., Gorgas, J., Cardiel, N., González, J.J., 2006b. Stellar populations of early-type galaxies in different environments. II. Ages and metallicities. A&A 457, 809--821. doi:10.1051/0004-6361:20064845, arXiv:astro-ph/0604568.
- Sheth et al. (2006) Sheth, R.K., Jimenez, R., Panter, B., Heavens, A.F., 2006. Environment and the Cosmic Evolution of Star Formation. ApJL 650, L25--L28. doi:10.1086/508683, arXiv:astro-ph/0604581.
- Skillman et al. (1989) Skillman, E.D., Kennicutt, R.C., Hodge, P.W., 1989. Oxygen abundances in nearby dwarf irregular galaxies. ApJ 347, 875--882. doi:10.1086/168178.
- Skillman et al. (1996) Skillman, E.D., Kennicutt, Jr., R.C., Shields, G.A., Zaritsky, D., 1996. Chemical Abundances in Virgo Spiral Galaxies. II. Effects of Cluster Environment. ApJ 462, 147. doi:10.1086/177138, arXiv:astro-ph/9511019.
- Smith et al. (2009) Smith, R.J., Lucey, J.R., Hudson, M.J., Allanson, S.P., Bridges, T.J., Hornschemeier, A.E., Marzke, R.O., Miller, N.A., 2009. A spectroscopic survey of dwarf galaxies in the Coma cluster: stellar populations, environment and downsizing. MNRAS 392, 1265--1294. doi:10.1111/j.1365-2966.2008.14180.x, arXiv:0810.5558.
- Smith et al. (2008) Smith, R.J., Marzke, R.O., Hornschemeier, A.E., Bridges, T.J., Hudson, M.J., Miller, N.A., Lucey, J.R., Vázquez, G.A., Carter, D., 2008. A large population of recently quenched red-sequence dwarf galaxies in the outskirts of the Coma cluster. MNRAS 386, L96--L100. doi:10.1111/j.1745-3933.2008.00469.x, arXiv:0803.0327.
- Sreedhar et al. (2012) Sreedhar, Y.H., Odell, A.P., Rakos, K.D., Hensler, G., Zeilinger, W.W., 2012. Ages and Metallicities of Cluster Galaxies in A779 Using Modified Strömgren Photometry. ApJ 747, 68. doi:10.1088/0004-637X/747/1/68.
- Thomas et al. (2005) Thomas, D., Maraston, C., Bender, R., Mendes de Oliveira, C., 2005. The Epochs of Early-Type Galaxy Formation as a Function of Environment. ApJ 621, 673--694. doi:10.1086/426932, arXiv:astro-ph/0410209.
- Thomas et al. (2010) Thomas, D., Maraston, C., Schawinski, K., Sarzi, M., Silk, J., 2010. Environment and self-regulation in galaxy formation. MNRAS 404, 1775--1789. doi:10.1111/j.1365-2966.2010.16427.x.
- Toloba et al. (2009) Toloba, E., Boselli, A., Gorgas, J., Peletier, R.F., Cenarro, A.J., Gadotti, D.A., Gil de Paz, A., Pedraz, S., Yildiz, U., 2009. Kinematic Properties as Probes of the Evolution of Dwarf Galaxies in the Virgo Cluster. ApJL 707, L17--L21. doi:10.1088/0004-637X/707/1/L17, arXiv:0910.4968.
- Trager et al. (2008) Trager, S.C., Faber, S.M., Dressler, A., 2008. The stellar population histories of early-type galaxies - III. The Coma cluster. MNRAS 386, 715--747. doi:10.1111/j.1365-2966.2008.13132.x, arXiv:0803.0464.
- Trager et al. (2000) Trager, S.C., Faber, S.M., Worthey, G., González, J.J., 2000. The Stellar Population Histories of Early-Type Galaxies. II. Controlling Parameters of the Stellar Populations. AJ 120, 165--188. doi:10.1086/301442, arXiv:astro-ph/0004095.
- Tremonti et al. (2004) Tremonti, C.A., Heckman, T.M., Kauffmann, G., Brinchmann, J., Charlot, S., White, S.D.M., Seibert, M., Peng, E.W., Schlegel, D.J., Uomoto, A., Fukugita, M., Brinkmann, J., 2004. The Origin of the Mass-Metallicity Relation: Insights from 53,000 Star-forming Galaxies in the Sloan Digital Sky Survey. ApJ 613, 898--913. doi:10.1086/423264, arXiv:astro-ph/0405537.
- Vazdekis et al. (1996) Vazdekis, A., Casuso, E., Peletier, R.F., Beckman, J.E., 1996. A New Chemo-evolutionary Population Synthesis Model for Early-Type Galaxies. I. Theoretical Basis. ApJS 106, 307. doi:10.1086/192340, arXiv:astro-ph/9605112.
- Vazdekis et al. (2010) Vazdekis, A., Sánchez-Blázquez, P., Falcón-Barroso, J., Cenarro, A.J., Beasley, M.A., Cardiel, N., Gorgas, J., Peletier, R.F., 2010. Evolutionary stellar population synthesis with MILES - I. The base models and a new line index system. MNRAS 404, 1639--1671. doi:10.1111/j.1365-2966.2010.16407.x, arXiv:1004.4439.
- Weigel et al. (2016) Weigel, A.K., Schawinski, K., Bruderer, C., 2016. Stellar mass functions: methods, systematics and results for the local Universe. MNRAS 459, 2150--2187. doi:10.1093/mnras/stw756, arXiv:1604.00008.
- Weiss et al. (1995) Weiss, A., Peletier, R.F., Matteucci, F., 1995. Synthetic metal line indices for elliptical galaxies from super metal-rich -enhanced stellar models. A&A 296, 73.
- Worthey (1994) Worthey, G., 1994. Comprehensive stellar population models and the disentanglement of age and metallicity effects. ApJS 95, 107--149. doi:10.1086/192096.
- Worthey and Ottaviani (1997) Worthey, G., Ottaviani, D.L., 1997. H and H Absorption Features in Stars and Stellar Populations. ApJS 111, 377--386. doi:10.1086/313021.
- Worthey et al. (1995) Worthey, G., Trager, S.C., Faber, S.M., 1995. The Galaxian Age-Metallicity Relation, in: Buzzoni, A., Renzini, A., Serrano, A. (Eds.), Fresh Views of Elliptical Galaxies, p. 203.
- Wu et al. (2017) Wu, P.F., Zahid, H.J., Hwang, H.S., Geller, M.J., 2017. The dependence of the mass-metallicity relation on large-scale environment. MNRAS 468, 1881--1892. doi:10.1093/mnras/stx597, arXiv:1702.03323.
- York et al. (2000) York, D.G., Adelman, J., Anderson, Jr., J.E., Anderson, S.F., Annis, J., Bahcall, N.A., Bakken, J.A., Barkhouser, R., Bastian, S., Berman, E., Boroski, W.N., Bracker, S., Briegel, C., Briggs, J.W., Brinkmann, J., Brunner, R., Burles, S., Carey, L., Carr, M.A., Castander, F.J., Chen, B., Colestock, P.L., Connolly, A.J., Crocker, J.H., Csabai, I., Czarapata, P.C., Davis, J.E., Doi, M., Dombeck, T., Eisenstein, D., Ellman, N., Elms, B.R., Evans, M.L., Fan, X., Federwitz, G.R., Fiscelli, L., Friedman, S., Frieman, J.A., Fukugita, M., Gillespie, B., Gunn, J.E., Gurbani, V.K., de Haas, E., Haldeman, M., Harris, F.H., Hayes, J., Heckman, T.M., Hennessy, G.S., Hindsley, R.B., Holm, S., Holmgren, D.J., Huang, C.h., Hull, C., Husby, D., Ichikawa, S.I., Ichikawa, T., Ivezić, Ž., Kent, S., Kim, R.S.J., Kinney, E., Klaene, M., Kleinman, A.N., Kleinman, S., Knapp, G.R., Korienek, J., Kron, R.G., Kunszt, P.Z., Lamb, D.Q., Lee, B., Leger, R.F., Limmongkol, S., Lindenmeyer, C., Long, D.C., Loomis, C., Loveday, J., Lucinio, R., Lupton, R.H., MacKinnon, B., Mannery, E.J., Mantsch, P.M., Margon, B., McGehee, P., McKay, T.A., Meiksin, A., Merelli, A., Monet, D.G., Munn, J.A., Narayanan, V.K., Nash, T., Neilsen, E., Neswold, R., Newberg, H.J., Nichol, R.C., Nicinski, T., Nonino, M., Okada, N., Okamura, S., Ostriker, J.P., Owen, R., Pauls, A.G., Peoples, J., Peterson, R.L., Petravick, D., Pier, J.R., Pope, A., Pordes, R., Prosapio, A., Rechenmacher, R., Quinn, T.R., Richards, G.T., Richmond, M.W., Rivetta, C.H., Rockosi, C.M., Ruthmansdorfer, K., Sandford, D., Schlegel, D.J., Schneider, D.P., Sekiguchi, M., Sergey, G., Shimasaku, K., Siegmund, W.A., Smee, S., Smith, J.A., Snedden, S., Stone, R., Stoughton, C., Strauss, M.A., Stubbs, C., SubbaRao, M., Szalay, A.S., Szapudi, I., Szokoly, G.P., Thakar, A.R., Tremonti, C., Tucker, D.L., Uomoto, A., Vanden Berk, D., Vogeley, M.S., Waddell, P., Wang, S.i., Watanabe, M., Weinberg, D.H., Yanny, B., Yasuda, N., SDSS Collaboration, 2000. The Sloan Digital Sky Survey: Technical Summary. AJ 120, 1579--1587. doi:10.1086/301513, arXiv:astro-ph/0006396.