11email: {liumy, tzy_hit, xiaofei, rainy}@hit.edu.cn
Community-Based Service Ecosystem Evolution Analysis
Abstract
The prosperity of services and the frequent interaction between services contribute to the formation of the service ecosystem. Service ecosystem is a complex dynamic system with continuous evolution. Service providers voluntarily or compulsorily participate in this evolutionary process and face great opportunities and challenges. Existing studies on service ecosystem evolution are more about facilitating programmers to use services and have achieved remarkable results. However, the exploration of service ecosystem evolution from the business level is still insufficient. To make up this deficiency, in this paper, we present a method for analyzing service ecosystem evolution patterns from the perspective of the service community. Firstly, we train a service community evolution prediction model based on the community evolution sequences. Secondly, we explain the prediction model, showing how different factors affect the evolution of the service community. Finally, using the interpretable predictions and prior knowledge, we present how to assist service providers in making business decisions. Experiments on real-world data show that this work can indeed provide business-level insights into service ecosystem evolution. Additionally, all the data and well-documented code used in this paper have been fully open source.
Keywords:
Service Ecosystem Service Community Evolution Tracking Pattern Analysis1 Instruction
Along with the trend of Everything as a Service (EaaS), services flourish drastically both on the Internet and in the real world. These services have become much more interconnected and have formed various service ecosystems, such as “Internet of Services”, “Smart Planet”111https://www.ibm.com/smarterplanet/us/en/ and “Big Services”[16]. Nowadays, the service ecosystem continues to evolve every day, with the emergence, prosperity, integration, and decline of a large number of service individuals/service populations. The service providers in the service ecosystem are actively or passively involved in this evolution process and faced with great opportunities and challenges. It is of great significance to explore the evolution patterns and predict the evolution trend of the service ecosystem based on historical information, which can assist service providers in making business decisions to survive better in the competitive environment.
The existing studies on service ecosystem evolution mainly focus on solving the traditional service computing problems, such as service recommendation[7, 8, 17] and service discovery[1, 15], by exploring the changes in the overall network propriety of the service ecosystem or the changes of the individual attributes of the service. These studies mainly focus on technical-level service and have yielded many commendable results, helping programmers to develop services faster and better. In the real world, in addition to technical-level services, there are more common business-level service. Exploring the evolution of business-level service ecosystems can bring significant benefits and unique insights that cannot be provided by exploring technical-level service ecosystems, such as as service market trend development prediction and business decision assistance. However, there is still a lack of studies on the evolution of business-level service ecosystem is still insufficient, which is mainly caused by the lack of data and corresponding methods.
In this paper, we explore the evolution patterns and laws of the business-level service ecosystem from the perspective of the service community, to provide helpful insights on the evolving service ecosystem and suggestions for business decisions. To achieve this, we train and explain a service community evolution event prediction model. Specifically, we first extract a subgraph222In the remainder of this paper, we will treat this subgraph as a service ecosystem. of historical interaction between stakeholders and services from Multilayer network-based Service Ecosystem Model (MSEM)[10], which is constructed from the social media news data and solves the data deficiency of the business-level service ecosystem. Next, a series of service ecosystem snapshots at different times are generated, and the static community detection algorithm is applied to these snapshots to obtain the service community structure at different times. Then, by using the Group Evolution Detection (GED) algorithm[3], the service community structures at adjacent moments are aligned and the community evolution events are identified, including forming, continuing, growing, shrinking, splitting, merging, and dissolving [12]. After that, sequences are created to describe the evolution of the service community. Each sequence is consists of several preceding service community features and the corresponding evolution event, which serve as input for the prediction model. Finally, the service community evolution event prediction model is trained, and SHapley Additive exPlanations (SHAP)[11] is used to explain this machine learning model. Based on the explainable result, we summarized some patterns of service community evolution in the evolving service ecosystem and show how this explainable result can be contributed to assisting business decisions.
The main contributions of this paper are as follows:
-
1)
Different from traditional research on service ecosystem evolution, we explore the evolution patterns of the service ecosystem from the perspective of the service community. To the best of our knowledge, this is the first time that community evolution analysis is applied to the service ecosystem.
-
2)
A service community evolution prediction model is trained and explained. Applying the appropriate visualization to the interpretation results, we summarize some evolution patterns of service communities in the evolving service ecosystem.
-
3)
We used the trained prediction model to predict the evolution trend of a service community and show how this prediction can help service providers make business decisions.
All the data and algorithms used in the experiments have been fully open-sourced333https://github.com/icecity96/icsoc-2020, to help researchers in this domain for more deep research.
The remainder of this paper is organized as follows. Section 2 introduces related work. Section 3 gives the process and steps of exploring service ecosystem evolution from the perspective of the service community. Section 4 evaluates our approach on real-world data and presents a case study in the bike-sharing. And the last section is the conclusion.
2 Related Work
2.1 Service Evolution & Service Ecosystem Evolution
There have been a number of studies investigating the evolutionary properties of service and service ecosystems. These evolutionary studies focus on the state changes of service individuals and the changes of service network topology to help programmers select appropriate service for integration into their applications. In other words, these studies are mainly aimed at solving the classic problems in service computing, such as service recommendation, service discovery, and service deployment.
For example, Adalberto et al[14] aggregated structural, deployment, and runtime information of an evolving microservice system in one model, which provides actionable insights to help developers manage service upgrades, architectural evolution, and changing deployment trade-offs. Fokaefs and Stroulia[6] explored service evolution by comparing changes on interface description of a service. Huang et al[7] used a network link prediction method to study both usage patterns and the evolution traces of entire ProgrammableWeb ecosystem for service recommendation. Adeleye et al[1] organized web API services into a complex network graph by considering relations between them and studied the evolution of services for service discovery by analyzing the changes of this complex network. Yang et al[17] used Latent Dirichlet Allocation (LDA) and time series prediction to extract service evolution patterns for time-aware service recommendation.
These studies are all on technical-level service ecosystem, and the have achieved respectable results. In our view, in addition to the technical-level service ecosystem, the business-level ecosystem is a much broader service ecosystem in real world, and exploring the evolution of the business-level service ecosystem can bring more unique insights and significant benefits.
2.2 Community Evolution Prediction
As for the research on community evolution prediction, researchers mainly focus on (1) how to make prediction results more accurate and (2) explore the influence of different factors on prediction results. For example, Saganowski et al[13] presented and analyzed two methods to predict the near future of the community. They summarized that: (1) the longer community history cause higher quality of prediction, and (2) the most recent history of the community has the most influence on its next change. Dakiche et al[5] improved the accuracy of prediction by using change rates of features that describe a community throughout its evolution life-cycle rather than absolute values of features and achieved excellent results on DBLP and Facebook datasets. Dakiche et al[4] also explored the effect of timeframe type and size on community evolution prediction on Facebook and Higgs Twitter datasets.
Inspired by the success of community evolution prediction in social network analysis, we applied it to the analysis of service ecosystem evolution. The experiment shows that there are some similar patterns in the evolution of the service community and social community and some unique patterns in the evolution of the service community.
3 The Framework of Service Community Evolution Analysis and Prediction
Fig. 1 shows the framework of service community evolution analyzing and prediction in an evolving service ecosystem. The five parts of the framework are discussed in detail in the next five subsections of this section.
3.1 Service Ecosystem Snapshots Generation
We extract the stakeholder layer and service & feature layer involved in evolution from MSEM as the evolving service ecosystem studied in this paper. This ecosystem can be represented as , where represents the stakeholder and service in the ecosystem, which are collectively referred to for convenience. refers to the historical interactions between entities, where is the type of interaction, such as conflict and cooperation, and is the time of interaction.
In order to analyze the evolution of service ecosystem, it is segmented into adjacent snapshots . Each snapshot represents a weighted undirected graph with only the set of entities and edges that can be observed at time . represents the relation between entities with indicates the tightness of the relation. The main challenge in generating service ecosystem snapshots is how to determine the weight of each edge in the snapshot. We design Algorithm 1 to generate service ecosystem snapshots based on the following assumptions:
-
1)
The tightness of relation between entities is the cumulative result of their historical interactions.
-
2)
Different types of interactions have different impacts, which means that the impact of interactions on the weight is different, and the impact can be either positive or negative.
-
3)
The influence mechanism of different types of interaction on weight is different. In this paper, these mechanisms are summarized, including the stability mechanism that is not affected by time, the aging mechanism that declines with time and the mutation mechanism that is not affected by historical interaction.
The aging coefficient used in Algorithm 1 can be calculated as follows:
| (1) |
is a linear decay function, where and are two parameters used to indicate the period of decline and the maximum duration, which are set to 30 days and 365 days respectively in this paper.
3.2 Service Community Detection
Community detection is a popular research topic in the field of social network analysis. Several methods have been summarised in [9]. Each detection method has its characteristics and applicable scenarios, and the Louvain algorithm[2] with the advantages of easy implementation, no specific parameters, fast and good partition quality is used in this paper. It should be noted that one could use any other static community detection algorithm.
Due to the instability of the community detection, in order to obtain stable communities, we only keep the community of size more than . The communities detected in the are denoted by , where each is also a graph denoted by . Key nodes (leaders), which have higher social position than surrounding nodes, is also detected in each community and denoted by . The social position is represented by the PageRank score in this paper.
3.3 Service Community Evolution Tracking
GED[3] is applied as a community evolution tracker that can detect evolution events through the community structure of consecutive snapshots, including forming, continuing, growing, shrinking, splitting, merging, and dissolving [12]. The most important component in GED is a structural method called inclusion, which allows to evaluate the inclusion of one community in another. It takes into account both quantity and quality:
| (2) |
where is the social position of in community .
and are the GED method parameters, which are used to adjust the method to the particular network and community detection method. In this paper, they are both set to .
3.4 Service Community Features Representation
Based on the scale of our data and the demand for interpretability, we manually selected features rather than using representation learning to acquire features. Community structural features and community key nodes features are selected based on the following intuition:
-
1)
The service community is a dense subgraph composed of closely related entities, so the aggregated topology features in the community are very important.
-
2)
Key nodes, which promote the formation of the community, have more influence than other members of the community and usually lead the development of the community. We added the features of the key nodes to our consideration.
Table 1 summarizes the selected features as well as formulations and business explanations.
| Feature | Description | Formulation | Business explanation |
|---|---|---|---|
| size | Number of node within the community. | Reflects the scale of the service community | |
| density | The portion of potential connections in a community that are actual connections | Reflects the degree of familiarity between the entities within the service community | |
| clustering | The average clustering coefficient of nodes in the community | Reflects the degree of solidarity among the entities in the service community. | |
| average closeness | The average closeness of nodes in the community | Reflects the importance of the service community to the service ecosystem. | |
| degree | The average weighted degree of nodes in the community | Reflects the strength of internal and external interaction ability of the service community. | |
| leadership | The centralization of the community | Reflects the single entity’s maximum control over the entire service ecosystem. | |
| cohesion | The characterising strength of connections inside community in relation to connections outside | Reflects the degree of solidarity within the service community. | |
| #KeyNodes | Number of key nodes in the community | Reflects the number of leaders in the service community. | |
| activity | The max/sum/average weight of edges in the community (only max formulation is given) | Reflects the activity of the service community, and also reflects the degree to which the service community is concerned. | |
| %NodeType | The ratio of different type nodes in the community (only the formulation for service nodes is given) | Reflects the proportion of stakeholders and services in the service community. | |
| Kdegree | The average weighted degree of key nodes in the community | Reflects the strength of internal and external interaction ability of the key nodes in the service community. | |
| Kaverage closeness | The average closeness of key nodes in the community | Reflects the importance of the core members of the service community in the whole ecosystem |
Using the features given in Table 1, each service community can be denoted as vector , where corresponds to the features listed in the table. It is important to point out that some of the features have similar business explanations, but are reflected from different perspectives.
3.5 Prediction Model Training and Interpretation
After the steps mentioned in Section 3.3 and Section 3.4, we can obtain the evolution sequence of the service community and the their vector representation at different times. To balance the amount of training data and the information contained in the data, we use the state of the current moment and the state of the two past moments to predict the evolution, so the sequence length is , and the input can be denoted as follow:
| (3) |
The prediction target is the evolutionary event mentioned in Section 3.3, except forming, because forming has no past instances.
We use a random forest as prediction model based on the following reasons:
-
1.
Compared with several other prediction models, the random forest performs better on our real-world dataset. Detailed comparison is shown in Section 4.
-
2.
Tree models do not require large amounts of data for training and are easy to interpret and understand.
After the prediction model is trained. SHAP, which is a machine learning interpreter based on game-theoretic, are applied to explain the output of the prediction model. SHAP use shap values to explain how different features affect the predicted results. Combining the shap values with the appropriate visualization, we create results that are easily understood by humans.
The interpretation of the prediction model mainly serves two purposes: (1) Summarize the evolution patterns of service community based on historical data (train data). (2) Predict the evolution trend of a service community at present (test data) and provide evidence to assist in business decisions.
4 Case Study
In this section, we provide an case study on the bike-sharing service ecosystem. Since the bike-sharing industry has not been around for a long time, the Internet media has recorded a relatively complete development history, which provides us with an ideal data. Moreover, the bike-sharing service ecosystem has gone through a complete life circle, including growth, prosperity and decline.
We extracted data on the bike-sharing filed before December 24, 2019 from the auto-built MSEM. Starting from August 1, 2016, a snapshot of the service ecosystem will be generated every 30 days.
4.1 Snapshots Generation & Service Community Detection
Fig. 2 shows the size of service ecosystem (the blue line) and the number of service communities (the orange line) in the service ecosystem snapshot at different times. It can be seen that the size of service ecosystem and the number of service community both grew rapidly and reach their peak. However, the number of service communities is earlier the size of service ecosystem at both the time of high-speed growth and reaching the peak. This reflects that the service community is more sensitive to the evolution trend of the service ecosystem than the service ecosystem itself, and can perceive the evolution trend of the service ecosystem earlier. Decline comes after prosperity. Decline comes after a short period of prosperity. However, the decline mechanism of the service ecosystem scale is different from that of the number of service communities. The former is a gradual and slow decline, while the latter is a rapid decline after and then into a stable stage. Combining with the domain knowledge, we can know that the reduction of service ecosystem scale is due to the saturation of demand, and the change in the number of service communities is due to the fierce market competition.
To sum up, Fig. 2 confirms the point we made in the introduction that service communities can indeed provide unique insights that service ecosystem as a whole cannot.
4.2 Results of Service Evolution Tracking
Fig. 3 shows the distribution of service community evolution events over different time periods. is the most frequent evolution event. The formation and growth of service communities are mainly before 2018. A large number of communities died in mid-2018. Since late 2018, more service communities are starting to shrinking, which means that the competition in the bike-sharing market is coming to an end and the whole market is already saturated. Compared with other types of evolutionary events, service community merging and splitting events are significantly less.
By combining the distribution of service community evolution events and the change of the number of service communities, we can further understand the reasons for the change of the number of service communities. For example, it can be observed that two rapid decline of the number of service communities (labeled as decline point in Fig. 3) were mainly caused by and respectively. Furthermore, we can find that the subsequent effects of decline caused by the two type events are also different. The decline caused by soon recovered and grew and flourish again, while the decline caused by did not recover.
4.3 Evaluate Service Community Evolution Prediction Model
We divide the dataset containing samples into a train set and a test set, containing 665 samples and 166 samples, respectively. Fig. 4 compares the values of different prediction models on each evolution event on the test set.
As we can see, compared withe other models, the tree models (decision tree, bagging tree, random forest) performs well on our small dataset. The random forest get the highest value for all evolution events except for . Deep learning method (LSTM) do not perform well, because of the small data size. All models have poor performance for merging.
It should be pointed out that the focus of paper is not to find an optimal service community evolution prediction model. These models may vary greatly in different domains and datasets of different sizes. In this paper, we selected random forest for subsequent analysis because it performed best on our dataset.
4.4 Evolution Patterns of Service Community
Once we identified the best model for the prediction task, we explore evolution patterns of service community through investigating how do key features affect service community evolution events.
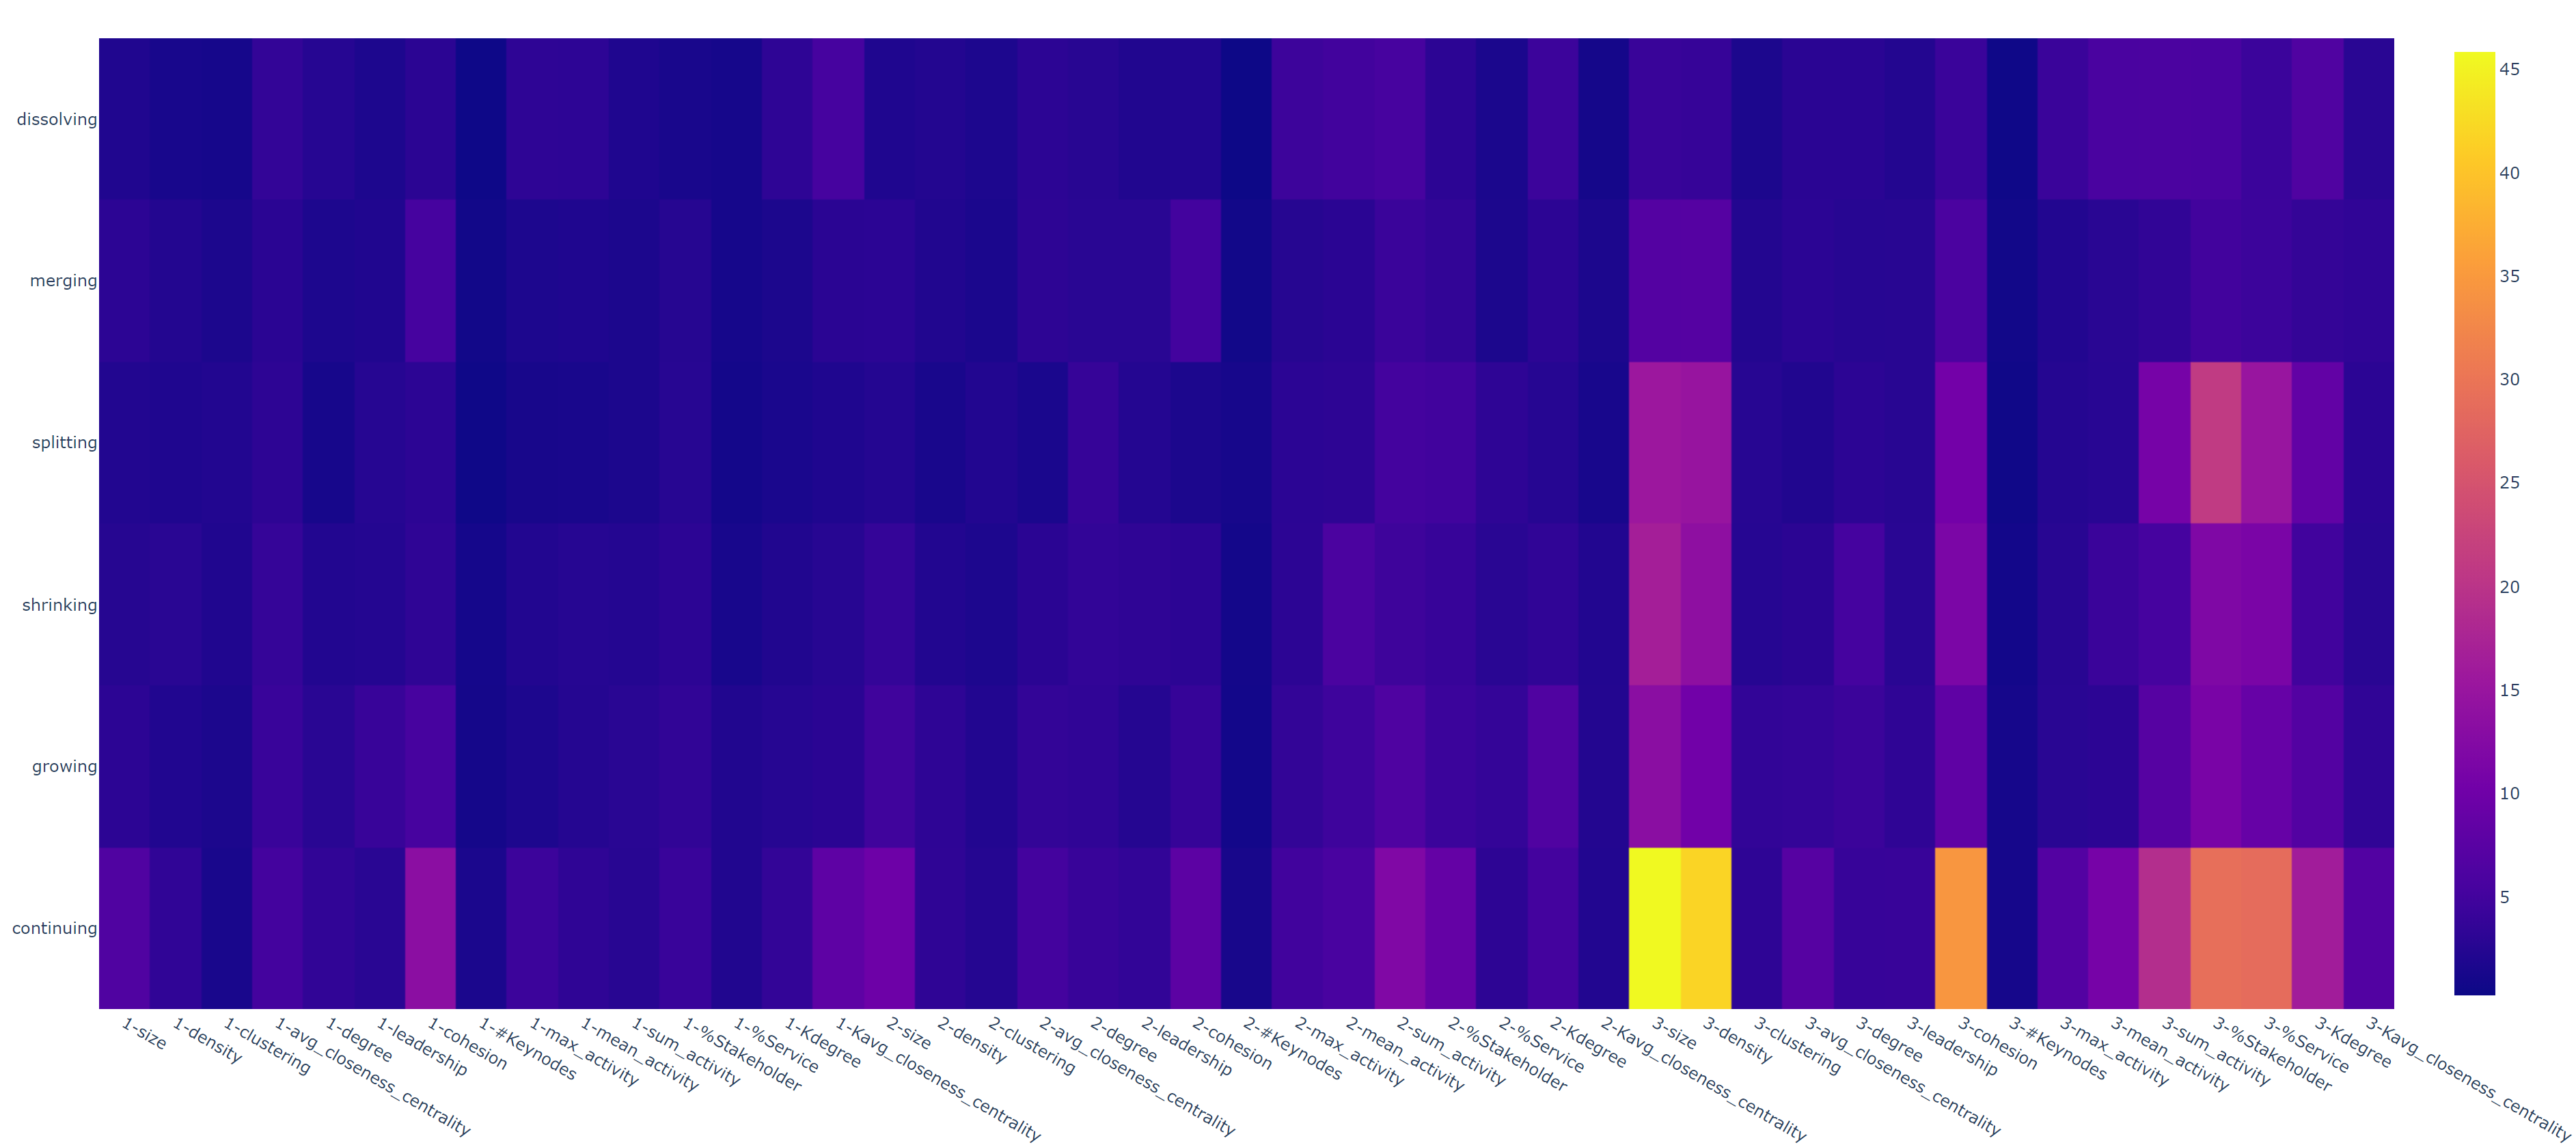
Fig. 5 shows an heat map of the importance of each selected feature to the prediction of different service community evolution events. It can be observed that for all events, and the number of key nodes in service community contributes little to the prediction. The degree of centralization () of the service community also has little influence on all events, which means that there is no advantage or disadvantage between centralization and decentralization in the field of bike-sharing. For example, both the Mobike-centered service community (centralization) and the HelloBike-Youon-centered service community (decentralization) have a high market share. Although and reflect the degree of service community solidarity from different aspects, has a greater impact on the events. It is not surprising that the service community size and the proportion of different types of entities are important features for all events.
Moreover, based on the sensitivity of events to temporal features, we summarize the evolutionary event types as follows:
-
1.
Full time sensitivity: for continuing, it sensitive to the features of the all time periods, and this sensitivity gradually declines with time.
-
2.
Nearest time sensitivity: for growing, shrinking and splitting, they are sensitive to the immediate history of the service community rather than more distant history.
-
3.
Not sensitive to time: for merging and dissolving, they are not sensitive to time factors, but more sensitive to some specifical features.
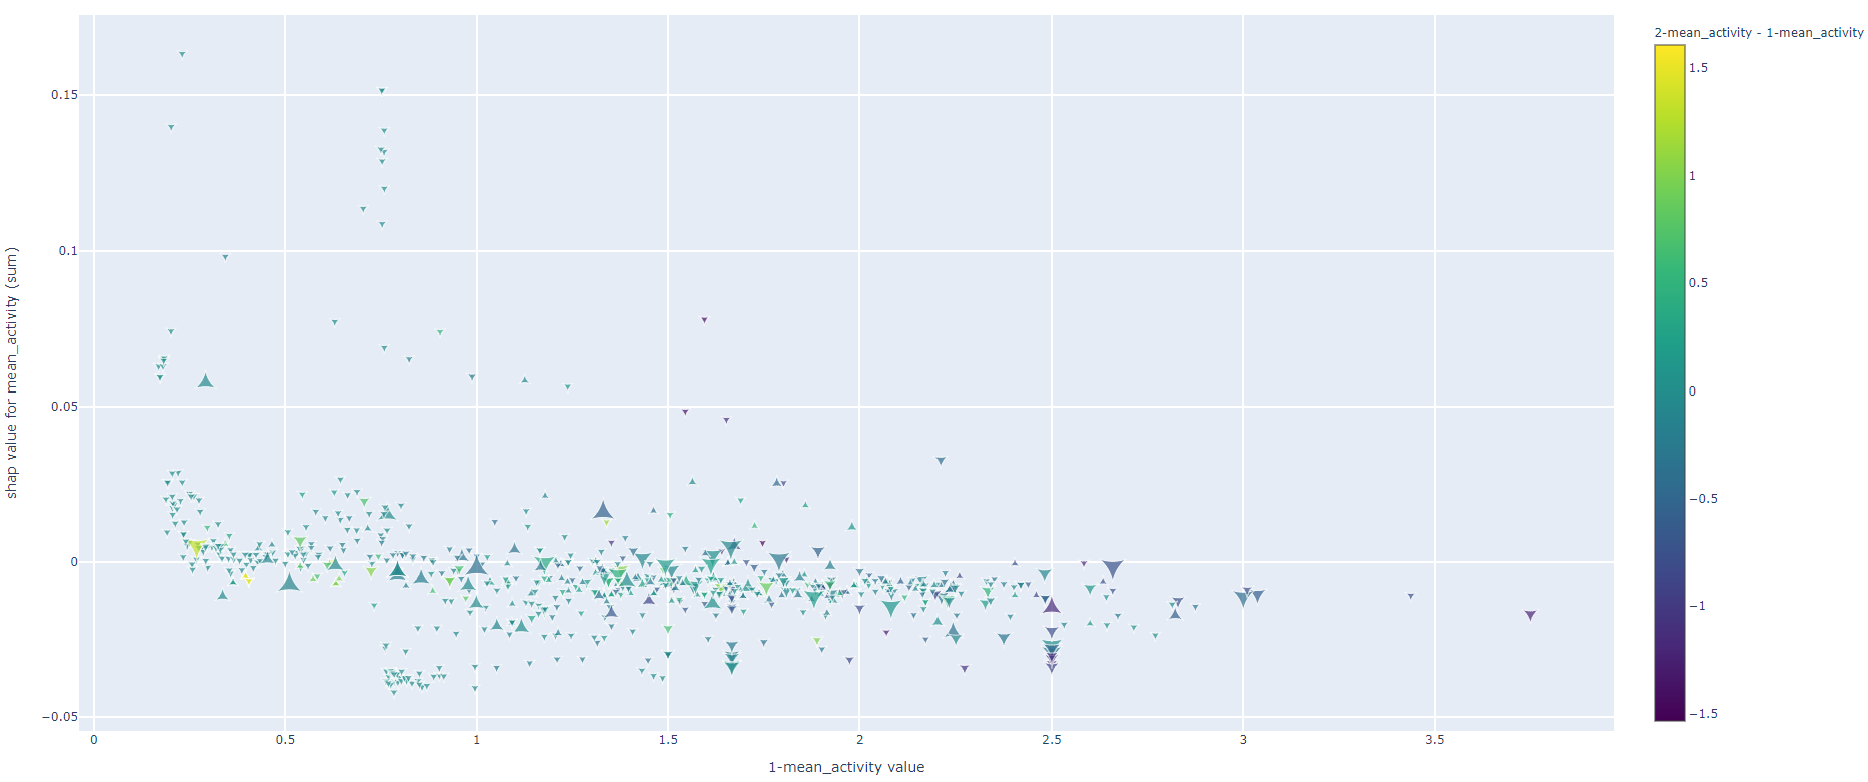
With SHAP values, we can further understand how a feature affects an evolutionary event in detail. Fig. 6 shows the dependence between event and . The vertical axis is the sum of SHAP values of of three consecutive service communities, where the positive value indicate that promotes the and negative value indicate prevents the . The horizontal axis the of the first service community. The color is used to indicate the difference in between the second community and the oldest community. Shape is used to represent the difference between the nearest community, where means that the difference is positive, while means negative. And the shape size means the absolute value of the difference.
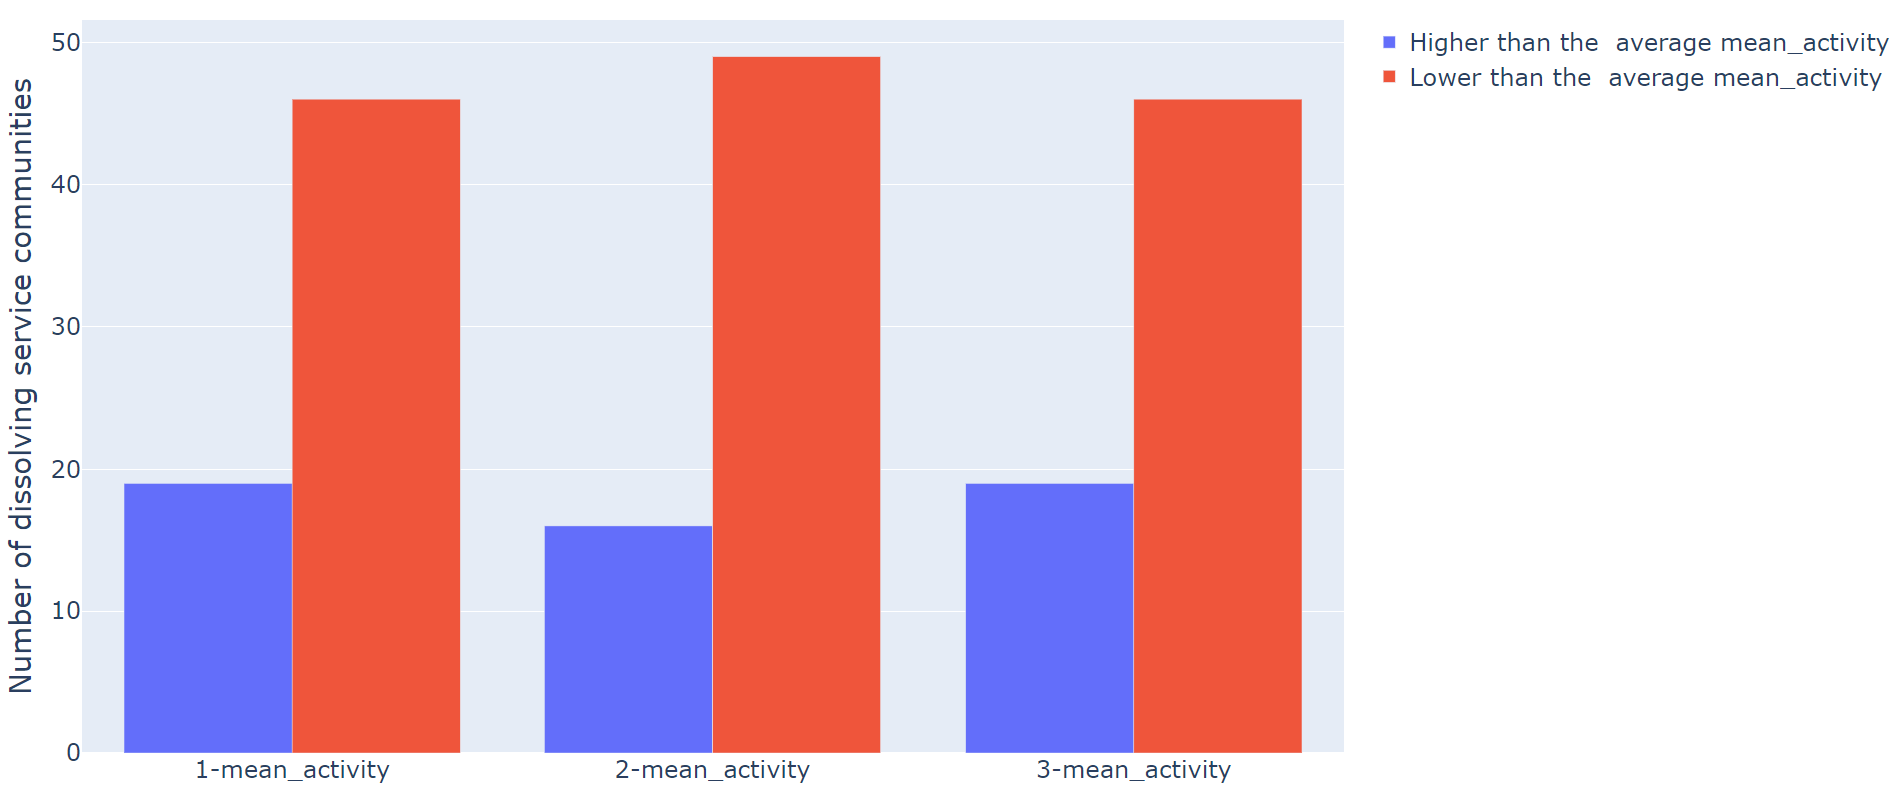
It is easy to conclude from the figure that service communities with low and declining are more likely to dissolve. Service communities with high are less likely to dissolve in the short time. This pattern is in line with people’s common sense, and we also illustrate the correctness of this pattern through the statistical results of our dataset, as shown in Fig. 7. It should be noted that this is a simple pattern used as an example. Managers can combine their domain knowledge to discover more complex patterns with the help of these data analysis results.
4.5 Decision Support
The prediction model can also assist managers to make decisions by providing the possibility of each evolutionary event and the influence of each feature on this evolution.
Fig. 8 give an prediction of the evolution trend of ofo-centered service community, where is the probability of an evolutionary event in the training sample. From the figure, we can see that the probability of continuing, growing, shrinking, splitting, merging, and dissolving occurring in ofo-centered service community is , , , , and respectively. Therefore, the most likely evolution for ofo-centered service community is shrinking and splitting. Normally, both shrinking and splitting are negative evolutions, so when a new service provider wants to select partners and enter the bike-sharing market, it is not a good choice for him to join the ofo-centered service community, he may need to find those service community that are more likely to grow to join.
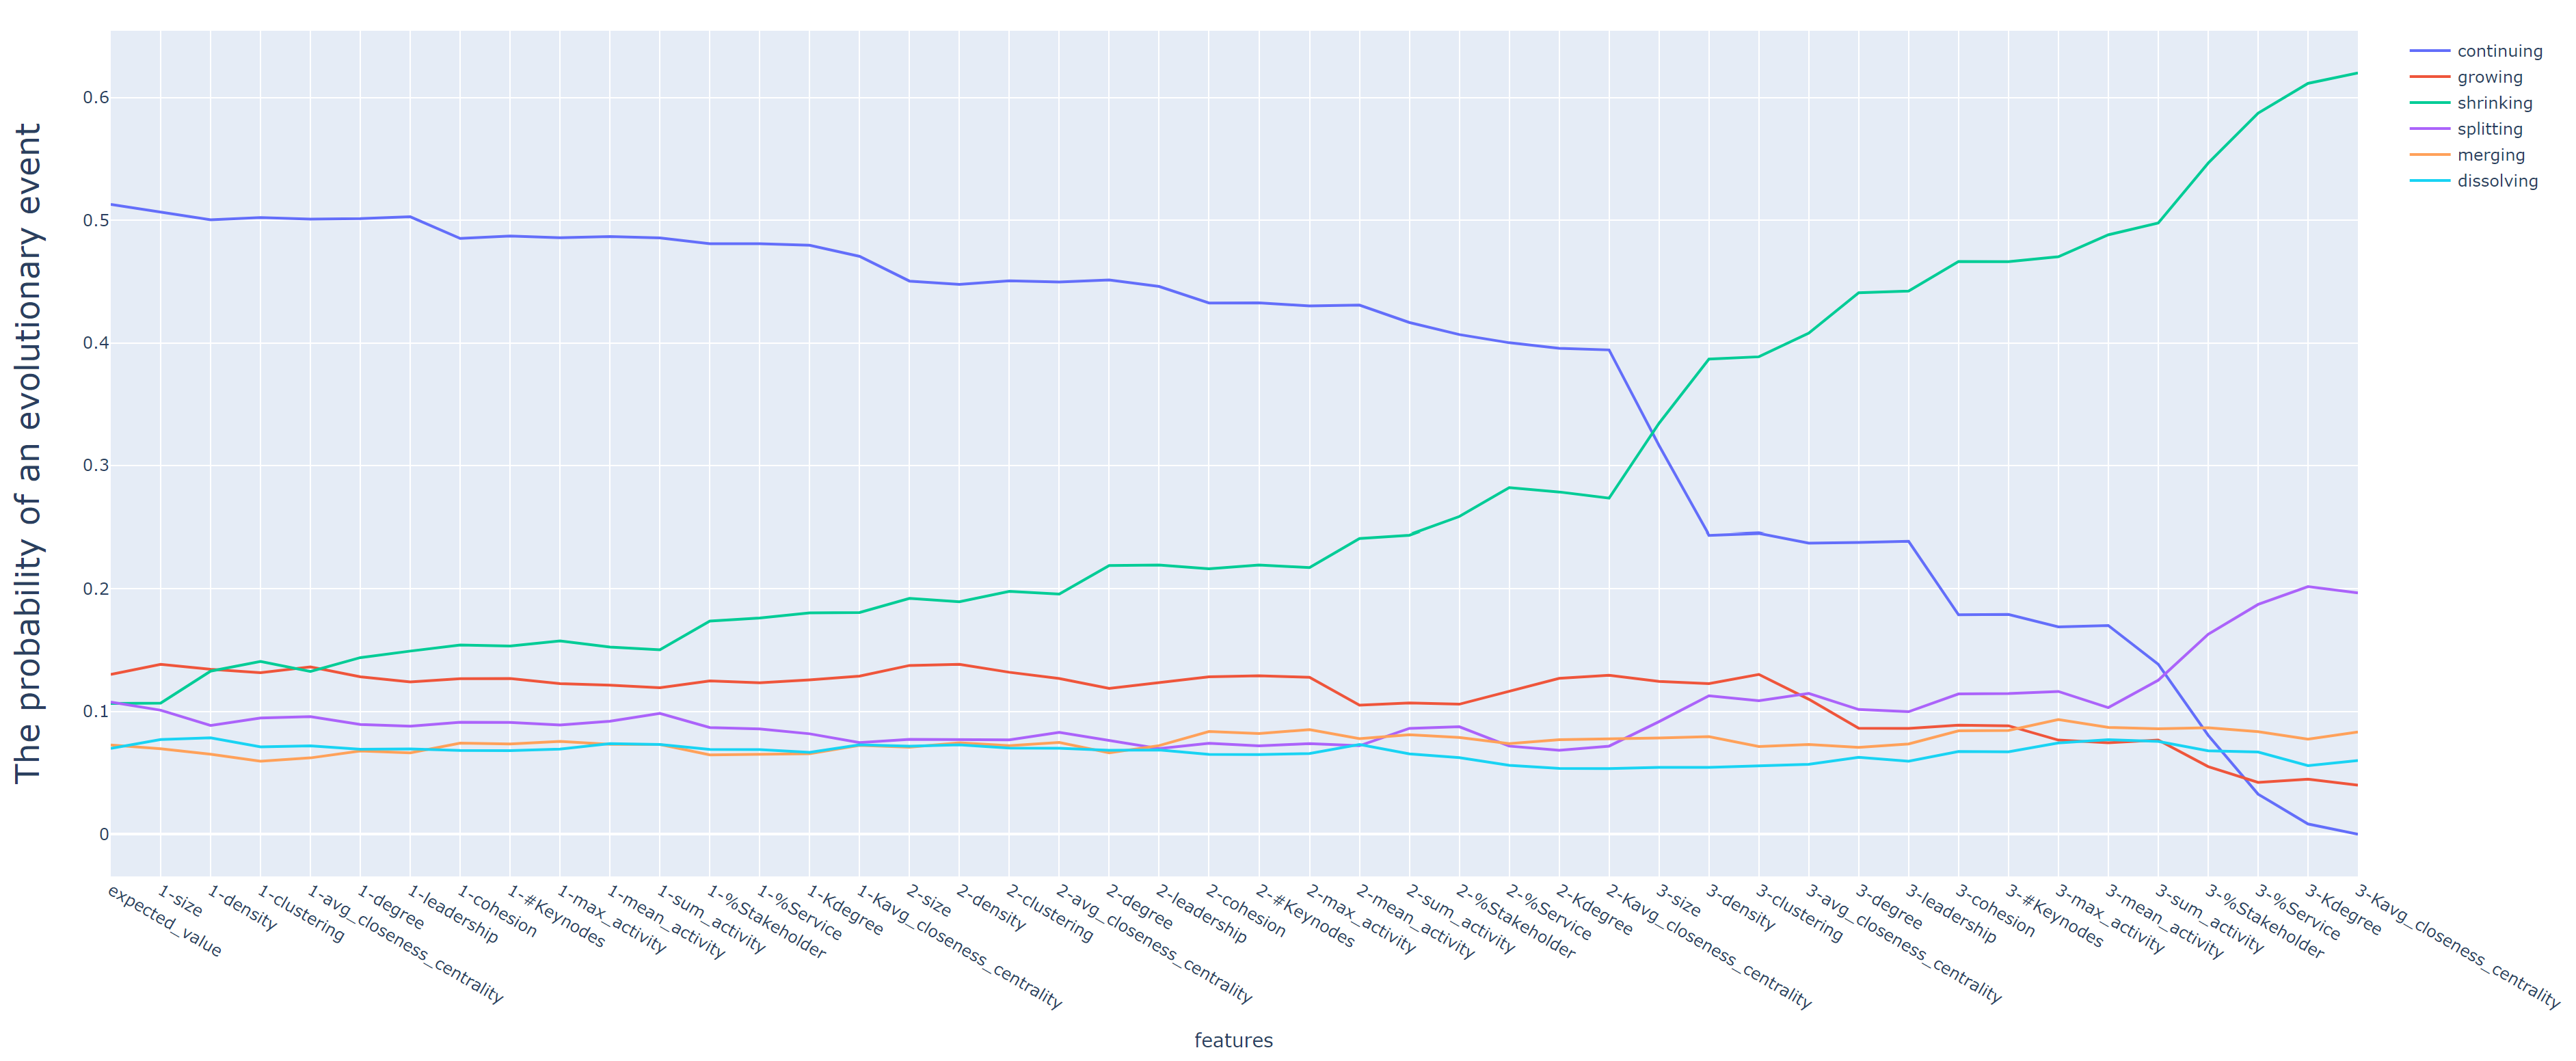
The figure also shows that the low service community and the imbalance of the proportion of stakeholders and services in the service community are the main reasons for the shrinking and splitting of ofo-centered service community. Therefore, for stakeholders who are already in the ofo-centered service community and want to maintain the stability of the service community, strengthening the cooperation among stakeholders within the community and developing more service functions might be a feasible method. Additionally, the curve of also confirms the pattern summarized in Section 4.4 that is sensitive to the immediate history of the service community.
5 Conclusion
In this paper, we explore the evolution law of service ecosystem by predicting and explaining the evolution of service community. We achieve this by propose a service community evolution analysis and prediction framework. This framework includes service ecosystem snapshot generation, service community detection, service community evolution tracking, service community feature representation, and service community evolution prediction and interpretation.
We did a case study on the bike-sharing service ecosystem, the result shows that some unique insights on the evolution of service ecosystem can be obtained for the perspective of service community, and the explainable prediction of service community evolution can assist in business decision making.
We are proud that the all the data and tools used in the experiments, have been fully open-sourced. We do hope researchers in this domain use them for more deep research.
6 Acknowledgment
Research in this paper is partially supported by the National Key Research and Development Program of China (No 2018YFB1402500), the National Science Foundation of China (61832004, 61772155, 61802089, 61832014).
References
- [1] Adeleye, O., Yu, J., Yongchareon, S., Han, Y.: Constructing and Evaluating an Evolving Web-API Network for Service Discovery. Service-Oriented Computing, 16th International Conference pp. 603–617 (2018)
- [2] Blondel, V.D., Guillaume, J.L., Lambiotte, R., Lefebvre, E.: Fast unfolding of communities in large networks. Journal of statistical mechanics: theory and experiment 2008(10), P10008 (2008)
- [3] Bródka, P., Saganowski, S., Kazienko, P.: GED: the method for group evolution discovery in social networks. Social Network Analysis and Mining 3(1), 1–14 (2012)
- [4] Dakiche, N., Tayeb, F.B., Slimani, Y., Benatchba, K.: Sensitive analysis of timeframe type and size impact on community evolution prediction. In: 2018 IEEE International Conference on Fuzzy Systems (FUZZ-IEEE). pp. 1–8 (2018)
- [5] Dakiche, N., Tayeb, F.B.S., Slimani, Y., Benatchba, K.: Community evolution prediction in dynamic social networks using community features’ change rates. In: Proceedings of the 34th ACM/SIGAPP Symposium on Applied Computing. p. 2078–2085. SAC ’19, Association for Computing Machinery, New York, NY, USA (2019)
- [6] Fokaefs, M., Stroulia, E.: Wsdarwin: Studying the evolution of web service systems. In: Advanced Web Services, pp. 199–223. Springer (2014)
- [7] Huang, K., Fan, Y., Tan, W.: Recommendation in an Evolving Service Ecosystem Based on Network Prediction. IEEE Transactions on Automation Science and Engineering 11(3), 906–920 (2014)
- [8] Huang, K., Liu, Y., Nepal, S., Fan, Y., Chen, S., Tan, W.: A Novel Equitable Trustworthy Mechanism for Service Recommendation in the Evolving Service Ecosystem pp. 510–517 (2014)
- [9] Khan, B.S., Niazi, M.A.: Network community detection: A review and visual survey. arXiv preprint arXiv:1708.00977 (2017)
- [10] Liu, M., Tu, Z., Xu, X., Wang, Z.: A data-driven approach for constructing multilayer network-based service ecosystem models (2020)
- [11] Lundberg, S.M., Lee, S.I.: A unified approach to interpreting model predictions. In: Guyon, I., Luxburg, U.V., Bengio, S., Wallach, H., Fergus, R., Vishwanathan, S., Garnett, R. (eds.) Advances in Neural Information Processing Systems 30, pp. 4765–4774. Curran Associates, Inc. (2017)
- [12] Palla, G., Barabási, A.L., Vicsek, T.: Quantifying social group evolution. Nature 446(7136), 664–667 (2007)
- [13] Saganowski, S., Gliwa, B., Bródka, P., Zygmunt, A., Kazienko, P., Koźlak, J.: Predicting community evolution in social networks. Entropy 17(5), 3053–3096 (2015)
- [14] Sampaio, A.R., Kadiyala, H., Hu, B., Steinbacher, J., Erwin, T., Rosa, N., Beschastnikh, I., Rubin, J.: Supporting microservice evolution. In: 2017 IEEE International Conference on Software Maintenance and Evolution (ICSME). pp. 539–543 (Sep 2017)
- [15] Wan, Y., Chen, L., Yu, Q., Liang, T., Wu, J.: Incorporating heterogeneous information for mashup discovery with consistent regularization. In: Pacific-Asia Conference on Knowledge Discovery and Data Mining. pp. 436–448. Springer (2016)
- [16] Xu, X., Sheng, Q.Z., Zhang, L.J., Fan, Y., Dustdar, S.: From big data to big service. Computer (7), 80–83 (2015)
- [17] Zhong, Y., Fan, Y., Huang, K., Tan, W., Zhang, J.: Time-Aware Service Recommendation for Mashup Creation in an Evolving Service Ecosystem. 2014 IEEE International Conference on Web Services pp. 25–32 (2014)