Hydrodynamical Backflow in X-shaped Radio Galaxy PKS 2014-55
Abstract
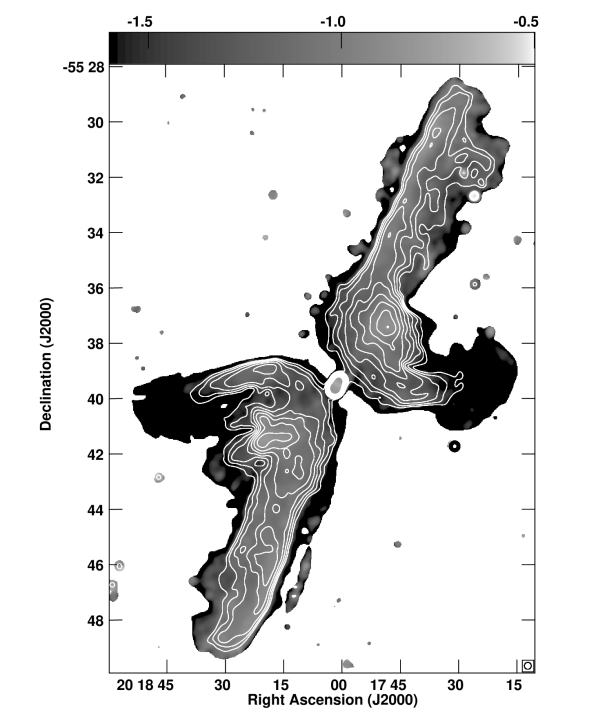
We present MeerKAT 1.28 GHz total-intensity, polarization, and spectral-index images covering the giant (projected length Mpc) X-shaped radio source PKS 201455 with an unprecedented combination of brightness sensitivity and angular resolution. They show the clear “double boomerang” morphology of hydrodynamical backflows from the straight main jets deflected by the large and oblique hot-gas halo of the host galaxy PGC 064440. The magnetic field orientation in PKS 201455 follows the flow lines from the jets through the secondary wings. The radio source is embedded in faint () cocoons having the uniform brightness temperature and sharp outer edges characteristic of subsonic expansion into the ambient intra-group medium. The position angle of the much smaller ( kpc) restarted central source is within of the main jets, ruling out models that invoke jet re-orientation or two independent jets. Compression and turbulence in the backflows probably produce the irregular and low polarization bright region behind the apex of each boomerang as well as several features in the flow with bright heads and dark tails.
keywords:
galaxies: active – galaxies: jets – hydrodynamics – ISM: individual objects: PGC 064440 – radio continuum: galaxies – radio lines: galaxies1 Introduction
Most luminous and extended radio sources have a pair of collinear jets thought to be aligned with the spin axis of the supermassive black hole (SMBH) in the nucleus of the host galaxy (Blandford & Znajek, 1977). However, –% are X-shaped radio galaxies (XRGs) defined by having a second set of jets or “wings” misaligned with the first (Leahy & Williams, 1984; Joshi et al., 2019). The three main models for XRGs invoke (1) a sudden or continuous reorientation of the nuclear SMBH spin axis (e.g., Ekers et al., 1978; Klein et al., 1995; Dennett-Thorpe et al., 2002), (2) the superposition of two independent linear jets produced by two SMBHs residing in the same host galaxy (Lal & Rao, 2005), or (3) hydrodynamical backflows from the over-pressured main jets deflected by the ellipsoidal hot interstellar medium (ISM) of the host galaxy (e.g., Leahy & Williams, 1984; Worrall et al., 1995; Capetti et al., 2002; Saripalli et al., 2008).
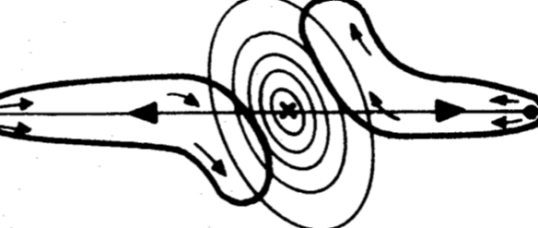
Fig. 1 is a reproduction of the prescient fig. 6a in Leahy & Williams (1984) illustrating the hydrodynamical backflow model. The nuclear SMBH () emits two collinear radio jets (large horizontal arrows) ending in hotspots (black dots). Hydrodynamical backflows from the ends of the jets (small horizontal arrows) initially preserve the axial symmetry of the jets. The axial symmetry is broken by the oblique hot ISM of the host galaxy (thin elliptical contours) deflecting the backflows in opposite directions (bent arrows) and producing a radio source (heavy bent contours) with only inversion symmetry about the nucleus. Although the radio source may resemble a true XRG in low-resolution images, its actual shape is more like a double boomerang.
In this paper we present and analyse new 1.28 GHz images of the giant XRG PKS 201455 (Saripalli et al., 2008; Saripalli & Subrahmanyan, 2009) based on data from the recently completed 64-element MeerKAT array of the South African Radio Astronomy Observatory (SARAO) in the Northern Cape of South Africa. We show that the morphology, spectrum and magnetic field structure of this source are very consistent with the hydrodynamical model and are inconsistent with other proposed models for X shaped sources. The central component of PKS 201455 = PKS 2014558 = PKS J2018556 (Wright & Otrupcek, 1990) is identified by position coincidence with the Seyfert II elliptical galaxy PGC 064440 (Paturel et al., 1989). PGC 064440 has heliocentric redshift and velocity (Jones et al., 2009); corrected to the cosmic microwave background (CMB) frame (Fixsen et al., 1996) and . All absolute quantities in this paper were calculated for a CDM universe with and using equations in Condon & Matthews (2018). Thus PGC 064440 is at comoving distance Mpc, (bolometric) luminosity distance Mpc, and angular diameter distance Mpc so .
The radio observations and data reduction are described in Section 2, and the resulting images are presented in Section 3. Section 4 discusses the morphology of the radio source and its host galaxy. The data are interpreted with the asymmetric hydrodynamical model in Section 5. Our results are summarized in Section 6.
2 Observations and Data Reduction
The XRG PKS 201455 and its unpolarized gain/bandpass/flux-density calibrator PKS B1934638 were observed by MeerKAT for 9.7 h on 2019 October 11 using 55 of the 64 13.5 m diameter antennas in the array. One 10 min scan on the polarization calibrator 3C 138 was also included. Additional information about MeerKAT and its specifications can be found in Jonas et al. (2016), Camilo et al. (2018), and Mauch et al. (2020). The maximum baseline length used was nearly 8 km, giving FWHM resolution at GHz. All four correlations XX, YY, XY, and YX of the orthogonal linearly polarized feeds were divided into 4096 spectral channels of width 0.208984 MHz. The 856 MHz total bandpass centred on 1.284 GHz includes the 1.420 GHz H i line near the host galaxy PGC 064440 redshifted to 1.34 GHz, where the channel width is . The averaging time was 8 s.
2.1 Continuum Flagging and Calibration
The data were converted from the archive format to AIPS format using MeerKAT’s KATDAL package111https://libraries.io/github/ska-sa/katdal. The initial radio-frequency interference (RFI) flagging followed that by Mauch et al. (2020). We trimmed 144 channels from each end of the bandpass and merged the 3808 remaining spectral channels into eight spectral windows. Subsequent editing and calibration used the OBIT package (Cotton, 2008)222http://www.cv.nrao.edu/~bcotton/Obit.html. In each calibration step, deviant solutions were detected and flagged along with the corresponding data. The gain/bandpass/flux-density calibrator is essentially unpolarized, so the approximation XX=YY is valid. Standard structural and spectral models for PKS B1934638 and 3C 138 were used as appropriate. Our flux-density scale is based on the Reynolds (1994) polynomial fit for the spectrum of PKS B1934638:
| (1) |
where is the flux density in Jy and is the frequency.
The main flagging and calibration steps were:
-
1.
Fixed flagging: Frequency ranges known to contain strong, persistent RFI were flagged. Projected baselines shorter than the 13.5 m dish diameter were flagged to eliminate shadowing.
-
2.
Hanning smoothing: The spectral channels were Hanning smoothed (channel weights ) to reduce possible Gibbs ringing from strong narrowband RFI. This doubled the effective channel bandwidth.
-
3.
Initial flagging: Running medians in time and frequency were compared with the data to reveal variable and/or narrowband RFI for flagging.
-
4.
Initial X-Y phase calibration: Cross-hand phase corrections were determined from the noise diode calibration signals injected into each data stream at the beginning of the observing session.
-
5.
Delay calibration: Residual group delays were determined from PKS B1934638.
-
6.
Bandpass calibration: Amplitude and phase correction spectra were determined from PKS B1934638.
-
7.
Amplitude and phase calibration: Complex gain solutions for PKS B1934638 were determined and applied to the target field.
-
8.
Flagging of calibrated data: Flagging operations for which calibrated data are needed were done.
-
9.
Repeat: Flags from the steps i–viii were kept and the calibration steps iv–viii were repeated.
-
10.
Polarization calibration: After a further averaging of two spectral channels, instrumental polarization was determined from the unpolarized calibrator PKS B1934638; solutions were obtained in 14.2 MHz blocks. The cross-hand delay and phase were determined from the polarized calibrator 3C 138. All polarization calibration parameters, including feed orientation, were determined jointly in a nonlinear least-squares solution using all calibrators.
Finally, the calibrated data were averaged in time to reduce their volume. The averaging times were subject to the baseline-dependent constraint that averaging reduce the amplitudes by % inside the circle of radius centred on the target, and they never exceeded 30 s.
2.2 Continuum Imaging
The continuum imaging used the Obit task MFImage, which was described in more detail by Cotton et al. (2018). The non-coplanar array in our extended synthesis was corrected by covering the imaged sky with small tangential facets out to radius and placing additional facets on outlying sources stronger than from the 843 MHz SUMSS catalog (Mauch et al., 2003). Variations of sky brightness and antenna gain across our wide bandpass were accommodated by dividing the observed spectrum into 34 frequency bins having % fractional bandwidths. The frequency bins were imaged independently and CLEANed jointly. Three iterations of phase self-calibration were applied. The CLEAN window was mostly generated automatically, but with some manual assistance to cover all of the extended emission. The multi-resolution Stokes I CLEAN used 1,032,004 components, a 3% loop gain, and included 3.394 Jy of total flux density after CLEANing to a depth of . Spectra were least-squares fitted in each pixel using frequency bin weights inversely proportional to the square of the image-plane rms noise.
Stokes Q and U were imaged out to a radius and CLEANed for 50,000 components to a depth of in Stokes Q and in Stokes U. Rotation measures (RMs) and electric-vector polarization angles (EVPAs) corrected to zero wavelength for each pixel were derived by a search in RM space, essentially taking the peak of the rotation measure synthesis function Brentjens, M. A. & de Bruyn, A. G. (2005). The RM that gave the highest polarized intensity in the average RM-corrected value of the was taken as the RM, the peak average as the polarized intensity, and the polarization angle of the RM-corrected average as the EVPA at zero wavelength. The EVPA at zero wavelength is orthogonal to the source magnetic field vector integrated through the source. There is little evidence for effects beyond a simple well-resolved, external Faraday screen. The fractional polarization image was derived by first correcting the frequency averaged polarized intensity for the Ricean bias and divided by the frequency averaged total intensity.
2.3 Continuum Spectral Index
The imaging described in Section 2.2 used tapering in the outer portion of the plane to minimize the variation of resolution with frequency but did not address a similar problem in the inner portion of the plane that distorts the spectral-index image. Further imaging similar to that described in Section 2.2 was done using a Gaussian taper in the inner plane with rms length to reduce the frequency dependence of the short-baseline coverage. In order to better explore the faintest emission, we convolved the images of the individual frequency planes to before making frequency-dependent primary beam corrections and fitting for the spectral index.
2.4 Spectral-line Calibration and Imaging
The 1420 MHz H i line frequency at the redshift of PGC 064440 is 1340 MHz. We reduced a subset of the visibility data including this frequency using the IDIA Pipeline333https://www.idia-pipelines.github.io to produce a spectroscopic data cube containing the H i line around PGC 064440. The IDIA pipeline is based entirely on CASA (McMullin et al., 2007) tasks. The basic workflow follows the calibration process described above. After the continuum subtraction using CASA’s UVCONTSUB task to fit a polynomial to the visibility spectra, we used CASA’s TCLEAN task with the widefield gridder performing 1000 CLEAN iterations per channel. A Briggs weighting with was used to optimise the shape of the dirty beam while minimizing sensitivity loss. We measured the image noise to be . The FWHM resolution in the H i cube is .
3 The Radio Images
3.1 Total Intensity Continuum
UnCLEANed flux from the very extended radio source PKS 201455 and background sources in the primary beam, combined with the lack of projected baselines shorter than the 13.5 m antenna diameter, left a wide but very shallow negative “bowl” in the total-intensity image. We used the AIPS task IMEAN to measure the mode of the intensity distribution of pixels in source-free areas near PKS 201455; it is . To fill in the bowl, we added to the image zero level. We divided this image by the circularised FWHM primary beam attenuation pattern specified by Mauch et al. (2020) equations 3 and 4 to yield the final “sky” image shown in Fig. 2. The actual primary beam is slightly elliptical with axial ratio and rotates with parallactic angle on the sky. However, the maximum attenuation error introduced by our circular approximation is a negligible % even at the ends of PKS 201455, from the pointing centre.
The image was restored with a Gaussian beam, so the brightness temperature corresponding to a spectral intensity is at . The rms noise plus confusion is .
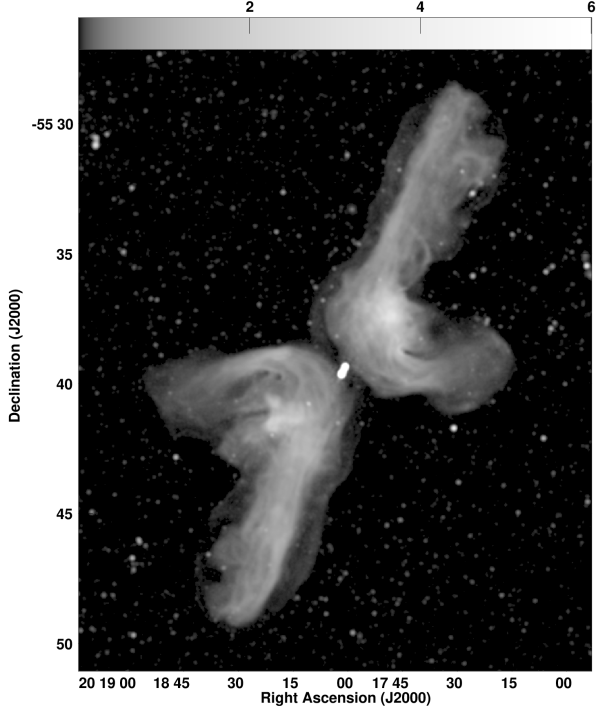
We used the AIPS task TVSTAT to measure the total 1.28 GHz flux density in the region bounded by the faint “cocoon” that makes Fig. 2 resemble the photograph of a jellyfish; it is , with the quoted error being dominated by an estimated 3% uncertainty in the absolute flux-density scale. Inside the region subtended by PKS 201455, the bowl correction contributed only Jy to the total flux density. The smooth bowl correction is only % of the average cocoon brightness, so our detection of the sharp-edge cocoons is quite reliable. Most published flux densities (e.g. Wright & Otrupcek, 1990; Hindson et al., 2014) at nearby frequencies appear to be about 25% lower than ours, perhaps because they didn’t capture the full extent of this very large source. The Murchison Widefield Array (MWA) flux densities (Hindson et al., 2014) , , , and Jy at 120, 149, 180, and 226 MHz, respectively, are consistent with PKS 201455 having an overall spectral index in the range .
The central region in our 1.28 GHz total-intensity image of PKS 201455 (Fig. 3) is well fit by the sum of three Gaussian components: two with completely free size and position parameters plus a (forced) point source with free position and flux density representing a possible radio core between them. The results are listed in Table 1. Although it is not clearly visible in Fig. 3, the mJy core component is required for the best fit and its fitted position is from the nucleus of the host galaxy PGC 064440. The line connecting the two outer components has position angle measured from north to east.

| J2000 | ||||
|---|---|---|---|---|
| (mJy) | () | (deg) | ||
| 88 | 159 | |||
| 32 | … | |||
| 211 | 154 | |||
Saripalli et al. (2008) imaged the central region of PKS 201455 with sub-arcsec resolution and found five nearly collinear radio components: a central core, an inner double source, and an outer double source. The position angles of their inner and outer doubles are and , respectively. Thus each long, narrow Gaussian component in Table 1 is a blend of two relatively compact sources. The Saripalli et al. (2008) radio core has a fairly flat () spectrum above , so it is probably synchrotron self-absorbed and completely unresolved.
3.2 Polarization
The rotation measure in front of PKS 201455 is shown in Figure 4. It is and varies by only a few rad m-2 across the source, so it may originate primarily in our Galaxy.
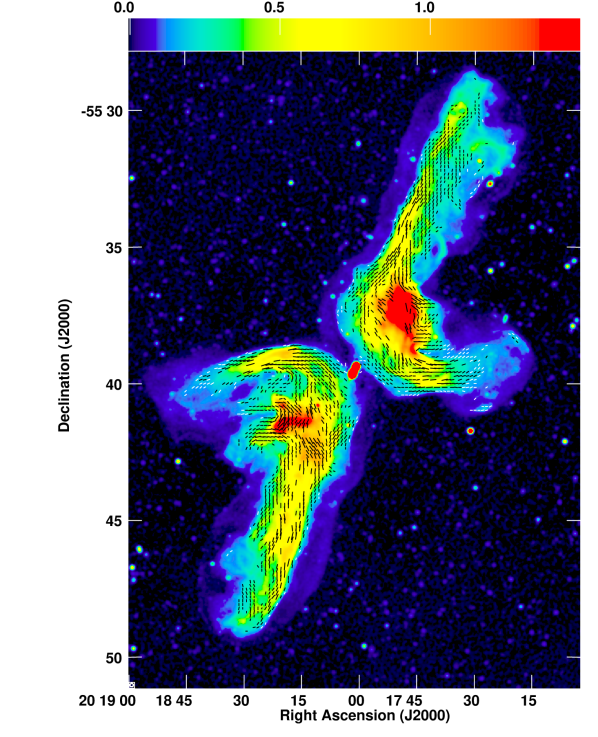
Polarization “B” vectors at zero wavelength parallel to the magnetic field orientation in the emitting region are plotted as short line segments in Fig. 5. The lengths of the vectors are proportional to the fractional polarization. The magnetic vectors are nearly parallel to the main jets, as in most FR II (Fanaroff & Riley, 1974) sources (Bridle et al., 1994). In contrast, the magnetic vectors are usually perpendicular to the jets in FR I sources (Bridle & Perley, 1984). Fig. 5 shows that the magnetic field closely follows the apparent flow around the bends in PKS 201455.
The fractional polarization is high (30–50%) over most of the main lobes indicating very organized magnetic fields. In the secondary lobes, the fractional polarization approaches 80% indicating very little scatter in the magnetic field orientations. On the other hand, the brighter Stokes I regions at the apexes of the “boomerangs” typically have around 15% fractional polarization indicating a more tangled magnetic field structure.
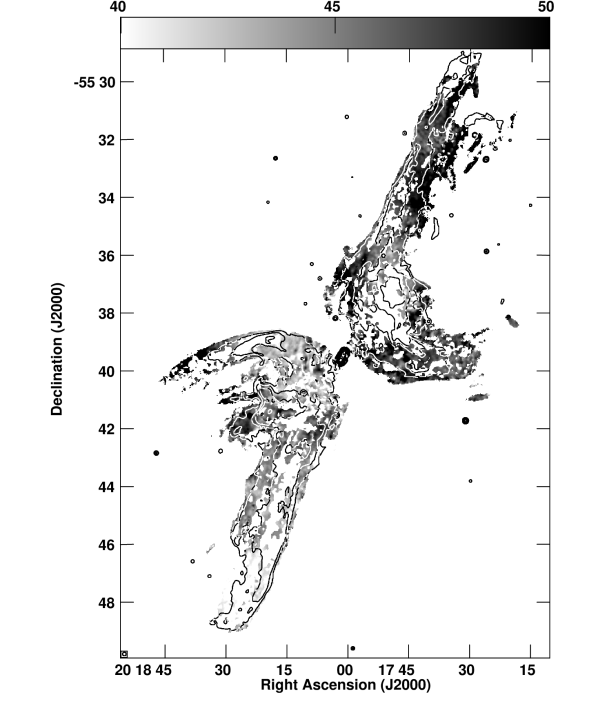
3.3 Continuum Spectral Index
The spectral-index image is given in Figure 6. The spectrum in the lobes is steep everywhere, flattening somewhat near the bright regions inside the apexes of the “boomerangs” and becoming very steep in the cocoons and near the ends of the secondary lobes. We hesitate to provide quantitative estimates of the spectral-index errors because they are largely systematic, caused by limited sampling near the centre of the plane. Further analysis of the spectral index is being developed for a subsequent paper.
4 The Radio Source PKS 201455 and its Host Galaxy PGC 064440
4.1 The Radio Source PKS 201455
The radio source with spectral index has spectral luminosity at GHz in the source frame. Such luminous sources (Ledlow & Owen, 1996) usually have FR II morphologies (Fanaroff & Riley, 1974) characterised by narrow jets leading to hotspots in edge-brightened lobes. PKS 201455 does not (Fig. 2); its long, filamentary, and diffuse main “jets” are only decaying relics of activity that ceased millions of years ago. Saripalli & Subrahmanyan (2009) found several examples of XRGs lacking hotspots at the ends of their relic jets and noted that the current lack of hotspots cannot be used to rule out backflows from earlier jets that have since decayed.
The current spectral brightnesses of the relic jets are only , so their minimum-energy magnetic field strengths (e.g., Pacholczyk, 1970; Worrall & Birkinshaw, 2006) are low. For electrons emitting at their critical frequencies from to , proton/electron energy ratio , and source line-of-sight depth ,
| (2) |
in convenient astronomical units. Even for a line-of-sight depth and a high proton/electron energy ratio , the magnetic field strength is only and the corresponding synchrotron lifetime (Pacholczyk, 1970) is very long. The energy density of the CMB at is the same as that of a magnetic field, so inverse–Compton (IC) scattering off the CMB reduces the radiative lifetimes in the relic jets to . The spectral steepening at the ends of the wings visible in Figure 6 indicate ages yr. This result is typical of giant radio galaxies (Ishwara-Chandra & Saikia, 1999). The minimum relativistic pressure
| (3) |
in most of PKS 201455 is .
At Mpc, and the largest angular extent of PKS 201455 implies a projected overall length Mpc. This is more than twice the traditional minimum size defining a giant radio source, Mpc for (Willis et al., 1974), or Mpc for . Even the backflow wings of PKS 201455 easily satisfy this criterion: their total projected extent is or Mpc. The two long arms have nearly equal projected lengths ( and for the NW and SE arms, respectively) and flux densities (1.033 and 1.025 Jy), so they show no evidence for relativistic time delays or flux boosting.
PKS 201455 extends far beyond the virial radius of its host galaxy and directly probes the ambient intergalactic medium (IGM). PGC 064440 is not in a cluster environment rich enough to have a significant intracluster medium. Malarecki et al. (2015) made a spectroscopic study of the Mpc-scale environments for a sample of low-redshift giant radio galaxies including PKS 201455. The number density of galaxies more luminous than mag in a cylinder of 1 Mpc radius and 24 Mpc length along the line-of-sight centred on PKS 201455 is only , a typical density in galaxy groups and poor clusters, but a factor of 10 lower than in galaxy clusters.
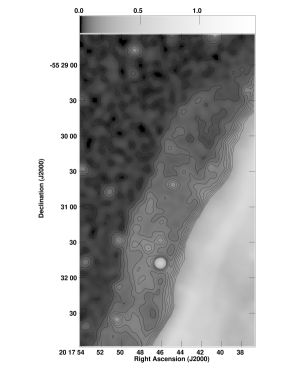
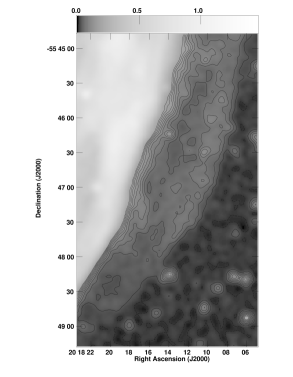
The faint radio cocoons in Fig. 7 are defined by their fairly constant brightness temperatures K between sharp inner and outer boundaries. Figure 6 shows that they have the steep spectra produced by radiative losses, so, like the relic jets, they too may be relics of even earlier activity. Inserting K, GHz, and line-of-sight depth kpc into Equation 2 yields in the cocoon of PKS 201455. The corresponding magnetic energy density is and the minimum relativistic pressure in the cocoons is . These low-pressure cocoons are exceptionally sensitive barometers for measuring the pressure of the intra-group medium (IGrM) or the IGM (Malarecki et al., 2013).
If the pressure in the external medium is less than the cocoon pressure , the cocoon should expand laterally with speed at which the ram pressure balances the cocoon overpressure:
| (4) |
where is the external mass density. The IGM may contain half of all baryons and , so a lower limit to the external mass density at redshift is the mean baryonic IGM density
| (5) |
For a primordial abundance of fully ionized H and He, the mean mass per particle is and the particle density is . PGC 064440 is in a poor group of galaxies, where the IGrM particle density is as high and the temperature range is (Stocke et al., 2019), so the external particle pressure . Even if , the minimum cocoon pressure is comparable with the external pressure. Higher or non-equipartition magnetic fields would only increase the cocoon pressure.
In the limit , inserting into Equation 4 predicts that the cocoon boundary should be expanding into the surrounding medium with speeds between (IGrM) and (IGM). These expansion speeds are subsonic in the radio cocoons, allowing the cocoons enough time to reach pressure equilibrium (Begelman et al., 1984) and attain their constant brightness temperatures. The PKS 201455 cocoons are kpc wide, so the expansion time scales of the cocoons are .
The energy density of the CMB surrounding PKS 201455 at is . It is larger than the magnetic energy density in the cocoon even in the unlikely event (Beck & Krause, 2005) that . The ratio of IC losses to synchrotron losses is , so the radiative lifetimes of relativistic electrons in the cocoons are strongly limited by IC scattering off the CMB, not by synchrotron radiation.
4.2 The Host Galaxy PGC 064440
The total stellar mass of PGC 064440 can be estimated photometrically from its m absolute magnitude using the empirical relation (Cappellari, 2013)
| (6) |
The 2MASX apparent magnitude of PGC 064440 is , the distance modulus is 32.16, and the correction is mag (Kochanek et al., 2001), so and the total mass of stars inside the photometric radius is .
The mid-infrared source WISEA J201801.29553931.5 (Wright et al., 2010) coincides with PGC 064440. Its mid-infrared colours and are typical of Seyfert galaxies and far from the colors of elliptical galaxies whose mid-infrared emission is dominated by stellar photospheres (Jarrett et al., 2011). This mid-infrared evidence for circumnuclear dust heated by an active galactic nucleus (AGN) is supported by the presence of a heavily obscured (column density ) hard X-ray source at the centre of PKS 201455 (Panessa et al., 2016) and the absence of broad optical emission lines. Star formation may also contribute to the mid-infrared emission from PGC 064440.
PGC 064440 is a Seyfert II galaxy with very strong high-ionization ([O iii]/H) emission lines (Simpson et al., 1996). Many powerful radio galaxies have extended emission-line regions (EELRs) with radii . Tadhunter et al. (1989) observed the [O iii] line of PGC 064440 with a long slit in nearly parallel to the continuum major axis and found emission extending on both sides of the nucleus with the linear velocity field of a constant-density enclosed mass and maximum rotation velocity relative to the nucleus, indicating a total mass within of the nucleus.
5 The Hydrodynamical Backflow Model
The extended radio jets of most high-luminosity sources are linear and inversion symmetric about their host galaxies. Leahy & Williams (1984) noted that opposing axisymmetric backflows could form a fat disc expanding laterally where they encountered the hot ISM of their host galaxy, but a misaligned ellipsoidal hot gas halo could break the axial symmetry and bend the backflows in opposite directions away from the ellipsoid major axis to produce the secondary arms or “wings” of XRGs (Fig. 1). Saripalli & Subrahmanyan (2009) found that XRGs lacking FR II hotspots often contain inner doubles, indicating restarted jets along the same axis, and they proposed that the wings are asymmetric backflows.
Backflows from extended radio jets can be treated as fluid flows because their magnetic fields are strong enough that even ultrarelativistic protons and electrons have Larmor radii much smaller than the jet radius. Magnetic lines of force are frozen into the jet fluid, so velocity shear across the jet tends to align the magnetic field along the jet, and jet growth can increase the frozen-in magnetic field strength to near equipartition. Many astrophysical jets are stable enough to survive bending, as demonstrated by the bent tails of radio galaxies moving through dense gas in massive galaxy clusters.
5.1 Backflow Geometry
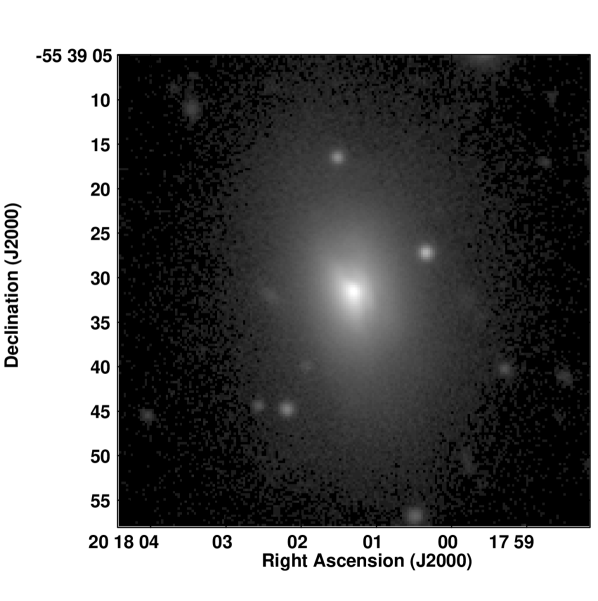
A faint dust lane extending () is just visible in the DES DR1 (Abbott et al., 2018) -band image of PGC 064440 (Fig. 8). Fig. 9 is the corresponding -band brightness contour plot. The narrow inner ellipse represents the tilted circular ring that overlaps the dust lane, of which only the near half is visible in absorption. The two larger ellipses are fits to the first and third brightness contours in Fig. 9. The parameters of these ellipses and the 2MASS “total” isophotal ellipse are listed in Table 2. The isophotal ellipticities are in the range . They indicate that PGC 064440 is an oblate ellipsoid whose equatorial position angle is and whose projected polar axis is at . If the dust lane is an equatorial ring, the polar axis is inclined from the plane of the sky, with the side closer to us and the side farther away. Even if PGC 064440 were a thin disc, the isophotal ellipticities independently imply that its polar axis must be from the plane of the sky.

| Ellipse | () | (deg) | (deg) |
|---|---|---|---|
| Dust ring | 82 | ||
| First contour | 50 | ||
| Third contour | 46 | ||
| total | 44 |
Fig. 10 represents the hypothetical hot halo of PGC 064440 with an ellipse superimposed on a grey-scale image of PKS 201455. The ellipse has the same central position, ellipticity , and major-axis position angle as the starlight of PGC 064440 traced by its outer isophote (Table 2). The shape and orientation are justified by Chandra X-ray Observatory images (Hodges-Kluck et al., 2010) of hot () halo gas surrounding the host galaxies of XRGs which show that the ellipticities and position angles of the hot gas follow those of the stellar light distributions.
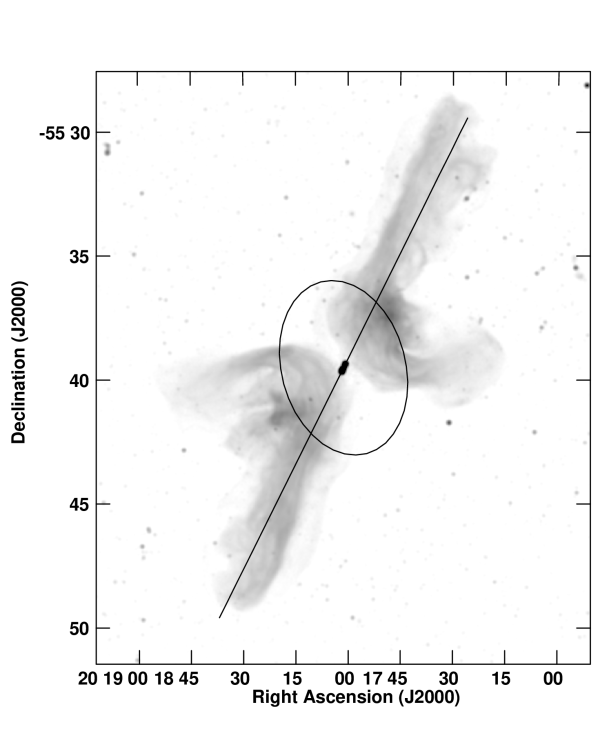
The 1.57 Mpc long straight line in Fig. 10 is centred on PGC 064440 and has the same position angle as the inner triple source. The fact that it closely overlaps the long arms of PKS 201455 proves that the radio jet orientation today is within of its orientation when the jets were launched tens of millions of years ago and when the faint cocoons were formed even earlier. This is expected if the radio “wings” in are produced by hydrodynamical backflows from stable jets but improbable for models in which the wings are produced by changing the jet orientation.
The hydrodynamical model predicts that the ends of the wings should contain the “oldest” synchrotron electrons. Their very steep continuum spectra (Figure 6) are consistent with synchrotron and inverse-Compton energy losses. The cocoons are probably even older.
The biggest challenge to the hydrodynamical backflow model presented by PKS 201455 is the need to deflect both of its very wide (observed width , which we treat as a cylinder of radius ) backflows cleanly in opposite directions without splitting them. This requires that the hot ISM have both a high ellipticity and a large semimajor axis . Capetti et al. (2002) found that XRG host galaxies in a small sample all have , a criterion easily satisfied by PGC 064440, while only three in their reference sample of 15 3C FR II galaxies have , the ellipticity of PGC 064440.
When they encounter the hot halo ISM of the host galaxy, backflows initially parallel to the main jets are deflected toward the most negative pressure gradient. The ellipse in Fig. 10 represents an isobaric contour, so backflows bend away from the directions in which the angle between the backflow and the constant-pressure contour of the ellipse is . For any , backflow radius , and ellipticity , this implies a minimum galaxy semimajor axis is needed to deflect the entire backflow to one side. In the case of PGC 064440, and , so and . Then Equation 13 yields the minimum semimajor axis that can cleanly deflect the backflow
| (7) |
the size of the ellipse drawn in Fig. 10. This ellipse is just the projection of the galaxy onto the sky, which is an ellipsoid of revolution. However, the dust lane indicates that the polar axis of PGC 064440 lies only from the plane of the sky, so the observed ellipse is a good representation of the ellipsoid.
PGC 064440 includes a stellar mass (Section 4.2), so the galaxy stellar-to-halo mass relation (SHMR) predicts that its halo virial mass should be (Wechsler & Tinker, 2018). Such massive galaxies are typically assembled at redshift and have virial radii (Shull, 2014)
| (8) |
Thus PGC 064440 has kpc, and its halo is (just) big enough to completely deflect the wide backflows of PKS 201455.
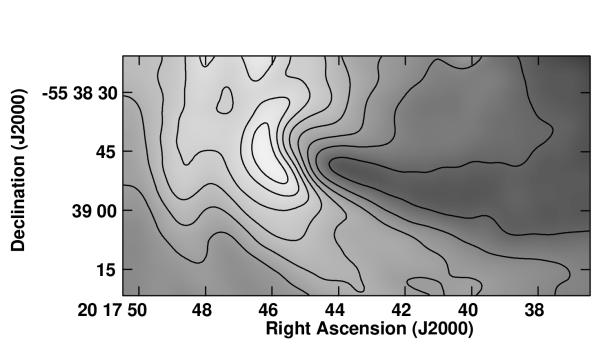
5.2 Head-tail brightness features in the backflows
Radio continuum features with bright bent “heads” and long dark “tails” pointing downstream in the backflows (Fig. 2) of both secondary lobes at first suggest obstacles blocking the backflows. The clearest example is in the western backflow (Fig. 11), and there are three weaker examples in the eastern backflow near J2000 , , , , and , . The apparent width of the dark tails is slightly larger than the resolution of the radio image. The corresponding linear diameter 10 kpc is comparable with the size of cold H i discs in spiral galaxies. However, we detected no H i line emission and found no visible galaxies on the DES images downstream of the heads. Furthermore, 10 kpc is much smaller than the kpc diameter of the backflows. The line-of-sight depth of the backflows from such wide axially symmetric jets should be kpc, so a 10 kpc obstacle could not reduce the backflow brightness by the observed amount shown in Fig. 11, which is more than a factor of two.
The dark tail in Fig. 11 cannot be attributed to free-free absorption in an intervening ionized cloud with kinetic temperature K because an absorber with optical depth emits with brightness temperature , and the 1.28 GHz brightness temperature of the tail implies .
Fig. 10 shows that the dark tails appear in the downstream sides of both backflows near the deflecting halo boundary indicated by the ellipse. It also shows two matching bright regions, one just inside the apex of each “boomerang”. These bright regions are probably not traditional FR II hotspots because they are not in the radio jets and they do not have the usual edge-brightened morphology. We suggest that the bright regions indicate compression and turbulence where backflow material is piling up inside the apex. Turbulence on scales smaller than our beam could explain the low observed polarized intensity in the brighter northwestern region (Fig. 5). We suspect that the matched sets of dark tails are simply hydrodynamical features downstream of the bright regions, and don’t actually indicate the presence of external obstructions.
6 Summary
The hydrodynamical backflow model for PKS 201455 is supported by the following evidence:
-
1.
The observed “double boomerang” radio morphology is expected for backflows from a pair of collinear jets redirected by the oblique hot ISM of the host galaxy. Both the magnetic fields and the total-intensity ridges follow the continuously bending flow lines. Two matching bright regions inside the boomerang apexes suggest compression and turbulence where backflow material is piling up. Bright heads and dark tails appear between both bright regions and their backflow wings. They appear to be features in the flow, not signs of obstruction by the ISM of nearby galaxies.
- 2.
-
3.
The virial halo of the host galaxy PGC 064440 is large enough and has the correct position angle to cleanly deflect backflows from the wide main jets in the direction observed.
The unique combination of high surface-brightness sensitivity (), high angular resolution (), and dense -plane coverage of our new MeerKAT continuum image makes the very extended radio source PKS 201455 the best example of an XRG produced by hydrodynamical backflows from a jet with fixed orientation. The prototypical XRG NGC 326 has been cited as evidence for jet reorientation following an SMBH-SMBH merger (Merritt & Ekers, 2002). However, Hardcastle et al. (2019) reobserved the dumbbell galaxy NGC 326 with the Low-Frequency Array (LOFAR) at 144 MHz and found faint, extended radio morphological evidence for hydrodynamical effects related to an ongoing group or cluster merger. Although their result does not rule out the spin-flip model for NGC 326, we endorse their caution not to infer jet reorientation in XRGs lacking deep and detailed radio images.
The new MeerKAT continuum image also revealed faint () low-pressure () cocoons with sharp edges and the nearly constant brightness characteristic of subsonic (in the cocoons) expansion into the surrounding intra-group medium probed by the giant source PKS 201455. This pressure assumes . The pressure in the cocoons could range from if to if .
Acknowledgements
The MeerKAT telescope is operated by the South African Radio Astronomy Observatory which is a facility of the National Research Foundation, an agency of the Department of Science and Innovation. The National Radio Astronomy Observatory is a facility of the National Science Foundation, operated under a cooperative agreement by Associated Universities, Inc. This research has made use of the NASA/IPAC Extragalactic Database (NED), which is funded by the National Aeronautics and Space Administration and operated by the California Institute of Technology. This research uses services or data provided by the NOAO Data Lab. NOAO is operated by the Association of Universities for Research in Astronomy (AURA), Inc. under a cooperative agreement with the National Science Foundation. K. Thorat acknowledges support from the Inter-University Institute for Data Intensive Astronomy (IDIA). The financial assistance of the South African Radio Astronomy Observatory (SARAO) towards this research is hereby acknowledged (www.ska.ac.za).
We thank the anonymous referee for numerous valuable suggestions to improve our manuscript.
References
- Abbott et al. (2018) Abbott T. M. C., et al., 2018, ApJS, 239, 18
- Beck & Krause (2005) Beck R., Krause M., 2005, Astronomische Nachrichten, 326, 414
- Begelman et al. (1984) Begelman M. C., Blandford R. D., Rees M. J., 1984, Reviews of Modern Physics, 56, 255
- Blandford & Znajek (1977) Blandford R. D., Znajek R. L., 1977, MNRAS, 179, 433
- Brentjens, M. A. & de Bruyn, A. G. (2005) Brentjens, M. A. de Bruyn, A. G. 2005, A&A, 441, 1217
- Bridle & Perley (1984) Bridle A. H., Perley R. A., 1984, ARA&A, 22, 319
- Bridle et al. (1994) Bridle A. H., Hough D. H., Lonsdale C. J., Burns J. O., Laing R. A., 1994, AJ, 108, 766
- Camilo et al. (2018) Camilo F., et al., 2018, ApJ, 856, 180
- Capetti et al. (2002) Capetti A., Zamfir S., Rossi P., Bodo G., Zanni C., Massaglia S., 2002, A&A, 394, 39
- Cappellari (2013) Cappellari M., 2013, ApJ, 778, L2
- Condon & Matthews (2018) Condon J. J., Matthews A. M., 2018, PASP, 130, 073001
- Cotton (2008) Cotton W. D., 2008, PASP, 120, 439
- Cotton et al. (2018) Cotton W. D., et al., 2018, ApJ, 856, 67
- Dennett-Thorpe et al. (2002) Dennett-Thorpe J., Scheuer P. A. G., Laing R. A., Bridle A. H., Pooley G. G., Reich W., 2002, MNRAS, 330, 609
- Ekers et al. (1978) Ekers R. D., Fanti R., Lari C., Parma P., 1978, Nature, 276, 588
- Fanaroff & Riley (1974) Fanaroff B. L., Riley J. M., 1974, MNRAS, 167, 31P
- Fixsen et al. (1996) Fixsen D. J., Cheng E. S., Gales J. M., Mather J. C., Shafer R. A., Wright E. L., 1996, ApJ, 473, 576
- Hardcastle et al. (2019) Hardcastle M. J., et al., 2019, MNRAS, 488, 3416
- Hindson et al. (2014) Hindson L., et al., 2014, MNRAS, 445, 330
- Hodges-Kluck et al. (2010) Hodges-Kluck E. J., Reynolds C. S., Cheung C. C., Miller M. C., 2010, ApJ, 710, 1205
- Ishwara-Chandra & Saikia (1999) Ishwara-Chandra C. H., Saikia D. J., 1999, MNRAS, 309, 100
- Jarrett et al. (2011) Jarrett T. H., et al., 2011, ApJ, 735, 112
- Jonas et al. (2016) Jonas J., et al., 2016, Proceedings of MeerKAT Science: On the Pathway to the SKA, p. 1
- Jones et al. (2009) Jones D. H., et al., 2009, MNRAS, 399, 683
- Joshi et al. (2019) Joshi R., et al., 2019, The Astrophysical Journal, 887, 266
- Klein et al. (1995) Klein U., Mack K.-H., Gregorini L., Parma P., 1995, A&A, 303, 427
- Kochanek et al. (2001) Kochanek C. S., et al., 2001, ApJ, 560, 566
- Lal & Rao (2005) Lal D. V., Rao A. P., 2005, MNRAS, 356, 232
- Leahy & Williams (1984) Leahy J. P., Williams A. G., 1984, MNRAS, 210, 929
- Ledlow & Owen (1996) Ledlow M. J., Owen F. N., 1996, AJ, 112, 9
- Malarecki et al. (2013) Malarecki J. M., Staveley-Smith L., Saripalli L., Subrahmanyan R., Jones D. H., Duffy A. R., Rioja M., 2013, MNRAS, 432, 200
- Malarecki et al. (2015) Malarecki J. M., Jones D. H., Saripalli L., Staveley-Smith L., Subrahmanyan R., 2015, MNRAS, 449, 955
- Mauch et al. (2003) Mauch T., Murphy T., Buttery H. J., Curran J., Hunstead R. W., Piestrzynski B., Robertson J. G., Sadler E. M., 2003, MNRAS, 342, 1117
- Mauch et al. (2020) Mauch T., et al., 2020, ApJ, 888, 61
- McMullin et al. (2007) McMullin J. P., Waters B., Schiebel D., Young W., Golap K., 2007, 376, 127
- Merritt & Ekers (2002) Merritt D., Ekers R. D., 2002, Science, 297, 1310
- Pacholczyk (1970) Pacholczyk A. G., 1970, Radio astrophysics. Nonthermal processes in galactic and extragalactic sources. San Francisco: W. H. Freeman and Company
- Panessa et al. (2016) Panessa F., et al., 2016, MNRAS, 461, 3153
- Paturel et al. (1989) Paturel G., Fouque P., Bottinelli L., Gouguenheim L., 1989, A&AS, 80, 299
- Reynolds (1994) Reynolds J. E., 1994, ATNF Memo, AT/39.3/040
- Saripalli & Subrahmanyan (2009) Saripalli L., Subrahmanyan R., 2009, ApJ, 695, 156
- Saripalli et al. (2008) Saripalli L., Subrahmanyan R., Laskar T., Koekemoer A., 2008, Proceedings of Science, 052, 130
- Shull (2014) Shull J. M., 2014, ApJ, 784, 142
- Simpson et al. (1996) Simpson C., Ward M., Clements D. L., Rawlings S., 1996, MNRAS, 281, 509
- Skrutskie et al. (2006) Skrutskie M. F., et al., 2006, AJ, 131, 1163
- Stocke et al. (2019) Stocke J. T., Keeney B. A., Danforth C. W., Oppenheimer B. D., Pratt C. T., Berlind A. A., Impey C., Jannuzi B., 2019, ApJS, 240, 15
- Tadhunter et al. (1989) Tadhunter C. N., Fosbury R. A. E., Quinn P. J., 1989, MNRAS, 240, 225
- Wechsler & Tinker (2018) Wechsler R. H., Tinker J. L., 2018, ARA&A, 56, 435
- Willis et al. (1974) Willis A. G., Strom R. G., Wilson A. S., 1974, Nature, 250, 625
- Worrall & Birkinshaw (2006) Worrall D. M., Birkinshaw M., 2006, Multiwavelength Evidence of the Physical Processes in Radio Jets. p. 39, doi:10.1007/3-540-34621-X_2
- Worrall et al. (1995) Worrall D. M., Birkinshaw M., Cameron R. A., 1995, ApJ, 449, 93
- Wright & Otrupcek (1990) Wright A., Otrupcek R., 1990, PKS Catalog (1990),
- Wright et al. (2010) Wright E. L., et al., 2010, AJ, 140, 1868
Appendix A Minimum size of the deflecting halo
In the coordinate system with parallel to the major axis and parallel to the minor axis, the equation of the deflecting ellipse with semimajor axis and ellipticity is
| (9) |
and tangents to the ellipse have slopes
| (10) |
If is the angle between the backflow and the axis, the equation of the outermost backflow of radius is
| (11) |
and the initial slope of the backflow is . At the point where it intersects the ellipse at a angle, the slope of the ellipse is and
| (12) |
The point must also satisfy Equation 9 so
| (13) |