Solar-type Stars Observed by LAMOST and Kepler
Abstract
Obtaining measurements of chromospheric and photometric activity of stars with near-solar fundamental parameters and rotation periods is important for a better understanding of solar-stellar connection. We select a sample of 2603 stars with near-solar fundamental parameters from the the Large Sky Area Multi-Object Fiber Spectroscopic Telescope (LAMOST)-Kepler field and use LAMOST spectra to measure their chromospheric activity and Kepler light curves to measure their photospheric activity (i.e. the amplitude of the photometric variability). While the rotation periods of 1556 of these stars could not be measured due to the low amplitude of the photometric variability and highly irregular temporal profile of light curves, 254 stars were further identified as having near-solar rotation periods. We show that stars with near-solar rotation periods have chromospheric activities systematically higher than stars with undetected rotation periods. Furthermore, while the solar level of photospheric and chromospheric activity appears to be typical for stars with undetected rotation periods, the Sun appears to be less active than most stars with near-solar rotation periods (both in terms of photospheric and chromospheric activity).
1 Introduction
The action of a dynamo generates magnetic field in the stellar interior [Charbonneau, 2010, 2013]. This field emerges in the stellar atmosphere leading to various manifestations of magnetic activity, e.g. brightness and spectroscopic variability, chromospheric and coronal emission. The interest in stellar magnetic activity has been recently brought to a new level by the advent of high-precision transit photometry and subsequent discovery of thousands of exoplanets. This is particularly due to stellar magnetic activity appearing to be a limiting factor in exoplanet detection and characterization, and due to its possible influence on exoplanet atmospheres [see, e.g. Wood, 2004, Vidotto, 2019].
Among the most typical proxies of stellar magnetic activity are chromospheric Ca ii H and K line emission [see, e.g., Noyes et al., 1984, Baliunas et al., 1995, Hall et al., 2007, and references therein] and amplitude of the photometric brightness variations [Basri et al., 2013, Reinhold et al., 2017]. During the past few decades, the long-term synoptic HK projects at Mount Wilson Observatory [MWO; Wilson, 1978] and at the Lowell Observatory [Hall et al., 2007] have been dedicated to measuring the Ca ii H and K emission in late-type stars. Contemporary to monitoring of the stellar Ca ii activity, Lowell and Fairborn Observatories initiated programs for measuring photometric variability of Sun-like stars [Radick et al., 1998, Lockwood et al., 2007, Hall et al., 2009, Radick et al., 2018]. Interestingly, it was found that stars with near-solar level of chromospheric activity appear to be much more photometrically variable than the Sun on the decadal timescale. Several explanations of such a puzzle have been proposed, e.g. Witzke et al. [2018] suggested that the Sun corresponds to a local minimum of the complex dependence of the amplitude of brightness variations on the activity cycle timescale on fundamental stellar parameters and magnetic activity level.
While the MWO, Lowell, and Fairborn observations formed the backbone of stellar activity studies, they were limited to just a few hundreds of stars. The high-precision photometry from space telescopes, particularly from the Kepler mission which observed almost two hundred thousands of stars, allowed to circumvent this limitation. Also, the studies aimed at the comparison of solar and stellar variability enjoyed a breath of fresh air. In one of the first solar-stellar comparison studies based on the Kepler data, Gilliland et al. [2011] suggested that the Sun is photometrically quieter than other presumably main sequence Kepler stars with near-solar effective temperatures. Conversely, Basri et al. [2013] found that photometric variability of the Sun is similar to the level of variability displayed by the majority of Kepler stars with near-solar effective temperatures. Salabert et al. [2016] identified a sample of 18 solar analogs and found that their photometric variability and chromospheric activities are similar to those of the Sun.
Recently, Reinhold et al. [2020] combined Gaia and Kepler data to identify a sample of Kepler stars with effective temperatures between 5500 K and 6000 K. 369 of these stars had rotation periods between 20 and 30 days, while rotation periods of 2529 stars could not be determined from the photometry. The photometric variability of the stars with non-detected periods appeared to be very similar to that of the Sun. This is not surprising, since the highly irregular temporal profile of solar brightness variations would make the detection of the solar rotation period from the photometric time-series very difficult [see, e.g. Aigrain et al., 2015, Witzke et al., 2020, and references therein]. Consequently, if the Sun were observed by Kepler it would most probably be attributed to a sample of stars with near-solar fundamental parameters but undetected rotation periods. Interestingly, Reinhold et al. [2020] found that despite having near-solar fundamental parameters and rotation periods, 369 stars with known rotation periods are significantly more variable than the Sun (e.g. the mean variability of the stars with detected periods is almost 5 times larger than solar median variability). Currently, the high variability of these stars and a regular pattern of their light curves remain unexplained. One of the important questions is whether there is any systematic difference between Ca ii H and K emission of the stars with non-detected rotation periods and the Sun on one side and stars with detected near-solar rotation periods on the other side. This question is addressed in this Letter utilizing data from the Large Sky Area Multi-Object Fibre Spectroscopic Telescope (LAMOST) spectroscopic survey [Cui et al., 2012, Zhao et al., 2012].
LAMOST has collected millions of stellar spectra with a mean spectral resolution of about 1800 in broad wavelength range of 3700–9100 Å [Zhao et al., 2012]. In particular, it provides vast amounts of Ca ii H and K observational data. Meanwhile, LAMOST spectra allowed accurate determination of stellar fundamental parameters, i.e. effective temperature , surface gravity , and metallicity [Fe/H]. LAMOST has performed spectroscopic follow-up for targets in the Kepler field of view, which was initiated as the LAMOST-Kepler project (LK-project) [De Cat et al., 2015]. By June 2017, this project obtained more than 227,000 low-resolution spectra [Zong et al., 2018], thus providing us with a tool required to answer the question raised above.
In this Letter, we select solar-type stars observed by both LAMOST and Kepler, and study the relation between period detectability and chromospheric activity. In Section 2, we explain the sample selection and the procedure for measuring the Ca ii H and K emission from the LAMOST spectra. In Section 3, we compare the Ca ii H and K emission of the Sun and stars with known and unknown rotation periods. We summarise our results in Section 4.
2 Data and methods
2.1 Stellar samples
The stars analyzed in this study have been selected from the sixth Data Release (DR6) of the LAMOST survey111http://dr6.lamost.org/. Here, we define solar-type stars as stars with , and [Fe/H] in the ranges 5500–6000 K, 4.14–4.74 and –0.2, respectively. All these parameters are taken from DR6 of the LAMOST survey which is based on the LAMOST stellar parameter pipeline [LASP; Zhao et al., 2012, Luo et al., 2015]. The solar values were taken to be: = 5777 K and = 4.44. To place a lower limit on the quality of the spectroscopic observations, we only considered stars with the signal-to-noise ratios (S/Ns) at the blue end of the spectra higher than 30. With these constraints, we collected 341,557 spectra for 272,854 solar-type stars, which we denote as LAMOST sample. Among them, there are 6626 stars which have been also observed by Kepler mission [Zong et al., 2018], which we denote as the L-K sample.
We cross-matched the selected 6626 stars with the catalog of McQuillan et al. [2014]. This is a catalog of Kepler stars containing 34,030 stars with detected rotation periods and 99,000 stars with non-detected rotation periods. Following Reinhold et al. [2020] we concentrated on stars with rotation periods in the range 20–30 days (hereafter, solar-type stars) and stars with non-detected rotation period (hereafter, non-periodic sample). Furthermore, we have also selected stars with periods in the range 10–20 days (hereafter, short-periodic sample). Such a classification results in 254 solar-type stars and 793 short-periodic stars. 1556 stars were deemed as non-periodic. These stars can be considered as pseudo solar-type stars since their rotation periods are unknown. As discussed in Section 1 the Sun would most probably be allocated to the non-periodic sample of pseudo solar-type stars. In the Appendix we also consider stars with rotation periods shorter than 10 days to better illustrate the effect of the rotation period on photometric variability and on Ca ii H and K emission.
2.2 Chromospheric activity
Using the LAMOST spectra, we measured the magnetic activity proxy S-index as:
| (1) |
where H and K are the integrated fluxes in the cores of Ca ii H and K lines, respectively. The integration is performed using a triangle function with a full width at half-maximum (FWHM) of 1.09 Å centered at 3968 Å and 3934 Å, respectively. The parameters R and V are the integrated fluxes in the nearby pseudo-continuum. The integration in pseudo-continuum is performed using a rectangular function with 20 Å width centered at 4001 Å and 3901 Å, respectively. Following Karoff et al. [2016] we put calibration factor to 14.4. Karoff et al. [2016] argued that such a choice of the calibration factor leads to a distribution of LAMOST S-index values being consistent with that derived from Isaacson and Fischer [2010] around . For stars with multiple observations, the S-indexes were determined by using the weighted mean values of these multiple spectra with the weights being the S/Ns of the spectra. We refer to Zhang et al. [2020] for a detailed discussion of S-index measurements.
One of the main limitations of the current study is that Kepler and LAMOST observations are not performed at the same moment in time. While Kepler data considered in this study were obtained from June 2009 till May 2013, most of the LAMOST spectra were taken from June 2012 to June 2017. Consequently, 92% of LAMOST spectra used in this study have been taken outside of the period of Kepler observations. Nevertheless, we do not expect S-index to change significantly between the periods of Kepler and LAMOST observations. Indeed, the amplitude of the S-index variability on the rotation and activity cycle timescales is proportional to the time-averaged values of the S-index [see, e.g., Egeland, 2017, Radick et al., 2018, and references therein]. Consequently, the changes of S-index values of stars in the solar-type and non-periodic samples are expected to be similar to those of the Sun (i.e. about 10% from the mean value). Furthermore, spectra of 577 stars in our samples have been recorded by LAMOST more than once with the intervals among observations often reaching a couple of years. Comparison of these spectra did not reveal any significant changes of the corresponding S-index values with time (e.g. standard deviation among S-index values for the majority of the non-periodic stars was below 0.01–0.015).
3 Results
3.1 S-index distributions
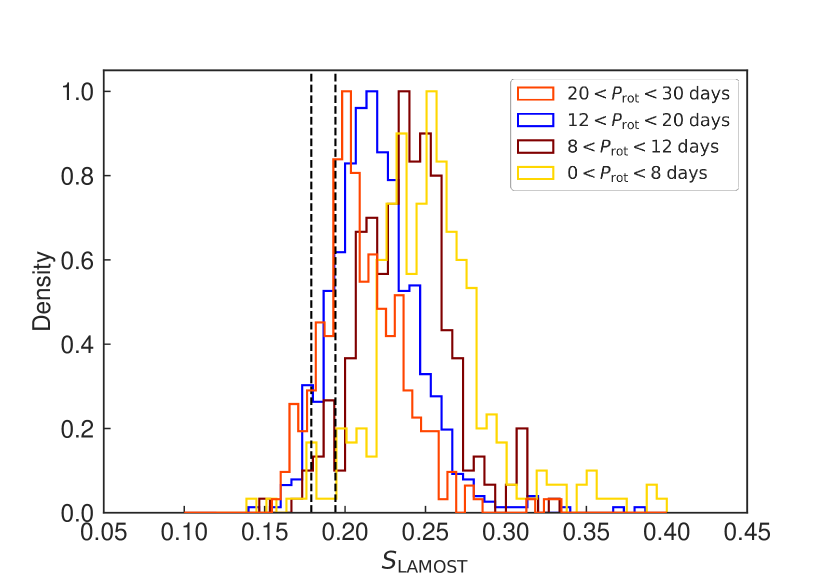
Figure 1 shows distributions of S-index values for three stellar samples introduced in Section 2.1. Not surprisingly the short-periodic sample appears to be on an average more active than the sample of solar-type stars. Interestingly, Figure 1 indicates that non-periodic stars are on an average less active than solar-type stars. Furthermore, the difference between distributions of solar-type and non-periodic stars is similar to the difference between distributions of short-periodic and solar-type stars.
To quantify the difference between the distributions we computed the Kolmogorov-Smirnov (K-S) statistic [Hodges, 1958]. The K-S statistic are measured by the maximum diagonal distance between the empirical cumulative distribution functions of the two samples. The statistic is 0.21 for distributions between short-periodic and solar-type sample while it is 0.27 for distributions between solar-type and non-periodic sample. The K-S statistic values and the two low p-values () indicate distributions of both sample sets are different, and distributions between the solar-type and non-periodic sample are much more different than those between short-periodic and solar-type sample.
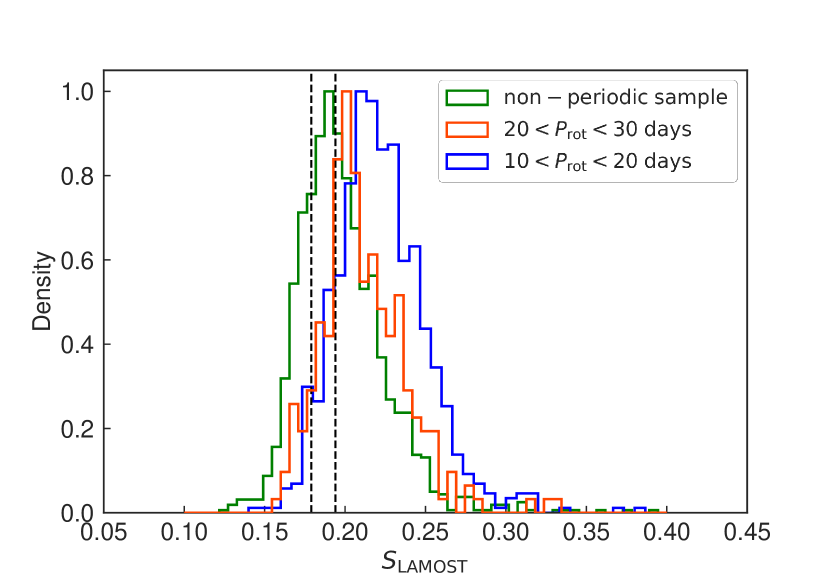
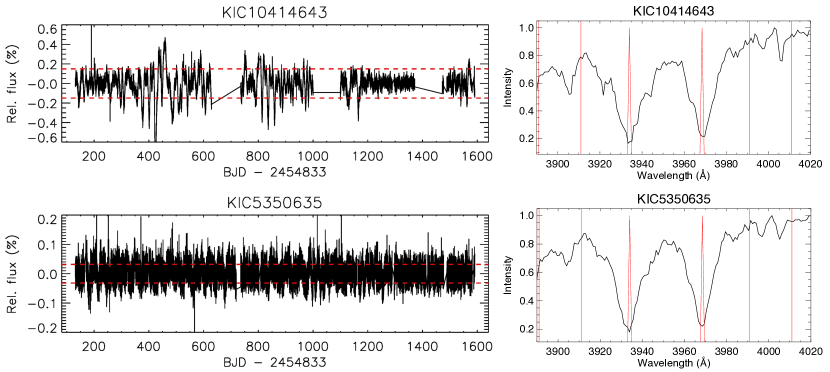
Figure 1 indicates that though the S-index distributions of solar-type and non-periodic stars are different, there is a substantial overlap between them. This implies that stars with detectable and not-detectable rotation periods and, consequently, very different light curves can still have the same levels of the chromospheric activity. The example of two such stars, KIC 10414643 and KIC 5350635, is given in Figure 2 and their main parameters are summarised in Table 1. The photometric variation is taken from Reinhold et al. [2020]. It is calculated by defining the difference between the 5th and 95th percentile of the sorted differential flux in each Kepler quarter and then taking the median among all quarters value.
Figure 2 shows that while both stars have very similar Ca ii H and K profiles and basically the same values of the S-index, their light curves are pretty different. The light curve of KIC 10414643, on the one hand, is highly regular and its rotation period can be easily determined. On the other hand, the amplitude of variability of KIC 5350635 is roughly five times smaller and no clear periodic signal can be seen behind the noise.
One possible explanation of such behaviour is that chromospheric activity is mainly given by the overall coverage of a star by the magnetic features [see, e.g., Shapiro et al., 2014]. At the same time, the photometric variability on stellar rotation timescale strongly depends on the surface distribution of magnetic features, their sizes, as well as evolution [see, e.g., Shapiro et al., 2020]. In particular, recent studies have been able to reveal the temporal evolution of starspots [see, e.g. Namekata et al., 2020] and also determine their sizes [see, e.g. Morris et al., 2017, who showed that spots of HAT-P-11 and of the Sun have similar sizes].
One interesting effect capable of a strong increase of the photometric variability without a direct influence on the S-index values and, thus, explaining the difference between periodic and non-periodic stars is nesting in the distribution of magnetic features [i.e. the tendency of magnetic features to emerge within certain “nests” of activity, see, e.g. Castenmiller et al., 1986]. In contrast to the spatially random distribution of emergences, nesting would lead to a non-axisymmetric distribution of spots [see, e.g., I\textcommabelowsık et al., 2018] and, consequently, regular light curves with large amplitudes of the rotational brightness variability. The effect of nesting on the photometric variability will be addressed in the forthcoming study. 222E.Isik(2020, private communication).
Another contributing factor might be the stellar inclination, i.e. the angle between the direction to the observer and stellar rotation axis. While photometric variability and period detectability strongly depends on the inclination of a star [Nèmec et al., 2020], chromospheric activity shows a much weaker dependence [Shapiro et al., 2014]. In particular, if a star is observed at a relatively low inclination (i.e. pole-on) its rotational variability would be significantly reduced and a star will be classified as non-periodic despite a large chromospheric activity. Finally, we can not fully exclude a possible change of the S-index between periods of Kepler and LAMOST observations (although, see the discussion in Sect. 2.2). We emphasize here the need for the future contemporaneous spectroscopic and photometric observations for a large sample of stars.
3.2 Relation between S-index and photometric variability
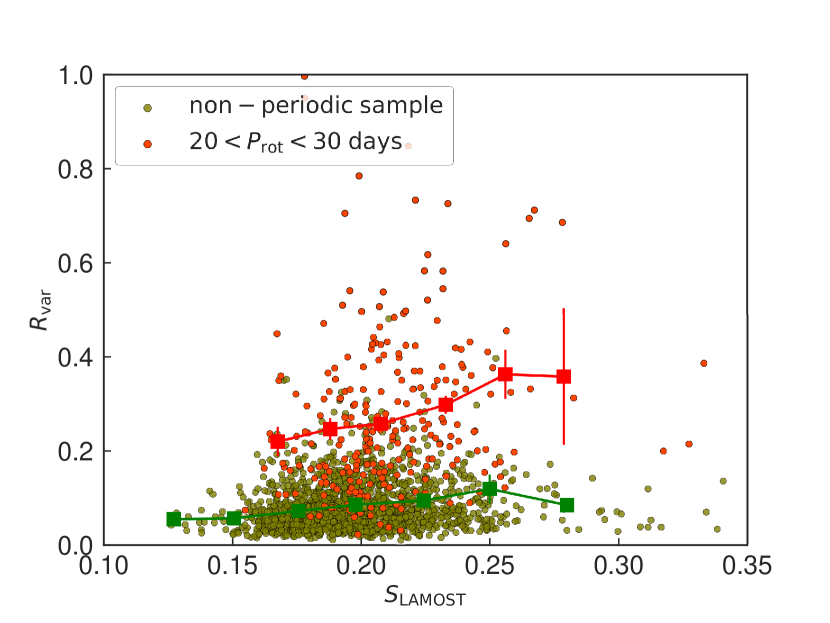
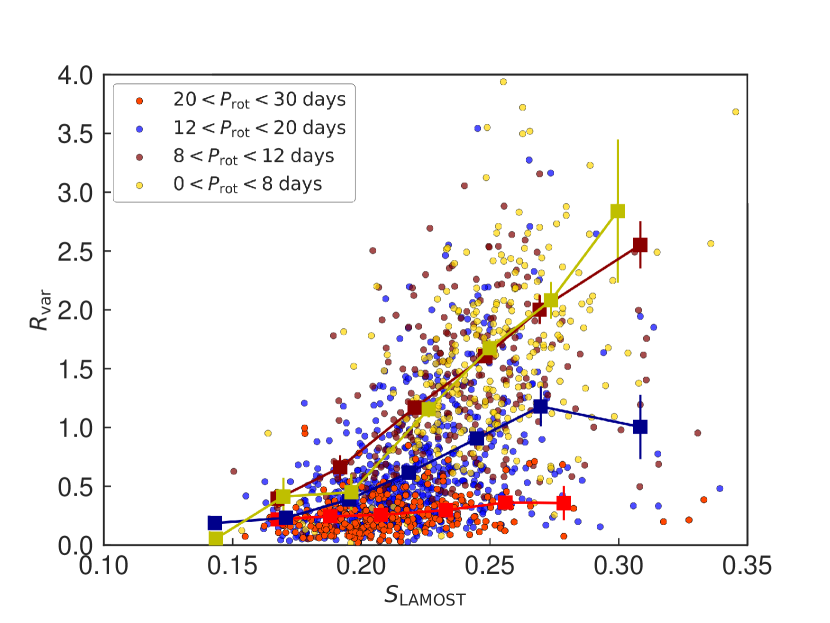
In Figure 3 we plot the dependences of photometric variability on S-index for the solar-type and non-periodic samples. For the solar-type sample, the significantly increases with S-index. We binned the S-index values into 7 equidistant segments within the range 0.12–0.30 for the solar-type sample and within the range 0.1–0.3 for the non-periodic sample. The averaged values in each bins were then calculated. The binned values show that for both samples photometric variability somehow increases with the S-index. The increase is, however, not particularly strong and is to a large extent hidden by the large spread of photometric variabilities the stars with the same S-index can have.
In agreement with Reinhold et al. [2020], Figure 3 shows that photometric variability of solar-type stars is significantly larger than that of non-periodic stars. The stars in the non-periodic sample exhibit variabilities similar to that of the Sun [for which median over the last 140 years was 0.07% and maximum was about 0.2%, see Reinhold et al., 2020, for detailed discussion]. At the same time Figure 3 demonstrates that although distributions of S-index values for the periodic and non-periodic stars are different (see Section. 3.1), the S-index is not the main factor which defines the morphology of the light curves (regular vs. non-regular) and their amplitude. We note that the S-index mainly depends on the total coverage of stellar surface by magnetic features, while the photometric variability additionally depends on the degree of axisymmetry of this distribution (see Section. 3.1). Consequently, our result hints that the surface distribution of magnetic features and its degree of axisymmetry plays an important role in defining whether a star is solar-type or non-periodic stars.
Kepler data shows that photometric variability increases with the stellar rotation rate until periods of about 12 days and saturates for faster rotators [see, e.g., Fig. 15 in Notsu et al., 2019]. Interestingly, the saturation appears to be less pronounced for the S-index values [see Fig. 6 in Zhang et al., 2020]. We further illustrate this point in the Appendix where we repeat Figs. 1 and 3 but for samples of stars with rotational periods days, days, days, and days (see Figs. A1 and A2). One can see that S-index values and photometric variabilities for the last three samples are clearly different, increasing from slower to faster rotators (see red, blue, and maroon in Figs. A1 and A2). For the S-index the same trend is also valid for stars with days - they appear to be more active than stars in other samples (see yellow in Fig 1). At the same time there seems to be a saturation in the photometric variabilities since their average values for stars with days and for stars with days are very similar (see maroon and yellow in Fig. A2). This is consistent with the results of Notsu et al. [2019] and Zhang et al. [2020].
3.3 Effect of spectral resolution on the S-index and placing the Sun among solar-type stars
The main difficulty in finding the solar S-index as it would be measured by LAMOST is the relatively low spectral resolution of LAMOST. Although the mean resolution power of LAMOST is about 1800, the resolution strongly depends on wavelength and is expected to be about 1000 around Ca ii H and K lines [Xiang et al., 2015]. Furthermore, Xiang et al. [2015] reported that the resolution power of each LAMOST fiber varies considerably, with amplitudes amounting to 1 Å. Potentially such a spread of resolutions might affect not only placing the Sun on the LAMOST S-index scale but also the distributions plotted in Figure 1. Indeed, one might expect that stars with near-solar activity levels observed at lower spectral resolution will have higher S-index values than stars observed at higher resolution (since the lower the spectral resolution is the stronger the line cores are mixed with wings and, consequently, the larger are the H and K fluxes , see Equation 1).
To clarify how strong the impact of the differences in the resolution power between different LAMOST fibres on the distribution of S-index values is, we collected the observational resolution curves at the blue end (3700–5900 Å) of the individual spectra which were obtained utilizing the LAMOST arc lamp and sky emission lines.333M.-S., Xiang(2020, private communications). In the left panel of Figure 4 we show the dependence of the S-index on the LAMOST observational resolution power, i.e. FWHM for stars from Figure 1. Note that the observational resolution curves are available for 50% of stars in Figure 1. One can see that the dependence (if any) of the S-index on the LAMOST spectral resolution is rather weak compared to the differences of S-index values between the periodic and non-periodic sample. Consequently, we do not expect that any of our results might be affected by the LAMOST stars being observed at slightly different spectral resolutions.
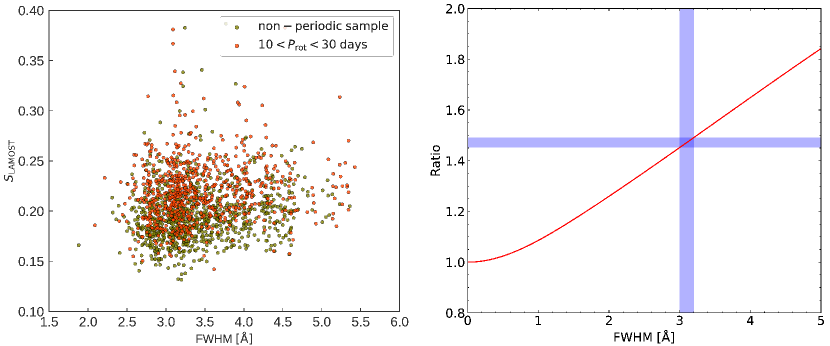
It is important to place the Sun and solar-type stars on the same S-index scale for comparing their chromospheric activities. This, however, is hindered by the fact that LAMOST survey has no record of spectra of solar light reflected from minor bodies or from inactive satellites. Therefore, we take the following indirect approach to obtain the S-index of the Sun on LAMOST scale. We use the high resolution (better than 350 000) solar flux spectrum from Hamburg atlas444ftp://ftp.hs.uni-hamburg.de/pub/outgoing/FTS-Atlas/ [see, for e.g. Doerr et al., 2016] created using the data from the Fourier Transform Spectrometer (FTS) at the McMath-Pierce solar telescope at the Kitt Peak National Observatory. We degrade this FTS spectrum by convolving it with Gaussian kernels of varying FWHM in the range 0–5 Å, which covers the range of spectral resolutions achieved from LAMOST fibres. Then we compute the S-index for the high resolution (undegraded) and degraded spectra. In the right panel of Figure 4 we show the ratio of S-index measured for the degraded spectrum to that measured for the original high resolution FTS spectrum as a function of the resolution. Due to the increased H and K fluxes resulting from the lower spectral resolution, the ratio increases with decreasing resolution. In the left panel of Figure 4, it appears that the majority of LAMOST stars considered for this plot were observed with spectral resolution between 3.0 and 3.2 Å. For this range of resolution, the ratio varies only slightly i.e. between 1.45–1.49 as indicated by the shaded horizontal bar in the right panel of Figure 4, reinforcing that S-index has a weaker dependence on the variations in LAMOST resolution. However, we note that S-index measured with a low resolution spectra like LAMOST would be on an average larger by 47% than that measured with the high resolution spectrum.
Egeland et al. [2017] has accurately placed the solar S-index value on the MWO S-index scale. They found that minimum and maximum values of the solar S-index during cycles 15–24 were 0.162 and 0.177, respectively. We note that these values correspond to instead of we adopted here following Karoff et al. [2016]. Thus we first corrected Egeland et al. [2017] values for the difference in calibration factors and then applied factor 1.47 (see right panel of Figure 4) to correct for LAMOST spectral resolution. As a result we find that solar S-index on the LAMOST scale varied between 0.179 and 0.194 during cycles 15–24. These values are designated by the dashed vertical lines in Figure 1. Compared to the activity level of the Sun, the peak level of activity of the non-periodic stars is near the range of the Sun, while the majority of the periodic stars have activity levels higher than that of the Sun. Consequently, the analysis of the Ca ii H and K data reinforces the conclusion of Reinhold et al. [2020] (drawn from the analysis of the Kepler light curves) that the Sun is a typical star of the non-periodic sample.
4 conclusions
We derived the chromospheric activity indexes of 2603 stars in LAMOST-Kepler project. These stars were classified into three different samples. The solar-type sample includes stars with known rotation periods in range of 20–30 days, the short-periodic sample includes stars with known rotation periods in range of 10–20 days, and the non-periodic sample includes stars with unknown rotation periods. We investigated the S-index distributions of these samples. We studied the dependence of the photometric variation on the chromospheric activity level for the solar-type sample and non-periodic sample. By convolving the high-resolution solar spectrum to the LAMOST resolution, we could place the Sun on the LAMOST S-index scale.
We showed that the solar S-index values are typical for the non-periodic Kepler stars. In contrast, the stars in the solar-type sample are systematically more active than the non-periodic stars in both chrmospheric activity levels and amplitudes of photometric variation. At the same time we found that non-periodic and solar-type stars can have the same values of the S-index. Consequently, the S-index, which mainly determines the total coverage of stellar surface by magnetic features, is not the main factor determining stellar photometric variability. We suggest that the surface distribution of magnetic features and, in particular, the degree of its axisymmetry plays at least as important role in defining stellar photometric variability as the total coverage of a star by magnetic features.
Acknowledgments This work is supported by the Joint Research Fund in Astronomy (U1631236) under cooperative agreement between the National Natural Science Foundation of China (NSFC) and Chinese Academy of Sciences (CAS), and grants 11903044 from the NSFC. Shapiro A.I. and Reinhold T. have been funded by the European Research Council (ERC) under the European Union’s Horizon 2020 research and innovation programme (grant agreement No. 715947). Xiang, M.-S. acknowledges support from NSFC Grant No.11703035. Sowmya, K. received funding from the European Union’s Horizon 2020 research and innovation programme under the Marie Skłodowska-Curie grant agreement No. 797715. T.L. acknowledge the funding from the European Research Council (ERC) under the European Union’s Horizon 2020 research and innovation programme (CartographY GA. 804752). Zhang, X.-F. acknowledges support from NSFC Grant No.11703001. We acknowledge the entire Kepler team and everyone involved in the Kepler mission. Funding for the Kepler Mission is provided by NASA’s Science Mission Directorate. Guoshoujing Telescope (the Large Sky Area Multi-Object Fiber Spectroscopic Telescope, LAMOST) is a National Major Scientific Project built by the Chinese Academy of Sciences. Funding for the project has been provided by the National Development and Reform Commission. LAMOST is operated and managed by the National Astronomical Observatories, Chinese Academy of Sciences.
Distributions of S-index values (Figure A1) and the dependence of photometric variability on S-index (Figure A2) for periodic stars grouped according to their rotation periods.
References
- Aigrain et al. [2015] S. Aigrain, J. Llama, T. Ceillier, M. L. d. Chagas, J. R. A. Davenport, R. A. García, K. L. Hay, A. F. Lanza, A. McQuillan, T. Mazeh, J. R. de Medeiros, M. B. Nielsen, and T. Reinhold. Testing the recovery of stellar rotation signals from Kepler light curves using a blind hare-and-hounds exercise. MNRAS, 450:3211–3226, July 2015. 10.1093/mnras/stv853.
- Baliunas et al. [1995] S. L. Baliunas, R. A. Donahue, W. H. Soon, J. H. Horne, J. Frazer, L. Woodard-Eklund, M. Bradford, L. M. Rao, O. C. Wilson, Q. Zhang, W. Bennett, J. Briggs, S. M. Carroll, D. K. Duncan, D. Figueroa, H. H. Lanning, T. Misch, J. Mueller, R. W. Noyes, D. Poppe, A. C. Porter, C. R. Robinson, J. Russell, J. C. Shelton, T. Soyumer, A. H. Vaughan, and J. H. Whitney. Chromospheric Variations in Main-Sequence Stars. II. ApJ, 438:269, January 1995. 10.1086/175072.
- Basri et al. [2013] Gibor Basri, Lucianne M. Walkowicz, and Ansgar Reiners. Comparison of Kepler Photometric Variability with the Sun on Different Timescales. ApJ, 769(1):37, May 2013. 10.1088/0004-637X/769/1/37.
- Castenmiller et al. [1986] M. J. M. Castenmiller, C. Zwaan, and E. B. J. van der Zalm. Sunspot Nests - Manifestations of Sequences in Magnetic Activity. Sol. Phys., 105(2):237–255, June 1986. 10.1007/BF00172045.
- Charbonneau [2010] Paul Charbonneau. Dynamo Models of the Solar Cycle. Living Reviews in Solar Physics, 7(1):3, Sep 2010. 10.12942/lrsp-2010-3.
- Charbonneau [2013] Paul Charbonneau. Solar and Stellar Dynamos. Saas-Fee Advanced Course, January 2013.
- Cui et al. [2012] Xiang-Qun Cui, Yong-Heng Zhao, Yao-Quan Chu, Guo-Ping Li, Qi Li, Li-Ping Zhang, Hong-Jun Su, Zheng-Qiu Yao, Ya-Nan Wang, Xiao-Zheng Xing, Xin-Nan Li, Yong-Tian Zhu, Gang Wang, Bo-Zhong Gu, A. Li Luo, Xin-Qi Xu, Zhen-Chao Zhang, Gen-Rong Liu, Hao-Tong Zhang, De-Hua Yang, Shu-Yun Cao, Hai-Yuan Chen, Jian-Jun Chen, Kun-Xin Chen, Ying Chen, Jia-Ru Chu, Lei Feng, Xue-Fei Gong, Yong-Hui Hou, Hong-Zhuan Hu, Ning-Sheng Hu, Zhong-Wen Hu, Lei Jia, Fang-Hua Jiang, Xiang Jiang, Zi-Bo Jiang, Ge Jin, Ai-Hua Li, Yan Li, Ye-Ping Li, Guan-Qun Liu, Zhi-Gang Liu, Wen-Zhi Lu, Yin-Dun Mao, Li Men, Yong-Jun Qi, Zhao-Xiang Qi, Huo-Ming Shi, Zheng-Hong Tang, Qing-Sheng Tao, Da-Qi Wang, Dan Wang, Guo-Min Wang, Hai Wang, Jia-Ning Wang, Jian Wang, Jian-Ling Wang, Jian-Ping Wang, Lei Wang, Shu-Qing Wang, You Wang, Yue-Fei Wang, Ling-Zhe Xu, Yan Xu, Shi-Hai Yang, Yong Yu, Hui Yuan, Xiang-Yan Yuan, Chao Zhai, Jing Zhang, Yan-Xia Zhang, Yong Zhang, Ming Zhao, Fang Zhou, Guo-Hua Zhou, Jie Zhu, and Si-Cheng Zou. The Large Sky Area Multi-Object Fiber Spectroscopic Telescope (LAMOST). Research in Astronomy and Astrophysics, 12(9):1197–1242, Sep 2012. 10.1088/1674-4527/12/9/003.
- De Cat et al. [2015] P. De Cat, J. N. Fu, A. B. Ren, X. H. Yang, J. R. Shi, A. L. Luo, M. Yang, J. L. Wang, H. T. Zhang, H. M. Shi, W. Zhang, Subo Dong, G. Catanzaro, C. J. Corbally, A. Frasca, R. O. Gray, J. Molenda-Żakowicz, K. Uytterhoeven, M. Briquet, H. Bruntt, S. Frandsen, L. Kiss, D. W. Kurtz, M. Marconi, E. Niemczura, R. H. Østensen, V. Ripepi, B. Smalley, J. Southworth, R. Szabó, J. H. Telting, C. Karoff, V. Silva Aguirre, Y. Wu, Y. H. Hou, G. Jin, and X. L. Zhou. Lamost Observations in the Kepler Field. I. Database of Low-resolution Spectra. ApJS, 220(1):19, Sep 2015. 10.1088/0067-0049/220/1/19.
- Doerr et al. [2016] H. P. Doerr, N. Vitas, and D. Fabbian. How different are the Liège and Hamburg atlases of the solar spectrum? A&A, 590:A118, May 2016. 10.1051/0004-6361/201628570.
- Egeland [2017] Ricky Egeland. Long-Term Variability of the Sun in the Context of Solar-Analog Stars. PhD thesis, Montana State University, Bozeman, Montana, USA, April 2017.
- Egeland et al. [2017] Ricky Egeland, Willie Soon, Sallie Baliunas, Jeffrey C. Hall, Alexei A. Pevtsov, and Luca Bertello. The Mount Wilson Observatory S-index of the Sun. ApJ, 835(1):25, Jan 2017. 10.3847/1538-4357/835/1/25.
- Gilliland et al. [2011] Ronald L. Gilliland, William J. Chaplin, Edward W. Dunham, Vic S. Argabright, William J. Borucki, Gibor Basri, Stephen T. Bryson, Derek L. Buzasi, Douglas A. Caldwell, Yvonne P. Elsworth, Jon M. Jenkins, David G. Koch, Jeffrey Kolodziejczak, Andrea Miglio, Jeffrey van Cleve, Lucianne M. Walkowicz, and William F. Welsh. Kepler Mission Stellar and Instrument Noise Properties. ApJS, 197(1):6, Nov 2011. 10.1088/0067-0049/197/1/6.
- Hall et al. [2009] J. C. Hall, G. W. Henry, G. W. Lockwood, B. A. Skiff, and S. H. Saar. The Activity and Variability of the Sun and Sun-Like Stars. II. Contemporaneous Photometry and Spectroscopy of Bright Solar Analogs. AJ, 138:312–322, July 2009. 10.1088/0004-6256/138/1/312.
- Hall et al. [2007] Jeffrey C. Hall, G. W. Lockwood, and Brian A. Skiff. The Activity and Variability of the Sun and Sun-like Stars. I. Synoptic Ca II H and K Observations. AJ, 133(3):862–881, Mar 2007. 10.1086/510356.
- Hodges [1958] J. L. Hodges. The significance probability of the smirnov two-sample test. Ark. Mat., 3(5):469–486, 01 1958. 10.1007/BF02589501.
- Isaacson and Fischer [2010] Howard Isaacson and Debra Fischer. Chromospheric Activity and Jitter Measurements for 2630 Stars on the California Planet Search. ApJ, 725(1):875–885, December 2010. 10.1088/0004-637X/725/1/875.
- I\textcommabelowsık et al. [2018] E. I\textcommabelowsık, S. K. Solanki, N. A. Krivova, and A. I. Shapiro. Forward modelling of brightness variations in Sun-like stars. I. Emergence and surface transport of magnetic flux. A&A, 620:A177, December 2018. 10.1051/0004-6361/201833393.
- Karoff et al. [2016] Christoffer Karoff, Mads Faurschou Knudsen, Peter De Cat, Alfio Bonanno, Alexandra Fogtmann-Schulz, Jianning Fu, Antonio Frasca, Fadil Inceoglu, Jesper Olsen, Yong Zhang, Yonghui Hou, Yuefei Wang, Jianrong Shi, and Wei Zhang. Observational evidence for enhanced magnetic activity of superflare stars. Nature Communications, 7:11058, Mar 2016. 10.1038/ncomms11058.
- Lockwood et al. [2007] G. W. Lockwood, B. A. Skiff, G. W. Henry, S. Henry, R. R. Radick, S. L. Baliunas, R. A. Donahue, and W. Soon. Patterns of Photometric and Chromospheric Variation among Sun-like Stars: A 20 Year Perspective. ApJS, 171:260–303, July 2007. 10.1086/516752.
- Luo et al. [2015] A. Li Luo, Yong-Heng Zhao, Gang Zhao, Li-Cai Deng, Xiao-Wei Liu, Yi-Peng Jing, Gang Wang, Hao-Tong Zhang, Jian-Rong Shi, Xiang-Qun Cui, Yao-Quan Chu, Guo-Ping Li, Zhong-Rui Bai, Yue Wu, Yan Cai, Shu-Yun Cao, Zi-Huang Cao, Jeffrey L. Carlin, Hai-Yuan Chen, Jian-Jun Chen, Kun-Xin Chen, Li Chen, Xue-Lei Chen, Xiao-Yan Chen, Ying Chen, Norbert Christlieb, Jia-Ru Chu, Chen-Zhou Cui, Yi-Qiao Dong, Bing Du, Dong-Wei Fan, Lei Feng, Jian-Ning Fu, Peng Gao, Xue-Fei Gong, Bo-Zhong Gu, Yan-Xin Guo, Zhan-Wen Han, Bo-Liang He, Jin-Liang Hou, Yong-Hui Hou, Wen Hou, Hong-Zhuan Hu, Ning-Sheng Hu, Zhong-Wen Hu, Zhi-Ying Huo, Lei Jia, Fang-Hua Jiang, Xiang Jiang, Zhi-Bo Jiang, Ge Jin, Xiao Kong, Xu Kong, Ya-Juan Lei, Ai-Hua Li, Chang-Hua Li, Guang-Wei Li, Hai-Ning Li, Jian Li, Qi Li, Shuang Li, Sha-Sha Li, Xin-Nan Li, Yan Li, Yin-Bi Li, Ye-Ping Li, Yuan Liang, Chien-Cheng Lin, Chao Liu, Gen-Rong Liu, Guan-Qun Liu, Zhi-Gang Liu, Wen-Zhi Lu, Yu Luo, Yin-Dun Mao, Heidi Newberg, Ji-Jun Ni, Zhao-Xiang Qi, Yong-Jun Qi, Shi-Yin Shen, Huo-Ming Shi, Jing Song, Yi-Han Song, Ding-Qiang Su, Hong-Jun Su, Zheng-Hong Tang, Qing-Sheng Tao, Yuan Tian, Dan Wang, Da-Qi Wang, Feng-Fei Wang, Guo-Min Wang, Hai Wang, Hong-Chi Wang, Jian Wang, Jia-Ning Wang, Jian-Ling Wang, Jian-Ping Wang, Jun-Xian Wang, Lei Wang, Meng-Xin Wang, Shou-Guan Wang, Shu-Qing Wang, Xia Wang, Ya-Nan Wang, You Wang, Yue-Fei Wang, You-Fen Wang, Peng Wei, Ming-Zhi Wei, Hong Wu, Ke-Fei Wu, Xue-Bing Wu, Yu-Zhong Wu, Xiao-Zheng Xing, Ling-Zhe Xu, Xin-Qi Xu, Yan Xu, Tai-Sheng Yan, De-Hua Yang, Hai-Feng Yang, Hui-Qin Yang, Ming Yang, Zheng-Qiu Yao, Yong Yu, Hui Yuan, Hai-Bo Yuan, Hai-Long Yuan, Wei-Min Yuan, Chao Zhai, En-Peng Zhang, Hua-Wei Zhang, Jian-Nan Zhang, Li-Pin Zhang, Wei Zhang, Yong Zhang, Yan-Xia Zhang, Zheng-Chao Zhang, Ming Zhao, Fang Zhou, Xu Zhou, Jie Zhu, Yong-Tian Zhu, Si-Cheng Zou, and Fang Zuo. The first data release (DR1) of the LAMOST regular survey. Research in Astronomy and Astrophysics, 15(8):1095, Aug 2015. 10.1088/1674-4527/15/8/002.
- McQuillan et al. [2014] A. McQuillan, T. Mazeh, and S. Aigrain. Rotation Periods of 34,030 Kepler Main-sequence Stars: The Full Autocorrelation Sample. ApJS, 211(2):24, Apr 2014. 10.1088/0067-0049/211/2/24.
- Morris et al. [2017] Brett M. Morris, Leslie Hebb, James R. A. Davenport, Graeme Rohn, and Suzanne L. Hawley. The Starspots of HAT-P-11: Evidence for a Solar-like Dynamo. ApJ, 846(2):99, September 2017. 10.3847/1538-4357/aa8555.
- Namekata et al. [2020] Kosuke Namekata, James R. A. Davenport, Brett M. Morris, Suzanne L. Hawley, Hiroyuki Maehara, Yuta Notsu, Shin Toriumi, Kai Ikuta, Shota Notsu, Satoshi Honda, Daisaku Nogami, and Kazunari Shibata. Temporal Evolution of Spatially Resolved Individual Star Spots on a Planet-hosting Solar-type Star: Kepler-17. ApJ, 891(2):103, March 2020. 10.3847/1538-4357/ab7384.
- Nèmec et al. [2020] N. E. Nèmec, A. I. Shapiro, N. A. Krivova, S. K. Solanki, R. V. Tagirov, R. H. Cameron, and S. Dreizler. Power spectra of solar brightness variations at different inclinations. arXiv e-prints, art. arXiv:2002.10895, February 2020.
- Notsu et al. [2019] Yuta Notsu, Hiroyuki Maehara, Satoshi Honda, Suzanne L. Hawley, James R. A. Davenport, Kosuke Namekata, Shota Notsu, Kai Ikuta, Daisaku Nogami, and Kazunari Shibata. Do Kepler Superflare Stars Really Include Slowly Rotating Sun-like Stars?—Results Using APO 3.5 m Telescope Spectroscopic Observations and Gaia-DR2 Data. ApJ, 876(1):58, May 2019. 10.3847/1538-4357/ab14e6.
- Noyes et al. [1984] R. W. Noyes, L. W. Hartmann, S. L. Baliunas, D. K. Duncan, and A. H. Vaughan. Rotation, convection, and magnetic activity in lower main-sequence stars. ApJ, 279:763–777, Apr 1984. 10.1086/161945.
- Radick et al. [1998] R. R. Radick, G. W. Lockwood, B. A. Skiff, and S. L. Baliunas. Patterns of Variation among Sun-like Stars. ApJS, 118:239–258, September 1998. 10.1086/313135.
- Radick et al. [2018] Richard R. Radick, G. Wesley Lockwood, Gregory W. Henry, Jeffrey C. Hall, and Alexei A. Pevtsov. Patterns of Variation for the Sun and Sun-like Stars. ApJ, 855(2):75, Mar 2018. 10.3847/1538-4357/aaaae3.
- Reinhold et al. [2020] T. Reinhold, A. I. Shapiro, S. K. Solanki, N. A. Krivova, R. H. Cameron, and E. M. Amazo-Gómez. The Sun is less active than other solar-like stars. Science, 368:518–521, 2020. 10.1126/science.aay3821.
- Reinhold et al. [2017] Timo Reinhold, Robert H. Cameron, and Laurent Gizon. Evidence for photometric activity cycles in 3203 Kepler stars. A&A, 603:A52, July 2017. 10.1051/0004-6361/201730599.
- Salabert et al. [2016] D. Salabert, R. A. García, P. G. Beck, R. Egeland , P. L. Pallé, S. Mathur, T. S. Metcalfe, Jr. do Nascimento, J. D., T. Ceillier, M. F. Andersen, and A. Triviño Hage. Photospheric and chromospheric magnetic activity of seismic solar analogs. Observational inputs on the solar-stellar connection from Kepler and Hermes. A&A, 596:A31, Nov 2016. 10.1051/0004-6361/201628583.
- Shapiro et al. [2014] A. I. Shapiro, S. K. Solanki, N. A. Krivova, W. K. Schmutz, W. T. Ball, R. Knaack, E. V. Rozanov, and Y. C. Unruh. Variability of Sun-like stars: reproducing observed photometric trends. A&A, 569:A38, September 2014. 10.1051/0004-6361/201323086.
- Shapiro et al. [2020] A. I. Shapiro, E. M. Amazo-Gómez, N. A. Krivova, and S. K. Solanki. Inflection point in the power spectrum of stellar brightness variations. I. The model. A&A, 633:A32, January 2020. 10.1051/0004-6361/201936018.
- Vidotto [2019] A. A. Vidotto. Different types of star-planet interactions. arXiv e-prints, art. arXiv:1911.10915, November 2019.
- Wilson [1978] O. C. Wilson. Chromospheric variations in main-sequence stars. ApJ, 226:379–396, Dec 1978. 10.1086/156618.
- Witzke et al. [2018] V. Witzke, A. I. Shapiro, S. K. Solanki, N. A. Krivova, and W. Schmutz. From solar to stellar brightness variations. The effect of metallicity. A&A, 619:A146, November 2018. 10.1051/0004-6361/201833936.
- Witzke et al. [2020] V. Witzke, T. Reinhold, A. I. Shapiro, N. A. Krivova, and S. K. Solanki. Effect of metallicity on the detectability of rotational periods in solar-like stars. A&A, 634:L9, February 2020. 10.1051/0004-6361/201936608.
- Wood [2004] Brian E. Wood. Astrospheres and Solar-like Stellar Winds. Living Reviews in Solar Physics, 1(1):2, Jul 2004. 10.12942/lrsp-2004-2.
- Xiang et al. [2015] M. S. Xiang, X. W. Liu, H. B. Yuan, Y. Huang, Z. Y. Huo, H. W. Zhang, B. Q. Chen, H. H. Zhang, N. C. Sun, C. Wang, Y. H. Zhao, J. R. Shi, A. L. Luo, G. P. Li, Y. Wu, Z. R. Bai, Y. Zhang, Y. H. Hou, H. L. Yuan, G. W. Li, and Z. Wei. The LAMOST stellar parameter pipeline at Peking University - LSP3. MNRAS, 448(1):822–854, March 2015. 10.1093/mnras/stu2692.
- Zhang et al. [2020] Jinghua Zhang, Shaolan Bi, Yaguang Li, Jie Jiang, Tanda Li, Han He, Jie Yu, Shourya Khanna, Zhishuai Ge, Kang Liu, Zhijia Tian, Yaqian Wu, and Xianfei Zhang. Magnetic activity of f-, g-, and k-type stars in the LAMOST–kepler field. ApJS, 247(1):9, feb 2020. 10.3847/1538-4365/ab6165.
- Zhao et al. [2012] Gang Zhao, Yong-Heng Zhao, Yao-Quan Chu, Yi-Peng Jing, and Li-Cai Deng. LAMOST spectral survey — An overview. Research in Astronomy and Astrophysics, 12(7):723–734, Jul 2012. 10.1088/1674-4527/12/7/002.
- Zong et al. [2018] Weikai Zong, Jian-Ning Fu, Peter De Cat, Jianrong Shi, Ali Luo, Haotong Zhang, A. Frasca, C. J. Corbally, J. Molenda-Żakowicz, G. Catanzaro, R. O. Gray, Jiangtao Wang, Yang Pan, Anbing Ren, Ruyuan Zhang, Mengqi Jin, Yue Wu, Subo Dong, Ji-Wei Xie, Wei Zhang, Yonghui Hou, and LAMOST-Kepler Collaboration. LAMOST Observations in the Kepler Field. II. Database of the Low-resolution Spectra from the Five-year Regular Survey. ApJS, 238(2):30, Oct 2018. 10.3847/1538-4365/aadf81.