11email: stefano.facchini@eso.org 22institutetext: Departamento de Astronomía, Universidad de Chile, Camino El Observatorio 1515, Las Condes, Santiago, Chile 33institutetext: Unidad Mixta Internacional Franco-Chilena de Astronomía, CNRS, UMI 3386 44institutetext: Univ. Grenoble Alpes, CNRS, IPAG, 38000 Grenoble, France. 55institutetext: Earth and Planets Laboratory, Carnegie Institution for Science, 5241 Broad Branch Road NW, Washington, DC 20015, USA 66institutetext: NRAO, 520 Edgemont Rd, Charlottesville, VA 22903, USA 77institutetext: Flatiron Institute, Simons Foundation, 162 Fifth Ave, New York, NY 10010, USA 88institutetext: The Graduate University for Advanced Studies, SOKENDAI, Shonan Village, Hayama, Miura, Kanagawa 240-0193, Japan 99institutetext: Max Planck Institute for Astronomy, Königstuhl 17, 69117, Heidelberg, Germany 1010institutetext: Center for Astrophysics — Harvard & Smithsonian, 60 Garden Street, Cambridge, MA 02138, USA 1111institutetext: Department of Physics and Astronomy, Rice University, 6100 Main Street, MS-108, Houston, TX 77005, USA 1212institutetext: Department of Physics and Astronomy, University of North Carolina at Chapel Hill, Chapel Hill, NC 27599, USA
Annular substructures in the transition disks
around LkCa 15 and J1610
We present high resolution millimeter continuum ALMA observations of the disks around the T Tauri stars LkCa 15 and 2MASS J16100501-2132318 (hereafter, J1610). These transition disks host dust-depleted inner regions, possibly carved by massive planets, and are of prime interest to study the imprints of planet-disk interactions. While at moderate angular resolution they appear as a broad ring surrounding a cavity, the continuum emission resolves into multiple rings at a resolution of 6040 mas (au for LkCa 15, au for J1610) and Jy beam-1 rms at mm. In addition to a broad extended component, LkCa 15 and J1610 host 3 and 2 narrow rings, respectively, with two bright rings in LkCa 15 being radially resolved. LkCa 15 possibly hosts another faint ring close to the outer edge of the mm emission. The rings look marginally optically thick, with peak optical depths of (neglecting scattering), in agreement with high angular resolution observations of full disks. We perform hydrodynamical simulations with an embedded, sub-Jovian-mass planet and show that the observed multi-ringed substructure can be qualitatively explained as the outcome of the planet-disk interaction. We note however that the choice of the disk cooling timescale alone can significantly impact the resulting gas and dust distributions around the planet, leading to different numbers of rings and gaps and different spacings between them. We propose that the massive outer disk regions of transition disks are favorable places for planetesimals and possibly second generation planet formation of objects with a lower mass than the planets carving the inner cavity (typically few ), and that the annular substructures observed in LkCa 15 and J1610 may be indicative of planetary core formation within dust-rich pressure traps. Current observations are compatible with other mechanisms being at the origin of the observed substructures, in particular with narrow rings generated (or facilitated) at the edge of the CO and N2 snowlines.
Key Words.:
accretion, accretion disks – planetary systems: protoplanetary disks – stars: individual: LkCa15 – stars: individual: J1610 – submillimeter: planetary systems1 Introduction
High angular resolution observations of protoplanetary disks show that substructure in their dust emission is ubiquitous. This is the case in both (sub-)millimeter (mm) emission, largely tracing dust grains with sizes m (e.g., Andrews, 2020), and in scattered light observations at optical and near infrared (NIR) wavelengths, probing sub-m sized dust grains (e.g., Garufi et al., 2018). The only disks that so far do not show azimuthal or radial substructure in their dust distribution are very compact or faint objects, where the finite resolution of the instruments is able to image these disks with just a few (or less) resolution elements across their diameter (e.g., Facchini et al., 2019). Before the advent of the high resolution Atacama Large Millimeter/submillimeter Array (ALMA) and extreme adaptive optics systems on ground based telescopes, photometric surveys had already identified a class of objects with some level of substructure, the so-called transition disks, evidenced from a lack of near/mid-IR emission in their spectral energy distribution that indicates a dust-depleted inner region. This was confirmed with sub-mm images that clearly showed the presence of cavities with angular sizes larger than the resolution elements available at the time (0.3″, 40-75 au; Brown et al., 2009; Andrews et al., 2011) surrounded by a bright and wide ring. Their morphology has been explained as the outcome of planet-disk interactions, with massive companions carving a cavity and generating a pressure maximum outside their orbital radius where mm grains drift towards and accumulate (e.g., Rice et al., 2006). In some cases, the radial extent of the cavities is too large to be explained by a single planet orbiting on a circular orbit and the presence of multiple giant planets was suggested (Dodson-Robinson & Salyk, 2011; Bae et al., 2019). Other physical mechanisms have also been invoked to explain the lack of dust particles in the inner regions of transition disks, such as internal photoevaporation (e.g. Alexander et al., 2006; Gorti & Hollenbach, 2009; Owen et al., 2010) and dead zones (e.g. Regály et al., 2012; Flock et al., 2015).
High angular resolution observations of these objects at mm wavelengths are crucial to understand the origin of these cavities. The radial and azimuthal brightness distributions of the ring itself can be analyzed as probes of planet-disk interactions, with e.g., asymmetries tracing vortices due to the Rossby Wave instability. Independently of the mechanism clearing the central cavity, it is clear that dust trapping must be occurring in the ring, since mm dust grains would otherwise naturally drift towards the central star. In these rings, the dust-to-gas ratio is expected to be close to unity due to the efficient trapping at the pressure maximum. In such physical conditions, planetesimal formation is thought to occur efficienty via the streaming-instability (e.g., Youdin & Goodman, 2005; Johansen et al., 2007). Subsequent triggering of core-formation via pebble accretion may occur (e.g., Ormel & Klahr, 2010; Bitsch et al., 2015), even though theoretical models suggest that the growth timescales could be too long for this process to be efficient at large distances from the star within the disk lifetime (e.g. Morbidelli, 2020). These rings are likely among the best environments to look for signatures of on-going formation of planetesimals and possibly planetary cores.
| Object | Date | Antennas | Min. baseline | Max. baseline | Time on source | Bandpass calibrator | Phase calibrator | Flux calibrator |
|---|---|---|---|---|---|---|---|---|
| LkCa 15 | 18.11.2018 | 45 | 15 m | 1397 m | 31 min | J0510+1800 | J0426+2327 | J0510+1800 |
| LkCa 15 | 13.07.2019 | 40 | 111 m | 12644 m | 37 min | J0510+1800 | J0431+2037 | J0510+1800 |
| LkCa 15 | 19.07.2019 | 43 | 96 m | 8547 m | 37 min | J0510+1800 | J0431+2037 | J0510+1800 |
| J1610 | 03.09.2019 | 46 | 38 m | 3143 m | 19 min | J1517-2422 | J1551-1755 | J1517-2422 |
| J1610 | 17.07.2019 | 43 | 92 m | 8547 m | 43 min | J1427-4206 | J1551-1755 | J1427-4206 |
| J1610 | 18.07.2019 | 46 | 92 m | 8547 m | 19 min | J1427-4206 | J1551-1755 | J1427-4206 |
Some transition disks have been imaged at high angular resolution at mm wavelengths (mas), showing that the wide rings observed at intermediate resolution are actually composed of smaller-scale features. They show complex morphologies and finer levels of substructure in both radial and azimuthal directions. Multiple rings, spirals, arcs and eccentric features have been detected, showing high level of complexity (e.g., Dong et al., 2018; Andrews et al., 2018; Casassus & Pérez, 2019; Rosotti et al., 2019; Pérez et al., 2019). Interestingly, in the handful of disks that have been observed at similarly high resolution in both scattered light and mm thermal emission, there is no strict correspondence between the morphological features (e.g., Cazzoletti et al., 2018), indicating that the physical processes responsible for these complex morphologies may have different imprints depending on the disk tracer.
In this paper, we present new ALMA Band 6 220 GHz continuum observations of LkCa 15 and 2MASS J16100501-2132318 (EM*StHA 123, EPIC 204630363, hereafter J1610) at unprecedented angular resolution (mas, i.e. au and au in radius for LkCa 15 and J1610, respectively). Both objects are classical T Tauri stars hosting transition disks with resolved cavities (Piétu et al., 2006; Ansdell et al., 2020). Interestingly they are also classified as dippers, based on the short term variability seen in their optical light curves (Ansdell et al., 2016; Rodriguez et al., 2017; Alencar et al., 2018). This photometric variability is interpreted as due to a warp in a misaligned inner disk, possibly due to an inclined magnetic field or a companion on an inclined orbit.
LkCa 15 is a well-studied object, which garnered a lot of attention due to the claims of giant planets in the disk inner cavity (Kraus & Ireland, 2012; Sallum et al., 2015). Recent results show that the emission is however likely due to disk signal (Thalmann et al., 2016; Mendigutía et al., 2018; Currie et al., 2019). Located at a distance of pc (Gaia Collaboration et al., 2018), LkCa 15 is a star, with an age of Myr and accretion rate of yr and a stellar bolometric luminosity of (Donati et al., 2019). Note that previous works used a stellar luminosity of derived with the pre-Gaia distance. Dynamical estimates of the central star matches well to the one estimated from the pre-main sequence track (Qi et al., 2019). The disk is very bright in the mm (380 mJy at m; Andrews et al., 2011), with a dust disk mass of in the optically thin assumption (Isella et al., 2012), and a gaseous disk traced by CO out to au (e.g., Jin et al., 2019). While the disk exhibits a clear dust-depleted cavity at mm wavelengths, of au in radius (e.g., Piétu et al., 2006; Isella et al., 2012; Pinilla et al., 2018), scattered light observations indicate the presence of an inner disk extending up to 30 au within the mm cavity (e.g., Thalmann et al., 2016; Oh et al., 2016). Such a spatial segregation in dust sizes is a natural outcome of planet-disk interactions (Pinilla et al., 2012) and supports the presence of a massive planet orbiting at 40 au.
J1610 is a less studied object. Rizzuto et al. (2015) spectroscopically identified it as a low-mass member of the Upper Sco association. It is located at a distance of pc (Gaia Collaboration et al., 2018) and the star has a K7.5 spectral type, with evidence of accretion from H emission (Ansdell et al., 2016). Using the new Gaia distance, we fit the SNIFS stellar spectrum and broadband photometric spectral energy distribution (SED) from Ansdell et al. (2016) and obtain a stellar luminosity of , with K (more details in Appendix A). By using the Siess et al. (2000) pre-main sequence evolutionary tracks as done by Barenfeld et al. (2016) for a large sample of Class II objects in Upper-Scorpius, we obtain a stellar mass of , where we assumed a metallicity and no convective overshoot. The disk has been detected with the Sub-millimeter Array (SMA) with an integrated flux density of mJy at 1.3 mm (Ansdell et al., 2016), with estimated dust mass of in the optically thin and isothermal assumptions, and has been shown to have a cavity of au in radius from previous moderate resolution ALMA observations (Ansdell et al., 2020).
The paper is organized as follows. In Sec. 2 the observations, data calibration and imaging parameters are presented. Sec. 3 summarizes the data analysis, and Sec. 4 compares the data with hydrodynamical simulations of planet-disk interaction. In Sec. 5 we discuss our results and draw our conclusions in Sec. 6.
2 ALMA observations and data reduction
LkCa 15 and J1610 were observed in Band 6 as part of the ALMA Program #2018.1.01255.S. The observations were carried out with different configurations in order to provide good uv-coverage at different spatial frequencies, using nominal C43-5, C43-8 and C43-9 configurations for LkCa 15, and C43-6 and C43-8 for J1610. Details of the observations are reported in Table 1. The maximum recoverable scale for LkCa 15 and J1610 is and , respectively. The spectral setup had 4 spectral windows, three dedicated for continuum observations in TDM mode, and one dedicated for high spectral resolution observations of the 12CO line. In this paper we focus on the three continuum spectral windows only, which have central rest frequency of 214, 216.2 and 229 GHz.
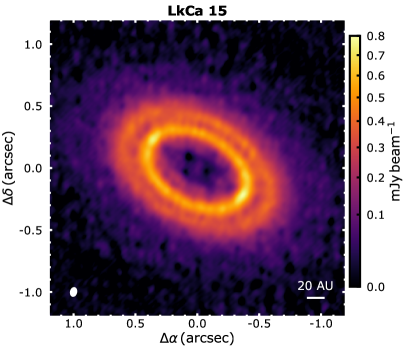
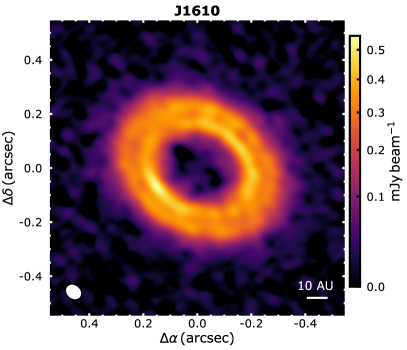
The data were calibrated using the CASA package, version 5.6 (McMullin et al., 2007). Self-calibration was performed on all data-sets, leading to a good improvement in the signal-to-noise (S/N) ratio. The visibilities were merged using the concat task in CASA, and spectrally re-binned on MHz channels to avoid bandwidth smearing. Images in the sky plane were produced using the tclean task, with the multiscale cleaning algorithm allowing for point source emission. Elliptical masks were applied, with position angle and inclination derived from -plane analysis (see Sec. 3.2), and a semi-major axis of and for LkCa 15 and J1610, respectively. The de-convolution was performed down to a cleaning threshold of , which maximises the flux in the clean model. The residuals in the final images were rescaled by the ratio of the clean beam and dirty beam (Jorsater & van Moorsel, 1995), which reduced the rms noise level by . This is to correct for the fact that the final image is the sum of the restored clean components (in units of clean beams) and of the residuals (in units of dirty beams); to properly estimate the flux of the residuals, a re-normalization factor equal to the ratio of the two beam areas is applied to them. This method has been successfully applied in Very Large Array (VLA) surveys such as THINGS (Walter et al., 2008), and more recently by Pinte et al. (2020) on ALMA data of protoplanetary disks. Different weighting schemes were tested to produce the images. The best compromise between angular resolution and S/N for LkCa 15 is with a Briggs robust weighting of 0, whereas for J1610 we opted for a Briggs robust weighting of 0.3. The resulting synthesized beam for LkCa 15 is mas, with a position angle (P.A.) of . The rms noise level is Jy beam-1, as estimated from an annulus centered in the phase center with a range in radii, and the image has a signal-to-noise (S/N) ratio of at the peak. For J1610, the synthesized beam is mas with a P.A. of , and the rms noise level is Jy beam-1. The S/N at the peak is . The recovered flux density within the cleaning mask is mJy and mJy for LkCa 15 and J1610, respectively. For both disks, the integrated flux densities are in agreement with previous observations at the same wavelength with different interferometers within the 10% calibration uncertainties, in particular the IRAM PdBI array and CARMA for LkCa 15 (Piétu et al., 2006; Isella et al., 2012) and SMA for J1610 (Ansdell et al., 2016). The resulting images are shown in Fig. 1.
3 Results
3.1 Images
The intensity maps reported in Fig. 1 clearly show that the two transition disks have substructure, with the bright mm ring observed in earlier observations separating into distinct multiple rings. Two clear rings are easily observable by looking at the images, and they look remarkably similar in the two disks. One major difference is that the rings observed in J1610 would lay within the cavity of LkCa 15, due to their different angular scales. Compared to other transition disks observed at high angular resolution, these two disks do not show high level of asymmetry, lacking prominent arcs and spirals features as observed for example in massive disks around Herbig stars as HD135344B (Cazzoletti et al., 2018) and MWC758 (Dong et al., 2018). However, both disks present azimuthal asymmetries along the North-West – South-East direction, and they are particularly evident in J1610.
Radial profiles.
In order to analyze the intensity profile, the intensity maps are re-centered, deprojected and azimuthally averaged using the geometrical parameters reported in Tables 2-3 and determined from fitting the visibilities. Details of the geometrical parameters determination can be found in Sec. 3.2. Radial bins of mas are used, and errors are computed as the quadratic sum of the standard deviation of the intensity across pixels in each radial bin and the rms of the observations divided by the square root of the number of independent beams sampling the same radial bin in the azimuthal direction.
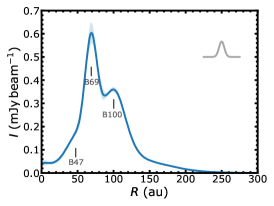
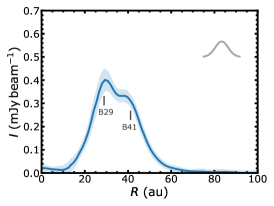
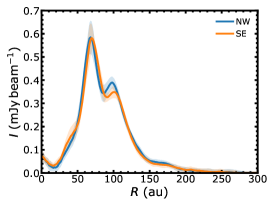
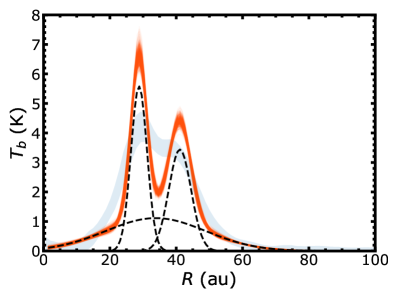
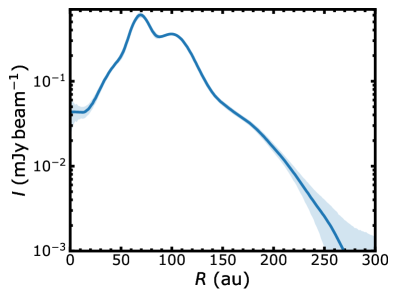
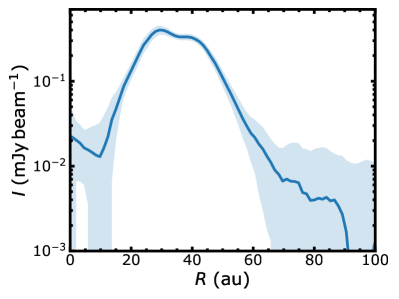
The resulting intensity profiles are reported in Fig. 2 and show radial substructure, with two narrow rings emerging in both LkCa 15 and J1610, and an underlying extended broad component. A figure with the same profiles in logarithmic scale highlights the faint extended emission (Fig. 10). The intensity peak of the outer ring is always fainter than the inner ring peak, which can be explained by a drop in dust temperature and/or optical depth. On average, the outer ring is brighter in the NW side of the disk by (Fig. 2, right) with the NW side being the close side of the disk to the observer (Thalmann et al., 2015). This same effect seems to be even more pronounced in lower resolution band 9 data (van der Marel et al., 2015), and may be indicative of azimuthally asymmetric illumination of the disk due to shadowing (Thalmann et al., 2016).
In LkCa 15, the inner ring shows a ‘shoulder’ extending inwards in the cavity, similarly to other transition disks imaged at high angular resolution (e.g., Pérez et al., 2019; Huang et al., 2020). The shoulder might indicate the presence of a ring unresolved at the spatial resolution of the observations. Interestingly, this structure is slightly more prominent in the South-East side of the disk, as shown in Fig. 2, right, suggesting that it is azimuthally asymmetric. Other disks have shown asymmetric structure reminiscent of streamers or filaments trailing a major symmetric dust ring (Isella et al., 2018; Pérez et al., 2019), but the spatial resolution of the observation of LkCa 15 impedes a similar characterization of the morphological feature. Both disks show a shallower tail in the outer regions, which has been already observed in LkCa 15 and other transition disks (e.g., Pinilla et al., 2018; Jin et al., 2019), in agreement with radial drift models predicting a smaller maximum grain sizes in the outer regions of the disk, leading to lower opacities at mm wavelength. In both cases, this extended emission shows a shoulder (meaning an intensity profile with negative second derivative), which may be tracing a shallow ringed structure at large radii. These outer shoulders are located at au and at au in LkCa 15 and J1610, respectively.
| Disk geometry | |||||
|---|---|---|---|---|---|
| PA | |||||
| RA | (mas) | ||||
| Dec | (mas) | ||||
| Ring parameters | B47 | B69 | B100 | Broad component | |
| (Jy/steradian) | |||||
| (au) | |||||
| (au) |
| Disk geometry | ||||
|---|---|---|---|---|
| PA | ||||
| RA | (mas) | |||
| Dec | (mas) | |||
| Ring parameters | B29 | B41 | Broad component | |
| (Jy/steradian) | ||||
| (au) | ||||
| (au) |
Emission within the cavity.
The cavities of both disks present low levels of emission (see Figs. 2 and 10). In the following, we refer to an uncertainty driven by the nominal rms given in Sec. 2, and estimated in the outer regions of the maps. We note that it might underestimate the rms in the inner regions, for which deconvolution errors are significant due to the high dynamic range. J1610 does not show clear centrally-peaked emission, with an average surface brightness within the cavity of . LkCa 15 also shows a low surface brightness distributed within the whole cavity, but with clear inner disk unresolved emission located at the center, with a peak intensity of Jy beam-1, reaching a S/N. The total flux within an area slightly larger than one beam (with same PA, and major and minor axes 1.2 larger than the ones of the beam) leads to a flux density of Jy. Isella et al. (2014) also detected a point source at the center of LkCa 15 with VLA observations at 7 mm with 70 mas resolution, with a flux density of Jy. Taking into account a 10 uncertainty in the flux calibration of both the VLA and the ALMA observations presented in this paper, and assuming that the errors are Gaussian, we obtain a spectral index of between 1.35 and 7 mm. This low value is incompatible with emission due to dust thermal radiation alone, and suggests that at 7 mm there may be a contribution from either free-free or synchrotron emission by the ionized gas in the proximity of the central star (Panagia & Felli, 1975; Reynolds, 1986).
 |
 |
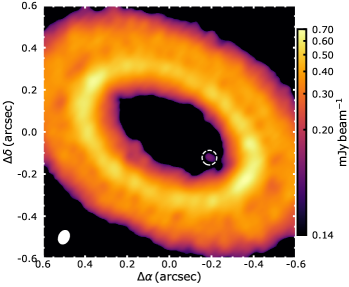
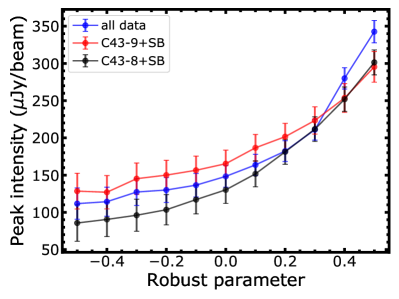
The LkCa 15 image additionally presents a localized, unresolved, bright emission within the cavity, at a radius of (au) and along a position angle of (see Fig. 13, left). The overbrightness is seen when imaging the disk with different weightings, in particular with robust parameter that allows to separate it from the inner bright mm ring. To verify whether it is an imaging artefact, we measure the peak intensity at the location of the feature when imaging the disk with different weighting schemes, in particular with Briggs weighting and robust parameter ranging from 0.5 to -0.5. The results are shown in Fig. 13, right panel. The peak intensity varies with imaging parameters, ranging between to Jy beam-1 (for robust parameter -0.5 and 0.3, leading to a nominal S/N of and , respectively). This suggests that the feature is likely an imaging artefact, since the peak intensity of an unresolved point source should not vary with resolution element. However, considering the proximity of the over-intensity to the bright mm ring, we expect the peak intensity to decrease with increased angular resolution as they are better separated. We discuss this further in the uv-plane analysis in Sec. 3.2. This discussion highlights the challenges of detecting faint point sources within cavities of transition disks, due to the high dynamic range and image reconstruction artefacts. Deeper observations with different array configurations and possibly different frequencies are needed to reach a final conclusion about the nature of these faint features, which can be interpreted as circumplanetary disks. Even more convincing cases, as the one of PDS 70c (Isella et al., 2019), still need confirmation with new observations.
3.2 Modelling of the continuum emission
In order to better characterize the continuum emission described in Sec. 3.1, we model the intensity maps in the -plane. We describe the continuum brightness distribution of LkCa 15 and J1610 by fitting the visibility points using an axisymmetric parametric model that consists in a set of radially Gaussian rings. The brightness profile of each model follows:
| (1) |
where is the number of rings considered, is the peak intensity at radius , is the ring width. As each ring has three free parameters (, and ), the model has 3 free parameters, plus four global disk parameters that are fitted for all rings together: the disk inclination (), position angle (PA) and offset from the phase center (RA, Dec). Inspired by the image analysis (Sec. 3.1), the model consists in a broad ring and 3 or 2 narrow rings for LkCa 15 and J1610, respectively, and is described with 16 and 13 free parameters, respectively. Flat priors are used for all parameters, with the constraint that one of the Gaussian rings has , in order to reproduce the broad component at large radii. For each set of parameters, the Fourier transform of the model image is computed and sampled in the points of the dataset using GALARIO (Tazzari et al., 2018). We sample the posterior distribution of our parameters with the emcee package (Foreman-Mackey et al., 2013) with 160 walkers over 10000 steps after 2000 steps of burn-in.
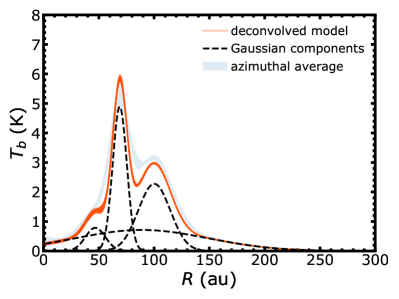
Tables 2 and 3 report the parameters of the maximum likelihood model for both targets, as well as statistical uncertainties for each parameter estimated from the 16th and 84th percentiles of the marginalized distributions. The error estimates have been computed after thinning the chains to avoid dependant samples in the posterior distributions. The brightness distribution of LkCa 15 is well represented by 3 narrow Gaussian rings centered at 47, 69 and 100 au (with widths between 6 and 14 au) and a broad component centered at 89 au with a width of au. In J1610, a similar morphology leads to a good fit, with two narrow 2-3 au-wide Gaussian rings located at 29 and 41 au and a broad component with a width of au. The similar width of the two Gaussian rings in J1610 suggests that the estimated width of the rings is limited by the angular resolution of the observations (the FWHM of the beam along the minor axis is ). The Gaussian curves composing the best-fit models are shown in dashed lines in Fig. 3.
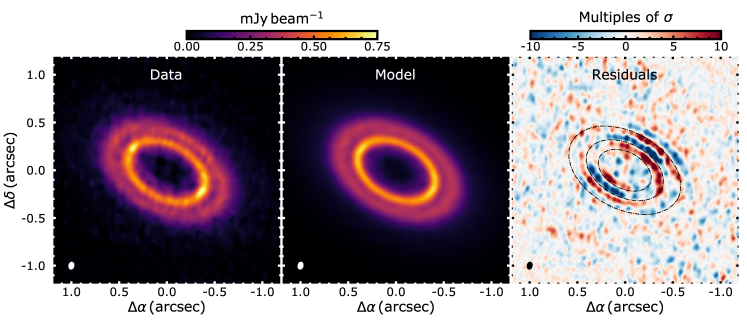
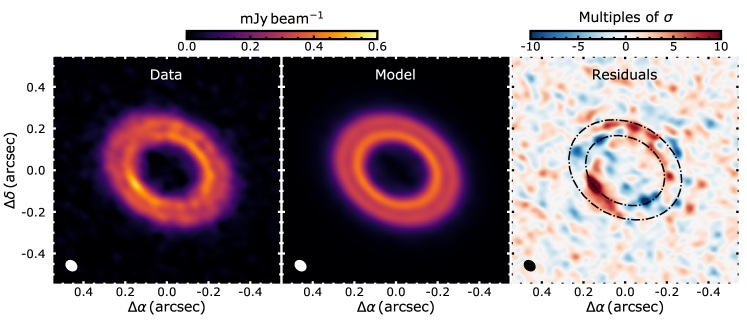
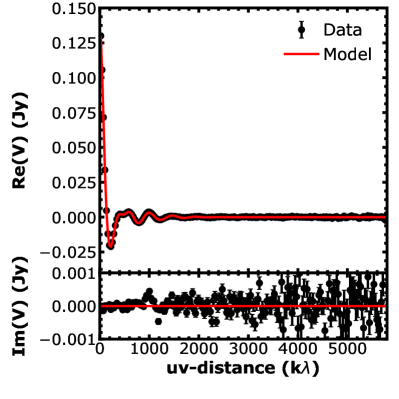
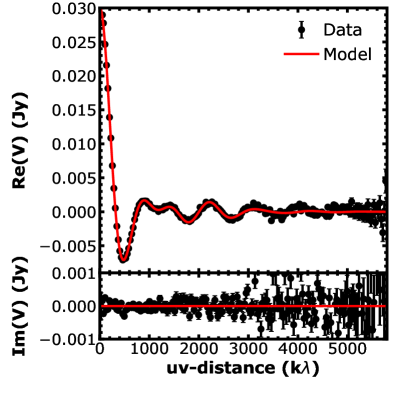
Figure 4 provides the images of the data, model and residuals for the best-fit model, synthesized with the same imaging parameters. The comparison between the observed visibilities and the model as a function of distance are shown in the Appendix (Fig. 11). While the models reproduce well the overall morphology of the emission for both targets, residuals are found at high spatial frequencies. In LkCa 15, at the 10 level, residuals are found slightly inwards and outwards of the rings indicating a more complex morphology than prescribed with a Gaussian. The width of the rings in LkCa 15 is larger than the resolution element, indicating that the rings are partly resolved and deviations from a Gaussian profile can be detected with these observations. Interestingly, both negative and positive residuals are mostly seen along the minor axis, which indicates that the intensity prescription is a good representation of the data where the linear resolution is maximum (along the major axis). The residuals along the minor axis can be explained by projection and radiative transfer effects with a finite ring vertical thickness (see also discussion in Huang et al., 2020). The NW over-brightness in both B69 and B100 is apparent in the residuals, as is the azimuthal asymmetry in the inner shoulder (B47). This confirms the analysis in the image plane, with the shoulder being more prominent in the SE side of the disk (Fig. 2, right). In J1610, the largest residual is azimuthally broad and located in the SE. Interestingly, the positive and negative residuals are mostly located along almost perpendicular directions (minor and major axis, respectively) which could be related to shadowing by the inner disk, as seen in DoAr 44 (Casassus et al., 2018). In both disks, the outer shoulder at au and au is not seen in the residuals (nor in their azimuthal average), with the extended Gaussian component reproducing the intensity profile within . Deeper observations might be needed to test whether they can be attributed to shallow rings at large distance from the star.
Within the central cavities, no residuals are found above the level. The models shown in Fig. 3 both present low surface brightness emission within the cavities. Such prescription works well in both cases, even though the S/N within the cavities is low enough in both disks that other functional forms could have been equally representative of the intensity distribution. In LkCa 15, the point like feature discussed in Sec. 3.1 is not recovered in the residuals above , suggesting again that this is due to an imaging artefact driven by the high dynamic range of the observations.
4 Comparison with hydrodynamical simulations
In this section, we aim to study the conditions for the formation of multiple rings in transition disks that host an inner dust-depleted cavity. We assume that the rings are caused by the interaction with a planet located at the pressure maximum at the edge of the central cavity. We use the better resolved LkCa 15 as a test case. We stress that our goal is not to reproduce a perfect match with the observations, since this would not imply that the solution is unique and would require fine-tuning of the hydrodynamical simulations while lacking possibly relevant physical mechanisms.
4.1 Set-up
We adopt a parameterized initial gas surface density profile based on the analysis of low-resolution 12CO (=3-2) observations of LkCa 15 by Jin et al. (2019), which well reproduces the inner cavity imaged at lower angular resolution. The profile we use follows
| (2) |
where au, , and . We choose so that the total gas disk mass inside of 600 au is . We point out that our choice of au differs from the best-fit value of Jin et al. (2019), au. We need to adopt au because grains are aerodynamically dragged towards the pressure peak near and form a ring there; with au, hydrodynamical simulations show that a ring forms at a too-small radius compared with the continuum observation.
Using the surface density profile described as in Eq. (2), we create the initial disk temperature by running iterative Monte Carlo radiative transfer (MCRT) calculations using RADMC-3D (Dullemond et al., 2012), following the method described in Appendix A of Bae et al. (2019). To briefly summarize, this iteration finds self-consistent three-dimensional density and stellar irradiation-dominated temperature structures that satisfy the hydrostatic equilibrium. We assume of total dust mass distributed among grains with sizes between m and 1 cm, adopting a power-law size distribution with power-law exponent of . We further assume that small dust grains having sizes between 0.01 and 1 m are perfectly coupled with disk gas and determine the disk temperature profile. This small grain component has total with the assumed power-law size distribution. For the small grain composition, we assume that they are compact monomers consist of silicate and amorphous carbon, having an internal density of . We adopt optical constants of silicate and amorphous carbon from Draine & Lee (1984) and Li & Greenberg (1997), respectively. We assume a stellar radius of and an effective temperature of 4500 K (Donati et al., 2019) for the MCRT iterations. Each iteration runs with photon packages.
The resulting density-weighted, vertically integrated temperature from the MCRT iterations is presented in the Appendix in Fig. 12. Note that the disk temperature drops rapidly around the location of the density peak at 65 au as stellar photons are scattered/absorbed at the wall outside of the inner cavity. Adopting a stellar mass of (Donati et al., 2019) and a mean molecular weight of 2.4, the disk aspect ratio between 30 and 300 au can be well described by the following functional form:
| (3) |
4.2 Hydrodynamical simulations
We carry out two-dimensional hydrodynamical simulations using the Dusty FARGO-ADSG code (Baruteau et al., 2019). This is an extended version of the publicly available FARGO-ADSG (Masset, 2000; Baruteau & Masset, 2008a, b), with Lagrangian test particles implemented (Baruteau & Zhu, 2016). The simulation domain extends from 20 to 300 au in the radial direction and covers the entire in azimuth. We adopt 672 logarithmically-spaced grid cells in the radial direction and 1556 uniformly-spaced grid cells in the azimuthal direction. With this choice, one scale height at the location of the planet is resolved with 22 grid cells in both radial and azimuthal directions. A wave-damping zone (de Val-Borro et al., 2006) is implemented at both inner and outer radial boundaries. The disk viscosity is characterized by a uniform viscosity parameter , where , with being the local sound speed.
We insert a 60 Earth-mass planet at 70 au, at the radial location of the middle continuum ring in the LkCa 15 disk, assuming a fixed circular orbit. This planetary mass has been chosen after running a coarse grid of different planet masses: 30, 60, and 90 . In short, with the viscosity considered in the model, a planet does not create any rings and gaps, whereas a planet creates a qualitatively similar morphology to a planet in terms of the number of rings and gaps, while the contrast between rings and gaps is much larger. A more general discussion about the model degeneracy can be found in Sec. 5. We note that we are agnostic about the origin of the inner cavity and we do not introduce additional planets in the inner cavity, since this would introduce a high number of additional free parameters.
Simulations are run for 1000 planetary orbits (0.52 Myr), by which time the gas and particle distribution reached a quasi-steady state. After this period, we insert Lagrangian test particles between 50 and 150 au, with a uniform dust-to-gas mass ratio of across this radial region, and we run simulations for additional 300 planetary orbits. The size of the test particles is uniformly distributed between 1 m and 1 cm in logarithmic space. The mass of each test particle is determined such that, at each radius in the disk, the dust mass is distributed over a range of dust sizes, from 1 m and 1 cm to have the mass per interval in be proportional to , consistent with a dust size distribution of . We assume a dust bulk density of , which corresponds to the density of aggregates with silicate matrix and water ice. The bulk density is lower than that of sub-m grains responsible for the thermalization of the stellar radiation (see Sec. 4.1), since for the small dust grains in the upper layers of the disk we do not expect ice-coating.
Recent numerical simulations of planet-disk interaction have shown that the propagation and dissipation of planet-driven spiral waves and the number and depth of associated gaps strongly depend on the thermal properties of the disk gas, in particular the cooling timescale of the disk gas (Miranda & Rafikov, 2019; Zhang & Zhu, 2020; Weber et al., 2019; Ziampras et al., 2020). Inspired by these studies, we run three hydrodynamical simulations: (1) a locally isothermal simulation, adopting an isothermal equation of state (hereafter isothermal model); (2) an adiabatic simulation, adopting an adiabatic equation of state with an adiabatic index and (hereafter model), where is defined as the multiplication of the cooling time and local orbital frequency , ; and (3) an adiabatic simulation with and (hereafter model). In and models, the disk temperature is relaxed toward the initial temperature over the cooling timescale .
4.3 Model results
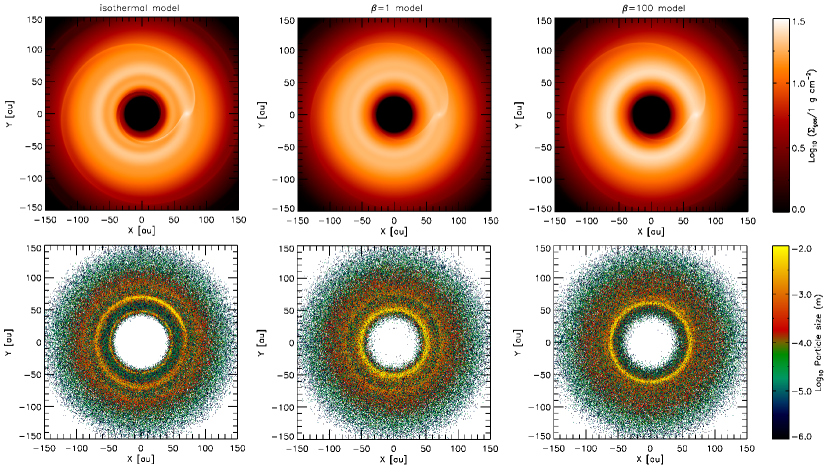
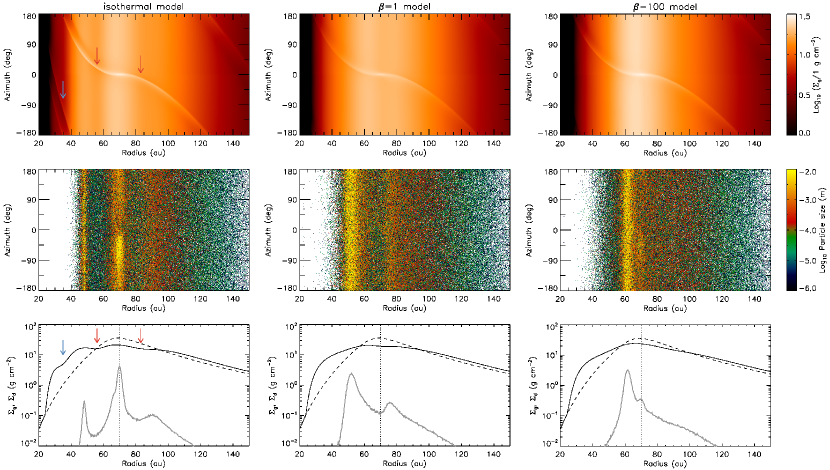
In Fig. 5, we present two-dimensional disk surface density and particle distributions. Gas and particle distributions in a radius - azimuthal angle plane, along with azimuthally-averaged radial profiles of gas and dust surface density, are shown in Fig. 6.
In the isothermal model, the inner and outer primary spiral arms (indicated with red arrows in Fig. 6) create shocks at au from the planet, which corresponds to about scale heights at the radial location of the planet. This is in a good agreement with the shock distance predicted by linear theory (Goodman & Rafikov, 2001). A secondary spiral arm forms in the inner disk (indicated with blue arrows in Fig. 6) and creates shocks around 35 au. As these spiral arms form they generate shocks, opening gaps in the disk (Bae et al., 2017). The gas pressure has local maxima between the gaps and beyond the outer gap at 48, 70, and 90 au, around which radii particles are aerodynamically dragged and trapped. Therefore, the planet generates three rings and two gaps in the dust disk, and the planet is embedded in the middle ring. In addition, within the co-rotation region, large particles ( cm) are preferentially collected around one of the Lagrangian points, L5, which locates behind the planet, leading to azimuthal asymmetries in the density distribution of large grains.
In model, the planet opens a single, broad gap around its orbit. This distinct feature of single gap opening around a sub-thermal-mass planet is known to happen when as linear damping plays a more important role in angular momentum transfer than non-linear shock dissipation (Miranda & Rafikov, 2019; Zhang & Zhu, 2020). As a result, two gas pressure peaks form in this model, one at the outer edge of the inner cavity at 52 au and the other beyond the gap at 75 au. The planet is embedded within the gap, sandwiched by two dust rings.
In model, the disk behaves nearly adiabatically and the perturbation driven by planet-driven spiral arms is much weaker compared with the isothermal model (Miranda & Rafikov, 2019; Zhang & Zhu, 2020). A secondary spiral arm forms in the inner disk around au, but the density perturbation driven by the spiral arm is much weaker compared with that seen in the isothermal model. With a finite viscosity implemented in the simulation (), neither primary nor secondary spiral arms open a gap. The gas pressure peaks slightly inward of the planet’s orbit, at 62 au. Large particles ( cm) are collected around Lagrangian point L5, similar to the isothermal model.
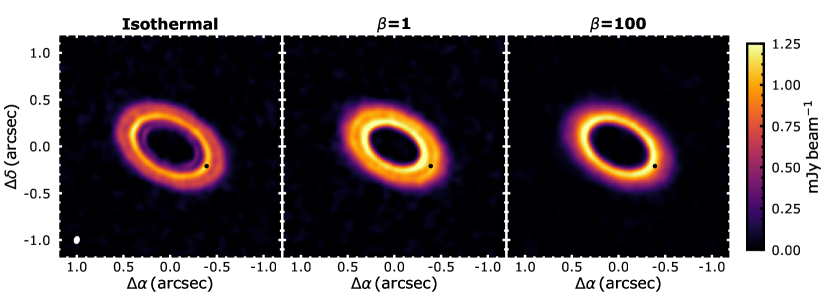
Based on the three models, we generate simulated continuum images. We first create 50 logarithmically-spaced grain size bins between m and 1 cm and compute the surface density of each grain component at each simulation grid cell. We then expand the dust disk vertically, assuming that grains are in a hydrostatic equilibrium within isotropic turbulence characterized by and have a Gaussian distribution. With this assumption, the scale height of dust particle having size , , can be written as
| (4) |
where St is the Stokes number of the particle (Birnstiel et al., 2010). The raw continuum emission is obtained with RADMC-3D (Dullemond et al., 2012), considering both absorption and anisotropic scattering using the Henyey–Greenstein approximation. We note that scattering dominates the continuum emission in the simulated observations, supporting recent explanations to low optical depths estimated in spatially resolved continuum observations (Zhu et al., 2019). We assume a distance of 158.9 pc and disk inclination and P.A. of and , respectively. We then convolve the raw images with the same synthesized beam used for the LkCa 15 observation (i.e., 6847 mas with a P.A. of ) and add random noise at the same level to the observation (i.e., Jy beam-1).
The resulting simulated continuum images are presented in Fig. 7. As shown, a planet can produce diverse continuum morphology depending on the disk’s cooling timescale. In the isothermal model, the planet generates three continuum rings separated by two gaps. The planet is embedded in the middle ring. In model, the planet opens a gap and two rings. The planet is embedded in the gap. In model, the disk appears as if it does not have any planets beyond the cavity; the disk is well characterized by the inner cavity and a single ring without footprints from the planet.
5 Discussion
Rings in transition disks.
About 40 disks that have been observed at moderate angular resolution (0.2-0.4″) show evidence for dust depleted inner cavities with radius of a few tens of au (e.g., Pinilla et al., 2020). A few of these disks have been observed at about ten times better resolution and present small scale substructure beyond their cavity (e.g., Kudo et al., 2018; Pérez et al., 2019; Huang et al., 2020). All of them host multiple rings, up to four (Pérez et al., 2019), except HD 100453 that is a known binary system. In addition to rings, some targets show localized azimuthal asymmetries (Pérez et al., 2018; Dong et al., 2018). Although the number of transition disks observed at high resolution is significantly lower than those of classical disks with no cavity (e.g., Andrews et al., 2018), it seems that rings are the most common type of substructure also in transition disks as in classical disks (Huang et al., 2018). These rings are likely tracing the trapping of dust grains (Dullemond et al., 2018), possibly as a consequence from the presence of companions located inside the cavity. This enables to maintain a significant dust mass in the outer disk over few million years, as mm dust particles would otherwise rapidly drift towards the star (e.g., Brauer et al., 2008). While most of the rings in transition disks can be well modelled with a radial Gaussian profile, some objects clearly show a strong asymmetry in their innermost ring, with an additional shoulder located inwards (in LkCa 15 and HD 169142; this paper, Pérez et al., 2019) or outwards of the ring (as in DM Tau and GM Aur; Kudo et al., 2018; Huang et al., 2020). Higher angular resolution (and possibly longer wavelengths to avoid optical thickness) will help determining the nature of these peculiar morphologies, which may be connected to the physical mechanism carving the prominent cavities in these disks. At the same time, outer rings show shallower profiles in the outward direction. This is the case for B100 and B41 in LkCa 15 and J1610, respectively. These radial asymmetries in the intensity profile of dust rings are of particular interest to discern what is causing them. Indeed gaps generated by planets are expected to create an asymmetric pressure profile, which would lead to skewed rings in the dust (e.g., Dullemond et al., 2018). This is even more pronounced when different grain sizes of dust are considered in the modelling, with large grains well confined at the pressure maximum but smaller grains tracing the underlying gas surface density (e.g., Pinilla et al., 2018). Pinilla et al. (2018) also showed how this effect can depend on the stellar mass. A larger sample of transition disks spanning different stellar and disk properties imaged at high angular resolution would help understand the physical origin of this common feature in the intensity profiles.
Optical depth.
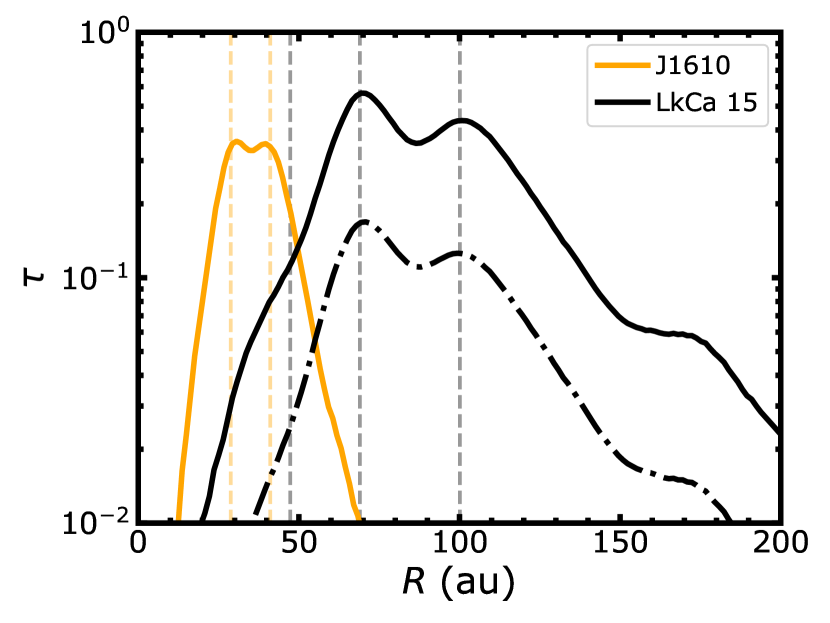
From the intensity profiles, we compute optical depth profiles under the assumptions of a uniform opacity across the disks, and that the albedo of the dust grains is negligible. The optical depths have been computed from:
| (5) |
with being the Planck function at the frequency of the observations, and being the azimuthally averaged intensity profile derived in Sec. 3. For LkCa 15 two midplane temperatures are used in the calculation, the one computed with the radiative transfer model discussed in Sec. 4 (see Eq. 3), and one expression used to derive optical depth profiles in the DSHARP large program (Andrews et al., 2018; Huang et al., 2018):
| (6) |
where in the Stefan-Boltzmann constant, and is the flaring angle, which we set equal to as in Huang et al. (2018). Only this temperature profile has been used for J1610. The rings appear as marginally optically thick, with peak values ranging between 0.18 and 0.6 (depending on the exact temperature structure) for LkCa 15, and being for J1610. The optical depth profiles are shown in Fig. 8, where LkCa 15 is presented with two curves based on different temperature profiles. A maximum optical depth of is remarkably similar to the ones obtained in other studies (Huang et al., 2018; Facchini et al., 2019). This may be caused by the presence of very large grains with significantly high albedo, with the optical depth peak derived from Eq. 5 being a lower limit in the absence of scattering (e.g., Liu, 2019; Zhu et al., 2019). Indeed, it is scattering what dominates the simulated continuum images presented in Figure 7. Observations at multiple wavelengths (more than 2) are needed to estimate how important scattering can be at mm wavelengths (e.g., Carrasco-González et al., 2019; Huang et al., 2020) and whether it can explain the observational result of roughly uniform maximum optical depth in rings and inner regions across different disks. Stammler et al. (2019) instead proposed that a maximum optical depth of can be driven by streaming instability self-regulating the dust-to-gas ratio within pressure maxima (see also Dullemond et al., 2018), which would be indirect evidence of planetesimal formation with the dust rings observed with ALMA. To disentangle between these different possibilities, multi-wavelengths observations at high spatial resolution are needed.
Dust masses and planetesimal formation.
From the optical depth profiles, it is possible to compute the amount of dust present in the rings by knowing that . For a given temperature profile and a given opacity, these values represent a lower limit, since we assume negligible albedo of the dust grains. The largest uncertainties lay in the dust opacity estimates, with values being unknown within 1 dex from the value we assume. From the opacity laws used in Sec. 4, we have an absorption opacity of 2.6 cm2 g-1 at 1.3 mm. For LkCa 15 we compute the mass of B47 and B69 together, integrating the optical depth profile between 19 and 88 au. As for B100, we compute the dust mass between 88 and 150 au. By using the temperature profile of Eq. 3, we obtain dust masses of 51 and for B47+B69 and B100, respectively, whereas using the temperature profile of Eq. 6 leads to dust masses of 32 and for the same regions. We integrate the optical depth profile of J1610 between 9.7 and and 35.8 au for B29 and between 35.8 and 72.2 au for B41, obtaining 10 and respectively.
These disks are still retaining a large amount of dust mass in this phase of their evolution, and planetesimal formation within these radially confined regions may still be operational via streaming instability (e.g., Youdin & Goodman, 2005; Johansen et al., 2007). In order to assess whether planetesimal formation via streaming instability may be occurring within the dust rings, we need to compare the gas with the dust surface density within the dust rings. We use the dust surface density computed from the optical depth profile, and we compare it with the upper limit of the gas surface density at the location of the dust rings. In order to have a physically motivated upper limit, we require that the disk is not locally gravitationally unstable, since this would develop spiral structures that we do not see in the ALMA images (e.g., Kratter & Lodato, 2016):
| (7) |
where is the local sound-speed, is the Keplerian angular velocity and is the gas surface density. The sound speed is estimated from Eq. 6. With these calculations, we find that for LkCa 15, the dust rings B69 and B100 show that at their intensity peaks, respectively. As for J1610, B29 and B41 present . If local turbulence is driven by the streaming instability itself, planetesimals are expected to form whenever (e.g., Bai & Stone, 2010), in which case the upper limits we obtained for LkCa 15 are intriguingly close to this value. If instead an additional turbulence component is present, the vertical settling of dust grains is reduced and the nominal condition for planetesimal formation to occur is less stringent (e.g., Gole et al., 2020). Note, however, that the co-existence of vertical turbulent motions as driven by other instabilities as the vertical shear instability or magneto-rotational instability may promote rather than suppress planetesimal formation (Johansen et al., 2007; Schäfer et al., 2020).
A possible way to derive information about the gas turbulence in disks is to determine how radially (or vertically) confined dust grains are in disks. In the following, we look at the radial concentration of dust particles at the rings locations in the assumption that these are dust traps. We follow the arguments of Dullemond et al. (2018) to characterize radially resolved rings in the DSHARP sample. First of all, we compute how radially confined the dust rings are, in order to have a lower limit on the combination of the turbulence viscosity and the characteristic grain size within the rings. Dullemond et al. (2018) showed that:
| (8) |
where is the Stokes number of the characteristic dust grain size entrained in the ring (we can think at the characteristic size as the one dominating the emission at the observed wavelength), and and are the widths of the gas and dust components of the rings, approximated as radial Gaussian profiles in the proximity of the rings. While Dullemond et al. (2018) computed the dust Gaussian widths by fitting the rings from the imaged radial intensity profiles, we use the ones obtained from the -plane fitting (values are reported in Tables 2). As for the gas Gaussian widths, we determine lower and upper limits using the same arguments as in Dullemond et al. (2018). The lower limit is the maximum value between the local pressure scale height and the Gaussian dust width. To estimate the pressure scaleheight, we use the temperature profile from Eq. 6, and derive knowing that:
| (9) |
with being the molecular weight and being the hydrogen mass. The upper limit is set such that the distance between the two rings is larger than the full-width-half-maximum of the gas Gaussian profile. Given that the rings in J1610 are likely unresolved even in the -plane analysis (see Sec. 3.2), we can determine upper limits only on . In particular, we obtain an upper limit of for B41 in J1610, and a lower limit of for B69 in LkCa 15. These values are in general agreement with the results on the DSHARP sample (Dullemond et al., 2018), possibly suggesting that dust confinement within rings in full or transition disks may be similar. Additional information could be derived by having higher angular resolution observations on J1610 to radially resolve the rings, having multi-wavelengths datasets to translate into a physical grain size, and having direct measurements of the ring widths in the gas component determining the pressure profile through kinematical analysis (e.g., Teague et al., 2018; Rosotti et al., 2020).
Planet-disk interactions.
In Sec. 4 we explored the possibility that multiple rings in transition disks are footprints of an embedded planet, while we have also shown that disk thermodynamics alone can drastically change the morphology in the mm-continuum emission. What is the cooling timescale in disks? Adopting the gray atmosphere approximation (Hubeny, 1990) and assuming that the disk temperature is dominated by stellar irradiation, the cooling timescale can be estimated as (see e.g., Zhu et al., 2015)
| (10) |
or
| (11) | |||||
| (13) | |||||
where is the specific heat capacity of gas, is the gas constant, is the mean molecular weight, and . With the initial disk conditions described in Sec. 4 and a range of Rosseland mean opacity value of , the cooling parameter at 70 au in the LkCa 15 disk is . Note that we adopted a range of Rosseland mean opacity value as it requires a proper knowledge of the dust size distribution which depends upon a variety of physical processes and parameters, including the dust fragmentation velocity, the level of disk turbulence, dust internal density, and underlying gas density and temperature (Birnstiel et al., 2018). In addition, the dust-to-gas mass ratio as well as the dust size distribution can evolve over time as a planet redistributes dust particles around its orbit. Nevertheless, this simple estimation shows that deviations from the isothermality, which previous studies have shown to occur for (Miranda & Rafikov, 2019; Zhang & Zhu, 2020), are likely to happen in protoplanetary disks and should be considered when modelling their observations with hydrodynamical simulations.
In addition to disk’s thermodynamic properties, many other parameters and physical processes also play a role in determining the location and appearance of the mm-rings generated by the planet-disk interactions. Among others, the underlying gas density structure, disk temperature, turbulence, planet mass, grain properties, dust feedback, orbital migration. This shows how challenging it is to retrieve planet mass and location by analysing the properties of rings in disks (in the hypothesis that these are the outcome of planet-disk interactions). At the same time, the resemblance of the morphological features observed in disks with the results of hydrodynamical simulations of planets-disk interactions is surprising, and suggests that rings in disks are (at least in part) generated by planets. The level and morphology of substructures in transition disks, and in particular LkCa 15 and J1610, suggest that the observed morphology can be caused by low mass planets that are formed within massive dust rings. Even though we have been agnostic on the mechanism generating the inner cavity by using a prescribed gas surface density, in the assumption of massive planets clearing the inner cavity it is reasonable to speculate that the resulting dust trapping can generate secondary planet formation from the inside-out, with planetary cores forming in dust traps created by the inner and more massive planet. However, we point out that planetary core formation via pebble accretion within dust rings at large distances from the central star ( au) may be challenging due to the long dynamical timescales (e.g., Morbidelli, 2020).
Snow lines.
While our model shows that a low mass planet is able to reproduce the observed features, planet-disk interactions are not the only means to form annular structure in disks. Among the numerous models proposed, dust properties and opacities are expected to vary at the ice lines of abundant chemical species, with physical mechanisms such as outward diffusion and sintering accentuating the contrast outside the ice-lines (Stevenson & Lunine, 1988; Okuzumi et al., 2016). While surveys of disk annular substructures did not find any correlation between the location of the rings with estimated ice lines location in disks when using simple temperature prescriptions (Huang et al., 2018; Long et al., 2018), indicating a different origin for most rings, some of them might still be induced at condensation fronts. N2H+ is a molecule known to be abundant between the CO and N2 ice lines (e.g., Qi et al., 2013; van ’t Hoff et al., 2017), and most importantly it traces the location of the ice lines without needing to assume a temperature or a desorption temperature of the two molecules. Qi et al. (2019) observed N2H+ in LkCa 15, showing that this ion is particularly abundant between and au. These radii are just inwards of the B69 and B100 rings, respectively, and it may suggest that the two rings are formed by condensation of these two abundant molecules. However, as noted by Huang et al. (2020) in the similar case of GM Aur, the scattered light data by Thalmann et al. (2016) do not show clear rings co-located with the ones observed in ALMA. This seems to favour a planetary origin of the rings, rather than chemical, since in the first case rings in scattered light are predicted to be less pronounced than at mm wavelengths, whereas in the second case the opposite is expected (Pinilla et al., 2017). Interestingly, both GM Aur and LkCa 15 show a faint outer ring in N2H+ emission at 200 and 220 au, respectively (Qi et al., 2019), and at the same time show an outer shallow ring/shoulder in the continuum intensity profile interior of the molecular ring (at and au, respectively), as shown in this paper and in Huang et al. (2020). It is likely that the outer N2H+ ring is related to a radial thermal inversion in the proximity of the dust outer radius which in turns leads to CO being released into gas phase again (e.g., Facchini et al., 2017); however, it would be worth exploring whether there is any potential connection between outer CO snow-lines and shallow rings close to edge of the mm-emission, analogously to what is expected to happen at the inner CO-snowline but in the opposite radial direction. No observations of molecular species rather than CO are available for J1610, thus estimates of ice lines locations would still suffer from the large uncertainties attributed to disk temperature retrieval.
It is worth mentioning that there can be alternative scenarios to the planet-disk interaction and snow lines cases. For example, Pinilla et al. (2016) modelled the grain size evolution in pressure maxima generated by a dead-zone (i.e. a radial discontinuity in the viscosity parameter governing radial advection of gas parcels in a disk Gammie, 1996; Regály et al., 2012; Flock et al., 2015), showing that substructure in the dust properties at the dead zone edge may occur on Myr timescales (see their Fig. 4). The present observations cannot distinguish between these different models.
Inner disk and azimuthal asymmetries.
Both LkCa 15 and J610 exhibit an inner disk via an IR excess (e.g., Espaillat et al., 2008; Ansdell et al., 2016), and LkCa 15 shows detectable mm continuum emission at the center of the cavity in the ALMA image. In the assumption that this is due to dust in the proximity of the star, by using the same dust opacity as above and a temperature of K, the inner disk shows a dust mass of Moon masses in the optically thin approximation. Since the emission seems unresolved at our spatial resolution, the flux density of the inner disk can be related to an inner disk size in the optically thick approximation, with a radius of au for a temperature of K. By using a gas-to-dust ratio of 100, the estimated mass in gas of the inner disk emitting at mm is , which would be entirely accreted in yrs at the current accretion rate, in a too short timescale to be realistic. This can be easily overcome since the mass estimate we computed is a lower limit in the optically thin assumption, and in particular in case the inner disk is constantly replenished by the outer disk through material flowing into the cavity.
Interestingly, both Lkca 15 and J1610 are known to host variability in their optical light curve, and have been both classified as dippers (e.g., Ansdell et al., 2016; Alencar et al., 2018). Dippers are pre-main sequence stars that host quasi-periodic or episodic dimming in the lightcurve, with durations of about one day (e.g., Alencar et al., 2010; Cody et al., 2014). Different models have been invoked to explain the photometric behaviour, in general requiring small amount of dust close to the dust sublimation radius to be interposed along the line of sight generating partial occultation of the central star. Among many, proposed models are magnetospheric accretion lifting dust along the accretion column (Bouvier et al., 1999), dust laden winds, thermal instabilities and/or misaligned inner disks. Many of these mechanisms rely on the inner disk to be close to edge-on (e.g., Bodman et al., 2017; Cody & Hillenbrand, 2018), in order for the mechanism to be able to displace dust along the line of sight. However, Ansdell et al. (2020) have shown that the distribution of outer disk (au) inclinations of dippers as retrieved by ALMA imaging is isotropic, suggesting that outer disk inclination is not a relevant parameter to determine the ’dipper’ status of young stars. In both disks analysed in this paper, the residuals shown in Fig. 4 show asymmetric features. Such features could be due both to thermal effects (and thus shadowing) or to local surface density effects, for example generated by decaying vortexes in low turbulence environments. LkCa 15 shows a North-West region that is brighter than the South-East, in agreement with the scattered light image and model by Thalmann et al. (2015). At the same time, J1610 presents evident negative residuals at PA of and , and strong positive residuals in the South-East side of the disk. This feature is strikingly similar to what is observed in scattered light images of disks interpreted as hosting a misaligned inner disk (e.g., Marino et al., 2015; Benisty et al., 2018; Muro-Arena et al., 2019) with a misalignment of (Facchini et al., 2018). Dedicated radiative transfer models and analysis of the gas kinematics in the inner regions of the central cavity will be key in confirming and characterizing the presence of misaligned inner disks in both systems.
6 Conclusions
In this paper, we present and analyze high angular resolution ALMA continuum observations of two transition disks, namely LkCa 15 and 2MASS J16100501-2132318. Our main results are summarized as follows:
-
•
Both disks are structured and the broad rings previously imaged at lower resolution resolve in multiple rings. LkCa 15 has rings located at 47, 69 and 100 au, with widths 9, 6, 14 au, respectively, and possibly another faint ring located further out at au. J1610 shows two rings at 29 and 41 au, with widths of 2, 3 au at the current resolution. Only the two outer rings in LkCa 15 are radially resolved at the present angular resolution. Both disks also host an extended component covering a broad range of radii.
-
•
Rings appear to be marginally optically thick assuming negligible albedo of the dust grains, with optical depths at peaks ranging between 0.3 and 0.6. All rings are more massive than 10 , and can be as massive as . The properties of the rings are similar to the ones observed in protoplanetary disks with no cavity (i.e. not transition) when imaged at high angular resolution.
-
•
While evidence for the presence of an inner disk has already been inferred from the near-IR excess in the SED (e.g., Espaillat et al., 2008), only LkCa 15 shows evidence for a compact millimeter emission inside the cavity indicating a dust-laden inner disk. At our sensitivity, we do not detect such inner emission in J1610.
-
•
Both disks show azimuthal asymmetries in the brightness temperature distribution, and they resemble theoretical predictions of shadowing from misaligned inner disks. Increasing the sample of transition disks hosting dipper stars may help elucidate the link between inner and outer disks in objects with dynamically variable inner regions.
-
•
Comparison with hydrodynamical simulations show that a planet embedded in the outer disk can lead to the formation of multiple rings beyond a cavity. However, we find that the thermodynamics can dramatically affect the number and appearance of these rings, suggesting that planet and disk properties inferred from models should be interpreted with caution. The uncertainty of the disk cooling adds to other uncertainties from planet migration, planet formation timescales, disk turbulence, among others that have been previously studied.
-
•
The radii of the two prominent rings in LkCa 15 are in broad agreement with observations locating the CO and N2 snowlines from N2H+ observations (Qi et al., 2019), suggesting that chemistry may be causing (or facilitating) the intensity contrast observed in the radial profile.
-
•
The rings in both disks appear as favourable locations where streaming instability can occur, leading to planetesimal (and possibly subsequent planetary core) formation. The qualitative agreement between the hydrodynamical simulations and the observed morphology suggests that massive rings in transition disks may be the best environments to characterize the conditions of formation of planetary cores. If the inner cavity is cleared by a yet unseen massive planet, we may be witnessing a second-generation planet formation event triggered by the dust trap generated by the inner body.
Future observations at even higher angular resolution may pin down the nature of the inner shoulder (B49) observed in LkCa 15. At the same time, high angular resolution observations can provide better constraints on the efficiency of dust trapping and on the dust diffusion within rings. Multi-frequency high resolution observations and gas kinematics studies will be particular beneficial to shed light on the dust trapping mechanisms in transition disks.
Acknowledgements.
We are thankful to Marco Tazzari, Leonardo Testi and Antonella Natta for fruitful discussions. This paper makes use of the following ALMA data: ADS/JAO.ALMA#2018.1.01255.S. ALMA is a partnership of ESO (representing its member states), NSF (USA), and NINS (Japan), together with NRC (Canada), NSC and ASIAA (Taiwan), and KASI (Republic of Korea), in cooperation with the Republic of Chile. The Joint ALMA Observatory is operated by ESO, AUI/NRAO, and NAOJ. S.F. acknowledges an ESO Fellowship, and is grateful to JAO for hosting a month long visit which was greatly beneficial for completing the paper. M.B. acknowledges funding from ANR of France under contract number ANR-16-CE31-0013 (Planet Forming Disks). J.B. acknowledges support by NASA through the NASA Hubble Fellowship grant #HST-HF2-51427.001-A awarded by the Space Telescope Science Institute, which is operated by the Association of Universities for Research in Astronomy, Incorporated, under NASA contract NAS5-26555, and computing resources provided by the NASA High-End Computing Program through the NASA Advanced Supercomputing Division at Ames Research Center. P.P. acknowledges support provided by the Alexander von Humboldt Foundation in the framework of the Sofja Kovalevskaja Award endowed by the Federal Ministry of Education and Research. AWM was partially supported through NASA’s Astrophysics Data Analysis Program (80NSSC19K0583). This project has received funding from the European Union’s Horizon 2020 research and innovation programme under the Marie Sklodowska-Curie grant agreement No 823823 (Dustbusters RISE project), and was partly supported by the Deutsche Forschungs-gemeinschaft (DFG, German Research Foundation) - Ref no. FOR 2634/1 TE 1024/1-1.References
- Alencar et al. (2018) Alencar, S. H. P., Bouvier, J., Donati, J. F., et al. 2018, A&A, 620, A195
- Alencar et al. (2010) Alencar, S. H. P., Teixeira, P. S., Guimarães, M. M., et al. 2010, A&A, 519, A88
- Alexander et al. (2006) Alexander, R. D., Clarke, C. J., & Pringle, J. E. 2006, MNRAS, 369, 229
- Allard et al. (2013) Allard, F., Homeier, D., Freytag, B., et al. 2013, Memorie della Societa Astronomica Italiana Supplementi, 24, 128
- Andrews (2020) Andrews, S. M. 2020, arXiv e-prints, arXiv:2001.05007
- Andrews et al. (2018) Andrews, S. M., Huang, J., Pérez, L. M., et al. 2018, ApJ, 869, L41
- Andrews et al. (2011) Andrews, S. M., Rosenfeld, K. A., Wilner, D. J., & Bremer, M. 2011, ApJ, 742, L5
- Ansdell et al. (2020) Ansdell, M., Gaidos, E., Hedges, C., et al. 2020, MNRAS, 492, 572
- Ansdell et al. (2016) Ansdell, M., Gaidos, E., Rappaport, S. A., et al. 2016, ApJ, 816, 69
- Bae et al. (2019) Bae, J., Zhu, Z., Baruteau, C., et al. 2019, ApJ, 884, L41
- Bae et al. (2017) Bae, J., Zhu, Z., & Hartmann, L. 2017, ApJ, 850, 201
- Bai & Stone (2010) Bai, X.-N. & Stone, J. M. 2010, ApJ, 722, L220
- Barenfeld et al. (2016) Barenfeld, S. A., Carpenter, J. M., Ricci, L., & Isella, A. 2016, ApJ, 827, 142
- Baruteau et al. (2019) Baruteau, C., Barraza, M., Pérez, S., et al. 2019, MNRAS, 486, 304
- Baruteau & Masset (2008a) Baruteau, C. & Masset, F. 2008a, ApJ, 672, 1054
- Baruteau & Masset (2008b) Baruteau, C. & Masset, F. 2008b, ApJ, 678, 483
- Baruteau & Zhu (2016) Baruteau, C. & Zhu, Z. 2016, MNRAS, 458, 3927
- Benisty et al. (2018) Benisty, M., Juhász, A., Facchini, S., et al. 2018, A&A, 619, A171
- Birnstiel et al. (2010) Birnstiel, T., Dullemond, C. P., & Brauer, F. 2010, A&A, 513, A79
- Birnstiel et al. (2018) Birnstiel, T., Dullemond, C. P., Zhu, Z., et al. 2018, ApJ, 869, L45
- Bitsch et al. (2015) Bitsch, B., Lambrechts, M., & Johansen, A. 2015, A&A, 582, A112
- Bodman et al. (2017) Bodman, E. H. L., Quillen, A. C., Ansdell, M., et al. 2017, MNRAS, 470, 202
- Bouvier et al. (1999) Bouvier, J., Chelli, A., Allain, S., et al. 1999, A&A, 349, 619
- Brauer et al. (2008) Brauer, F., Dullemond, C. P., & Henning, T. 2008, A&A, 480, 859
- Brown et al. (2009) Brown, J. M., Blake, G. A., Qi, C., et al. 2009, ApJ, 704, 496
- Carrasco-González et al. (2019) Carrasco-González, C., Sierra, A., Flock, M., et al. 2019, ApJ, 883, 71
- Casassus et al. (2018) Casassus, S., Avenhaus, H., Pérez, S., et al. 2018, MNRAS, 477, 5104
- Casassus & Pérez (2019) Casassus, S. & Pérez, S. 2019, ApJ, 883, L41
- Cazzoletti et al. (2018) Cazzoletti, P., van Dishoeck, E. F., Pinilla, P., et al. 2018, A&A, 619, A161
- Cody & Hillenbrand (2018) Cody, A. M. & Hillenbrand, L. A. 2018, AJ, 156, 71
- Cody et al. (2014) Cody, A. M., Stauffer, J., Baglin, A., et al. 2014, AJ, 147, 82
- Currie et al. (2019) Currie, T., Marois, C., Cieza, L., et al. 2019, ApJ, 877, L3
- de Val-Borro et al. (2006) de Val-Borro, M., Edgar, R. G., Artymowicz, P., et al. 2006, MNRAS, 370, 529
- Dodson-Robinson & Salyk (2011) Dodson-Robinson, S. E. & Salyk, C. 2011, ApJ, 738, 131
- Donati et al. (2019) Donati, J. F., Bouvier, J., Alencar, S. H., et al. 2019, MNRAS, 483, L1
- Dong et al. (2018) Dong, R., Liu, S.-y., Eisner, J., et al. 2018, ApJ, 860, 124
- Draine & Lee (1984) Draine, B. T. & Lee, H. M. 1984, ApJ, 285, 89
- Dullemond et al. (2018) Dullemond, C. P., Birnstiel, T., Huang, J., et al. 2018, ApJ, 869, L46
- Dullemond et al. (2012) Dullemond, C. P., Juhasz, A., Pohl, A., et al. 2012, RADMC-3D: A multi-purpose radiative transfer tool
- Espaillat et al. (2008) Espaillat, C., Calvet, N., Luhman, K. L., Muzerolle, J., & D’Alessio, P. 2008, ApJ, 682, L125
- Evans et al. (2018) Evans, D. W., Riello, M., De Angeli, F., et al. 2018, A&A, 616, A4
- Facchini et al. (2017) Facchini, S., Birnstiel, T., Bruderer, S., & van Dishoeck, E. F. 2017, A&A, 605, A16
- Facchini et al. (2018) Facchini, S., Juhász, A., & Lodato, G. 2018, MNRAS, 473, 4459
- Facchini et al. (2019) Facchini, S., van Dishoeck, E. F., Manara, C. F., et al. 2019, A&A, 626, L2
- Flock et al. (2015) Flock, M., Ruge, J. P., Dzyurkevich, N., et al. 2015, A&A, 574, A68
- Foreman-Mackey et al. (2013) Foreman-Mackey, D., Hogg, D. W., Lang, D., & Goodman, J. 2013, Publications of the Astronomical Society of the Pacific, 125, 306
- Gaia Collaboration et al. (2018) Gaia Collaboration, Brown, A. G. A., Vallenari, A., et al. 2018, A&A, 616, A1
- Gammie (1996) Gammie, C. F. 1996, ApJ, 457, 355
- Garufi et al. (2018) Garufi, A., Benisty, M., Pinilla, P., et al. 2018, A&A, 620, A94
- Gole et al. (2020) Gole, D. A., Simon, J. B., Li, R., Youdin, A. N., & Armitage, P. J. 2020, arXiv e-prints, arXiv:2001.10000
- Goodman & Rafikov (2001) Goodman, J. & Rafikov, R. R. 2001, ApJ, 552, 793
- Gorti & Hollenbach (2009) Gorti, U. & Hollenbach, D. 2009, ApJ, 690, 1539
- Henden et al. (2012) Henden, A. A., Levine, S. E., Terrell, D., Smith, T. C., & Welch, D. 2012, Journal of the American Association of Variable Star Observers (JAAVSO), 40, 430
- Huang et al. (2018) Huang, J., Andrews, S. M., Dullemond, C. P., et al. 2018, ApJ, 869, L42
- Huang et al. (2020) Huang, J., Andrews, S. M., Dullemond, C. P., et al. 2020, ApJ, 891, 48
- Hubeny (1990) Hubeny, I. 1990, ApJ, 351, 632
- Isella et al. (2019) Isella, A., Benisty, M., Teague, R., et al. 2019, ApJ, 879, L25
- Isella et al. (2014) Isella, A., Chandler, C. J., Carpenter, J. M., Pérez, L. M., & Ricci, L. 2014, ApJ, 788, 129
- Isella et al. (2018) Isella, A., Huang, J., Andrews, S. M., et al. 2018, ApJ, 869, L49
- Isella et al. (2012) Isella, A., Pérez, L. M., & Carpenter, J. M. 2012, ApJ, 747, 136
- Jin et al. (2019) Jin, S., Isella, A., Huang, P., et al. 2019, ApJ, 881, 108
- Johansen et al. (2007) Johansen, A., Oishi, J. S., Mac Low, M.-M., et al. 2007, Nature, 448, 1022
- Jorsater & van Moorsel (1995) Jorsater, S. & van Moorsel, G. A. 1995, AJ, 110, 2037
- Kratter & Lodato (2016) Kratter, K. & Lodato, G. 2016, ARA&A, 54, 271
- Kraus & Ireland (2012) Kraus, A. L. & Ireland, M. J. 2012, ApJ, 745, 5
- Kudo et al. (2018) Kudo, T., Hashimoto, J., Muto, T., et al. 2018, ApJ, 868, L5
- Li & Greenberg (1997) Li, A. & Greenberg, J. M. 1997, A&A, 323, 566
- Liu (2019) Liu, H. B. 2019, ApJ, 877, L22
- Long et al. (2018) Long, F., Pinilla, P., Herczeg, G. J., et al. 2018, ApJ, 869, 17
- Mann et al. (2016) Mann, A. W., Newton, E. R., Rizzuto, A. C., et al. 2016, AJ, 152, 61
- Marino et al. (2015) Marino, S., Perez, S., & Casassus, S. 2015, ApJ, 798, L44
- Masset (2000) Masset, F. 2000, A&AS, 141, 165
- McMullin et al. (2007) McMullin, J. P., Waters, B., Schiebel, D., Young, W., & Golap, K. 2007, in Astronomical Society of the Pacific Conference Series, Vol. 376, Astronomical Data Analysis Software and Systems XVI, ed. R. A. Shaw, F. Hill, & D. J. Bell, 127
- Mendigutía et al. (2018) Mendigutía, I., Oudmaijer, R. D., Schneider, P. C., et al. 2018, A&A, 618, L9
- Miranda & Rafikov (2019) Miranda, R. & Rafikov, R. R. 2019, arXiv e-prints, arXiv:1911.01428
- Morbidelli (2020) Morbidelli, A. 2020, arXiv e-prints, arXiv:2004.04942
- Muiños & Evans (2014) Muiños, J. L. & Evans, D. W. 2014, Astronomische Nachrichten, 335, 367
- Muro-Arena et al. (2019) Muro-Arena, G. A., Benisty, M., Ginski, C., et al. 2019, arXiv e-prints, arXiv:1911.09612
- Oh et al. (2016) Oh, D., Hashimoto, J., Tamura, M., et al. 2016, PASJ, 68, L3
- Okuzumi et al. (2016) Okuzumi, S., Momose, M., Sirono, S.-i., Kobayashi, H., & Tanaka, H. 2016, ApJ, 821, 82
- Ormel & Klahr (2010) Ormel, C. W. & Klahr, H. H. 2010, A&A, 520, A43
- Owen et al. (2010) Owen, J. E., Ercolano, B., Clarke, C. J., & Alexander, R. D. 2010, MNRAS, 401, 1415
- Panagia & Felli (1975) Panagia, N. & Felli, M. 1975, A&A, 39, 1
- Pérez et al. (2018) Pérez, L. M., Benisty, M., Andrews, S. M., et al. 2018, ApJ, 869, L50
- Pérez et al. (2019) Pérez, S., Casassus, S., Baruteau, C., et al. 2019, AJ, 158, 15
- Piétu et al. (2006) Piétu, V., Dutrey, A., Guilloteau, S., Chapillon, E., & Pety, J. 2006, A&A, 460, L43
- Pinilla et al. (2012) Pinilla, P., Benisty, M., & Birnstiel, T. 2012, A&A, 545, A81
- Pinilla et al. (2016) Pinilla, P., Flock, M., Ovelar, M. d. J., & Birnstiel, T. 2016, A&A, 596, A81
- Pinilla et al. (2020) Pinilla, P., Pascucci, I., & Marino, S. 2020, A&A, 635, A105
- Pinilla et al. (2017) Pinilla, P., Pohl, A., Stammler, S. M., & Birnstiel, T. 2017, ApJ, 845, 68
- Pinilla et al. (2018) Pinilla, P., Tazzari, M., Pascucci, I., et al. 2018, ApJ, 859, 32
- Pinte et al. (2020) Pinte, C., Price, D. J., Ménard, F., et al. 2020, ApJ, 890, L9
- Qi et al. (2019) Qi, C., Öberg, K. I., Espaillat, C. C., et al. 2019, ApJ, 882, 160
- Qi et al. (2013) Qi, C., Öberg, K. I., Wilner, D. J., et al. 2013, Science, 341, 630
- Regály et al. (2012) Regály, Z., Juhász, A., Sándor, Z., & Dullemond, C. P. 2012, MNRAS, 419, 1701
- Reynolds (1986) Reynolds, S. P. 1986, ApJ, 304, 713
- Rice et al. (2006) Rice, W. K. M., Armitage, P. J., Wood, K., & Lodato, G. 2006, MNRAS, 373, 1619
- Rizzuto et al. (2015) Rizzuto, A. C., Ireland, M. J., & Kraus, A. L. 2015, MNRAS, 448, 2737
- Rodriguez et al. (2017) Rodriguez, J. E., Ansdell, M., Oelkers, R. J., et al. 2017, ApJ, 848, 97
- Rosotti et al. (2019) Rosotti, G. P., Benisty, M., Juhász, A., et al. 2019, MNRAS, 2689
- Rosotti et al. (2020) Rosotti, G. P., Teague, R., Dullemond, C., Booth, R. A., & Clarke, C. 2020, MNRAS[arXiv:2004.11394]
- Sallum et al. (2015) Sallum, S., Follette, K. B., Eisner, J. A., et al. 2015, Nature, 527, 342
- Schäfer et al. (2020) Schäfer, U., Johansen, A., & Banerjee, R. 2020, A&A, 635, A190
- Siess et al. (2000) Siess, L., Dufour, E., & Forestini, M. 2000, A&A, 358, 593
- Skrutskie et al. (2006) Skrutskie, M. F., Cutri, R. M., Stiening, R., et al. 2006, AJ, 131, 1163
- Stammler et al. (2019) Stammler, S. M., Dr\każkowska, J., Birnstiel, T., et al. 2019, ApJ, 884, L5
- Stevenson & Lunine (1988) Stevenson, D. J. & Lunine, J. I. 1988, Icarus, 75, 146
- Tazzari (2017) Tazzari, M. 2017, Mtazzari/Uvplot: V0.1.1
- Tazzari et al. (2018) Tazzari, M., Beaujean, F., & Testi, L. 2018, MNRAS, 476, 4527
- Teague et al. (2018) Teague, R., Bae, J., Bergin, E. A., Birnstiel, T., & Foreman-Mackey, D. 2018, ApJ, 860, L12
- Thalmann et al. (2016) Thalmann, C., Janson, M., Garufi, A., et al. 2016, ApJ, 828, L17
- Thalmann et al. (2015) Thalmann, C., Mulders, G. D., Janson, M., et al. 2015, ApJ, 808, L41
- van der Marel et al. (2015) van der Marel, N., van Dishoeck, E. F., Bruderer, S., Pérez, L., & Isella, A. 2015, A&A, 579, A106
- van ’t Hoff et al. (2017) van ’t Hoff, M. L. R., Walsh, C., Kama, M., Facchini, S., & van Dishoeck, E. F. 2017, A&A, 599, A101
- Walter et al. (2008) Walter, F., Brinks, E., de Blok, W. J. G., et al. 2008, AJ, 136, 2563
- Weber et al. (2019) Weber, P., Pérez, S., Benítez-Llambay, P., et al. 2019, ApJ, 884, 178
- Youdin & Goodman (2005) Youdin, A. N. & Goodman, J. 2005, ApJ, 620, 459
- Zhang & Zhu (2020) Zhang, S. & Zhu, Z. 2020, MNRAS, 493, 2287
- Zhu et al. (2015) Zhu, Z., Dong, R., Stone, J. M., & Rafikov, R. R. 2015, ApJ, 813, 88
- Zhu et al. (2019) Zhu, Z., Zhang, S., Jiang, Y.-F., et al. 2019, ApJ, 877, L18
- Ziampras et al. (2020) Ziampras, A., Kley, W., & Dullemond, C. P. 2020, arXiv e-prints, arXiv:2003.02298
Appendix A Stellar properties of J1610
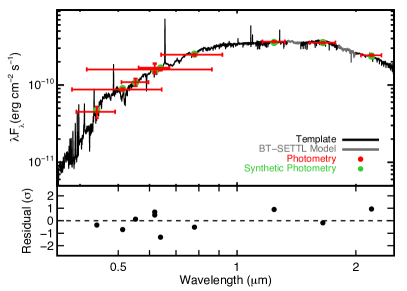
To determine the luminosity of J1610 we fit the spectral-energy distribution following the methodology from Mann et al. (2016), which we briefly summarize here. We use the spectra taken in Ansdell et al. (2016), which we absolutely calibrate using literature photometry from 2MASS (Skrutskie et al. 2006), Gaia DR2 (Evans et al. 2018), APASS (Henden et al. 2012), and CMC15 (Muiños & Evans 2014). We simultaneously fit for reddening by comparing the spectrum to un-reddened templates of stars in nearby young moving groups observed with the same instruments and setup. We fill in gaps in the observed spectra (e.g., beyond 2.2 microns) by interpolating over a grid of BT-SETTL model atmospheres (Allard et al. 2013). We calculate the bolometric flux from the integrated and un-reddened spectrum, and the luminosity from the bolometric flux and Gaia DR2 distance. We show the best-fit reddened spectrum in Figure 9. Final uncertainties account for errors in the flux calibration of the spectra, variability in the observed photometry, and differences in reddening from different selections of the un-reddened template. Our final value is , with , and K.
Appendix B Radial profiles and visibility modelling
Fig. 10 shows the azimuthally averaged intensity profiles of LkCa 15 and J1610 in log scale, to highlight the profile at large radii. Fig 11 shows the re-centered and deprojected visibilities of the data with the best fit model.
Appendix C Initial disk temperature profile from MCRT iterations
Fig. 12 shows the disk temperature profile obtained from the MCRT iterations described in Sec. 4.1 and the corresponding disk aspect ratio profile.
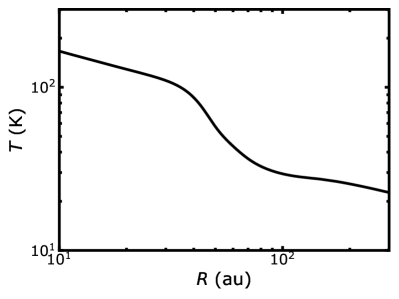
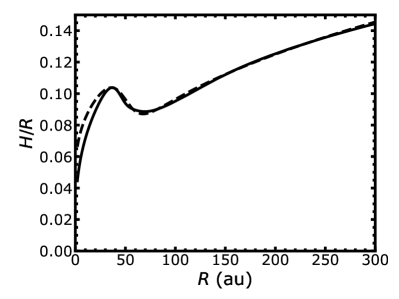
Appendix D On the point source within the LkCa 15 cavity
Fig. 13, left, shows an image of LkCa 15 with color code stretched to highlight the point source like emission within the cavity. We imaged the disk by combining the short spacings observation with only one long baseline observations at the time. Interestingly, the point source like feature is clearly imaged when only the C43-9 observation is considered, but it is not apparent in the C43-8 plus short spacing image. This supports the discussion presented in Sec. 3.1, i.e. that the feature is an image artifact driven in particular by the C43-9 execution block. The right panel of Fig. 13 shows the peak intensity within the area highlighted in the left panel, and how it varies with imaging parameters.