A Network Science Summer Course for High School Students
Abstract
We discuss a two-week summer course on Network Science that we taught for high school pupils. We present the concepts and contents of the course, evaluate them, and make the course material available.
Keywords: outreach, mathematics, physics, sociology, summer course, teaching
1 Introduction & Motivation
Teaching network science [1] has been identified as an important endeavor, because it is a concept usually omitted in high school curricula [3, 2, 4]. Hence, scientists organized outreach events for teenagers to bring them into contact with the study of networks, notably in England [5] and Spain [6]. These outreach events consisted of an introductory presentation, followed by work in smaller groups on topics such as ‘node importance’, ‘disease spread and vaccination strategies’, and ‘why your friends have more friends than you do’. Based on the success of these half-day events we decided to design a two-week summer course for German high school pupils with the topic ‘Networks and Complex Systems’ (German: Netzwerke und komplexe Systeme). The course was part of an established German summer school called Deutsche Schülerakademie (German Pupils Academy), whose concepts will be introduced in Section 2.
Due to the longer duration of the course and the higher age of the participants we were allowed to extend the covered material from the shorter outreach events, go into more mathematical detail with the topics, see Section 3, and include some components of programming with Python. In Section 4 we discuss our approaches and evaluate to what extent they were successful or might need further improvements. We make our teaching material available online [7].
2 Concept of the Deutsche Schülerakademie
The Deutsche Schülerakademie (DSA) is an extracurricular summer school for motivated and gifted pupils in the final two years of German high-school [8]. For more than twenty years every summer multiple of these academies have been organized where each of them consists of six courses for 15–16 pupils each. Our course was part of the academy ‘Roßleben 2016’ and set in a monastery school in a small town in Thuringia. The courses concurrent with ours covered diverse academic topics from analyzing Richard Wagner’s operas to String Theory. Approximately one hundred pupils participated in the courses and were encouraged to organize academic and non-academic extracurricular activities. Over the two weeks the participants spent a total of approximately sixty hours in their courses. In this time they worked under guidance of the lectures. Furthermore, they had to prepare talks for the participants of other courses explaining the topics of their course, a concept called Rotation (see Subsection 3.8), and create a written summary of the learned material, called Dokumentation (see Subsection 3.9).
3 Course Contents & Didactical Elements
In the course we used different didactic elements. Some of them, as the Rotation and the Dokumentation, were framed by the DSA structure, others, as pupil presentations and programming exercises, were chosen deliberately by us because they seemed appropriate for conveying the material.
3.1 Participant Questionnaire
We received a list with contact details of all fifteen participants two months before the academy. We expected some heterogeneity in existing knowledge because the pupils were in one of the final two grades in German high school. This discrepancy is enhanced by the federal education system in Germany which gives different foci to subjects in different states [9]. To assess the knowledge of the pupils we conducted a non-anonymous online survey which was answered by all fifteen participants. We mainly assessed the mathematical knowledge in eleven brief questions, for example, ‘Do you know what a matrix is?’. The results gave us an overview over the pupils’ abilities: All pupils knew how to operate with vectors and two thirds knew how to work with matrices, almost all of them were able to differentiate, but less knew about Riemann integration. The most heterogeneous knowledge was given for programming with a third of the participants having no programming experience and others knowing Python or C-family programming languages rudimentarily. Three quarters did not know LaTeX, which we intended to use for the Dokumentation. We also included an open-ended question about their motivation to choose this particular course. The pupils stated that they were especially interested because the course connects mathematical tools with real-world applications and targets questions from different sciences as physics and biology.
3.2 Reader
Based on the results from the questionnaire we provided the participants with a so-called Reader as preparation for the course. The main purposes of this document was to give all participants a common level of mathematical background and to provide them with some programming experience. For this we drew from two sources, (i) the Python online course ‘Spielend programmieren lernen’ (engl. ‘Learning Programming Effortlessly’) by the Hasso-Plattner-Institute [10, 11] and one chapter of ‘Physik mit Bleistift’ (engl. ‘Physics with a Pencil’) [12]. The latter gave a brief introduction to vectors and differentiating. In the post-course evaluation the pupils were, however, not satisfied with the material as it focused too much on mathematical tools that we used only briefly and not enough on learning programming.
3.3 Pupil Presentations
Each of the participants gave a presentation during the course. In preparation of the course we suggested a topic to each of them based on their interests as deduced from the survey and provided them with reading material. The talks were supposed to be 10–15 min long and we advised the participants to approach the topics from a phenomenological side. For example, Turing patterns were introduced under the topic ‘how leopards get their patterns’. Our aim was to discuss the mathematics behind the phenomena together after the introduction given by the pupils. An overview over all fifteen topics and a brief assessment of their suitability is shown in Table 1. We noted that some pupils considerably overrun the allocated time. We decided to not interrupt their talks but let them know afterwards that this might not be appropriate in other circumstances.
| Topic | Comment |
|---|---|
| Four color map problem | Good introduction to graph coloring. Allows a discussion about computer-assisted mathematical proofs |
| Seven bridges of Königsberg | Classic and easily accessible problem |
| Traveling salesman problem | Allows introduction to computational complexity |
| Kirchhoff’s circuit laws | Well-suited to introduce pupils without a physics background to physical phenomena |
| Percolation theory | Easily accessible with e.g. forest tree density and forest fires |
| Cybernetics | Participant introduced a school project’s work |
| Neuronal networks | Interesting topic but too complex for deep discussion |
| Graph isomorphism problem | Allows discussion of vs. |
| Disease spreading | Excellent for tying together network phenomena and dynamics |
| Predator-prey interactions | Good introduction to dynamical systems but too complex for deep discussion |
| Turing patterns | Accessible with, e.g., animal fur patterns but too complex for deep discussion |
| Deterministic chaos | The logistic map is well-suited for simple analyses of chaotic phenomena |
| Fractals | Nicely accessible with, e.g. coast lines and Koch’s curve |
| Fractal dimension | Counter-intuitive but easily accessible with box counting method |
3.4 Lectures
Lectures were a fundamental part of our course. Usually, they covered concepts that were earlier introduced by the pupils in their presentations. We subsequently formalized the mathematical description and went into more detail. We briefly summarize the presented topics below.
3.4.1 Introduction to Graph Theory
This lecture was built on the discussion about the representation of graphs as edge lists and adjacency matrices (see Subsubsection 3.5.1). We proceeded to introduce simple network measures as the number of edges , node degree , path length and density . We then discussed some deterministic synthetic networks as the empty graph , the path graph , the complete graph , and the complete bipartite graph and derived formulas of the network measures in dependence of the graph size . Later in a programming exercise the student validated these formulas numerically.
3.4.2 Graph Coloring
Our aim was to teach the pupils network science and classical graph theoretical concepts alike. Graph coloring was an appropriate field for the latter because the underlying problems are easily accessible, while the proofs can be challenging. We introduced node coloring and edge coloring but focussed on the former. The pupils particularly enjoyed proving theorems and challenged our proofs if they were too sloppy. In the last part of this lecture we also discussed coloring algorithms, particularly greedy coloring. One task the pupils enjoyed was to compute an upper bound of the chromatic number of a symmetrize food web [13] consisting of animals in the Everglades by applying greedy coloring many times to different orders of the nodes. We motivated this question by asking how many different cages are necessary if a zoo director would like to keep all the animals without one preying on the other.
3.4.3 Social Networks & Friendship Paradox
The discussion of social networks is well-suited to motivate the real-world applicability of network science to the pupils. The participants were rather astonished by the so-called friendship paradox. We followed Strogatz’s excellent explanation in the New York Times [14].
We proceeded by discussing the existence of clusters and other mesoscale structures in networks. Unfortunately, for privacy reasons, Facebook does not allow downloading your own friendship network anymore. This used to be an excellent way to make pupils familiar with various network characteristics as communities and centrality measures. Therefore, we had to fall back on other available data, e.g. the social graphs from MovieGalaxies [15] and B. F. Maier’s Facebook friends network from 2014 [16]. As another example of a small-world network we played the ‘Wikipedia-Game’ to demonstrate short link paths between apparently unrelated articles. Its objective is to find the shortest link-path between two random Wikipedia articles by only following links on the encountered Wikipedia pages [17].
3.4.4 Effective Resistance
A lot of the pupils showed interest in physics. Therefore we dedicated a day to the discussion of resistor networks. This topic was first introduced by a pupil’s presentation on Kirchhoff’s circuit laws. Subsequently we aimed at computing the effective resistance of more complex networks where we followed the discussion in [1]. In particular, we proceeded as follows (see also Exercise Sheet 3).
At first we motivated eigenvalues and -vectors of matrices with a rudimentary example of a growing population of linearly interacting species. Using this concept we were able to motivate the inverse matrix and what it means when a matrix has eigenvalue zero (the concept of singularity), which was necessary to explain the reduction of the graph Laplacian to make it invertible.
This topic was very difficult for some of the younger pupils which were not as versatile in working with matrices as the older ones. However, some of the more engaged participants particularly enjoyed those discussions.
3.4.5 Dynamic Systems and Fractals
In addition to traditional network science we also discussed dynamic systems, e.g. simple exponential growth or more complex Lotka-Volterra equations. The pupils enjoyed the discussion, although an introduction of mathematical prerequisites, e.g. ordinary differential equations (ODEs), was necessary. Even though introducing those prerequisites took a rather long time, we think it was valuable for the pupils to learn about ODEs using very simple systems. In particular we showed how to derive the equation of motion for logistic growth given the example of the mean-field model of the susceptible-infected infection model. Here, we started with discrete time and probabilistic considerations and arrived at the final equation by going to continuous time using .
We furthermore discussed chaotic systems by analyzing the logistic map in discrete time, as well as the stability of equilibria since those are very accessible with high school-level calculus and graphical methods equally. Especially the discussion of stability was hence well-received and the participants seemed to grasp the concept of phase transitions easily by analyzing the logistic growth equation in continuous time.
The lectures on dynamic systems ended with the discussion of fractals (e.g., as coast lines) and fractal dimensions (by introducing the box counting-method). While the pupils seemed to understand the fundamental concepts they had significant problems reproducing self-similar structures using Lindenmayer systems and Python’s implementation of ‘turtle’, a drawing engine that uses simple iterative instructions.
In retrospect, we feel that this part of the course was a bit out of scope and potentially overwhelming for the pupils.
3.5 Modules
In addition to longer lectures we also used a couple of smaller modules, which had a stronger component of pupil involvement. We will briefly introduce some of them below.
3.5.1 How to Communicate a Graph
This module was one of the first elements of our course. We separated the pupils into two groups. Each of them was given a printout of a small labeled graph with the aim to communicate the graph in written form to the other group such that they were able to recreate the same graph.
The pupils quickly identified ways to achieve this, for example, as an edge list. After joining both groups together we discussed different approaches and their limitations, for example, that edge lists do not allow the representation of isolated nodes but an additional node set is required. This naturally led to the introduction of other representations such as adjacency matrices. One of the graphs was dense and the other sparse, which lead to the discussion of space and memory considerations when working with large graphs in different representations.
This simple task was very successful because it clearly motivates the definition of a graph as node and edge set. Giving the mathematical definitions exclusively can intimidate pupils who are not familiar with the notion of sets.
3.5.2 Analog Creation of Random Graphs with Dice
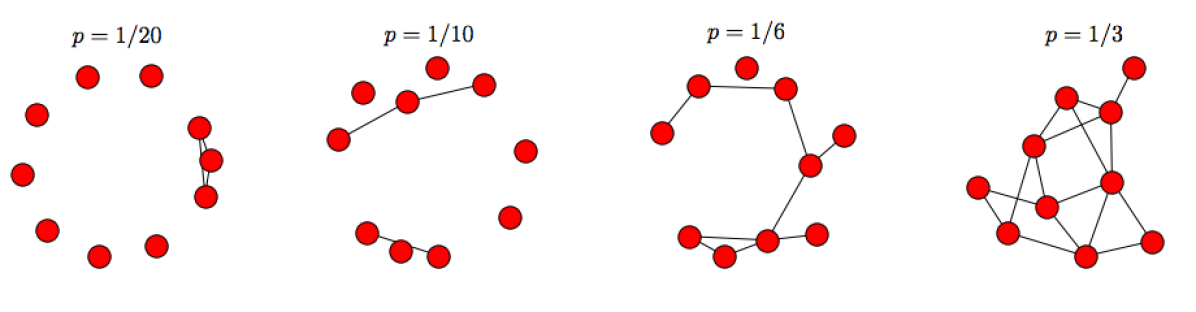
After introducing Erdős-Rényi random graphs we gave the participants the task to create undirected random graphs with the help of six-sided and twenty-sided dice. We discussed how to generate graphs with different connection probabilities and also identified an appropriate number of nodes. We settled for nodes given that dice rolls per network seemed a reasonable time effort. We then split the pupils into four groups, each creating a graph of different connection probability . Each group drew their final graph on the blackboard (see Fig. 1) and we subsequently discussed their properties, e.g. the size of their giant connected component and their degree distributions , and compared them with theoretical expectations.
This task was praised as ‘very fun’ by the pupils. We evaluated it as successful from a didactical perspective because it playfully connects known material, such as dice rolls and probabilities, with new concepts, such as random graphs. Furthermore, it allows the transition to the creation of random graphs using pseudorandom number generators of a computer. However, the introduction of the binomial coefficient to explain the random graph’s degree distribution was rather challenging for the majority of the pupils.
3.5.3 Creating a Floor Plan Network
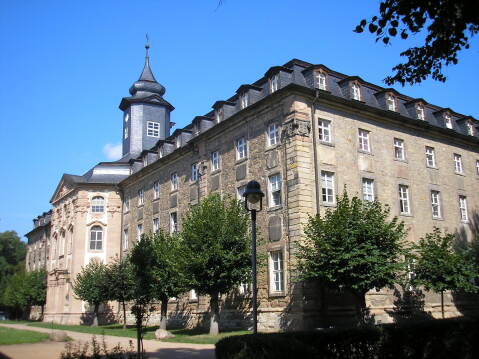
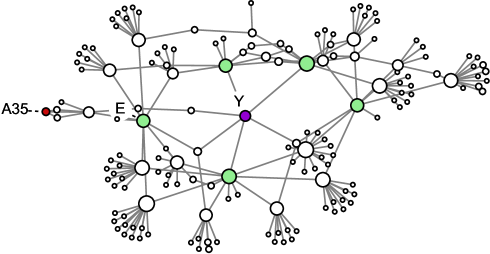
In addition to synthetic networks and the networks created from data that we provided, we wanted the participants to experience a more realistic experience of network creation. For this we gave them access to a printout of the floor plan of the Klosterschule Roßleben, which hosted the academy (see Fig. 2). They had the task to create a network in which nodes represent the rooms and edges stand for direct connections between them.
We let the pupils organize amongst themselves how to achieve this and how to overcome the problems they faced. They decided to split into groups, each of them covering one floor of the building. They labeled each room with a unique alphanumerical identifier consisting of a letter for the floor and a number for the room. The four stairwells, which connected floors, were given the label ‘East’, ‘South’, ‘West’, and ‘North’. The unique labeling allowed the parallel creation of different parts of the network which were joined together later on. To avoid making mistakes in the network creation process each floor’s network was generated independently twice. The pupils then used their knowledge about necessary conditions of graph isomorphism, e.g. identical number of edges and degree distributions, to check whether both were potentially identical. If this was not the case they knew that there was a discrepancy between the created networks and they investigated which of the two creators made a mistake.
The generated network, which is given in the course material [7] and shown in Fig. 2, was then further analyzed by the pupils. For example, they investigated the degree distribution and compared different centrality measures. They found a positive correlation between degree and betweenness while some nodes contradicted that notion by having a much higher betweenness than expected from their degree. They identified these nodes to represent staircases that connect the hallways with each other.
3.5.4 Infectious Dynamics
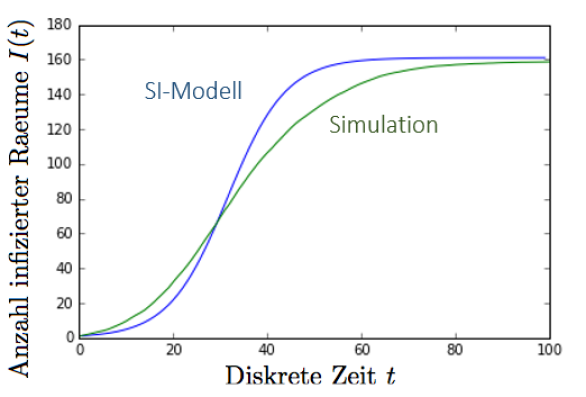
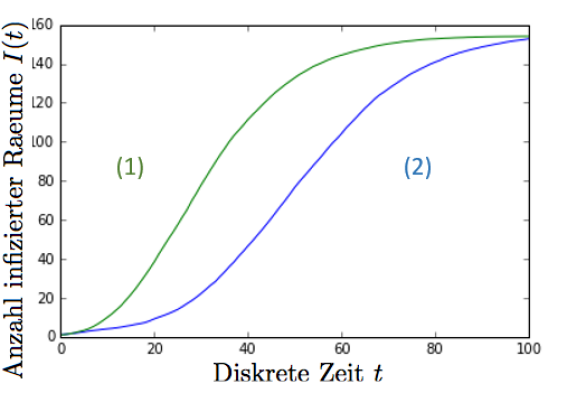
We used the created school building network for the simulation of compartmental models in epidemiology, specifically the susceptible-infected dynamics (SI), as shown in Figure 3. We invented a scenario where another course of the academy, working with bacteria germs, let a hyperinfective strain escape which slowly infects the whole building room by room. The pupils then compared the results with the mean-field approximation introduced in the lectures.
We then discussed three vaccination strategies: (i) random vaccination, (ii) vaccination of nodes with high betweenness, and (iii) random next-neighbor vaccination. The temporal development of the number of infected nodes for the former two are shown in Figure 3 and the pupils were able to identify that the betweenness-vaccination is slowing the spread of the disease. The final steady state, however, shows the same number of infected rooms.
This module successfully connected different aspects of the course, betweenness centrality and SI dynamics, with a real-world application. Furthermore, it demonstrated the effectiveness of vaccination to the pupils and we were able to discuss the aspect of herd immunity.
3.5.5 Small-World Networks
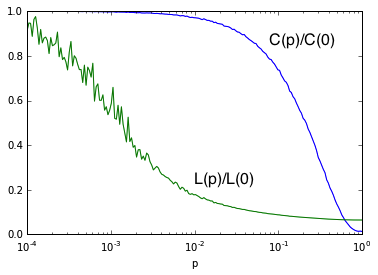
Besides the introduction of essential concepts for networks we also wanted to familiarize the pupils with scientific literature. For this we chose the first half of Watts’ and Strogatz’ famous paper Collective Dynamics of ‘small-world’ networks [19]. The task we gave them consisted of two parts: (i) read the paper and explain the definition of clustering coefficient and (ii) recreate Figure 2, which gives the characteristic path length and clustering coefficient of a lattice graph under rewiring.
This task was challenging but fruitful for the pupils. All of them quickly understood the contents of the paper. For the programming exercises they needed more help. We were, however, rather impressed by the pupils’ abilities. Reproducing the results of an important paper, as shown in Figure 4, led to a feeling of achievement as well as motivation for the upcoming lectures. Note that for time limitations we omitted averaging over a large number of realizations, which was used in the original paper. However, we discussed with the students the impact of and reason for such averaging procedures.
3.6 Problem Sheets
We created six problem sheets that gave the pupils the chance to apply some of the learned concepts. We initially planned a problem sheet per day but quickly realized that our schedule was too ambitious. The problem sheets usually consisted of a mixture of pen-and-paper analytical questions, as well as programming exercises as outlined in the next Subsection. We have made all problem sheets in the original German and a translated English version available online [7].
3.7 Programming Exercises
We used Python as the main and only programming language because it is open source and easy to learn and implement. In addition to the default Python functions we used mainly three libraries, networkX, matplotlib, and numpy. We also used Gephi [20] for the analysis of social networks and as an easy way to graphically access them.
Given the results from our initial questionnaire we were aware that the pupils had very different levels of knowledge of programming. To tackle this problem we created two groups, one working on their own on the programming exercises, the other receiving closer guidance.
The programming tasks were very diverse in their difficulty. We started with the creation of the synthetic graphs discussed earlier in the lecture. To make the task more feasible we gave the code to create a path graph of nodes (see Listing 1). After a discussion of the code and answering questions like ‘Why is the FOR loop progressing from to ?’ they had to adopt the code to create functions that construct other graphs such as the empty graph , the cycle graph , and the complete graph . We registered that a subset of the pupils had problems with this task and a careful discussion of the code was necessary. A line-by-line dismantling of the script on the blackboard was especially helpful to increase understanding.
Other tasks included the illustration of the networks with the networkX draw function and the computation of network metrics such as degree and betweenness. For each exercise we also had one or two rather complex tasks, such as the implementation of the Dijkstra-algorithm to keep even the most advanced participants engaged. We clearly communicated that we did not expect the pupils to solve all available tasks to ensure they did not feel insufficient. We discussed the findings of all tasks with the whole class.
3.8 Rotation
The Rotation is an inherent part of each DSA academy. It occurs at half-way through the course, thus after approximately seven days of covered material. It is a half-day event in which each course has to organize twenty minute presentations for pupils of other courses.
We planned the talks in our course and discussed which topics were appropriate to present to the other pupils. Our participants identified that the fundamental mathematical definitions should be covered and social networks would be a good example to make the topic accessible. They therefore covered the small-world phenomenon and the friendship paradox.
The feedback they received on the presentations was very positive. The participants as well as the lecturers of the other courses were astonished by how applicable and approachable mathematics can be. We think that network science itself can serve as a ‘figurehead’ topic inside mathematics because it easily contradicts the usual stereotypes of mathematics being incomprehensible and overly complicated.
3.9 Dokumentation
The Dokumentation (German for documentation) is another inherent part of each DSA summer school. It is a written report in which each course summarizes the covered material. Each participant contributed a small one to two page part, while we served as editors.
Despite most participants having no knowledge of LaTeX we decided to write the whole report with ShareLaTeX, an online LaTeX editor that allows real-time collaboration and online compiling [21].111There are plenty of other LaTeX online editors available, such as Overleaf, Papeeria, and Authorea. This came with the known advantages of LaTeX such as easy incorporation of formulas, figures, and citations. It furthermore allowed the collaboration of all pupils and removed compatibility issues. We introduced the use of LaTeX in a special session and accompanied the whole writing process to efficiently dismantle encountered problems.
The first step was the discussion of an overall structure of the Dokumentation. We did not impose any approach but discussed different potential approaches with the pupils. The final structure was similar but not identical to the one we chose for the course overall. The second step was the individual discussion with each pupil about the material they wanted to cover and what illustrations were necessary. All figures in this paper were created by pupils as part of the documentation.
The creation of the Dokumentation was a very novel challenge for the participants. One encountered problem was the space limitation, such that the presented information had to be condensed, while staying comprehensible. Furthermore, the appropriate referencing was unfamiliar to the pupils. Most of them did not encounter these aspects before and thus found them challenging. Overall however, we were impressed with the result and needed only two to three iterations of editing per pupil before the texts met the appropriate quality.
4 Conclusions
We were overall content with the course, the pupils’ involvement, and their progress. We think that network science is a appropriate topic to give pupils an introduction to university-level science and mathematics, as we noted from the feedback during the Rotation, even for those that are not naturally interested in such topics.
We encountered the disparity in background, especially concerning programming, as the most challenging part, because it made it more difficult to keep everybody engaged. As two instructors, we were able to split the class into a beginner and advanced half, which helped in some cases. A better, more detailed, discussion of programming for those that had never programmed before might have been fruitful.
A crucial part of our teaching was the flexibility in the covered topics. Sometimes the pupils had problems with concepts that we thought were taught at school, e.g. the binomial coefficient, while other new concepts took much less time to discuss than we anticipated.
One weakness of our preparation was the reader. We should have tailored it more to the specific course content and given ‘homework’ problems instead of reading material only. This would have allowed us to challenge the pupils with more advanced topics, such as more complicated differential equations, and thus go into more detail in the course itself.
Although the discussion of a broad range of topics was praised by the pupils we felt that a focus on networks under omission of a majority of the dynamic systems part would have been beneficial. The latter is an interesting and complex branch of science and would provide enough material for a course by itself. In retrospect, we would definitely drop the discussion of Lotka-Volterra systems, Turing patterns, chaos, and fractals while a discussion of stability and infection dynamics might still be interesting as an example for the application of network science to real-world problems.
We also want to note that the organization of such a course was also very beneficial for ourselves. It allowed us to recapture many different topics in graph theory and network science and think about ways to motivate and connect them with each other.
5 Acknowledgements
We would like to thank all the pupils who participated in the course for their engagement and criticism. It was a great pleasure working with them for the two weeks of the program. Further thanks goes to the central organization of the DSA in Bonn, as well as the academy administration and fellow course organizers at the DSA Roßleben 2016. We thank our doctoral advisers Mason A. Porter and Dirk Brockmann for supporting us in this endeavor and for their fruitful discussion. We are grateful to Sarah M. Griffin for proofreading the manuscript.
6 Funding
This work is supported by the EPSRC and MRC (FK, grant numbers EP/L016044/1, EP/R513295/1, EP/N014529/1) and by the Joachim Herz Stiftung (BFM).
References
- [1] Mark Newman. Networks: An Introduction. Oxford University Press, 2010.
- [2] Catherine Cramer, Mason A. Porter, Hiroki Sayama, Lori Sheetz, and Stephen Uzzo. Network literacy – essential concepts and core ideas. https://sites.google.com/a/binghamton.edu/netscied/teaching-learning/network-concepts, 2015.
- [3] Catherine Cramer, Lori Sheetz, Hiroki Sayama, Paul Trunfio, H Eugene Stanley, and Stephen Uzzo. Netsci high: bringing network science research to high schools. In Complex Networks VI, pages 209–218. Springer, 2015.
- [4] Hiroki Sayama, Catherine Cramer, Mason A. Porter, Lori Sheetz, and Stephen Uzzo. What are essential concepts about networks? Journal of Complex Networks, page cnv028, 2015.
- [5] Heather A Harrington, Mariano Beguerisse-Díaz, M Puck Rombach, Laura M Keating, and Mason A Porter. Commentary: Teach network science to teenagers. Network Science, 1(02):226–247, 2013.
- [6] Angel Sánchez and Cristina Brändle. More network science for teenagers. arXiv preprint arXiv:1403.3618, 2014.
- [7] Florian Klimm and Benjamin F. Maier. Teaching material for summer school on network science for high school students. https://github.com/floklimm/DSAMaterialNetworks, 2017.
- [8] Elke Völmicke. Deutsche Schülerakademie, 10 2017.
- [9] Bridgette Lohmar and Thomas Eckhardt. The education system in the federal republic of germany 2012/2013: A description of the responsibilities, structures and developments in education policy for the exchange of information in europe. In Bonn: Secretariat of the Standing Conference of the Ministers of Education and Cultural Affairs of the Länder in the Federal Republic of Germany, 2014.
- [10] Christoph Meinel and Stefanie Schweiger. openHPI–Das MOOC-Angebot des Hasso-Plattner-Instituts. In Veranstaltungen 4.0, pages 195–226. Springer, 2017.
- [11] Martin von Löwis. Spielend Programmieren lernen!, 10 2017.
- [12] Hermann Schulz. Physik mit Bleistift. Verlag Harri Deutsch, 2004.
- [13] Robert E. Ulanowicz and Donald L. DeAngelis. Network analysis of trophic dynamics in south florida ecosystems. US Geological Survey Program on the South Florida Ecosystem, 114, 2005.
- [14] Steven H. Strogatz. Friends you can count on. New York Times, 2012.
- [15] Jermain Kaminski, Michael Schober, Raymond Albaladejo, Oleksandre Zastupailo, and Cesar Hidalgo. Moviegalaxies-social networks in movies. Consulté sur http://moviegalaxies. com, 2012.
- [16] Benjamin F. Maier and Dirk Brockmann. Cover time for random walks on arbitrary complex networks. Physical Review E, 96(4):042307, October 2017.
- [17] Robert West, Joelle Pineau, and Doina Precup. Wikispeedia: An online game for inferring semantic distances between concepts. In Proceedings of the Twenty-First International Joint Conference on Artificial Intelligence, pages 1598–1603, 2009.
- [18] Michael Sander. Photography of the monastery school roßleben. ”https://de.wikipedia.org/wiki/Datei:Klosterschule_Ro%C3%9Fleben.JPG”, 8 2010.
- [19] Duncan J Watts and Steven H Strogatz. Collective dynamics of ’small-world’ networks. Nature, 393(6684):440, 1998.
- [20] Mathieu Bastian, Sebastien Heymann, and Mathieu Jacomy. Gephi: An open source software for exploring and manipulating networks, 2009.
- [21] Henry Oswald, James Allen, and Brian Gough. ShareLaTeX, the Online LaTeX Editor, 2015.