Jamming and force distribution in growing epithelial tissue
Abstract
We investigate morphologies of proliferating cellular tissues using a newly developed numerical simulation model for mechanical cell division and migration in 2D. The model is applied to a bimodal mixture consisting of stiff cells with a low growth potential and soft cells with a high growth potential; cancer cells are typically considered to be softer than healthy cells. In an even mixture, the soft cells develop into a tissue matrix and the stiff cells into a dendrite-like network structure. When soft cells are placed inside a tissue consisting of stiff cells (to model cancer growth), the soft cells develop to a fast growing tumor-like structure that gradually evacuates the stiff cell matrix. The model also demonstrates 1) how soft cells orient themselves in the direction of the largest effective stiffness as predicted by the theory of Bischofs and Schwarz (Proc. Natl. Acad. Sci U.S.A., 100, 9274–9279 (2003) and 2) that the orientation and force generation continue a few cell rows behind the soft-stiff interface. With increasing inter-cell friction, tumor growth slows down and cell death occurs. The contact force distribution between cells is demonstrated to be highly sensitive to cell type mixtures and cell-cell interactions, which indicates that local mechanical forces can be useful as a regulator of tissue formation. The results shed new light on established experimental data.
I Introduction
Morphology and dynamics of proliferating cells are fundamental issues in cellular development Paluch and Heisenberg (2009); Li et al. (2012); Heisenberg and Bellaïche (2013); Ragkousi and Gibson (2014); Gibson et al. (2014); Sanchez-Gutierrez et al. (2015). They are controlled by a number of factors, but from the physical point of view, morphology is tightly coupled to inter-cellular force transmission, see e.g. Refs. Rauzi et al. (2008); Tambe et al. (2011); Sanchez-Gutierrez et al. (2015). Mechanical forces have been shown to be important in tissue healing after damage Trepat et al. (2009) and cancer development, and it has been suggested that tumor growth may even become arrested by inter-cellular mechanical forces Helmlinger et al. (1997); Kumar and Weaver (2009); Alessandri et al. (2013). In addition to uniform structures, a plethora of structures with various mechanisms and division modes have been suggested but the issue remains largely unresolved Pilot and Lecuit (2005); Gibson et al. (2006); Guillot and Lecuit (2013); Herrero et al. (2016).
Among the many complications in investigating force transmission are that at their embryonic state, cells may not yet have developed junctions and may display more fluid-like behavior, and that cell-cell adhesion depends on the cell type and type of adhesion (focal or non-focal) Lecuit (2005); Rauzi et al. (2008); Guillot and Lecuit (2013); van Helvert et al. (2017). Junctions are crucial in cell-to-cell stress transmission Rauzi et al. (2008); Liu et al. (2010); Tambe et al. (2011); Pontani et al. (2012) but it is, however, challenging to probe the individual junctions experimentally. In addition, the different cellular level signaling mechanism can be coupled depending on local properties and environment, that is, chemical signaling based on molecular interactions and mechanotransduction may depend on each other, see e.g. Ref. Zhang and Labouesse (2012).
From a coarse-grained point of view, i.e., ignoring chemical details and treating cells as elastic objects, cellular systems can be seen as disperse grand canonical soft colloidal systems under evolving pressure. Several studies have tried to capture aspects of growing soft matter systems Åström and Karttunen (2006); Jones and Chapman (2012); Gonzalez-Rodriguez et al. (2012); Kursawe et al. (2018) but even in simple systems many fundamental questions remain open including the precise nature of colloidal phase diagrams when colloids are soft with size dispersity Fernández et al. (2007), and structure selection via self-assembly Frenkel and Wales (2011). Cellular systems are even more complex since they exhibit additional behaviors such as growth and division, have varying mechanical properties (e.g. elasticity and cell-cell adhesion) and their responses to external stimuli may be sensitive to the local environment.
Dimensionality has an important role in regulation of intra- and inter-cellular forces at different levels, see e.g. Refs. Charnley et al. (2013); Hernández-Hernández et al. (2014); Lesman et al. (2014); Osterfield et al. (2017); Owen et al. (2017). Systems such as epithelial tissues and Drosophila wing discs, are inherently two dimensional which gives them distinct morphological properties due to the nature of cellular packing, and transmission of and response to forces Gibson and Gibson (2009); Guillot and Lecuit (2013); Gibson et al. (2014). In addition, jamming can be very strong in two dimensions; understanding the effects of stiffness, density and inter-membrane friction is crucial for being able to determine how jamming emerges in cellular systems Sadati et al. (2013); Reichhardt and Olson Reichhardt (2014). Besides being important in understanding the mechanisms of cell movement under pressure Tambe et al. (2011), such situations have been proposed to be important in tumor growth Helmlinger et al. (1997); Kumar and Weaver (2009) – cancer cells are often softer than healthy cells Alibert et al. (2017) although the opposite has also been reported Suresh (2007). Our main focus is on the above effects in systems consisting of hard cells in a soft matrix and vice versa. We use our previously introduced two dimensional computational model called EpiCell2D (Epithelial Cell 2D) Mkrtchyan et al. (2014). The model is summarized below in Models and Methods and described in full detail in Ref. Mkrtchyan et al. (2014). Cell stiffness, its measurements and connection to cancer metastasis have been recently reviewed by Luo et al. Luo et al. (2016).
Two dimensional cellular systems have been studied with a number of computational methods including off-lattice vertex models Honda et al. (2004); Farhadifar et al. (2007); Hufnagel et al. (2007); Fletcher et al. (2014); Sussman et al. (2018); Staple et al. (2010); Fletcher and Mullins (2010); Gibson et al. (2006); Nagpal et al. (2008); Patel et al. (2009); Alt et al. (2017), and Voronoi tessellation or Delaunay triangulation based models Schaller and Meyer-Hermann (2004); Schaller and Meyer-Hermann (2005); Meyer-Hermann (2008); Beyer and Meyer-Hermann (2009); Radszuweit et al. (2009). Such models approximate cell membranes as edges or planes and they do not include inter-cellular forces. The immersed boundary method of Rejniak et al. Rejniak (2007) which explicitly models inter-membrane interactions is better suited to problems that require inter-cellular forces. Other methods include lattice-based methods such as the Cellular Potts Model Graner and Glazier (1992); Szabó and Merks (2013); Shirinifard et al. (2009); Merks and Glazier (2005). Although versatile, they describe cellular interactions with scalar energy terms, making it impossible to study forces between cells unless they are amended. Phase-field modeling, based on defining a free energy functional and an order parameter (or several parameters) and is a relatively new approach to cell division and migration Nonomura (2012); Palmieri et al. (2015, 2019); Jiang et al. (2019).
The models that describe cells as discrete entities with individual properties can be further classified as either off-lattice Liedekerke et al. (2018) or lattice-based Drasdo et al. (2018) agent models. For example, the former include the models of Rejniak et al. Rejniak (2007); Rejniak and Anderson (2008) and our current model, and the latter cellular automata and Potts models. In off-lattice models cells are typically deformable and forces or energies are used in determining their behavior whereas in lattice-based models updates are done based on pre-determined rules rather than forces and the cellular shapes or topologies are typically fixed. Both approaches have their advantages and caveats. A comprehensive review of agent-based cellular models is provided by Van Liedekerke et al. Liedekerke et al. (2015) and a review of mechanobiological aspects and morphology during the whole cell cycle is provided by Clark and Paluch Clark and Paluch (2011).
II Model and methods
We employ the two-dimensional EpiCell2D model to study tissue morphologies. Full details, derivation, and parameter mapping with all parameters (force field) are provided in Ref. Mkrtchyan et al. (2014) and not repeated here. Below, we summarize the salient features and provide the new additions. In the context of the models discussed above, EpiCell2D can be classified as an off-lattice agent-based model; cells are well-defined entities, have individual properties, they can deform, divide and forces are used to update their positions and motions.
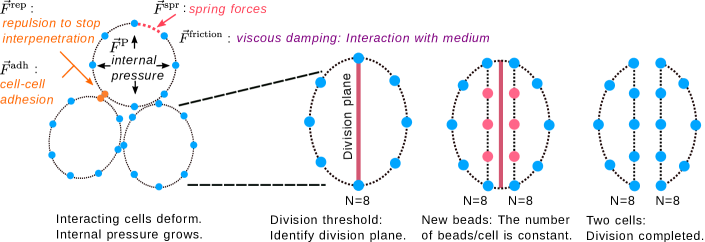
In EpiCell2D the cell membrane is discretized as beads connected by elastic bonds of stiffness to form a closed loop, see Fig. 1. In our simulations, the cells had 76 beads (Fig. 1 has only eight for clarity). The model has been previously tested Mkrtchyan et al. (2014) using 10-100 beads per cell and it was found that the number of beads has no effect on results if . The model parameters (details in Ref. Mkrtchyan et al. (2014)) were mapped using a cell diameter of 10 m, mass of kg Phillips et al. (2012) and Young’s modulus from mitotic HeLa cells Stewart et al. (2011). The orientation of the division plane was chosen randomly such that it passed through the center of mass of the cell.
In EpiCell2D, the force field is defined as a sum of intra-cellular, inter-cellular, and cell-medium interactions, see Fig. 1. The intra-cellular terms include the internal pressure () and spring forces () which provide a mean-field description for the components that give cells their integrity (cell cortex contractility), that is, the cell membrane and cytoskeleton. The inter-cellular terms define the interactions between the cells. The first of them () is repulsion to prevent cells from penetrating each other and the second term () describes cell-cell adhesion. In real cells adhesion occurs, e.g., due to lipids and different adhesive proteins depending on the cell type. For a recent discussion on the physical aspects of adhesion, see, e.g., Schulter et al. Schluter et al. (2014) and van Helvert et al. van Helvert et al. (2017). The final term is medium-cell interaction (friction). With these, the force field can be given in the following general form
| (1) |
The functional forms of the terms and all the parameters (14 in total) are given in Mkrtchyan et al. Mkrtchyan et al. (2014) and are not repeated here.
In EpiCell2D cellular growth is controlled by a growth pressure. This is motivated by the fact that cells have mechanisms to control their internal hydrostatic pressure particularly before division Stewart et al. (2011). Division is triggered by a threshold in cell area (above which cells divide). We would also like to note that different criteria can be used. As pointed out but Streichan et al. Streichan et al. (2014) at least area and growth rate are possible criteria for triggering cell division.
Importantly, EpiCell2D allows the aggregate topology (the polygonal distribution) to vary spontaneously Mkrtchyan et al. (2014); note that cellular topology is fixed, that is, the number of nodes per cell must remain constant upon division, Fig. 1.
One important issue in modeling cells is cell death. The role of cell death in tissue dynamics has been discussed in numerous publications, a recent perspective is given by Green Green (2019). Different approaches have been taken to include cell death in computational models. In some models that is done as a probability for a cell to disappear Podewitz et al. (2015) or via a tunable cell cycle rate Czajkowski et al. (2019). In the current study, cell death occurs due to local stresses. All of these approaches can be justified as cell death is a very complex and multifaceted phenomenon. Our choice is based the observations of Chen et al. Chen (1997) and Streichan et al. Streichan et al. (2014) that mechanical constraints, in particular cell shape and local stress, are critical factors and determinants for cell cycle and death. Similar mechanisms have also been proposed and analyzed by Shraiman Shraiman (2005).
Previously, we focused on model development, parameter mapping and verification against experiments using only one type of cells Mkrtchyan et al. (2014). Due to the large parameter space (14 in total), it is not feasible, however, to attempt to map a phase diagram. As a new direction, we extend EpiCell2D for simulations of different cell types using two simple approaches with parameters based on experiments:
-
1.
changing cell stiffness, and
-
2.
changing the cell-cell friction between cell membranes; in EpiCell2D cell membrane and cytoskeleton are treated as a coarse-grained single object.
Modification 1) allows for simulations of different cell types. As mentioned above, cancer cells are typically softer than the matrix cells and softness, or higher malleability, is typically associated with the invasiveness of cancer cells Luo et al. (2016); Alibert et al. (2017). This has recently been challenged by Nguyen Nguyen et al. (2016) et al. who measured Young’s modulus of pancreatic cancer cells using different cell lines and found the stiffer (than the matrix cells) cells to be more invasive than the softer cancer cells. Whether this is purely mechanical or due to simultaneously occurring biological processes remains unclear; simulations using EpiCell2D indicate that stiffer cells migrate easier following in the wake of a leader while softer cells collectively evacuate stiffer cells due to aggressive growth. This is in excellent agreement with the findings of Trepat et al. who showed that collective effects are essential cell migration Trepat et al. (2009). We will return to this issue in Results as well as in Discussion.
Here, we use two types of cells: (i) Stiff cells with a low growth potential with stiffness . The low growth potential means that the cell membrane is so stiff that the applied pressure is barely enough to grow the cell to a size above the division threshold. (ii) Soft cells with stiffness . These cells have a high growth potential which means that cell membrane stiffness is low and the cell area can easily grow beyond the division size; due to the lower elastic modulus, the growth rate of a soft cell is higher even if the internal pressure is the same as for a stiff cell. Note also that in EpiCell2D the plasma membrane and cytoskeleton are treated as a coarse-grained single object referred to as the membrane.
Modification 2) allows for comparisons of systems of cells with different inter-membrane friction coefficients (term in Eq. 1 and Fig. 1). The importance of cell-cell friction in mechanotransduction has recently been reviewed by Angelini et al. Angelini et al. (2012).
In Eq. 1 inter-membrane friction is modeled via term where is the friction coefficient and is the relative velocity between two membranes tangential to the cell that the bead belongs to. We compare systems with g/s, that is, cells do not interact very much with their neighbors, and strongly interacting cells with g/s. In the simulations, both open and closed boundaries were used.
III Results
We focus on systems with two cell types, Stiff and Soft, present simultaneously. Soft cells represent tumor cells based on the fact that cancer cells tend to be softer Alibert et al. (2017), Young’s modulus for cancer cells is typically kPa and whereas for normal cells it often kPa (although variations are large, see, e.g., Ref. van Helvert et al. (2017)). In real cancer cells this effect can be enhanced by a lesser number (or lack) of adhesion proteins. However, although cancer cells are generally assumed to grow faster than healthy cells, measurements are not trivial as different metrics can be used Mehrara et al. (2007). An additional complication is the fact that in healthy tissue growth is regulated whereas cancer cells typically lack such regulation. For a review of properties of cancer cells, see, e.g., Hanahan and Weinberg Hanahan and Weinberg (2011) and for biomechanical aspects Fritsch et al. Fritsch et al. (2010).
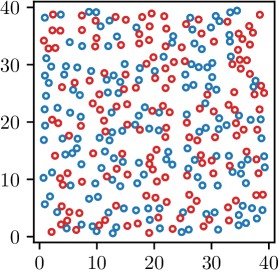
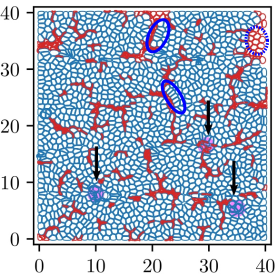
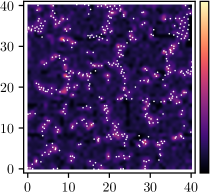
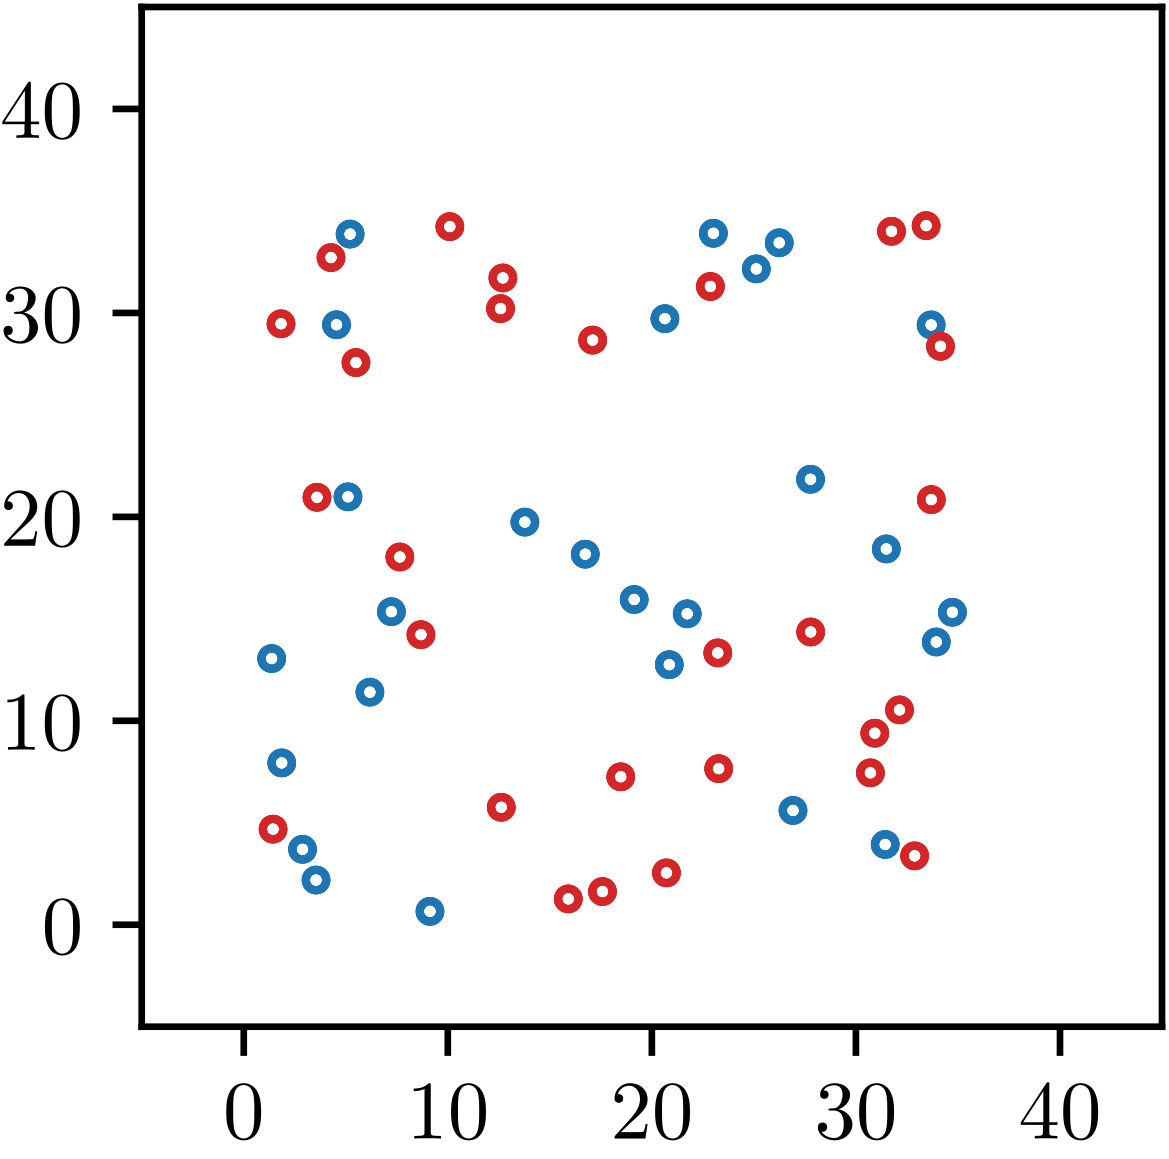
The initial setups were created by placing equal proportions of Stiff (red) and Soft (blue) cells randomly, see Figure 2a; the simulations were repeated several times and the results did not depend on the initial conditions. Figure 2b shows the tissue structure at the end of one of the simulations. The soft cancer cells have invaded the space while the stiff cells (red) have been compressed into dendrite-like structures. Another distinct feature is that the cells interpenetrate in the regions marked with light purple and arrows in Fig. 2b. Although this behavior may seem as an artifact, it occurs in diverse systems as has been shown by Eisenhoffer et al. for canine, human and zebrafish epithelial cells Eisenhoffer et al. (2012) and discussed at length by Guillot and Lecuit Guillot and Lecuit (2013) (see Fig. 2 in Ref. Guillot and Lecuit (2013)). Figure 2c shows the average contact forces between cells. The white dots show the centers of masses of the stiff cells. The contact force peaks correlate highly with the locations of the stiff cells indicating that the Soft cells overwhelm the Stiff cells as the tissue grows.
These interpenetrating cells is where cell death occurs. Although the dead cells are not physically removed (to keep the simulation code faster), they collapse and occupy only minimal space as defined by the non-overlap of the surface nodes.
Next, we examine if the collapse of stiff cells can be mitigated by making their interactions stronger. This is done by changing the magnitude of inter-membrane friction . Since cells need space to grow, they need to slide past each other into empty regions. Higher friction, however, induces jamming and thus reaching the division threshold takes a much longer time. The softer cells will also need to counteract this effect to be able to grow.
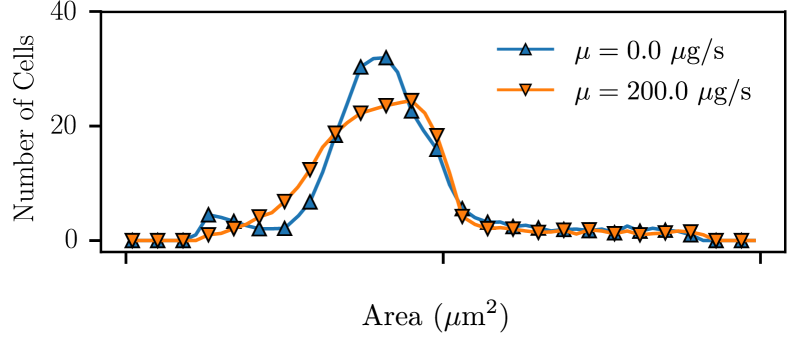
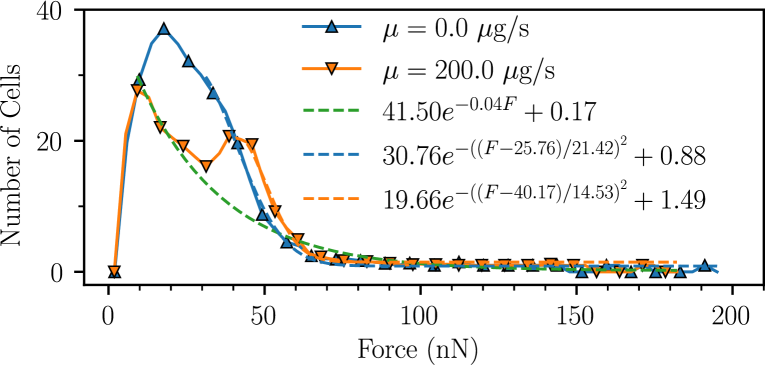
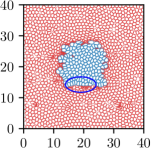
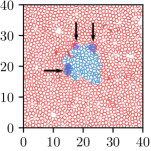
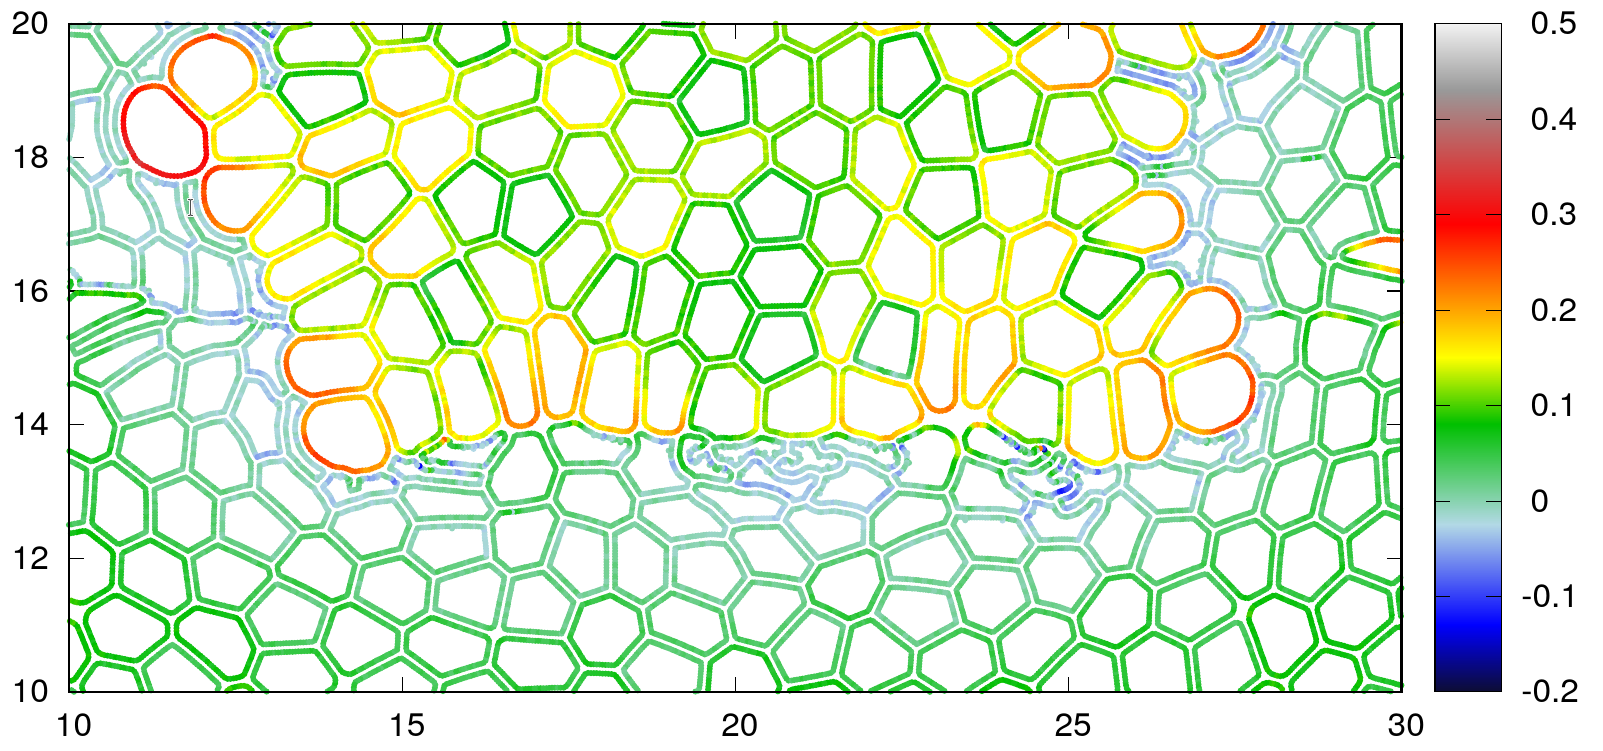
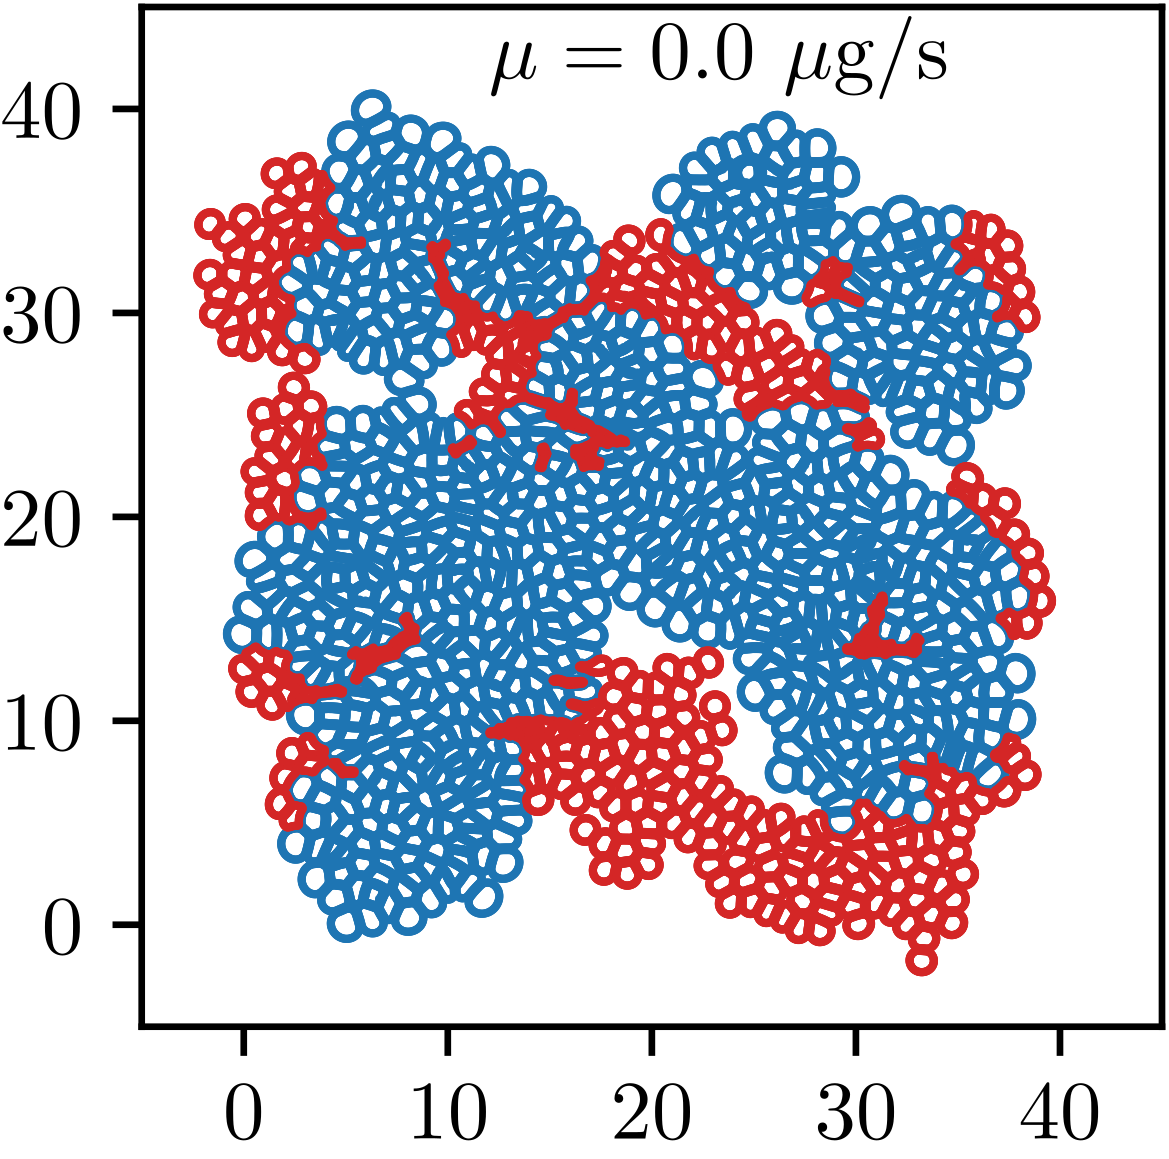
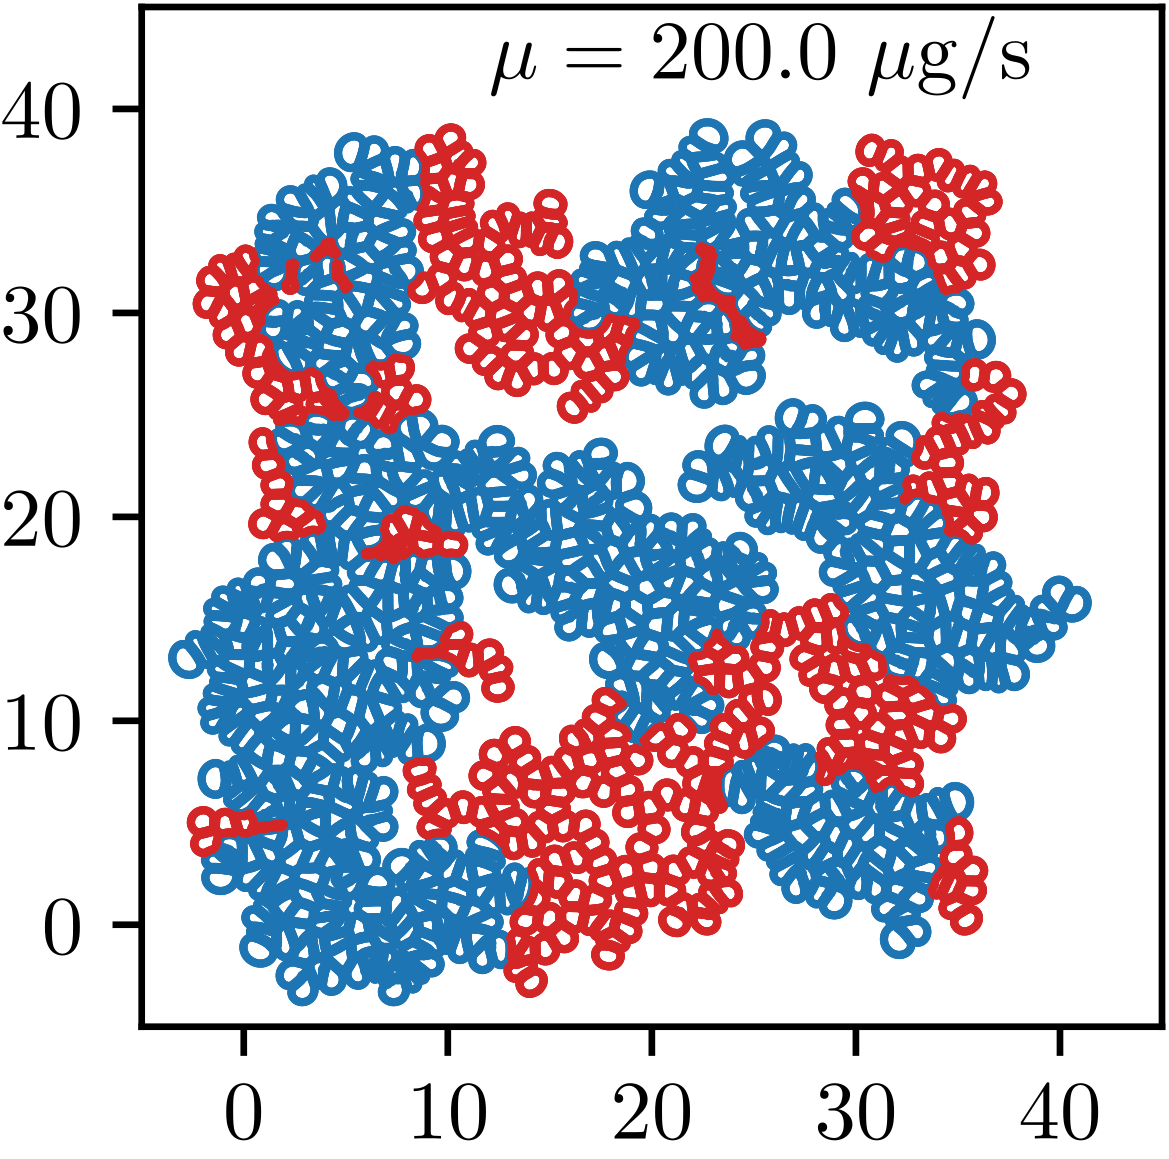
Figure 3 shows a similar simulation setup as before, except with two different values of friction . Figure 3a shows the initial conditions, and Figs. 3b and c, the final states for g/s and g/s, respectively. The tissues in Fig. 3c grow with open boundaries. In both cases, the simulations were run for a time corresponding to 10 division cycles. As expected, at low inter-membrane friction, there are more cells at the end of the simulation indicating faster growth. The high inter-membrane friction system is more porous with slower growth. Physically, the friction-less system (Fig. 3b) corresponds to very early stages of development when junctions have not yet developed and the latter (Fig. 3c) to a case when cell adhesion molecules are present.
To investigate further, we analyzed cellular areas (Fig. 4a) and the forces acting on the cells (Fig. 4b) at confluence. Both distributions display lower total number of cells in the case of the high friction tissue. The peak in area distributions is just below 100 m2, which is due to the threshold division area ( m2). Some of the cell areas have grown past this limit as division occurs only at discrete time intervals.
The area distribution for g/s (Fig. 4a) shows a small peak at m2 due to the higher number of collapsed cells in the low friction system. The large-area peak represents the soft-cell majority with approximately Gaussian shape. This is consistent with the results from simulations of non-dividing soft colloids Åström and Karttunen (2006). For g/s the distribution develops only a single peak.
The distribution of contact forces can perhaps be best understood by picturing two different phases of tissue: 1) A granular phase in which cell density and tissue structure resemble a granular material near jamming. Then the contact forces have the characteristics of granular force-chains with an exponential force distribution at the high-force. 2) A densely packed phase in which cells have overcome jamming, cell density approaches space-filling, forces have been equilibrated and approach a Gaussian. These aspects are discussed in detail below.
All contact forces would relax to toward zero if proliferation stopped and forces were measured after a long enough time. During growth and at low cell-cell friction, the force distribution in Fig. 4b is fairly close to a Gaussian (without negative values). There is however a hint of two separate peaks; when friction is increased, the distribution deviates more from a Gaussian, and its overall structure approaches an exponential function indicating that at zero friction the tissue is closer to the dense-packed phase, while at higher friction the tissue is closer to the granular phase. At high friction, the secondary peak in force distribution develops more clearly. Approximately exponential tails have also been reported in the cell cycle experiments of Trepat et al. Trepat et al. (2009). We will return to this issue in Discussion.
Cells at and above the peaks at larger forces arise as a result of remaining mechanical frustrations in particular at stiff/soft cell boundaries. These frustrations are, as expected, more pronounced at high friction, and more relaxed at low friction. Using tissue with only one type of cells present, the high-force tails of the distributions vanish entirely as there are no such boundaries.
As the final case, we study a cluster of soft cells surrounded by stiff cells to model tumor growth in a healthy tissue and with closed boundary conditions to be able to study densely packed tissues.
Figures 5a,b show morphologies for g/s and at g/ at confluence. Figure 5 shows that the softer (blue) cells introduced into matrices of stiffer cells grow faster when inter-membrane friction is low; weaker cell-cell interactions provide conditions for easier growth. This suggests that inter-cellular interactions can be an indicator of how well epithelial tissue can damp the growth of rogue cells that have a higher growth potential.
The high friction system contains a few pores that have formed due to jamming. Cell sizes are roughly equal within the tumor and inside the matrix but along the tumor boundary, however, the matrix cells are compressed and the tumor cells are enlarged. Further analysis also showed that contact forces are lowest far from the tumour, slightly elevated inside, while largest forces are scattered along the tumor boundary. The matrix cells at the boundary are compressed (i.e. they have a negative membrane strain), while the tumour cells are elongtaed (i.e. they have a positive mebranes strain) near the boundary, Fig. 6. This effect is more pronounced in the low friction case.
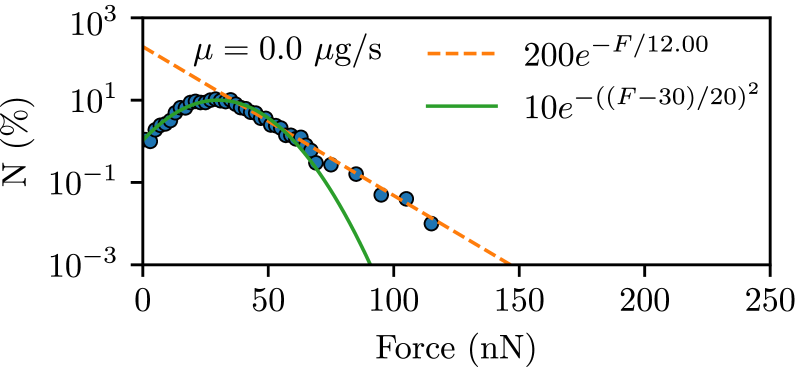
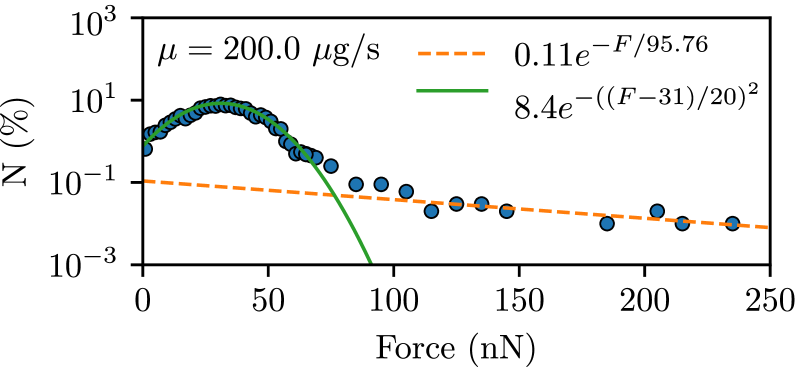
To quantify the above, Figs. 7a,b show the contact force distributions. Independent of friction, the distributions are Gaussian at small forces with an exponential tail. The Gaussian part suggests that the force distribution is uniform. The exponential tail, on the other hand, is a signature of disorder and jamming induced by mechanical frustrations. Here, it results from large differences in the cell-cell contact forces along and near the tumor boundary.
Distributions have also been measured for soft colloidal systems under compression. It is well established that the distribution has an exponential tail in the vicinity of the jamming transition, see e.g., Erikson et al. (2002); Åström and Karttunen (2006); Jose et al. (2016) and reference therein. Experiments by Jose et al. for 3-dimensional packings of soft colloids also show that the distribution well above the jamming transition becomes Gaussian Jose et al. (2016). As Fig. 7 shows, the exponential tail is present at both zero and high friction. The fact that the cells grow also means that their volumes are not conserved (in contrast to typical colloids). This is also the case for the cells that are being pushed and compressed by their neighbors, see the snapshots in Figs. 3 and 5. What is clearly different here is the distribution at low forces: The exponential is preceded by a Gaussian distribution. Gaussian peak has been observed in simulations of soft colloids in two dimensions with zero friction Åström and Karttunen (2006).
In contrast, in the three dimensional experiments of Jose et al. the low force part of the distribution remained almost flat except well above jamming transition. In addition, van Eerd et al. have reported faster than exponential decay from their high accuracy Monte Carlo simulations van Eerd et al. (2007) although the deviations can be very hard to detect without high accuracy sampling methods.
IV Discussion
Using proliferating Madin-Darby canine kidney cells, Trepat et al. Trepat et al. (2009) studied collective migration of cells and came to the conclusion that long-range traction forces drive collective migration. They measured traction distributions and found that in all cases the distributions had exponential tails. Here, we measured the cell-cell contact forces (Figs. 7) and also found exponential tails. Similarly to Trepat et al. Trepat et al. (2009), the peak of the distribution appears to be Gaussian. This indicates that our model is capable of capturing the behavior of real systems, and it confirms that mechanical aspects can be modeled using a such a coarse-grained approach.
Fritsch et al. Fritsch et al. (2010) point out the conundrum that although cancers cells are softer than healthy ones, tumors appear as hard lumps. In particular, Fritsch et al. Fritsch et al. (2010) write: ”At first sight, cell softening is contradictory to the observation that tumours are rigid masses – a notion borne out by the fact that breast tumours are often felt as lumps. Moreover, this apparent softness of tumours would hinder their invasiveness.” As Fig. 2 and 5 show, our model is capable of demonstrating the effect of invasive soft tissue and when growth starts within a matrix, it will become balanced by the pressure from the surrounding tissues (Fig. 5), that is, homeostatic pressure.
In separate studies, Basan et al. Basan et al. (2009) and Podewitz et al. Podewitz et al. (2015) investigated the role of homeostatic pressure using experiments, numerical models and mesoscale simulations in which cells are represented by two point-particles with potentials for growth, adhesion and exclusion. Constant temperature and pressure ensemble were used for the molecular dynamics simulations Podewitz et al. (2015). Due to the representation of cells with central potentials, the approach is not capable of modeling cell-shape changes to any significant degree. As their main conclusion based on their model and experiments, they showed that negative homeostatic pressure (due to compression in the bulk) is both possible and stable. They also showed that homeostatic pressure increases linearly with increasing cell compressibility. Our results agree with this and also demonstrate that the situation is complex. For example, there is destruction of healthy cells at the boundary as a result of concentrated pressure from the cancer cells. These results indicate why cancer cells may be softer.
Perhaps the most interesting comparison is to the theoretical work of Bischofs and Schwarz Bischofs and Schwarz (2003). In particular, they demonstrated that cells prefer to orient themselves in the direction of the largest effective stiffness. This orientational preference is illustrated in Figures 2b and 5a by blue ovals (solid line). The softer blue cells are facing a stiff environment and as a result, they elongate and organize with their long axis perpendicular to the interface. Figure 6 shows the local strain which clearly manifests that force dipoles are present at the boundary. This is exactly what is predicted by the theory of Bischofs and Schwarz for clamped (stiff) boundaries Bischofs and Schwarz (2003). In the interior, the cell shapes are more isotropic as is also the case with a free boundary, see the oval with the dotted blue line in Figure 2b; the outermost cells are not in contact with the boundary yet and hence do not feel it. This is also clearly visible in the simulations with open boundaries, Figure 2. In addition, Figures 2b and 5a show that when going away from a boundary where the softer cells have elongated, this order may persist for a few cell lines before disappearing depending on the local environment. Thus, forces are generated away from the immediate boundary. This is in excellent agreement with the experiments of Trepat et al. Trepat et al. (2009) who argued that force generation is a collective long-range effect rather than requiring ’leader cells’. The figure also shows that when the interface between the hard and soft cells has a more complex shape than a straight line, the cellular shapes and their orientations become more complex. This is also visible in the case of high cell-cell friction.
As already discussed in Introduction, different vertex, Potts and Voronoi-type models have been used to model cell division. Typically, the focus has been on glass-like behavior in (dense) tissues and topological transitions such as the neighbor exchange T1 transition Fletcher et al. (2014); Sussman et al. (2018) and in some cases such models have been combined even with dynamics Sussman et al. (2018); Czajkowski et al. (2019). Since the current model gives spontaneously rise to polygonal distributions (as already reported earlier Mkrtchyan et al. (2014)), it would be possible to use it to study topological changes. That is, however, beyond the scope of the current paper.
Using a vertex model, Bi et al. Bi et al. (2015) demonstrated a new rigidity transition at constant density (confluence). As the key parameter, the model has a (cellular) perimeter to area ratio which determines deformability of cells. This parameter has a critical value distinguishing between rigid and fluid-like tissues. The same effect can be observed in our model. Cells with high internal pressure form a rigid tissue, while deflated cells easily change their perimeter area allowing them to deform and flow past each other. Cell friction also plays a signigicant role in such behaviour. Using cellular area/rigidity ratio is not an optimal control parameter here, but as Fig. 7 shows, the amount of rigidity is governed by cell-cell friction.
V Conclusions
We use the EpiCell2D model to study systems of cells of two different types in 2D. Cell populations are differentiated by their membrane/cortex stiffness. We showed that this simple difference is enough, provided internal pressure is identical for both, to favor soft cell growth. Even if a few soft cells are surrounded by stiff cells, it is enough for the softer cell to grow rapidly. This effect can be mitigated by a higher interaction strength between cells. Force distributions show similarities to non-proliferating soft colloidal systems. Although not studied in detail here, the model allows for tuning the cell-cell friction, an issue that has recently been raised by Vinuth and Sastry for shear jamming Vinutha and Sastry (2016).
From the modeling perspective, the EpiCell2D approach appears to be very versatile. As discussed in Introduction and elsewhere in the text, there are several different models around each with their own strengths. EpiCell2D is, however, able to capture a very wide range of phenomena without additional modifications. As we have already shown earlier Mkrtchyan et al. (2014), it can reproduce the polygonal cell distributions and mitotic indices observed experimentally in epithelial systems, and as shown here, force distributions, and cellular response to different boundaries agree well with experiments and theory.
Acknowledgements.
MK thanks the Discovery and Canada Research Chairs Programs of the Natural Sciences and Engineering Research Council of Canada (NSERC) for financial support.References
- Paluch and Heisenberg (2009) E. Paluch and C.-P. Heisenberg, Curr. Biol. 19, R790 (2009).
- Li et al. (2012) Y. Li, H. Naveed, S. Kachalo, L. X. Xu, and J. Liang, PLoS One 7, e43108 (2012).
- Heisenberg and Bellaïche (2013) C.-P. Heisenberg and Y. Bellaïche, Cell 153, 948 (2013).
- Ragkousi and Gibson (2014) K. Ragkousi and M. C. Gibson, J. Cell Biol. 207, 181 (2014).
- Gibson et al. (2014) W. T. Gibson, B. Y. Rubinstein, E. J. Meyer, J. H. Veldhuis, G. Brodland, R. Nagpal, and M. C. Gibson, Theor. Biol. Med. Model. 11, 26 (2014).
- Sanchez-Gutierrez et al. (2015) D. Sanchez-Gutierrez, M. Tozluoglu, J. D. Barry, A. Pascual, Y. Mao, and L. M. Escudero, EMBO J. 35, 77 (2015).
- Rauzi et al. (2008) M. Rauzi, P. Verant, T. Lecuit, and P.-F. Lenne, Nat. Cell Biol. 10, 1401 (2008).
- Tambe et al. (2011) D. T. Tambe, C. Corey Hardin, T. E. Angelini, K. Rajendran, C. Y. Park, X. Serra-Picamal, E. H. Zhou, M. H. Zaman, J. P. Butler, and D. A. Weitz, Nat. Mater. 10, 469 (2011).
- Trepat et al. (2009) X. Trepat, M. R. Wasserman, T. E. Angelini, E. Millet, D. A. Weitz, J. P. Butler, and J. J. Fredberg, Nat. Phys. 5, 426 (2009).
- Helmlinger et al. (1997) G. Helmlinger, P. A. Netti, H. C. Lichtenbeld, R. J. Melder, and R. K. Jain, Nat. Biotech. 15, 778 (1997).
- Kumar and Weaver (2009) S. Kumar and V. M. Weaver, Canc. Metast. Rev. 28, 113 (2009).
- Alessandri et al. (2013) K. Alessandri, B. R. Sarangi, V. V. Gurchenkov, B. Sinha, T. R. Kiessling, L. Fetler, F. Rico, S. Scheuring, C. Lamaze, A. Simon, et al., Proc. Natl. Acad. Sci. USA 110, 14843 (2013).
- Pilot and Lecuit (2005) F. Pilot and T. Lecuit, Dev. Dyn. 232, 685 (2005).
- Gibson et al. (2006) M. C. Gibson, A. B. Patel, R. Nagpal, and N. Perrimon, Nature 442, 1038 (2006).
- Guillot and Lecuit (2013) C. Guillot and T. Lecuit, Science 340, 1185 (2013).
- Herrero et al. (2016) A. Herrero, J. Stavans, and E. Flores, FEMS Microbiol. Rev. 40, 831 (2016).
- Lecuit (2005) T. Lecuit, Trends Cell Biol. 15, 34 (2005).
- van Helvert et al. (2017) S. van Helvert, C. Storm, and P. Friedl, Nat. Cell Biol. 20, 8 (2017).
- Liu et al. (2010) Z. Liu, J. L. Tan, D. M. Cohen, M. T. Yang, N. J. Sniadecki, S. A. Ruiz, C. M. Nelson, and C. S. Chen, Proc. Natl. Acad. Sci. USA 107, 9944 (2010).
- Pontani et al. (2012) L.-L. Pontani, I. Jorjadze, V. Viasnoff, and J. Brujic, Proc. Natl. Acad. Sci. USA 109, 9839 (2012).
- Zhang and Labouesse (2012) H. Zhang and M. Labouesse, J. Cell Sci. 125, 3039 (2012).
- Åström and Karttunen (2006) J. A. Åström and M. Karttunen, Phys. Rev. E 73, 062301 (2006).
- Jones and Chapman (2012) G. W. Jones and S. J. Chapman, SIAM Rev. 54, 52 (2012).
- Gonzalez-Rodriguez et al. (2012) D. Gonzalez-Rodriguez, K. Guevorkian, S. Douezan, and F. Brochard-Wyart, Science 338, 910 (2012).
- Kursawe et al. (2018) J. Kursawe, R. E. Baker, and A. G. Fletcher, J. Theor. Biol. 443, 66 (2018).
- Fernández et al. (2007) L. A. Fernández, V. Martín-Mayor, and P. Verrocchio, Phys. Rev. Lett 98, 085702 (2007).
- Frenkel and Wales (2011) D. Frenkel and D. J. Wales, Nat. Mat. 10, 410 (2011).
- Charnley et al. (2013) M. Charnley, F. Anderegg, R. Holtackers, M. Textor, and P. Meraldi, PLoS ONE 8, e66918 (2013).
- Hernández-Hernández et al. (2014) V. Hernández-Hernández, D. Rueda, L. Caballero, E. R. Alvarez-Buylla, and M. Benítez, Front. Plant Sc. 5, 265 (2014).
- Lesman et al. (2014) A. Lesman, J. Notbohm, D. A. Tirrell, and G. Ravichandran, J. Cell. Biol. 205, 155 (2014).
- Osterfield et al. (2017) M. Osterfield, C. A. Berg, and S. Y. Shvartsman, Dev. Cell 41, 337 (2017).
- Owen et al. (2017) L. M. Owen, A. S. Adhikari, M. Patel, P. Grimmer, N. Leijnse, M. C. Kim, J. Notbohm, C. Franck, and A. R. Dunn, Mol. Biol. Cell 28, 1959 (2017).
- Gibson and Gibson (2009) W. T. Gibson and M. C. Gibson, in Curr. Top. Dev. Biol. (Elsevier, 2009), pp. 87–114.
- Sadati et al. (2013) M. Sadati, N. T. Qazvini, R. Krishnan, C. Y. Park, and J. J. Fredberg, Differentiation 86, 121 (2013).
- Reichhardt and Olson Reichhardt (2014) C. Reichhardt and C. J. Olson Reichhardt, Phys. Rev. E 90, 012701 (2014).
- Alibert et al. (2017) C. Alibert, B. Goud, and J.-B. Manneville, Biol. Cell 109, 167 (2017).
- Suresh (2007) S. Suresh, Acta Biomater. 3, 413 (2007).
- Mkrtchyan et al. (2014) A. Mkrtchyan, J. Åström, and M. Karttunen, Soft Mat. 10, 4332 (2014).
- Luo et al. (2016) Q. Luo, D. Kuang, B. Zhang, and G. Song, Biochim. Biophys. Acta - General Subjects 1860, 1953 (2016).
- Honda et al. (2004) H. Honda, M. Tanemura, and T. Nagai, J. Theor. Biol. 226, 439 (2004).
- Farhadifar et al. (2007) R. Farhadifar, J.-C. Röper, B. Aigouy, S. Eaton, and F. Jülicher, Curr. Biol. 17, 2095 (2007).
- Hufnagel et al. (2007) L. Hufnagel, A. A. Teleman, H. Rouault, S. M. Cohen, and B. I. Shraiman, Proc. Natl. Acad. Sci. U.S.A. 104, 3835 (2007).
- Fletcher et al. (2014) A. G. Fletcher, M. Osterfield, R. E. Baker, and S. Y. Shvartsman, Biophys. J. 106, 2291 (2014).
- Sussman et al. (2018) D. M. Sussman, M. Paoluzzi, M. C. Marchetti, and M. L. Manning, EPL (Europhysics Letters) 121, 36001 (2018).
- Staple et al. (2010) D. B. Staple, R. Farhadifar, J.-C. Röper, B. Aigouy, S. Eaton, and F. Jülicher, Eur. Phys. J. E 33, 117 (2010).
- Fletcher and Mullins (2010) D. A. Fletcher and R. D. Mullins, Nature 463, 485 (2010).
- Nagpal et al. (2008) R. Nagpal, A. Patel, and M. C. Gibson, Bioessays 30, 260 (2008).
- Patel et al. (2009) A. B. Patel, W. T. Gibson, M. C. Gibson, and R. Nagpal, PLoS Comput. Biol. 5, e1000412 (2009).
- Alt et al. (2017) S. Alt, P. Ganguly, and G. Salbreux, Phil. Trans. Roy. Soc. B 372, 20150520 (2017).
- Schaller and Meyer-Hermann (2004) G. Schaller and M. Meyer-Hermann, Comput. Phys. Commun. 162, 9 (2004).
- Schaller and Meyer-Hermann (2005) G. Schaller and M. Meyer-Hermann, Phys. Rev. E 71, 051910 (2005).
- Meyer-Hermann (2008) M. Meyer-Hermann, Curr. Top. Dev. Biol. pp. 373–399 (2008).
- Beyer and Meyer-Hermann (2009) T. Beyer and M. Meyer-Hermann, IEEE Eng. Med. Biol. Mag. 28, 38 (2009).
- Radszuweit et al. (2009) M. Radszuweit, M. Block, J. G. Hengstler, E. Schöll, and D. Drasdo, Phys. Rev. E 79, 051907 (2009).
- Rejniak (2007) K. A. Rejniak, J.Theor. Biol. 247, 186 (2007).
- Graner and Glazier (1992) F. Graner and J. .A. Glazier, Phys. Rev. Lett. 69, 2013 (1992).
- Szabó and Merks (2013) A. Szabó and R. M. H. Merks, Front. Oncol. 3, 87 (2013).
- Shirinifard et al. (2009) A. Shirinifard, J. S. Gens, B. L. Zaitlen, N. J. Popławski, M. Swat, and J. A. Glazier, PLoS One 4, e7190 (2009).
- Merks and Glazier (2005) R. M. H. Merks and J. A. Glazier, Physica A 352, 113 (2005).
- Nonomura (2012) M. Nonomura, PLoS ONE 7, e33501 (2012).
- Palmieri et al. (2015) B. Palmieri, Y. Bresler, D. Wirtz, and M. Grant, Sci. Rep. 5, 11745 (2015).
- Palmieri et al. (2019) B. Palmieri, C. Scanlon, D. Worroll, M. Grant, and J. Lee, PLoS One 14, e0212162 (2019).
- Jiang et al. (2019) J. Jiang, K. Garikipati, and S. Rudraraju, Bull. Math. Biol. 81, 3282–3300 (2019).
- Liedekerke et al. (2018) P. V. Liedekerke, J. Neitsch, T. Johann, E. Warmt, S. Grosser, I. G. Valverde, J. Kaes, S. Hoehme, and D. Drasdo, bioRxiv p. DOI: 10.1101/470559 (2018).
-
Drasdo et al. (2018)
D. Drasdo,
A. Buttenschön,
and P. V.
Liedekerke, in Numerical Methods and
Advanced Simulation in
Biomechanics and Biological Processes (Elsevier, 2018), pp. 223–238. - Rejniak and Anderson (2008) K. A. Rejniak and A. R. A. Anderson, Bull. Math. Biol. 70, 677 (2008).
- Liedekerke et al. (2015) P. V. Liedekerke, M. M. Palm, N. Jagiella, and D. Drasdo, Comput. Part. Mec. 2, 401 (2015).
- Clark and Paluch (2011) A. G. Clark and E. Paluch, 53, 31 (2011).
- Phillips et al. (2012) K. G. Phillips, S. L. Jacques, and O. J. T. McCarty, Phys. Rev. Lett 109, 118105 (2012).
- Stewart et al. (2011) M. P. Stewart, J. Helenius, Y. Toyoda, S. P. Ramanathan, D. J. Muller, and A. A. Hyman, Nature 469, 226 (2011).
- Schluter et al. (2014) D. K. Schluter, I. Ramis-Conde, and M. A. J. Chaplain, J. Royal Soc. Interf. 12, 20141080 (2014).
- Streichan et al. (2014) S. J. Streichan, C. R. Hoerner, T. Schneidt, D. Holzer, and L. Hufnagel, Proc. Natal. Acad. Sci. USA 111, 5586 (2014).
- Green (2019) D. R. Green, Cell 177, 1094 (2019).
- Podewitz et al. (2015) N. Podewitz, M. Delarue, and J. Elgeti, EPL (Europhysics Letters) 109, 58005 (2015).
- Czajkowski et al. (2019) M. Czajkowski, D. M. Sussman, M. C. Marchetti, and M. L. Manning, Soft Matter 15, 9133 (2019).
- Chen (1997) C. S. Chen, Science 276, 1425 (1997).
- Shraiman (2005) B. I. Shraiman, Proc. Natal. Acad. Sci. USA 102, 3318 (2005).
- Nguyen et al. (2016) A. V. Nguyen, K. D. Nyberg, M. B. Scott, A. M. Welsh, A. H. Nguyen, N. Wu, S. V. Hohlbauch, N. A. Geisse, E. A. Gibb, A. G. Robertson, et al., Integr. Biol. 8, 1232 (2016).
- Angelini et al. (2012) T. E. Angelini, A. C. Dunn, J. M. Urueña, D. J. Dickrell, D. L. Burris, and W. G. Sawyer, Faraday Disc. 156, 31 (2012).
- Mehrara et al. (2007) E. Mehrara, E. Forssell-Aronsson, H. Ahlman, and P. Bernhardt, Cancer Res. 67, 3970 (2007).
- Hanahan and Weinberg (2011) D. Hanahan and R. A. Weinberg, Cell 144, 646 (2011).
- Fritsch et al. (2010) A. Fritsch, M. Höckel, T. Kiessling, K. D. Nnetu, F. Wetzel, M. Zink, and J. A. Käs, Nature Physics 6, 730 (2010).
- Eisenhoffer et al. (2012) G. T. Eisenhoffer, P. D. Loftus, M. Yoshigi, H. Otsuna, C.-B. Chien, P. A. Morcos, and J. Rosenblatt, Nature 484, 546 (2012).
- Bischofs and Schwarz (2003) I. B. Bischofs and U. S. Schwarz, Proc. Natal. Acad. Sci. USA 100, 9274 (2003).
- Erikson et al. (2002) M. J. Erikson, N. W. Mueggenburg, H. M. Jaeger, and S. R. Nagel, Phys. Rev. E 66, 040301(R) (2002).
- Jose et al. (2016) J. Jose, A. van Blaaderen, and A. Imhof, Phys. Rev. E 93, 062901 (2016).
- van Eerd et al. (2007) A. R. T. van Eerd, W. G. Ellenbroek, M. van Hecke, J. H. Snoeijer, and T. J. H. Vlugt, Phys. Rev. E 75, 060302(R) (2007).
- Basan et al. (2009) M. Basan, T. Risler, J.-F. Joanny, X. Sastre-Garau, and J. Prost, HFSP J. 3, 265 (2009).
- Bi et al. (2015) D. Bi, J. H. Lopez, J. M. Schwarz, and M. L. Manning, Nature Physics 11, 1074 (2015).
- Vinutha and Sastry (2016) H. A. Vinutha and S. Sastry, Nat. Phys. 12, 578 (2016).