LandCover.ai: Dataset for Automatic Mapping of Buildings, Woodlands, Water and Roads from Aerial Imagery
Abstract
Monitoring of land cover and land use is crucial in natural resources management. Automatic visual mapping can carry enormous economic value for agriculture, forestry, or public administration. Satellite or aerial images combined with computer vision and deep learning enable precise assessment and can significantly speed up change detection. Aerial imagery usually provides images with much higher pixel resolution than satellite data allowing more detailed mapping. However, there is still a lack of aerial datasets made for the segmentation, covering rural areas with a resolution of tens centimeters per pixel, manual fine labels, and highly publicly important environmental instances like buildings, woods, water, or roads.
Here we introduce LandCover.ai (Land Cover from Aerial Imagery) dataset for semantic segmentation. We collected images of 216.27 km2 rural areas across Poland, a country in Central Europe, 39.51 km2 with resolution 50 cm per pixel and 176.76 km2 with resolution 25 cm per pixel and manually fine annotated four following classes of objects: buildings, woodlands, water, and roads. Additionally, we report simple benchmark results, achieving 85.56% of mean intersection over union on the test set. It proves that the automatic mapping of land cover is possible with a relatively small, cost-efficient, RGB-only dataset. The dataset is publicly available at https://landcover.ai.linuxpolska.com/
1 Introduction
Monitoring and assessment of land cover and land use are essential in natural resources management. Remote sensing data and image processing techniques have been widely used to provide a land description and change detection in urban and countryside areas. Detailed information about land use or land cover is a valuable source in various fields, such as urban planning [30, 43], change detection [17], vegetation monitoring [2], or even military reconnaissance. Changes in land cover are important as an indicator of environmental change [38, 37], forest cover dynamics [32], and degradation [21] as well as one of the methods of biodiversity monitoring [31]. This type of data can be used to investigate processes that take place in the landscape, such as flows between various land covers [16] allowing to study the rate of urbanization, deforestation, agricultural intensity, and other man-made changes.
The majority of those studies use multispectral satellite imagery. Though such data are useful for many purposes, the resolution of available free satellite data is generally between 10 and 30 m [39] and high-resolution commercial satellite images are rather expensive. The aerial photographs, often done by local and state government, usually have a pixel size of 25-50 cm or even lower.
Aerial imagery used as a proper assessment of land parcel content carries high economic values for agricultural and public administration. Taxes and government subsidies depend on the nature of the parcel usage \egplantations or buildings. However, human activity results in frequent changes in the appearance and usage of parcels. To discover these changes, new aerial orthophotos are required. Then it is necessary to indicate and vectorize all objects that have emerged or disappeared. For example, public agencies paying subsidies need to detect changes in classes of objects not eligible for the payments. From the business point of view, buildings, trees (including forests), water and roads are the most common objects. These classes are also affected by the dynamics of change over time.
Typically, the change detection process is carried out manually or using simple image classification (object or pixel [5, 23, 6, 2]). Most GIS-based programs provide a large number of such tools. The operator browses individual orthophotos images and physically indicates the ”new” objects. The whole process usually takes months throughout the country. Our own experience shows that for the area of over 312 000 km2 this workflow is very time-consuming and results in a significant error level (on average above 30% over multiple years). Consequently, it is expensive to manually encode large areas of land [17]. Therefore, it becomes necessary to develop an efficient automatic tool to shorten the processing time and ensure higher accuracy.
The classical computer vision approach, based on manually crafted feature extractors and rules, is insufficient in case of high variance and large scale of data and effects in the high effort and poor scalability. Deep learning with convolutional neural networks (CNN) has started to play a critical role in automatic change detection on aerial images [22, 27, 28, 35]. The unique composition of features such as scalability, affordability, and performance allows for quick and accurate monitoring of much larger regions. Moreover, it provides the possibility to detect changes over time \egby comparing the semantic segmentation of particular areas for different moments. Unfortunately, the deep learning approach usually requires large datasets with ground truth annotations.
While aerial images are readily obtainable, the efforts to generate high-quality datasets are limited by the enormous effort required to create accompanying annotations. Similar to other domains, the lack of natural annotated datasets is a limiting factor in the use of computer vision to land cover segmentation. A few fine-annotated datasets have been released recently [1, 10, 9, 26]. On the other hand, [20] uses RGB orthophotos from Google Maps together with weakly labeled training data automatically derive from OpenStreetMap to detect buildings and roads.
However, none of the above provide segmentation of buildings, woodlands, water, and roads simultaneously. To address this issue, we introduce LandCover.ai (Land Cover from Aerial Imagery) dataset suitable for semantic segmentation, which contains four manually annotated classes mentioned above. We collected images of 216.27 km2 of lands across Poland, a medium-sized country in Central Europe, 39.51 km2 with resolution 50 cm per pixel and 176.76 km2 with resolution 25 cm per pixel. Furthermore, we provide some results of a baseline model as a benchmark for comparison.
2 Related works
As mentioned, deep convolutional neural networks offer significant speedup over the previous manual work but require properly annotated data. Most segmentation datasets focus primarily on common objects or street views [12, 25], but aerial or satellite imagery requires a different perspective and an adequate set of classes. There are some datasets with aerial and satellite images.
One of the earliest satellite datasets is UC-Merced [41] with 30 cm per pixel resolution and 21 categories like buildings, forest, and even rivers. However, it is prepared for a classification of whole images, which is insufficient for the segmentation task. Other similar datasets like WHU-RS Dataset [24], RSSCN7 [18], AID [40], NWPU-RESISC45 [14], and PatternNet [44], which are mostly collected from Google Maps, are for image classification also.
On the other hand, DOTA [3] and iSAID [42] are aerial datasets made for multi-class detection and instance segmentation respectively. Even though they have many categories (15 classes like vehicles, bridges, ships, but also courts and game fields), they are inadequate for public agencies’ responsibilities like natural resources management.
Datasets created only for buildings or vegetation segmentation are useful but not entirely sufficient in land cover change detection. Those datasets include the Massachusetts Buildings Dataset [28], the Inria Aerial Image Labeling Dataset [26], the AIRS Automatic Mapping of Buildings Dataset [9], the Agriculture-Vision a Large Aerial Image Database for Agricultural Pattern Analysis [10], and the Tree Cover dataset for the year 2010 of the Metropolitan Region of São Paulo [36].
ISPRS Vaihingen and Potsdam datasets [1] are manually annotated, but they are relatively small (fewer than 5 km2 of labeled data). Although they have the most common classes, water class is missing. Moreover, they mainly cover urban areas.
Chesapeake Bay Land Cover Dataset [33] is very large (160,000 km2, 2% of the USA), but has a lower resolution (1 m) than desired and seems to be automatically annotated. There are many useful classes (\egwater, tree canopy, impervious roads) but the category ”building” is missing.
3 The dataset
We decided to create a simple RGB-only dataset, fully manually annotated, large, and diverse enough to train a model for accurate semantic segmentation.
3.1 Data acquisition
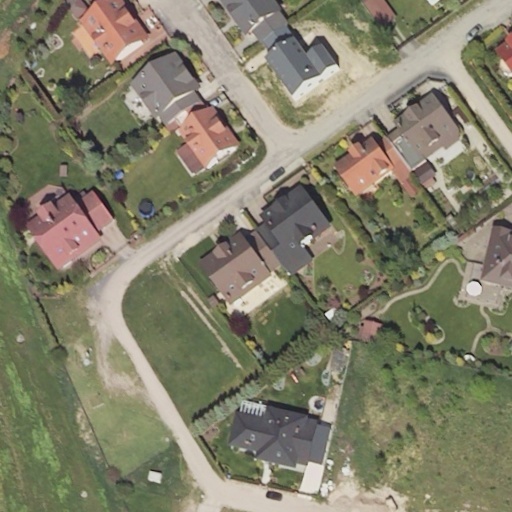
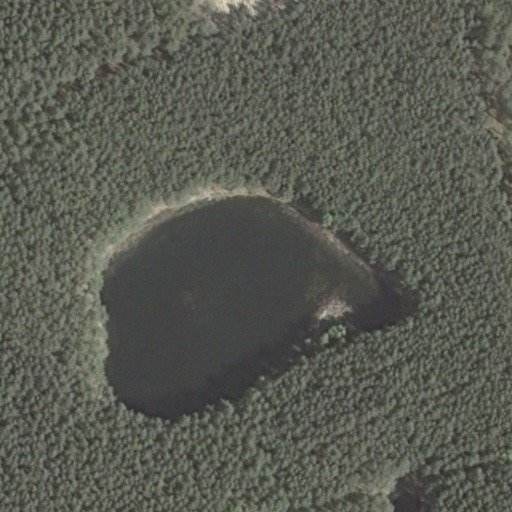
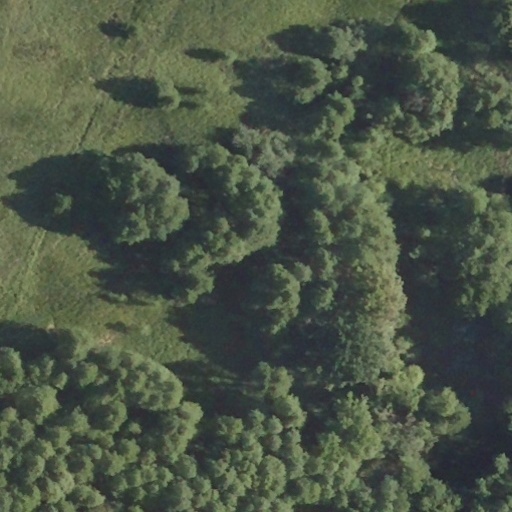
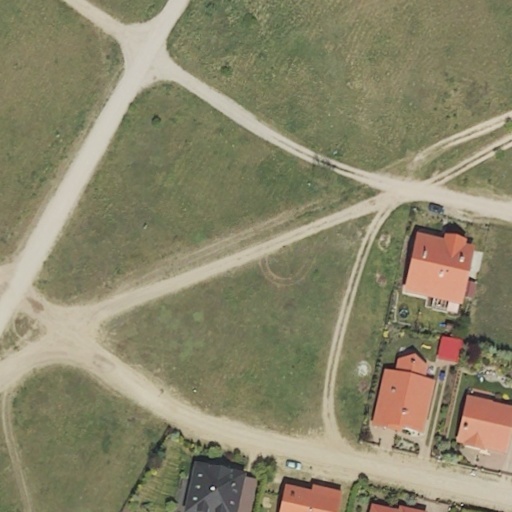
The dataset consists of images selected from aerial photos used to develop the digital orthophoto covering the whole of Poland. All images come from the public geodetic resource and are compiled to update reference data of the land parcel identification system (LPIS). Digital orthophotos are made in cartesian ”1992” (EPSG:2180) co-ordinate spatial reference system. Pictures were taken in spatial resolution of 25 or 50 cm per pixel with three spectral bands RGB. They come from different years (2015 - 2018) and flights. The photo-flying season in Poland begins in April and lasts until the end of September. Therefore, the acquired photos are characterized by a wide variety of optical conditions. They include images of different saturation, angles of sunlight, and shadow lengths. Simultaneously, the photos are from varying periods of the vegetation season. It makes this dataset robust and more applicable.
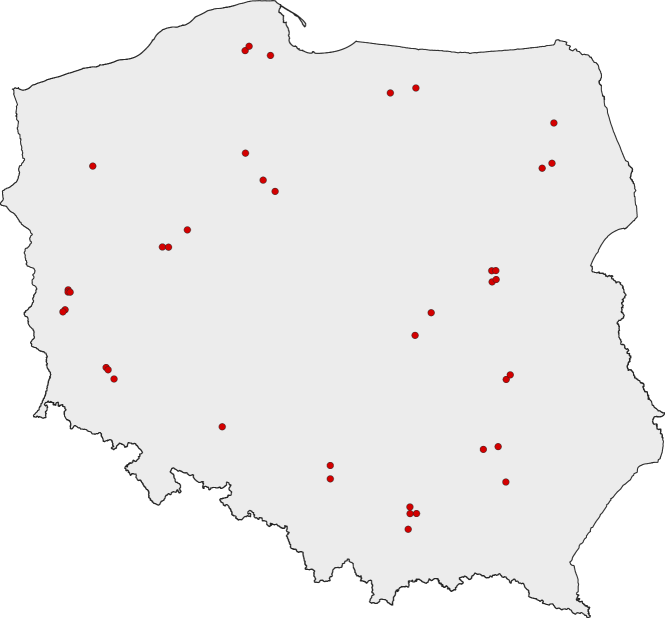
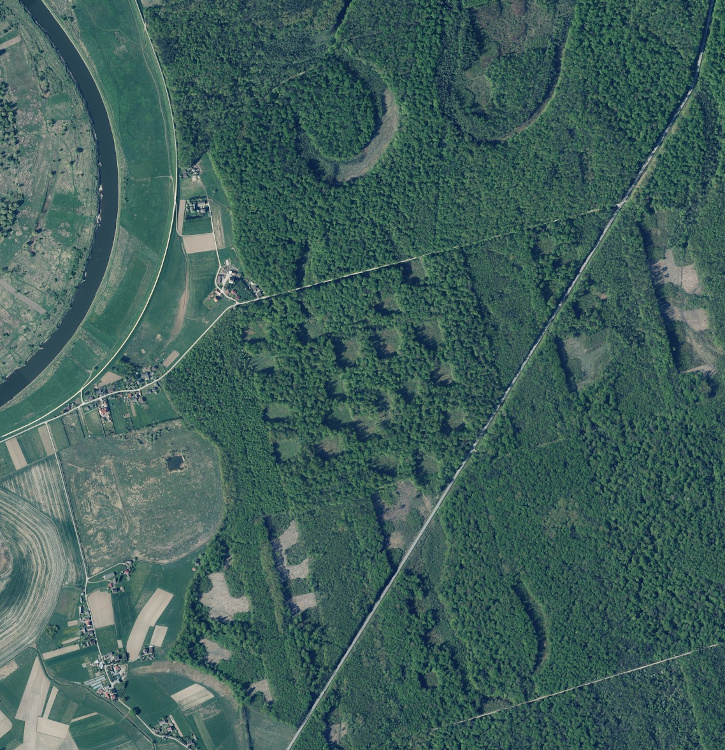
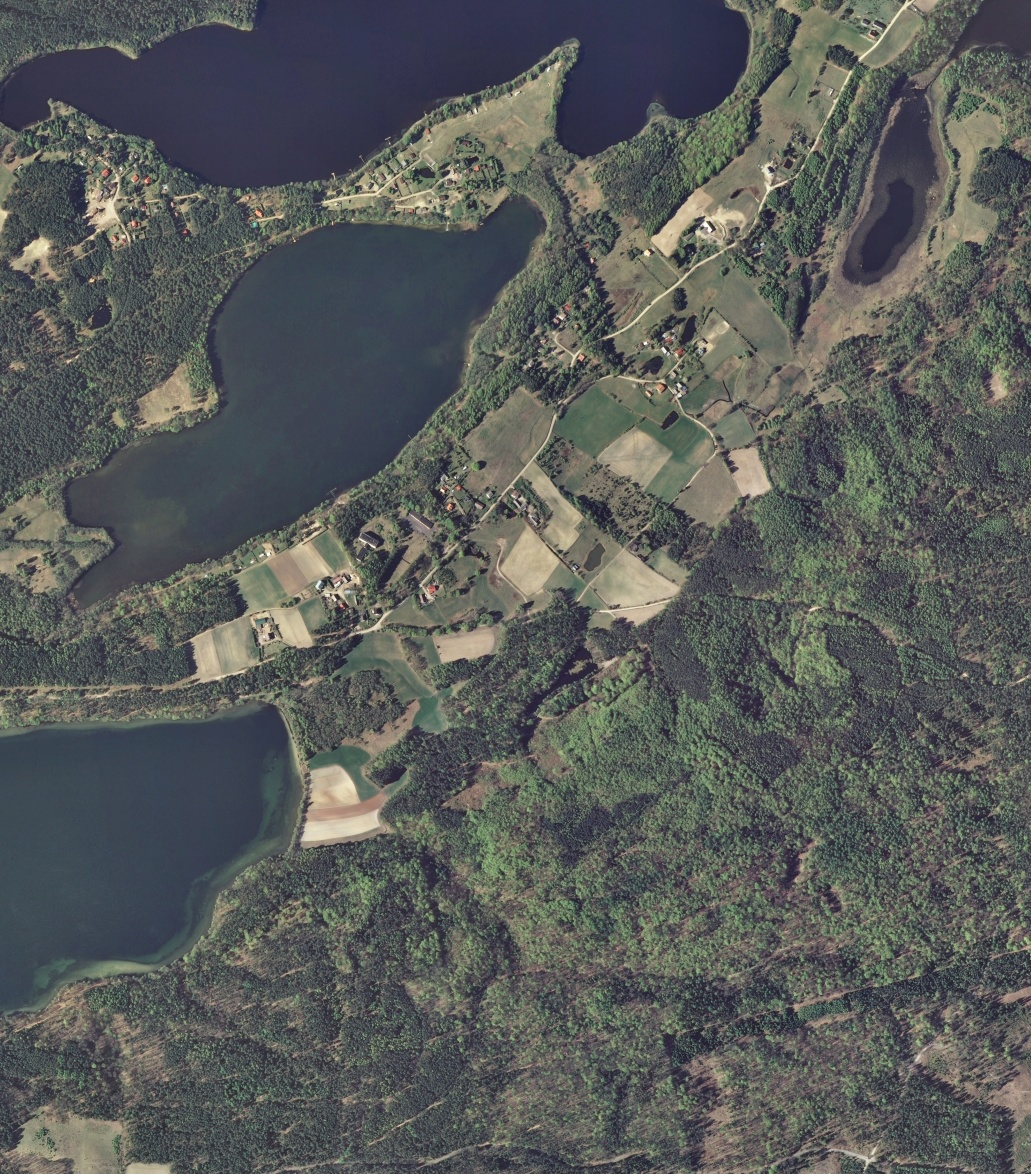
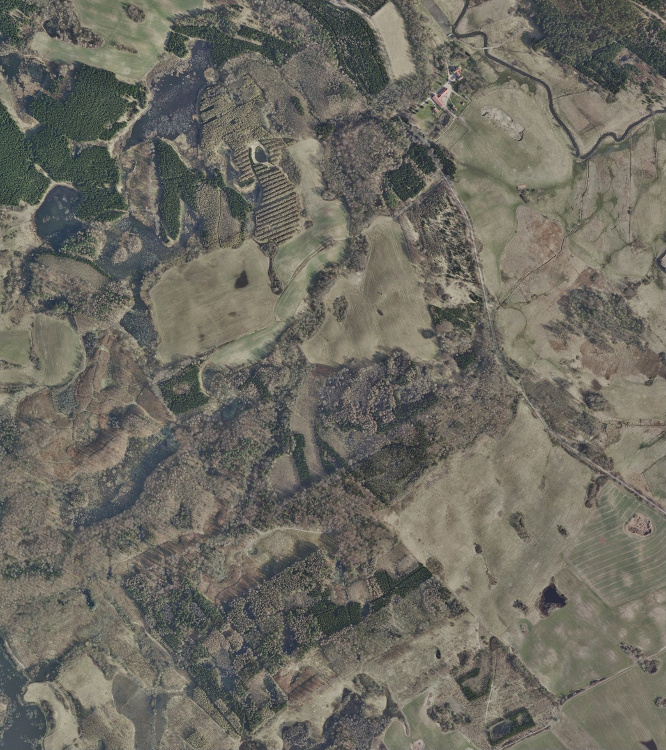
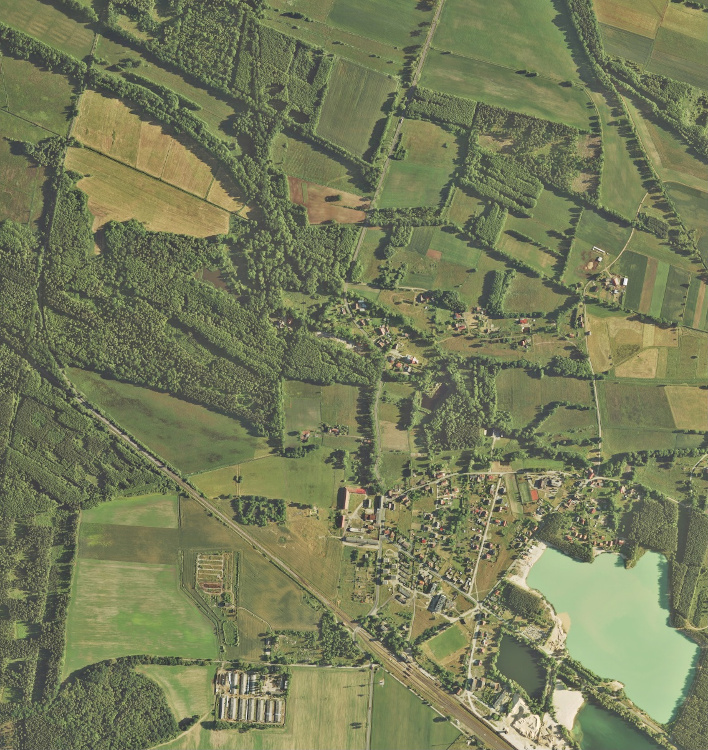
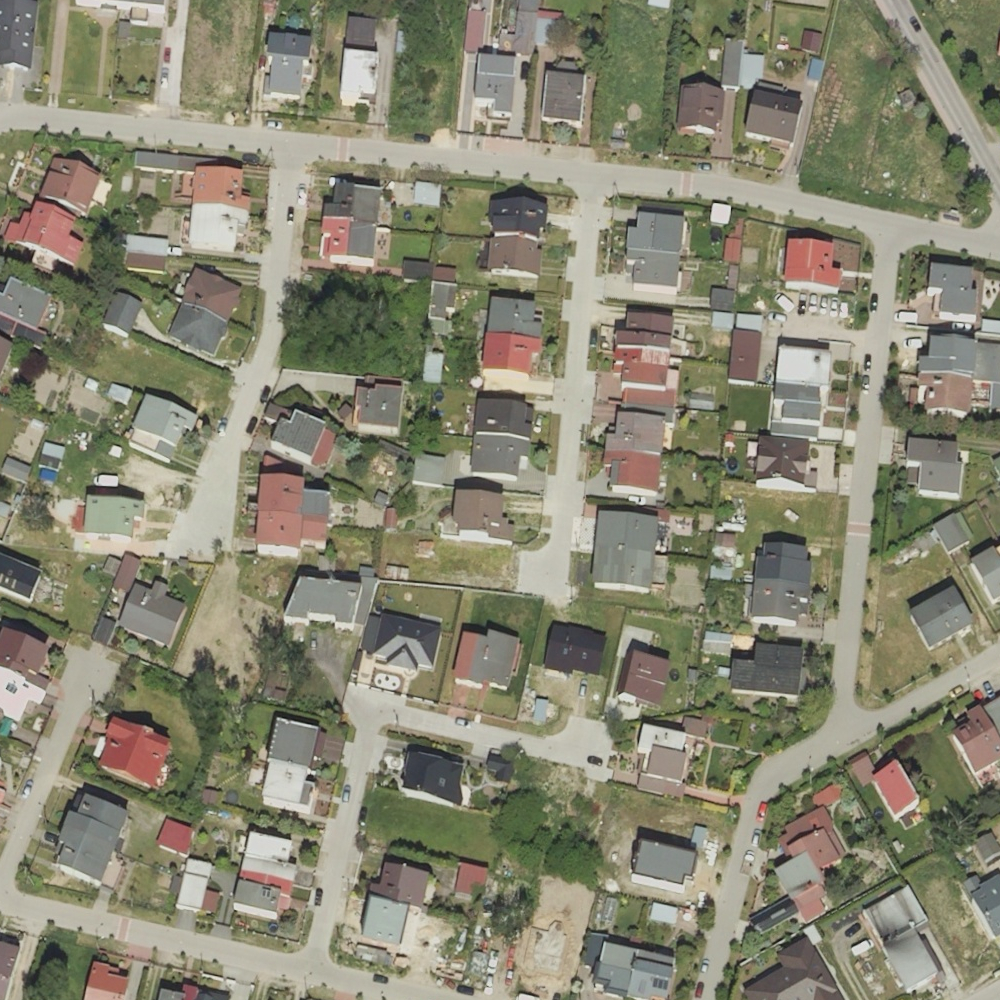
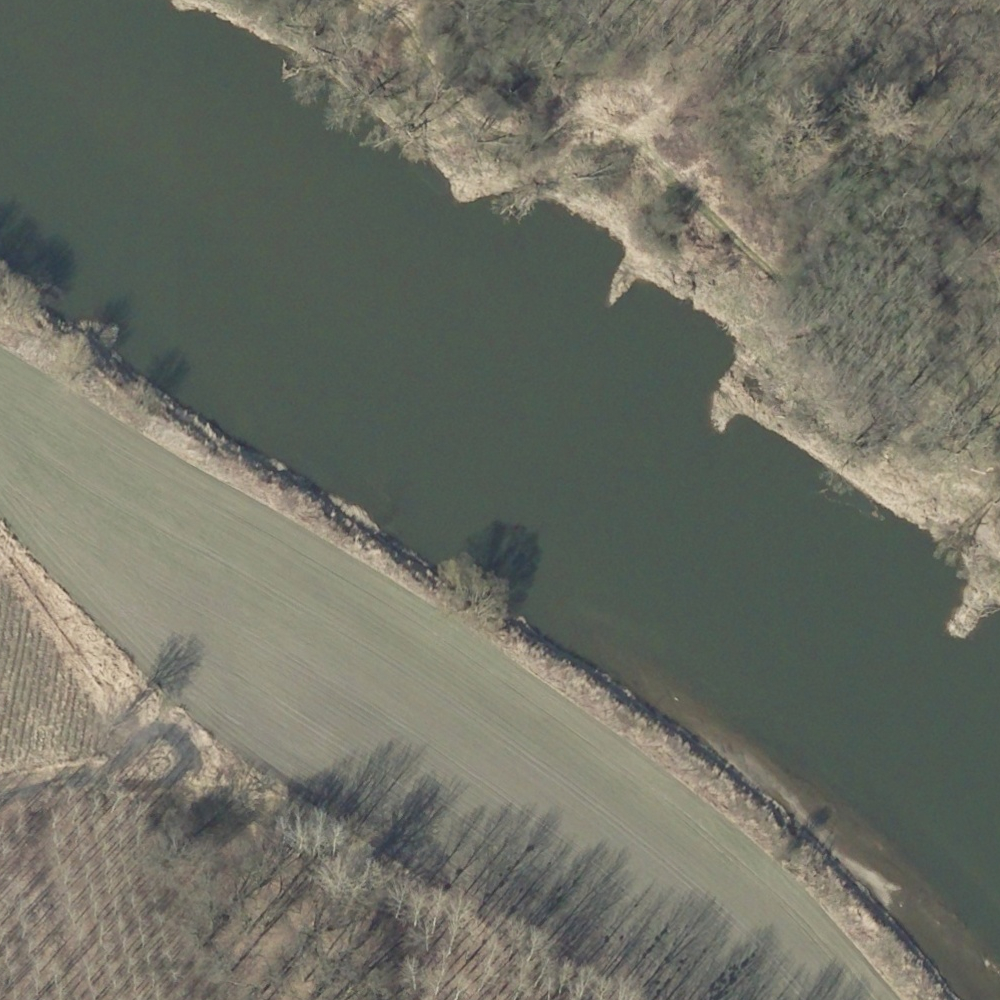
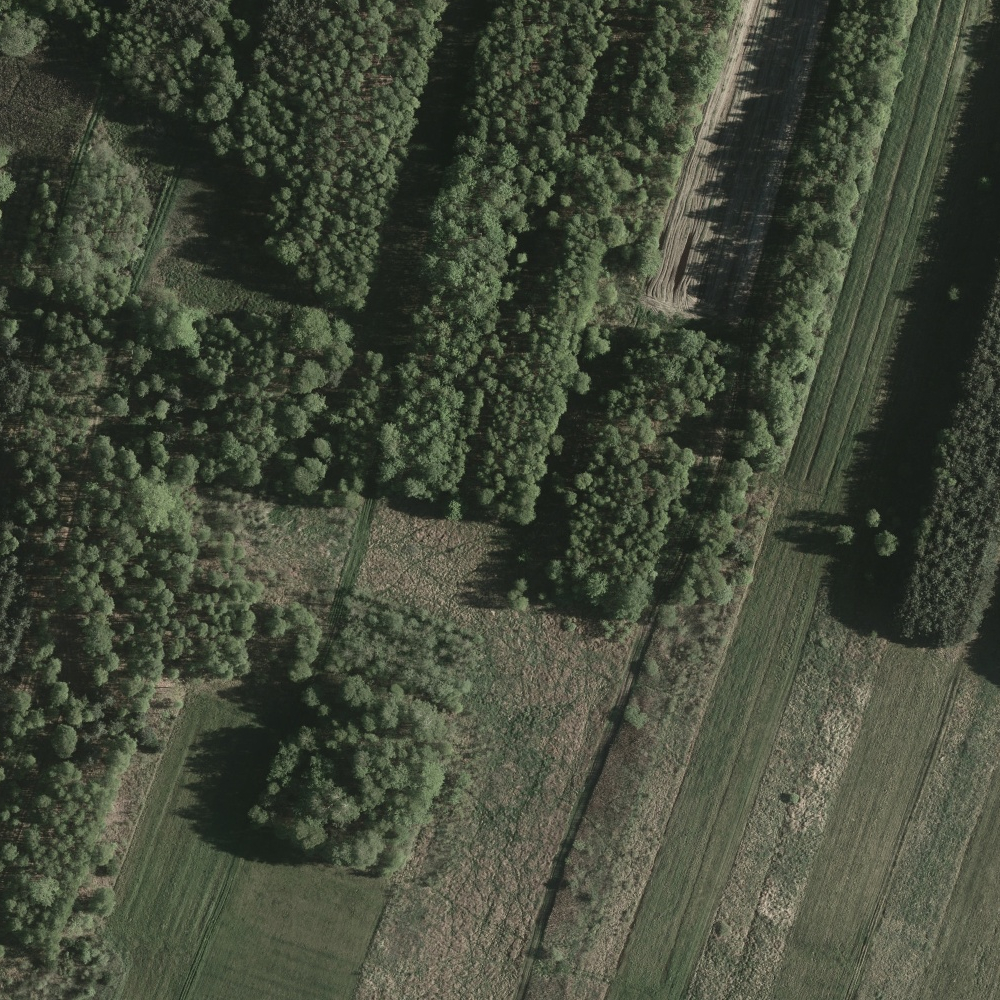
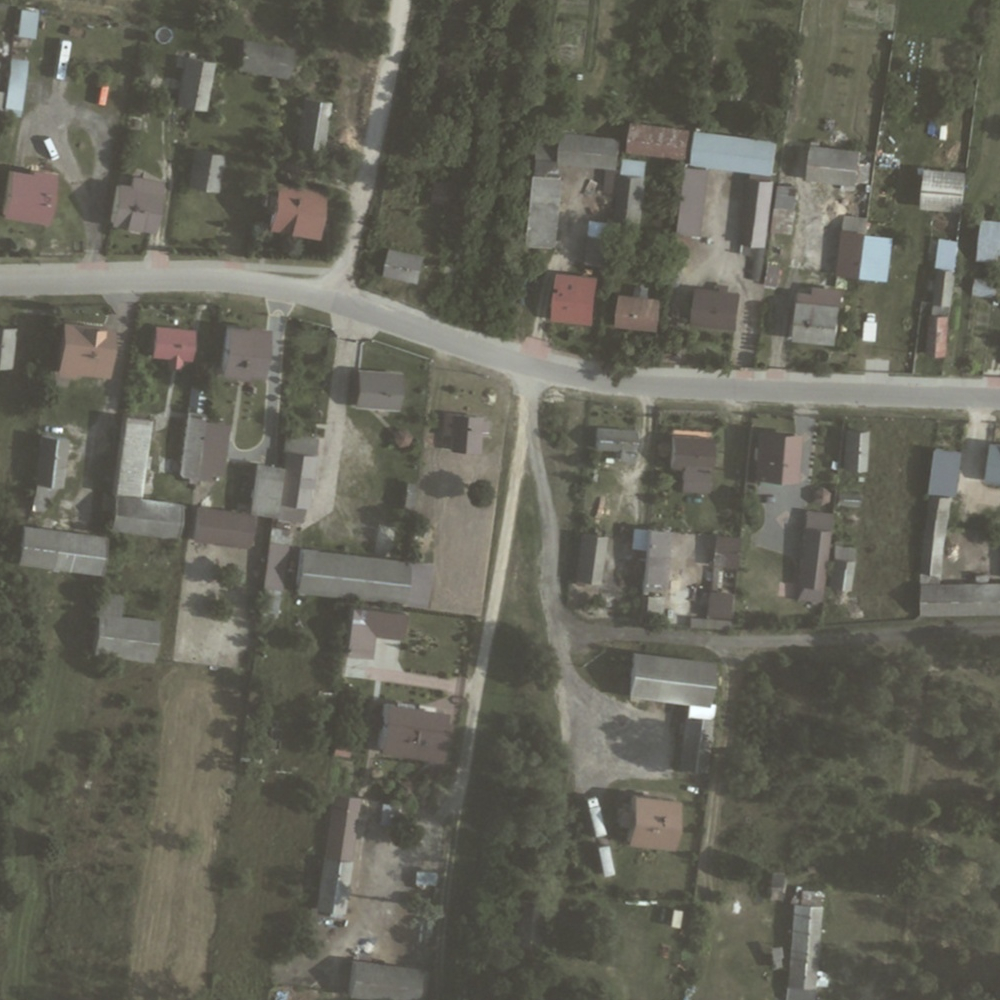
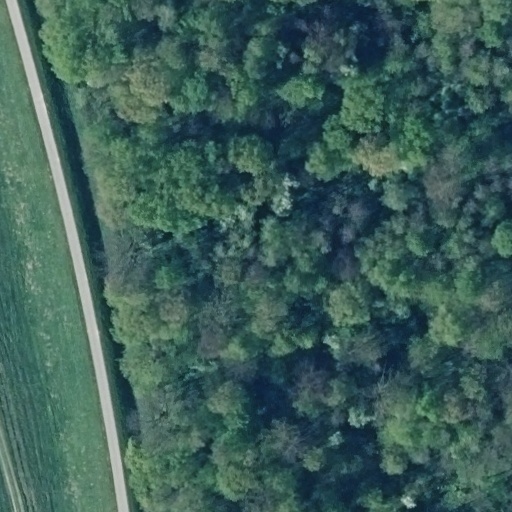
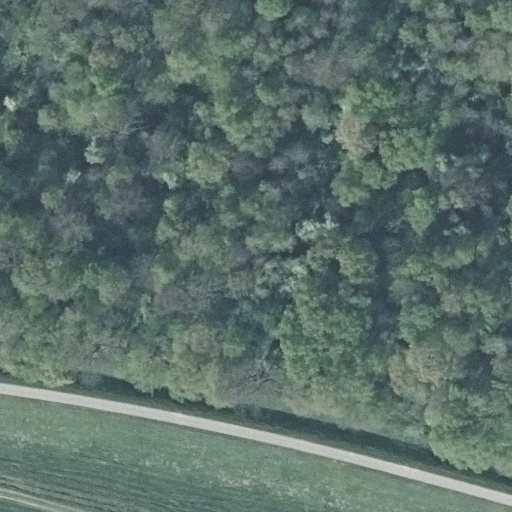
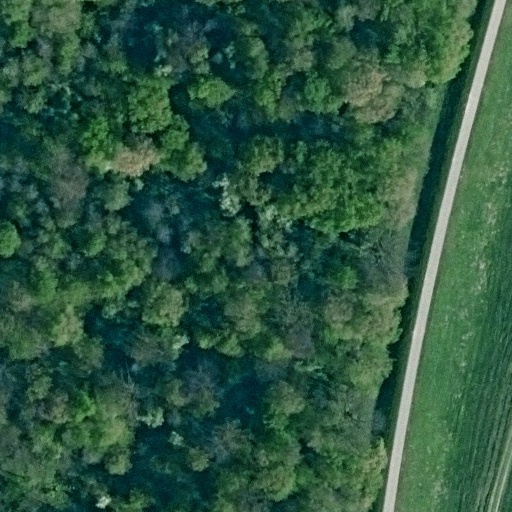
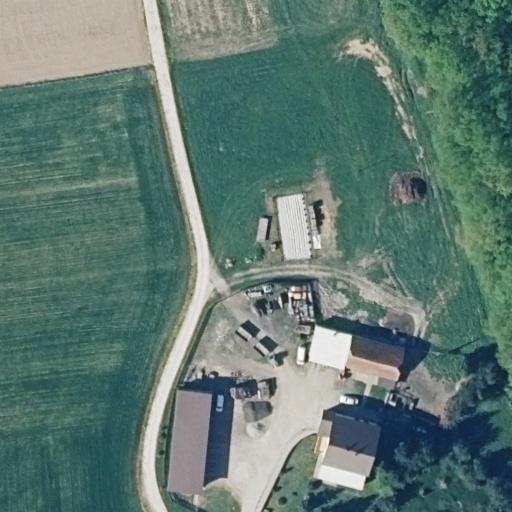
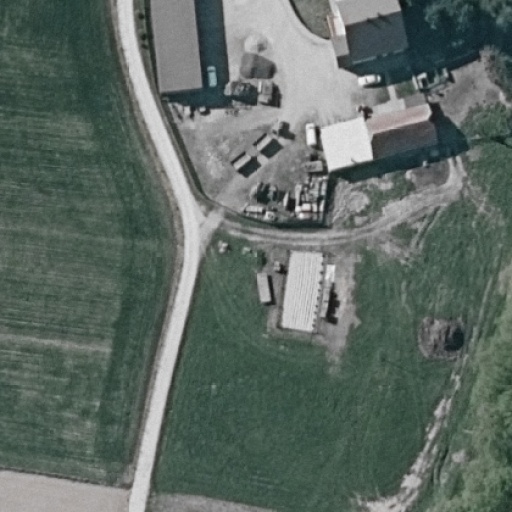
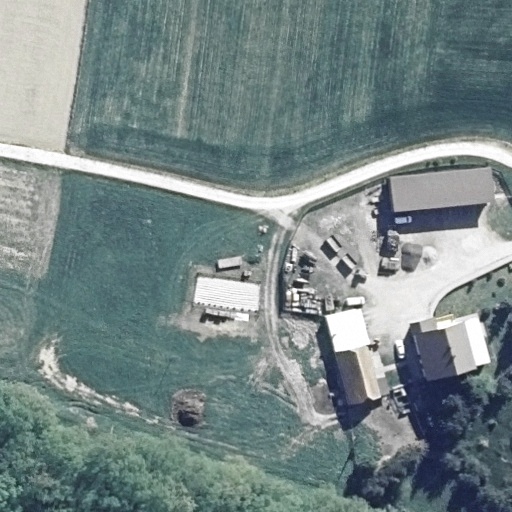
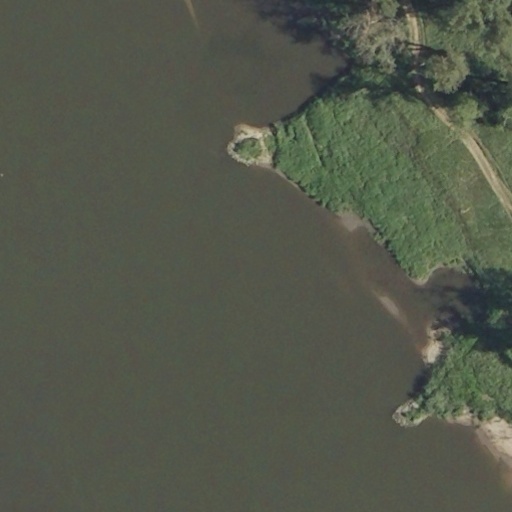
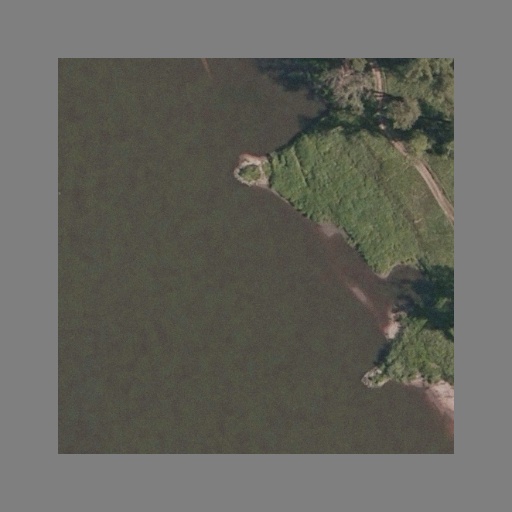
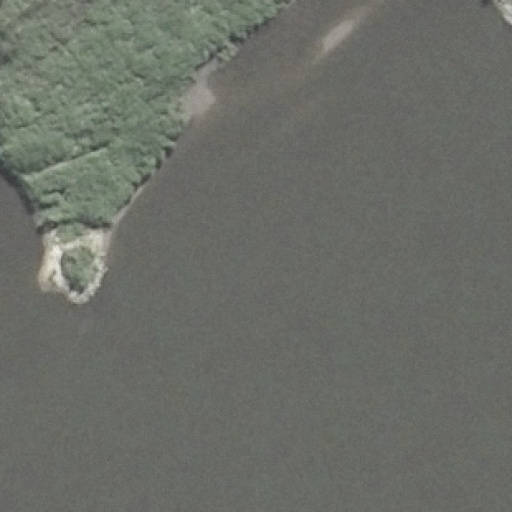
For the sake of maximum diversity of the dataset, we manually selected 41 orthophoto tiles from different counties located in all regions (as shown in Figure 1). Every tile has about 5 km2. There are 33 images with resolution 25 cm (ca. px) and 8 images with resolution 50 cm (ca. px), what gives 176.76 km2 and 39.51 km2 respectively and 216.27 km2 overall. Figure 2 shows samples of chosen images.
3.2 Land cover characteristics
The selected areas are located in Poland, i.e., in Central Europe. The majority of Poland spreads in the eastern part of the North European Plain. The country’s geographic regions extend latitudinally, gradually passing from the lowlands in the north and center to highlands and mountains in the south of the country. The landscape is dominated by agricultural areas with a varied agrarian structure (60%) as well as coniferous, deciduous, and mixed forests (29.6%). The Polish forest cover is similar to the average of European (excluding Russia) and North American (both about 33% of the area). Due to favorable climatic conditions, Poland’s dominant forest type is coniferous forest (68.4%, where pine accounts for 58%). There are 38 urban agglomerations with more than 100 000 inhabitants, including one that exceeds 1 million. The extensive postglacial lake districts occupy the north of Poland, but numerous pounds are also scattered in the rest of the country.
3.3 Classes
We decided to annotate the images using four classes: building (1), woodland (2), water (3), and road (4) due to their usefulness and importance for public administration cases.
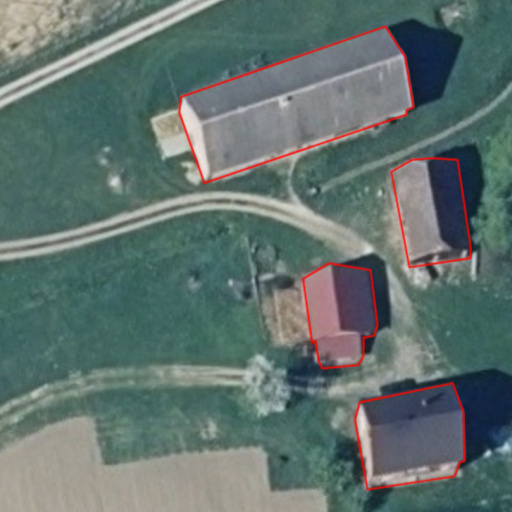
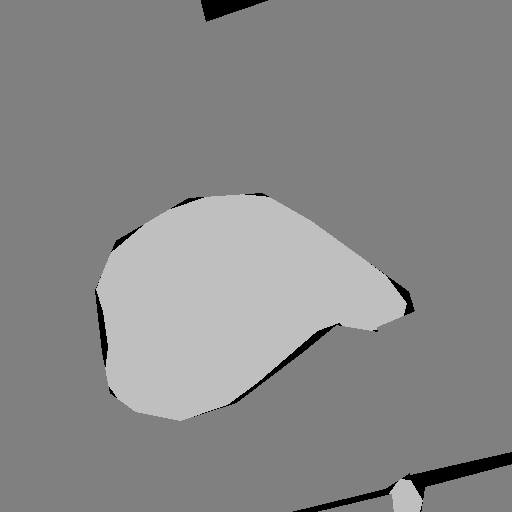
Building. An object standing permanently in one place. Greenhouses are excluded. Our images are not true orthophotos, so each building is annotated as roof and visible walls as shown in Figure 3.
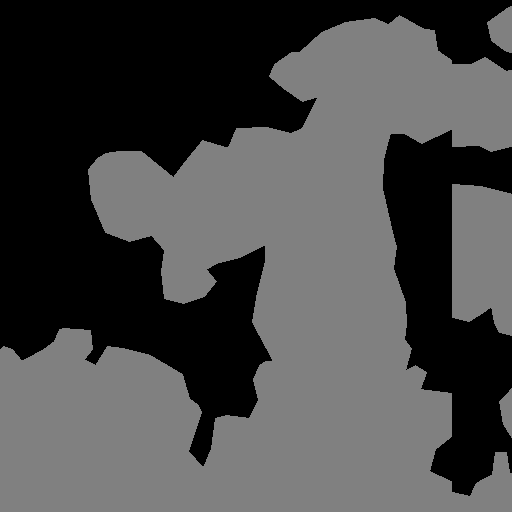
Woodland. Land covered with trees standing in proximity. Single trees and orchards are excluded.
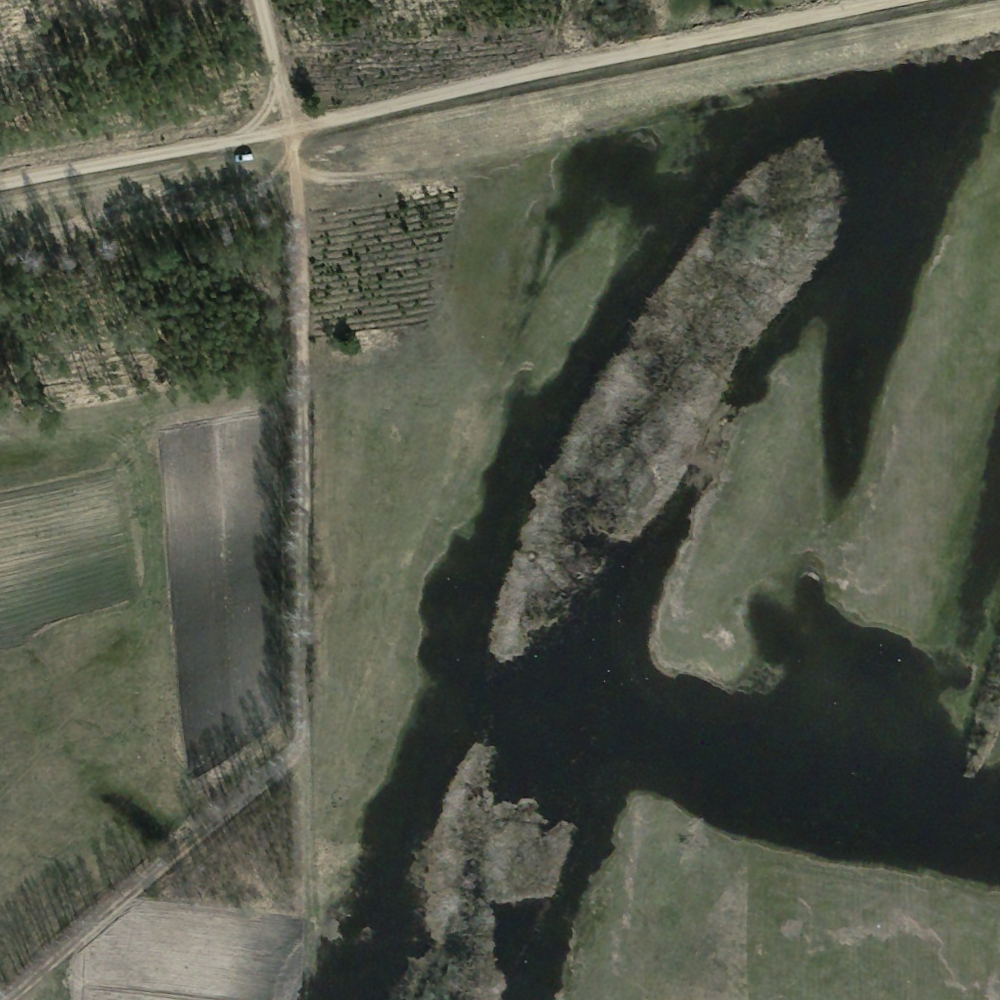
Water. Flowing and stagnant water including ponds and pools. Ditches and dry riverbeds are excluded.
Road. The infrastructure used for road transport including parking and unpaved roads, and rail transport including tracks.
Background. Area not classified to any class. It can include \egfields, grass, pavements, and all objects excluded from above.
3.4 Annotations
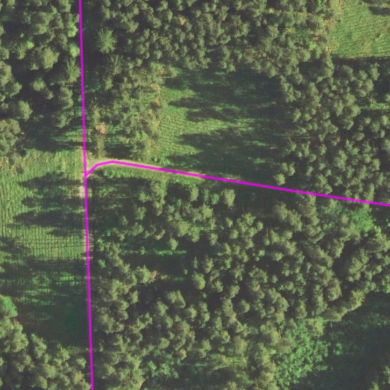
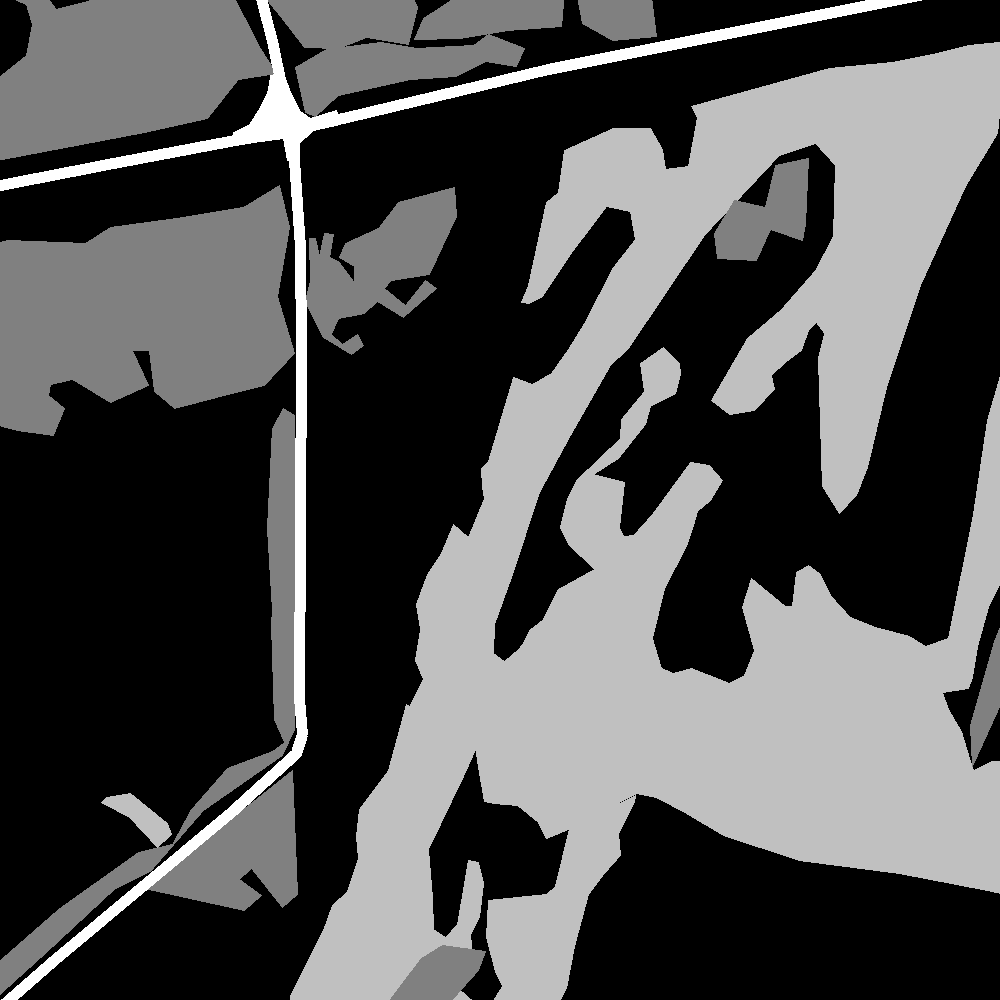
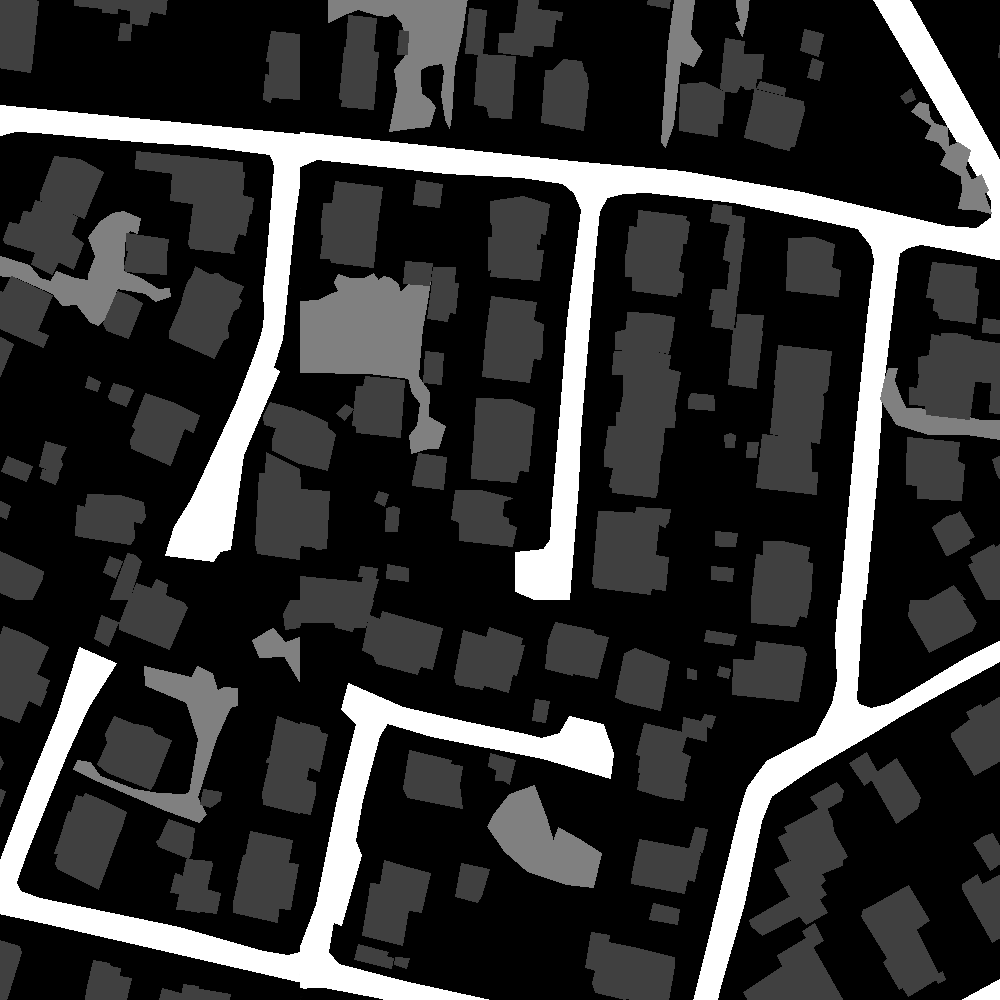
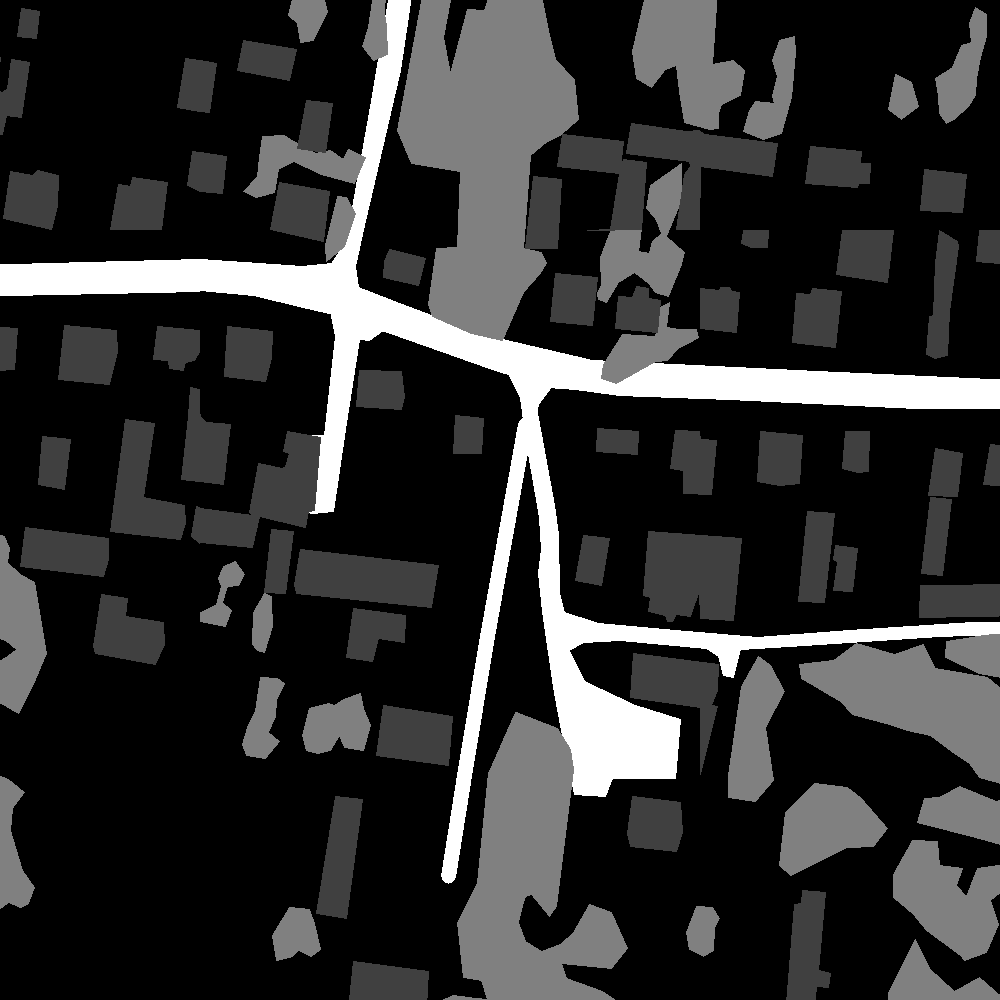
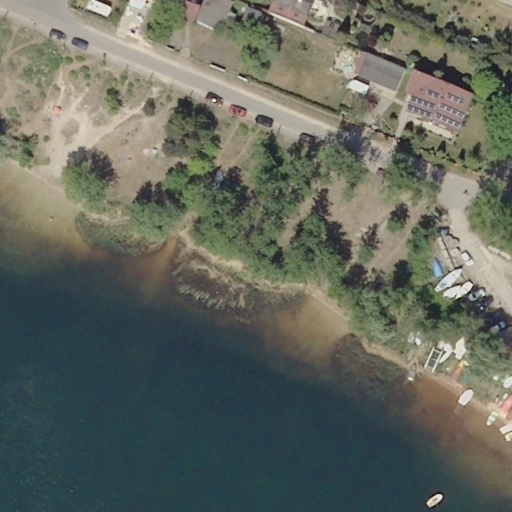
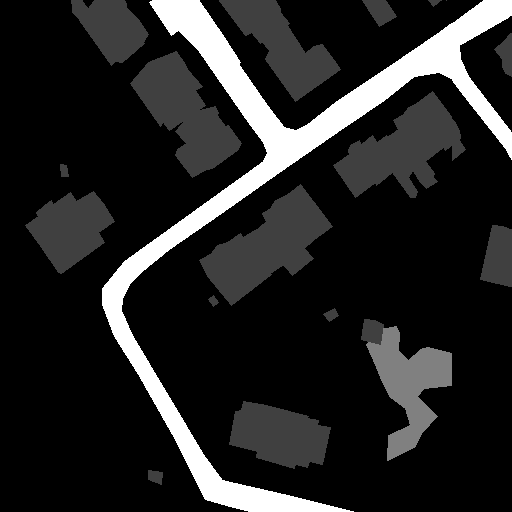
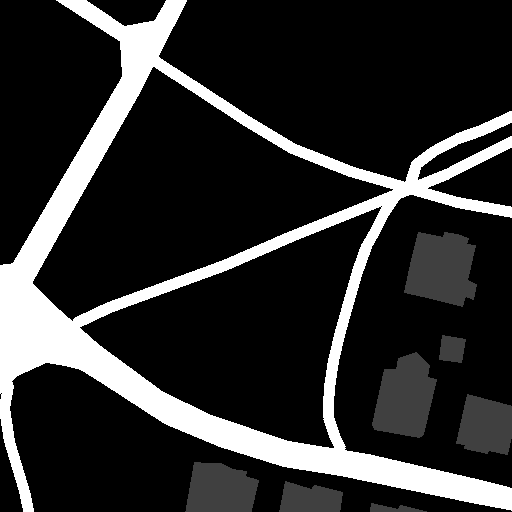
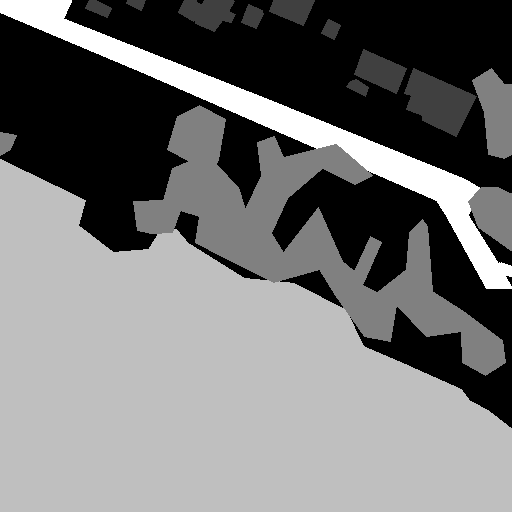
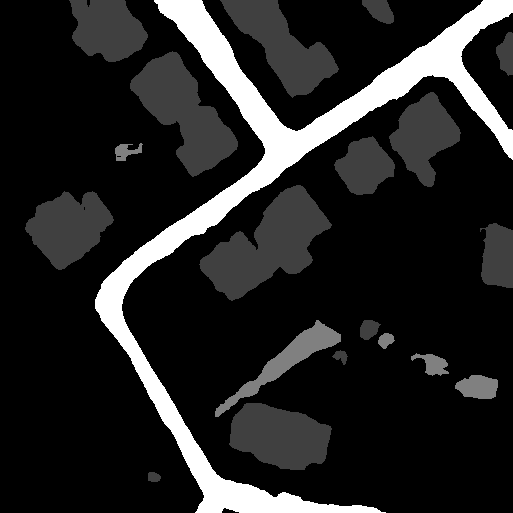
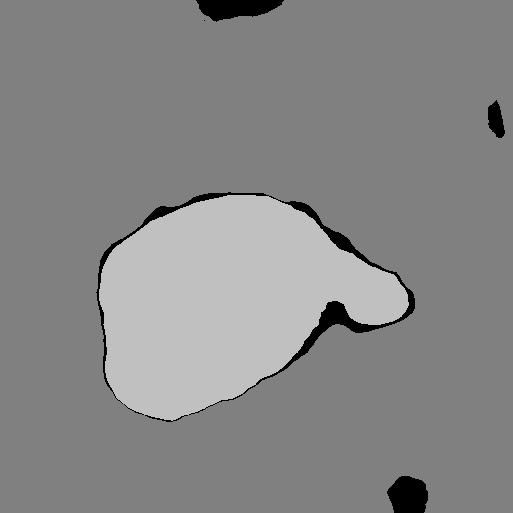
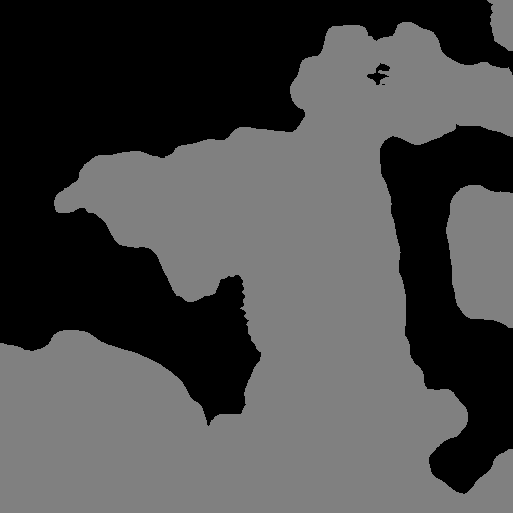
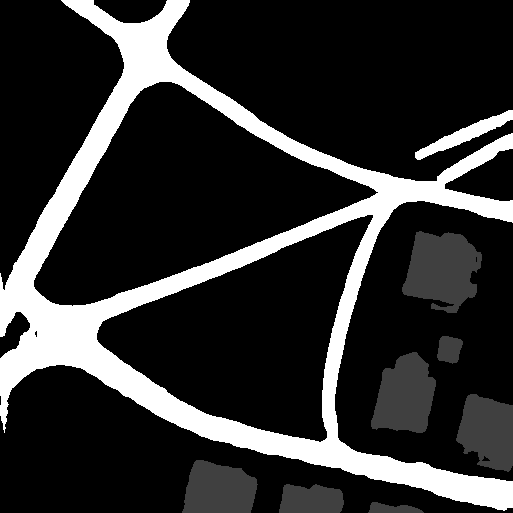
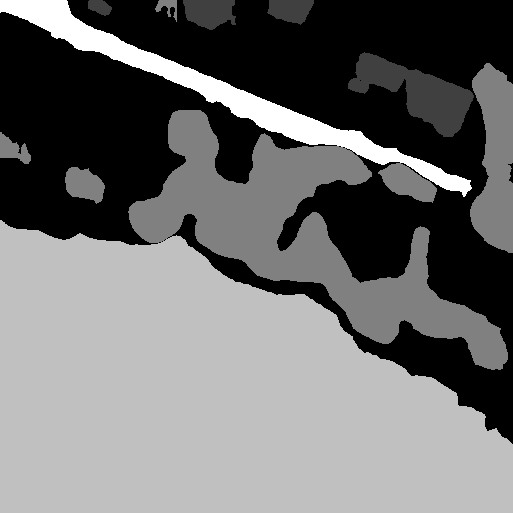
Annotations are made manually with VGG Image Annotator (VIA) [15] by a group of people using polygon shape and polyline (only for narrow roads) as shown in Figure 4. Firstly we split every image into px tiles for convenience. Tiles do not overlap, so the last tile in every row and all tiles in the last row are a little smaller. To provide a high-quality dataset, we implemented a rigorous procedure, so annotations are rather fine. A second person reviewed every finished tile. After that, all results were merged, and the segmentation mask was generated for each image, as shown in Figure 5. The road mask was created by replacing a polyline with a polygon shape with fixed thickness.
Statistics are as follows. There are 12280 buildings (1.85 km2), 72.02 km2 of woodlands, 13.15 km2 of water, 3.5 km2 of roads and 125.75 km2 of background in total.


3.5 Comparison to related datasets
Table 1 presents the comparison of the statistics between the proposed dataset and closely related aerial datasets: Inria [26], AIRS [9], Massachusetts [28], Agriculture-Vision [10], Tree Cover [36], ISPRS Potsdam and Vaihingen [1], and Chesapeake Conservancy [33]. The older ones have a worse resolution (Tree Cover, Massachusetts). Even newer high-resolution datasets usually cover one class \egbuildings (Inria, AIRS). ISPRS Potsdam and Vaihingen are high resolution but cover an urban area only. Agriculture-Vision and Chesapeake Conservancy were not available at the time of our dataset creation. Furthermore, they do not have building class. Despite Chesapeake is really large, it has automatic labels, which are coarse. Moreover, none of them except Potsdam and Vaihingen are located in Europe, where land cover (\egforest type) can be different.
In summary, there is no dataset with particular classes (buildings, trees, water, roads) covering a rural area with a resolution of tens centimeters per pixel and manual fine labels.
| Dataset | Location | Classes | Coverage (km2) | Resolution (cm/px) | Annotations |
|---|---|---|---|---|---|
| Inria | USA/Austria | buildings | 810 | 30 | semi-automatic |
| AIRS | Christchurch (New Zealand) | buildings | 457 | 7.5 | semi-automatic |
| Massachusetts Buildings | Boston (USA) | buildings | 340 | 100 | automatic |
| Massachusetts Roads | Boston (USA) | roads | 2600 | 100 | automatic |
| Tree Cover | São Paulo (Brazil) | trees | 8000 | 100 | automatic |
| Agriculture-Vision | USA | 9 (excluding buildings and trees) | 560 | 10/15/20 | manual |
| ISPRS Potsdam | Potsdam (Germany) | 5 (excluding water) | 1.4 | 5 | manual |
| ISPRS Vaihingen | Vaihingen (Germany) | 5 (excluding water) | 3.4 | 9 | manual |
| Chesapeake Conservancy | Chesapeake Bay (USA) | 13 (excluding buildings) | 160,000 | 100 | automatic |
| LandCover.ai (ours) | Poland | buildings, woodlands, water, roads | 216 | 25/50 | manual |
4 Experiments
In order to know how general semantic segmentation networks perform on our dataset and to check if LandCover.ai can be useful, we decided to create a baseline model. We chose one of state-of-the-art architectures - DeepLabv3+ [8] using modified Xception71 [8, 11, 13] with Dense Prediction Cell (DPC) [7] as a backbone. Additionally, we performed a few more experiments to check if data augmentation and some model modifications can improve results and, if so, how much.
4.1 Data preparation
Firstly we split 41 images and their corresponding masks into tiles, getting rid of smaller ones (these on the right and bottom edges), and we shuffled them. Then we organized it as follows: 15% (1602) of tiles became test set, 15% (1602) of tiles became validation set, and the last 70% (7470) became train set. We provide lists of the filenames with the dataset.
4.2 Data augmentation
We believe that proper augmentation, which simulates different flights and diverse land cover conditions, could be useful, so we applied an offline augmentation to the training set with imgaug [19]. We added nine augmented copies for every tile, randomly changing the following parameters: hue, saturation, grayscale, contrast, brightness, sharpness, adding noise, doing flipping, rotation, cropping, and padding. Therefore, we reached 74700 samples in the training set. Figure 6 presents sample augmentations.
4.3 Training
To train the network, we utilized a single NVIDIA Titan RTX GPU with 24GB of memory. We used Xception71 DPC pretrained on Cityscapes [12] to initialize weights and set decoder output stride = 4. Then we performed a few experiments changing encoder output stride from 16 to 4 along with batch size and atrous rates accordingly. We provided appropriate loss weights to counteract unbalanced area sizes of particular classes also. The other hyperparameters remained as default (as described in [8]).
To evaluate the model, we use the mean intersection over union (mIoU), which is the standard metric for semantic segmentation. The mIoU is the average of intersection over union (IoU) across all classes. And IoU is defined as the area of overlap between the ground truth and predicted class divided by the area of their union.
We finished the training when there was no significant gain of mIoU on the validation set.
4.4 Results
In table 2, we report the results obtained on the test set using IoU metrics. Figure 7 shows close-ups of images, labels, and result segmentation.
Roads and buildings are the most challenging classes for semantic segmentation, as they are often narrow (roads) or small (buildings). Hence they have fewer inner pixels, which are easier to classify correctly. In that case, imprecise edges cause greater error. Moreover, they are sometimes obscured by other objects like trees.
The baseline DeepLabv3+ model reaches 81.81% of mIoU of the entire test set. Smaller output stride provides better results, finally giving 84.09%. Augmentation further improves the metrics by 1.47% reaching 85.56%.
The results prove that automatic mapping from aerial images is possible with deep learning and a relatively small dataset.
| Method | Buildings | Woodlands | Water | Roads | Background | Overall |
|---|---|---|---|---|---|---|
| DeepLabv3+ OS 16 | 74.12% | 89.89% | 93.01% | 59.96% | 92.05% | 81.81% |
| DeepLabv3+ OS 8 | 77.47% | 90.62% | 93.77% | 62.64% | 92.65% | 83.43% |
| DeepLabv3+ OS 4 | 77.53% | 91.05% | 93.84% | 65.04% | 93.02% | 84.09% |
| DeepLabv3+ OS 4 + augmentation | 79.74% | 91.46% | 94.39% | 68.74% | 93.45% | 85.56% |
5 Conclusions
In this work, we present a unique RGB-only LandCover.ai dataset with aerial data typical for Central Europe, manually annotated for four classes: buildings, woodlands, water, and roads. The dataset is high resolution (tens centimeters per pixel), covers various rural areas and contain images with various optical conditions and periods of the vegetation season. In order to prove the usefulness of the dataset, we provide the results of a few baseline experiments using a state-of-the-art deep learning model - DeepLabv3+.
As we demonstrate, the dataset can be used to create tools for automatic mapping using neural networks. This allows for improving the efficiency and accuracy of identifying changes in land use and land cover. Therefore, it can be beneficial in various domains, such as administration, agriculture, forestry, and water resource management. Moreover, LandCover.ai fills an important gap as there was a lack of open aerial datasets useful for this type of application.
In the future, we plan to develop LandCover.ai by adding more classes \egfields, ditches, as well as splitting existing general classes like water into detailed \eglake, river, pond, and pool.
We make this dataset publicly available to encourage its future development and use.
References
- [1] 2d semantic labeling contest. http://www2.isprs.org/commissions/comm3/wg4/semantic-labeling.html.
- [2] Oumer S Ahmed, Adam Shemrock, Dominique Chabot, Chris Dillon, Rachel Wasson, and Steven E Franklin. Hierarchical land cover and vegetation classification using multispectral data acquired from an unmanned aerial vehicle. International Journal of Remote Sensing, 38(8-10):2037–2052, 2017.
- [3] Seyed Majid Azimi, Eleonora Vig, Reza Bahmanyar, Marco Körner, and Peter Reinartz. Towards multi-class object detection in unconstrained remote sensing imagery. In Asian Conference on Computer Vision, pages 150–165. Springer, 2018.
- [4] Mohammadamin Barekatain, Miquel Martí, Hsueh-Fu Shih, Samuel Murray, Kotaro Nakayama, Yutaka Matsuo, and Helmut Prendinger. Okutama-action: An aerial view video dataset for concurrent human action detection. In 2017 IEEE Conference on Computer Vision and Pattern Recognition Workshops (CVPRW), pages 2153–2160, 2017.
- [5] T. Blaschke. Object based image analysis for remote sensing. ISPRS Journal of Photogrammetry and Remote Sensing, 65(1):2–16, jan 2010.
- [6] Peter Caccetta, Simon Collings, Andrew Devereux, Kassell Hingee, Don McFarlane, Anthony Traylen, Xiaoliang Wu, and Zheng-shu Zhou. Monitoring land surface and cover in urban and peri-urban environments using digital aerial photography. International Journal of Digital Earth, 9(5):457–475, may 2016.
- [7] Liang-Chieh Chen, Maxwell D. Collins, Yukun Zhu, George Papandreou, Barret Zoph, Florian Schroff, Hartwig Adam, and Jonathon Shlens. Searching for efficient multi-scale architectures for dense image prediction. In NIPS, 2018.
- [8] Liang-Chieh Chen, Yukun Zhu, George Papandreou, Florian Schroff, and Hartwig Adam. Encoder-decoder with atrous separable convolution for semantic image segmentation. In ECCV, 2018.
- [9] Qi Chen, Lei Wang, Yifan Wu, Guangming Wu, Zhiling Guo, and Steven L. Waslander. Aerial imagery for roof segmentation: A large-scale dataset towards automatic mapping of buildings. ISPRS Journal of Photogrammetry and Remote Sensing, 147:42–55, Jan 2019.
- [10] Mang Tik Chiu, Xingqian Xu, Yunchao Wei, Zilong Huang, Alexander G. Schwing, Robert Brunner, Hrant Khachatrian, Hovnatan Karapetyan, Ivan Dozier, Greg Rose, David Wilson, Adrian Tudor, Naira Hovakimyan, Thomas S. Huang, and Honghui Shi. Agriculture-vision: A large aerial image database for agricultural pattern analysis. In IEEE/CVF Conference on Computer Vision and Pattern Recognition (CVPR), June 2020.
- [11] F. Chollet. Xception: Deep learning with depthwise separable convolutions. In 2017 IEEE Conference on Computer Vision and Pattern Recognition (CVPR), pages 1800–1807, July 2017.
- [12] Marius Cordts, Mohamed Omran, Sebastian Ramos, Timo Rehfeld, Markus Enzweiler, Rodrigo Benenson, Uwe Franke, Stefan Roth, and Bernt Schiele. The cityscapes dataset for semantic urban scene understanding. In The IEEE Conference on Computer Vision and Pattern Recognition (CVPR), June 2016.
- [13] J. Dai, H. Qi, Y. Xiong, Y. Li, G. Zhang, H. Hu, and Y. Wei. Deformable convolutional networks. In 2017 IEEE International Conference on Computer Vision (ICCV), pages 764–773, Oct 2017.
- [14] Diogo Duarte, Francesco Nex, Norman Kerle, and George Vosselman. Multi-resolution feature fusion for image classification of building damages with convolutional neural networks. Remote Sensing, 10, 10 2018.
- [15] Abhishek Dutta and Andrew Zisserman. The VIA annotation software for images, audio and video. In Proceedings of the 27th ACM International Conference on Multimedia, MM ’19, New York, NY, USA, 2019. ACM.
- [16] Jan Feranec, Gabriel Jaffrain, Tomas Soukup, and Gerard Hazeu. Determining changes and flows in European landscapes 1990 – 2000 using CORINE land cover data. Applied Geography, 30(1):19–35, 2010.
- [17] France Gerard et al. Land cover change in Europe between 1950 and 2000 determined employing aerial photography. Progress in Physical Geography: Earth and Environment, 34(2):183–205, apr 2010.
- [18] Xiaowei Gu and Plamen Angelov. A Semi-supervised Deep Rule-Based Approach for Remote Sensing Scene Classification, pages 257–266. Springer International Publishing, 01 2020.
- [19] Alexander B. Jung, Kentaro Wada, Jon Crall, Satoshi Tanaka, Jake Graving, Christoph Reinders, Sarthak Yadav, Joy Banerjee, Gábor Vecsei, Adam Kraft, Zheng Rui, Jirka Borovec, Christian Vallentin, Semen Zhydenko, Kilian Pfeiffer, Ben Cook, Ismael Fernández, François-Michel De Rainville, Chi-Hung Weng, Abner Ayala-Acevedo, Raphael Meudec, Matias Laporte, et al. imgaug. https://github.com/aleju/imgaug, 2020. Online; accessed 01-Jun-2020.
- [20] Pascal Kaiser, Jan Dirk Wegner, Aurelien Lucchi, Martin Jaggi, Thomas Hofmann, and Konrad Schindler. Learning Aerial Image Segmentation From Online Maps. IEEE Transactions on Geoscience and Remote Sensing, 55(11):6054–6068, nov 2017.
- [21] Robert E Kennedy, Zhiqiang Yang, and Warren B Cohen. Detecting trends in forest disturbance and recovery using yearly Landsat time series: 1. LandTrendr — Temporal segmentation algorithms. Remote Sensing of Environment, 114(12):2897–2910, dec 2010.
- [22] Salman Khan, Hossein Rahmani, Syed Shah, and Mohammed Bennamoun. A guide to convolutional neural networks for computer vision. Synthesis Lectures on Computer Vision, 8:1–207, 02 2018.
- [23] Reza Khatami, Giorgos Mountrakis, and Stephen V Stehman. A meta-analysis of remote sensing research on supervised pixel-based land-cover image classification processes: General guidelines for practitioners and future research. Remote Sensing of Environment, 177:89–100, may 2016.
- [24] Noureldin Laban, Bassam Abdel latif, Hala Ebied, Howida Shedeed, and Mohamed Tolba. Performance enhancement of satellite image classification using a convolutional neural network. In Proceedings of the International Conference on Advanced Intelligent Systems and Informatics 2017, pages 673–682, 01 2018.
- [25] Tsung-Yi Lin, Michael Maire, Serge Belongie, James Hays, Pietro Perona, Deva Ramanan, Piotr Dollár, and C. Lawrence Zitnick. Microsoft coco: Common objects in context. In David Fleet, Tomas Pajdla, Bernt Schiele, and Tinne Tuytelaars, editors, Computer Vision – ECCV 2014, pages 740–755, Cham, 2014. Springer International Publishing.
- [26] Emmanuel Maggiori, Yuliya Tarabalka, Guillaume Charpiat, and Pierre Alliez. Can semantic labeling methods generalize to any city? the inria aerial image labeling benchmark. In IEEE International Geoscience and Remote Sensing Symposium (IGARSS). IEEE, 2017.
- [27] E. Maggiori, Y. Tarabalka, G. Charpiat, and P. Alliez. Convolutional neural networks for large-scale remote-sensing image classification. IEEE Transactions on Geoscience and Remote Sensing, 55(2):645–657, Feb 2017.
- [28] Volodymyr Mnih. Machine Learning for Aerial Image Labeling. PhD thesis, University of Toronto, 2013.
- [29] Lichao Mou, Yuansheng Hua, Pu Jin, and Xiao Xiang Zhu. Era: A data set and deep learning benchmark for event recognition in aerial videos [software and data sets]. IEEE Geoscience and Remote Sensing Magazine, 8(4):125–133, 2020.
- [30] Stephan Pauleit and Friedrich Duhme. Assessing the environmental performance of land cover types for urban planning. Landscape and Urban Planning, 52(1):1–20, nov 2000.
- [31] Henrique M. Pereira and H. David Cooper. Towards the global monitoring of biodiversity change. Trends in Ecology & Evolution, 21(3):123–129, mar 2006.
- [32] P.V. Potapov, S.A. Turubanova, A Tyukavina, A.M. Krylov, J.L. McCarty, V.C. Radeloff, and M.C. Hansen. Eastern Europe’s forest cover dynamics from 1985 to 2012 quantified from the full Landsat archive. Remote Sensing of Environment, 159:28–43, mar 2015.
- [33] Caleb Robinson, Le Hou, Kolya Malkin, Rachel Soobitsky, Jacob Czawlytko, Bistra Dilkina, and Nebojsa Jojic. Large scale high-resolution land cover mapping with multi-resolution data. In Proceedings of the IEEE Conference on Computer Vision and Pattern Recognition, pages 12726–12735, 2019.
- [34] Tianmin Shu, Dan Xie, Brandon Rothrock, Sinisa Todorovic, and Song Chun Zhu. Joint inference of groups, events and human roles in aerial videos. In Proceedings of the IEEE Conference on Computer Vision and Pattern Recognition, pages 4576–4584, 2015.
- [35] M. Volpi and D. Tuia. Dense semantic labeling of subdecimeter resolution images with convolutional neural networks. IEEE Transactions on Geoscience and Remote Sensing, 55(2):881–893, Feb 2017.
- [36] Fabien Wagner and Mayumi Hirye. Tree cover for the year 2010 of the metropolitan region of são paulo, brazil. Data, 4:145, 11 2019.
- [37] J-L. Weber and M. Hall. Towards spatial and territorial indicators using land cover data. Technical report, European Environment Agency, Copenhagen, 2001.
- [38] James D. Wickham, Robert V. O’Neill, and K. Bruce Jones. Forest fragmentation as an economic indicator. Landscape Ecology, 15(2):171–179, 2000.
- [39] Michael A Wulder, Jeffrey G Masek, Warren B Cohen, Thomas R Loveland, and Curtis E Woodcock. Opening the archive: How free data has enabled the science and monitoring promise of Landsat. Remote Sensing of Environment, 122:2–10, jul 2012.
- [40] Gui-Song Xia, Jingwen Hu, Fan Hu, Baoguang Shi, Xiang Bai, Yanfei Zhong, Xiaoqiang Lu, and Liangpei Zhang. Aid: A benchmark data set for performance evaluation of aerial scene classification. IEEE Transactions on Geoscience and Remote Sensing, 55:3965 – 3981, 02 2017.
- [41] Yi Yang and Shawn Newsam. Bag-of-visual-words and spatial extensions for land-use classification. In Proceedings of the 18th SIGSPATIAL International Conference on Advances in Geographic Information Systems, pages 270–279, 01 2010.
- [42] Syed Waqas Zamir, Aditya Arora, Akshita Gupta, Salman Khan, Guolei Sun, Fahad Shahbaz Khan, Fan Zhu, Ling Shao, Gui-Song Xia, and Xiang Bai. isaid: A large-scale dataset for instance segmentation in aerial images, 2019.
- [43] Weiqi Zhou, Ganlin Huang, and Mary L. Cadenasso. Does spatial configuration matter? Understanding the effects of land cover pattern on land surface temperature in urban landscapes. Landscape and Urban Planning, 102(1):54–63, jul 2011.
- [44] Weixun Zhou, Shawn Newsam, Congmin Li, and Zhenfeng Shao. Patternnet: A benchmark dataset for performance evaluation of remote sensing image retrieval. ISPRS Journal of Photogrammetry and Remote Sensing, 145:197 – 209, 2018. Deep Learning RS Data.