Commissioning of the MEG II tracker system
Abstract
The MEG experiment at the Paul Scherrer Institut (PSI) represents the state of the art in the search for the charged Lepton Flavour Violating (cLFV) decay. With the phase 1, MEG set the new world best upper limit on the (90% C.L.). With the phase 2, MEG II, the experiment aims at reaching a sensitivity enhancement of about one order of magnitude compared to the previous MEG result. The new Cylindrical Drift CHamber (CDCH) is a key detector for MEG II. CDCH is a low-mass single volume detector with high granularity: 9 layers of 192 drift cells, few mm wide, defined by wires in a stereo configuration for longitudinal hit localization. The filling gas mixture is Helium:Isobutane (90:10). The total radiation length is , thus minimizing the Multiple Coulomb Scattering (MCS) contribution and allowing for a single-hit resolution m and an angular and momentum resolutions of 6 mrad and 90 keV/c respectively. This article presents the CDCH commissioning activities at PSI after the wiring phase at INFN Lecce and the assembly phase at INFN Pisa. The endcaps preparation, HV tests and conditioning of the chamber are described, aiming at reaching the final stable working point. The integration into the MEG II experimental apparatus is described, in view of the first data taking with cosmic rays and beam during the 2018 and 2019 engineering runs. The first gas gain results are also shown. A full engineering run with all the upgraded detectors and the complete DAQ electronics is expected to start in 2020, followed by three years of physics data taking.
1 Introduction
The MEG experiment with its first phase of operation at the Paul Scherrer Institut (PSI) set the most stringent constraint on the charged Lepton Flavour Violating (cLFV) decay. The analysis of the 2009–2013 full data set resulted in the new best upper limit on the at 90% C.L. (ref. [1]), imposing one of the tightest bounds on models predicting cLFV enhancements through new physics beyond the Standard Model (refs. [2, 3]). The MEG experiment has reached its ultimate level of sensitivity, limited by the resolutions on the measurement of the kinematic variables of the two decay products (ref. [4]). Therefore an upgrade of MEG, i.e. MEG II, was designed (ref. [5]) and is presently in the commissioning phase at PSI. MEG II aims at reaching a sensitivity level of the order of in three years of data taking, by improving both, the detector resolutions and the muon stopping rate by a factor of two.
2 The new MEG II Cylindrical Drift CHamber (CDCH)
2.1 Design
The new MEG II positron tracker is a single volume drift chamber with a cylindrical symmetry along the beam axis. The length is cm and the radial width ranges from to cm (figure 1). The full azimuthal coverage around the stopping target is guaranteed. This improves the geometric acceptance for signal and allows to use new tracking procedures capable to exploit a factor of four more hits than MEG for a larger tracking efficiency (%). The high granularity is ensured by 9 layers of 192 drift cells each, few mm wide. Each layer consists of 2 criss-crossing field wire planes enclosing a sense wire plane. The wires are not parallel to CDCH axis, but form an angle varying from 6∘ in the innermost layer to 8.5∘ in the outermost one. The stereo angle has an alternating sign, depending on layer, allowing to reconstruct the longitudinal hit coordinate. The stereo configuration gives CDCH the shape of a rotation hyperboloid. The single drift cell is quasi-square with a 20 m Au-plated W sense wire surrounded by 40/50 m Ag-plated Al field wires, with 5:1 field-to-sense wires ratio and a total number of 11904 wires.

The sensitive volume is filled with a low-mass He:i (90:10) gas mixture (ref. [6]), which is a good compromise between high transparency (radiation length ) and single-hit resolution ( m, measured on prototypes, ref. [7]). Full MC studies show angular and momentum resolutions in agreement with the MEG II experimental requirements: 6 mrad and 90 keV/c respectively.
2.2 Construction
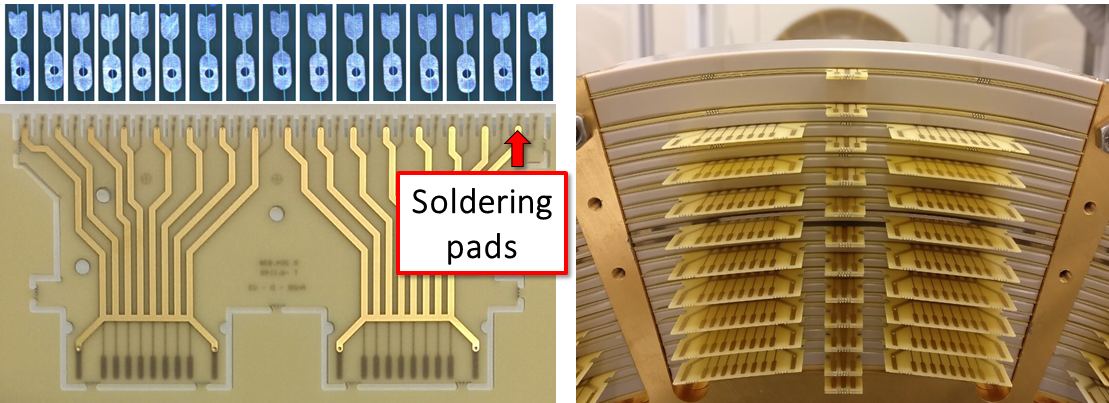
The CDCH design and construction were very challenging (refs. [8, 9, 10]). Indeed, given the high wire density (12 wires/), the classical technique with wires anchored to endplates with feedthroughs is hard to implement. CDCH is the first drift chamber ever designed and built in a modular way. Wires were not strung directly on the final chamber, but they were soldered at both ends on the pads of two PCBs, which were then mounted on the chamber (figure 2, left). The wiring procedure was performed at INFN Lecce, exploiting an automatic robot which fixed the wires on PCBs with a contact-less laser soldering. CDCH was then assembled at INFN Pisa by radially overlapping the wire-PCBs in the twelve 30∘ sectors of the helm-shaped endplates, between the spokes which act as housing for the PCBs. Each wire-PCB was placed at the proper radius through PEEK spacers whose thickness was adjusted to have the correct radial dimension of the drift cells (figure 2, right).
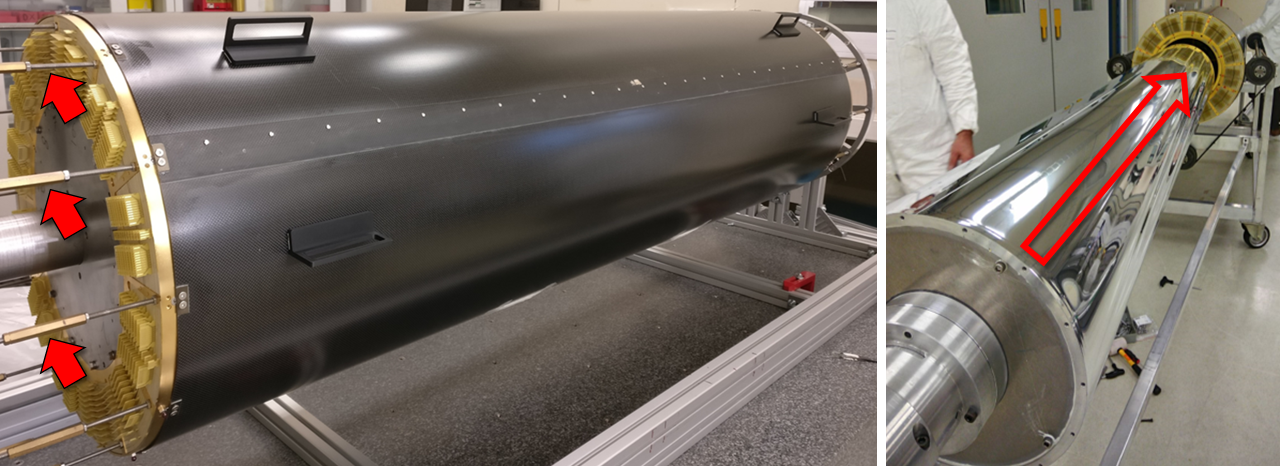
At the outermost radius, a 2 mm-thick Carbon Fiber (CF) support structure encloses the sensitive volume and keeps the endplates at the correct distance, ensuring the proper mechanical tension of the wires (figure 3, left). Twelve turnbuckles per side were connected to each individual spoke, allowing a fine tuning of the endplates distance, planarity and parallelism at a level better than 100 m. The CDCH geometry was continuously monitored during the assembly with a coordinate measuring machine. At the innermost radius, a 20 m one-side-Al Mylar foil separates the CDCH gas volume from the He-filled target region (figure 3, right). The gas mixture tightness is achieved by using the ThreeBond 1530222https://www.threebond.co.jp/en/product/detail/tb1530.html. It is a single-component silicone with strong adhesion. It ensures a very good tightness, even for He. glue and Stycast 2850333https://www.henkel-adhesives.com/it/en/product/potting-compounds/loctite_stycast_2850ft.html. It is a two-component thermally conductive epoxy encapsulant. resin.
Aluminum wire breaking problems arose during the CDCH assembly and commissioning, despite the fact that all the operations were performed inside cleanrooms with a strict monitoring of the environmental conditions. The problem was deeply investigated performing optical inspections with microscopes, chromatography, practical tests and SEM/EDS analyses. We developed a safe procedure to extract the broken wire pieces from the chamber. By simulating the drift cells electric field with Garfield444https://garfieldpp.web.cern.ch/garfieldpp/. and ANSYS555https://www.ansys.com/., the effect of a missing cathode wire on the reconstruction was found to be totally negligible. Chemical and mechanical analyses showed that the origin of the breaking phenomenon is the chemical corrosion of the Al core in presence of water condensation on wires from ambient humidity. Keeping the wires volume in an absolutely dry atmosphere with a continuous flow of inert gas (Nitrogen or Helium) proved to be effective to stop the development of corrosion. Once the assembly was completed, CDCH was transported to PSI for the commissioning phase.
More details about the CDCH design, construction and Al wires corrosion can be found in ref. [11].
3 CDCH commissioning at PSI
3.1 Endcaps preparation
After the CDCH sealing, the next step was the preparation of the endcap services. Two Al inner extension cylinders were connected to the endplates to couple the inner CDCH volume to the MEG II beam line. Twelve Al holders per side with grooves at the correct radii were machined to keep in position the 216 Front-End (FE) boards per side (figure 4, left).
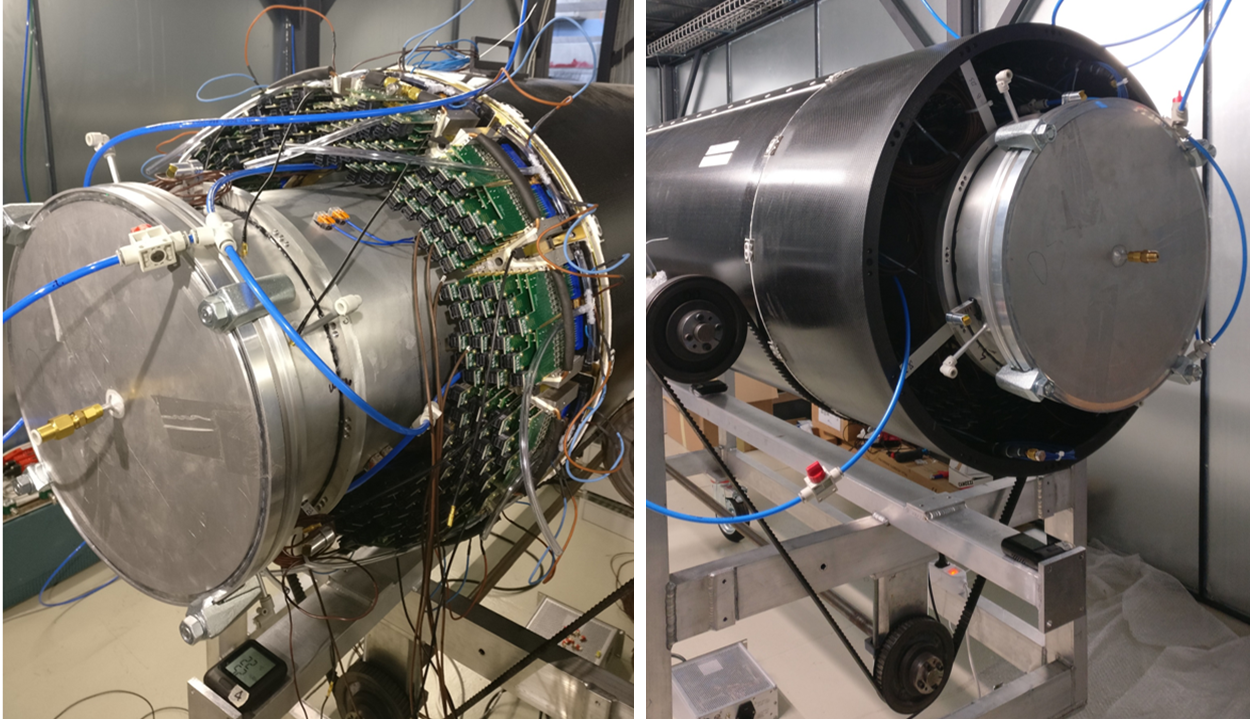
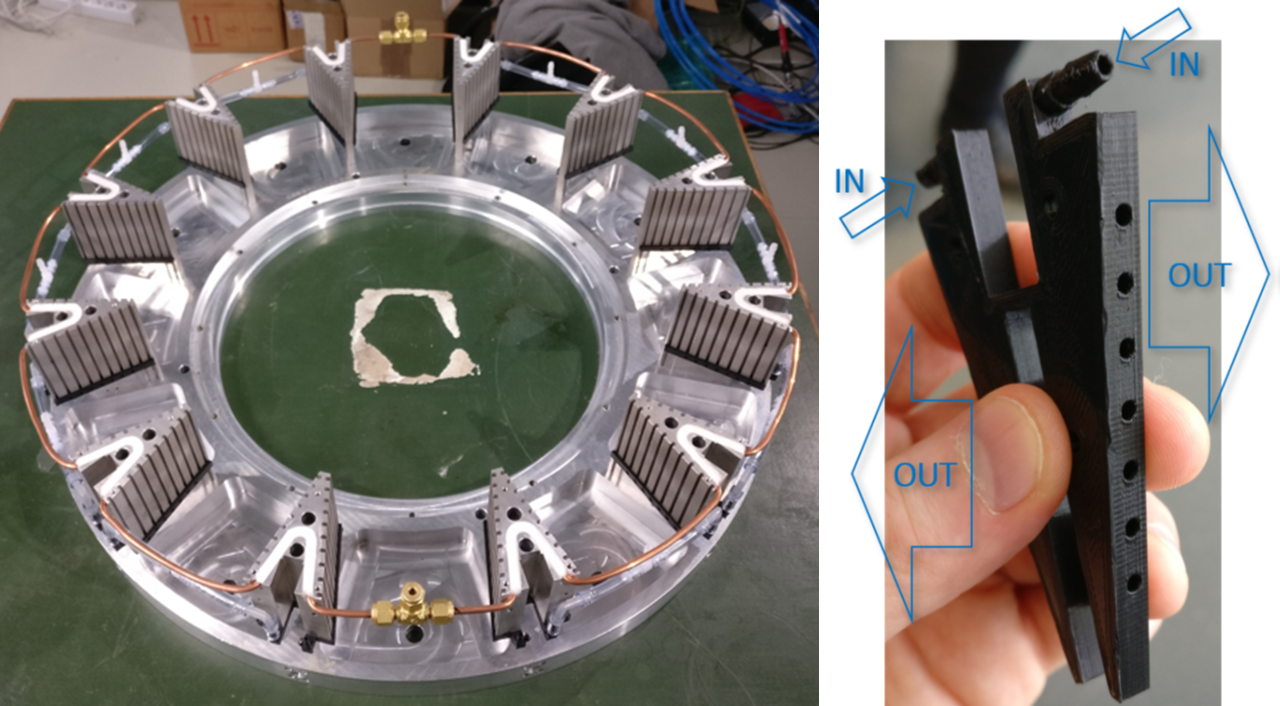
The FE boards can supply the HV to the wires from one side and read out the signal at both wire ends. In order to carry away the heat generated by the active electronics ( W/endplate) a chiller system is used. The 4 mm Cu pipes of the liquid cooling system are directly embedded in the FE holders (figure 5, left). A system of twelve inlet tubes per side supplies dry air to 3D-printed pieces screwed on the back side of each holder (figure 5, right). The dry air flushing system is used to uniform the temperature inside the endcaps and avoid water condensation on the FE electronics. Temperature and humidity sensors were added to monitor the endcaps environment which is enclosed by CF outer extension cylinders (figure 4, right).
3.2 Final working point and integration into the MEG II experimental apparatus
The HV Working Point (WP) for CDCH was estimated through gas gain simulations with the He:Isobutane 90:10 mixture and typical atmospheric pressure values at PSI. Since we aim to be sensitive to the single ionization cluster, the WP was defined as the HV to get a gas gain . A HV tuning by 10 V/layer was considered to compensate for the variation of the cell dimensions with radius. Furthermore, given the stereo wires geometry, the cell dimensions also vary along the chamber axis. The average HV WP as a function of the cell layers is summarized in table 1.
| L1 | L2 | L3 | L4 | L5 | L6 | L7 | L8 | L9 |
| 1480 V | 1470 V | 1460 V | 1450 V | 1440 V | 1430 V | 1420 V | 1410 V | 1400 V |
Figure 6 (left) shows an example of HV conditioning of the chamber at the first power up (here at 700 V). The residual currents drawn by the HV channels to correctly polarize the dielectric materials of the endplates reached a value of nA/cell, starting with a value more than a factor of 300 higher. The characteristic time was about three hours.
The CDCH working length was experimentally determined through systematic HV tests at different lengths/wires elongations, adjusted through geometry survey campaigns with a laser tracker ( m accuracy). The final length was set to +5.6 mm of wires elongation with respect to the zero tension position, corresponding to of the elastic limit. This guarantees an electrostatic stability safety margin of V above the WP. The map showing the HV value reached by each drift cell is reported in figure 6 (right). The cells which did not reach the WP are considered inefficient. The measured cell inefficiency was , negligible in reconstruction.

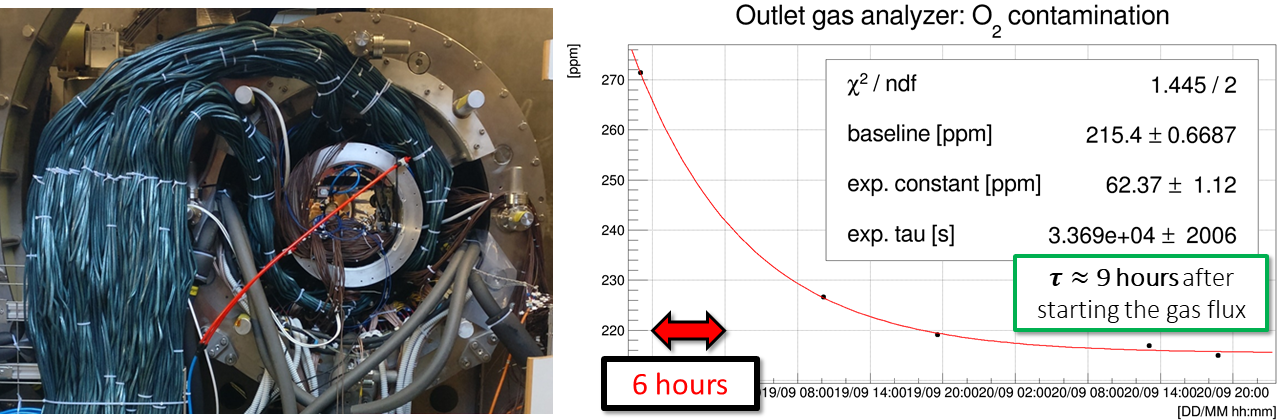
CDCH was finally integrated into the MEG II experimental apparatus for the first time in 2018, as shown in figure 7 (left). Complete signal/HV cabling and gas inlet/outlet connections to the final MEG II gas system were performed. A gas analyzer at the chamber outlet monitors the contaminants. An example for the Oxygen content666Electronegative impurities, like O2, can affect the avalanche development inside the drift cell, causing gas gain fluctuations. This is the so-called electron attachment. as a function of time since the starting of the gas mixture flux is shown in figure 7 (right). The cooling pipes were also routed and the cooling system was successfully tested. After the 2018 and 2019 engineering runs the CDCH geometry was measured and the CDCH mechanics proved to be stable and adequate to sustain a MEG II run.
3.3 First data taking
After completing the beam line and starting the gas mixture flux, CDCH was ready for data taking. Only 192 DAQ channels were available for 2018 and 2019 runs. This corresponds to six layers in one sector (16 drift cells per layer) with the double-side read out. Due to the limited number of DAQ channels a particle tracking test was not possible. Nevertheless, we studied the noise level in the experimental environment and performed several HV scans around the WP with Cosmic Rays (CR) and with the beam at different intensities: stopped /s (low rate), stopped /s (rate during the phase 1 of MEG), stopped /s (rate planned for MEG II). CR data allowed the first experimental gas gain studies in a clean environment. Michel data allowed to test the chamber response in a high rate environment and the combined data taking with the other MEG II sub-detectors (ref. [5]).
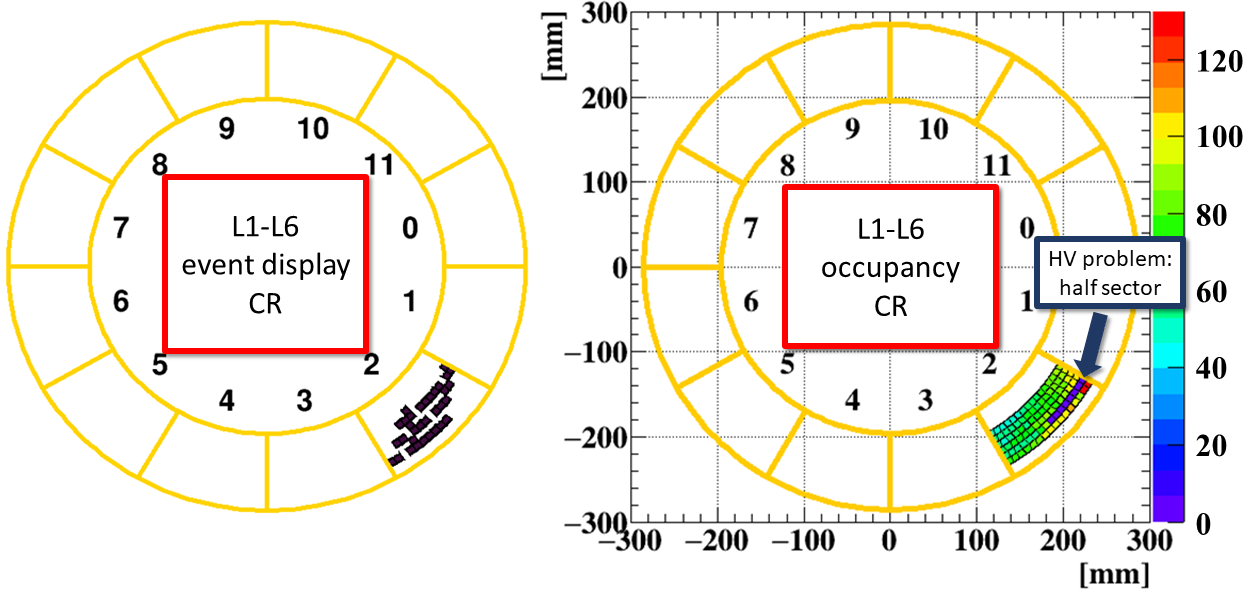
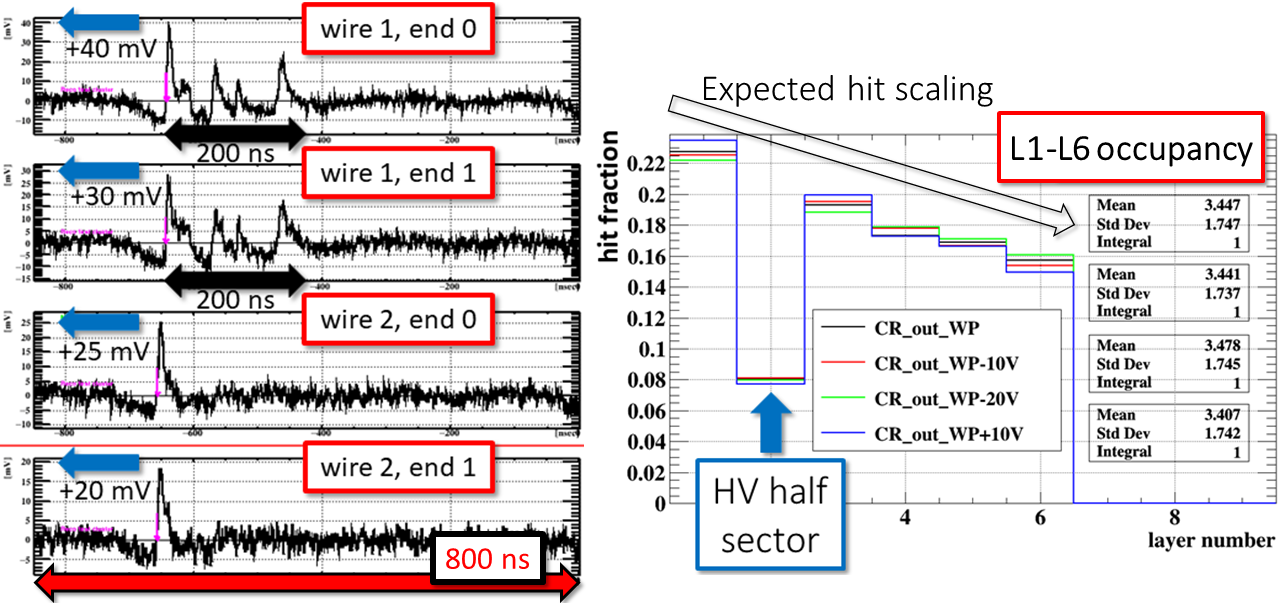
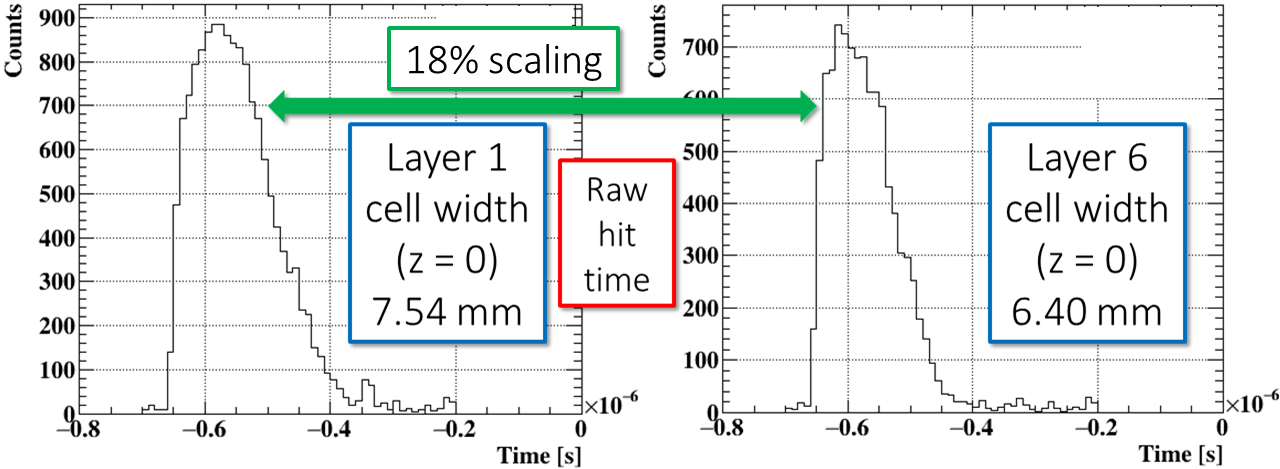
Figure 8 shows an example of a CR event display at the HV WP (left) from layer 1 (L1, outer) to layer 6 (L6, inner) and the corresponding occupancy plot integrating 25000 events. One drift cell has a hit if the WaveForm (WF) exceeds a predefined threshold: typically the RMS of the noise baseline which was mV. Figure 9 shows typical signal WFs as measured at both ends of two adjacent cells (left) and the occupancy as a function of the first six layers (right). The hit scaling as expected from MC simulations was correctly observed. Another interesting plot is reported in figure 10 which shows the width scaling of the raw hit time distributions for L1 (left) and L6 (right). This is related to the different drift cell dimensions: 7.54 mm and 6.40 mm for L1 and L6 respectively at the CDCH center (, figure 1). Figure 11 shows the distribution of the signal WF amplitude from CR data as a function of the same HV applied to L1, L2, L3.
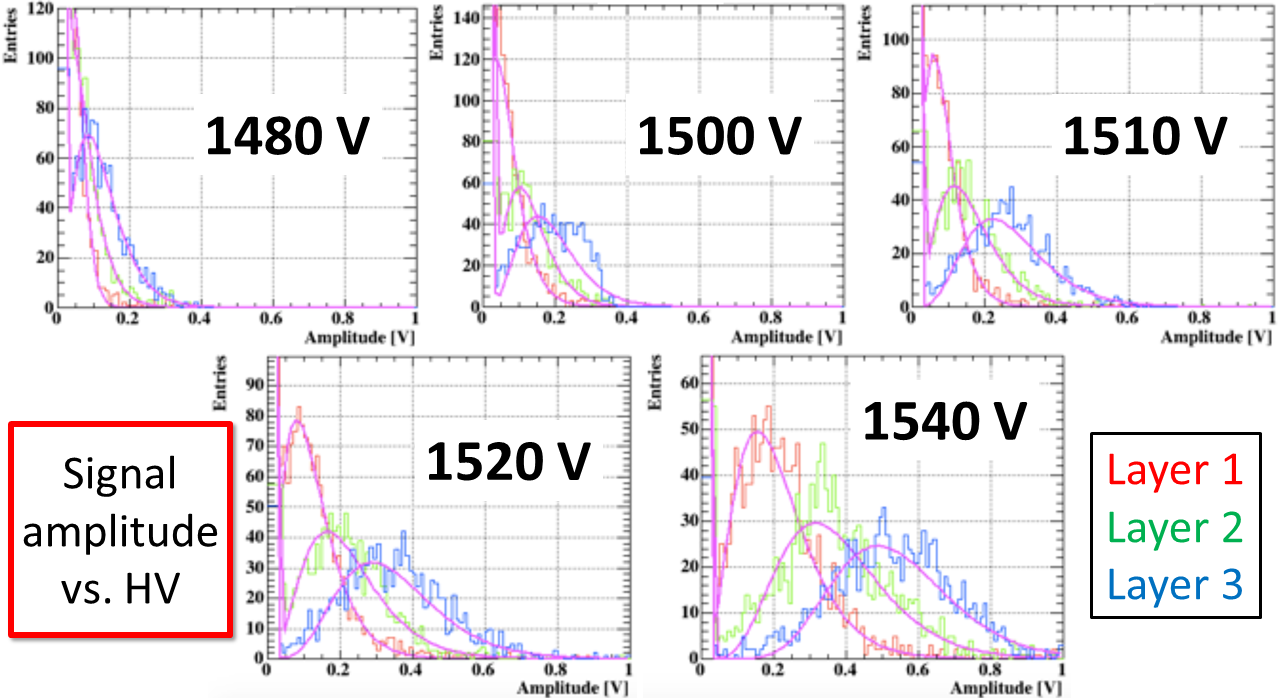
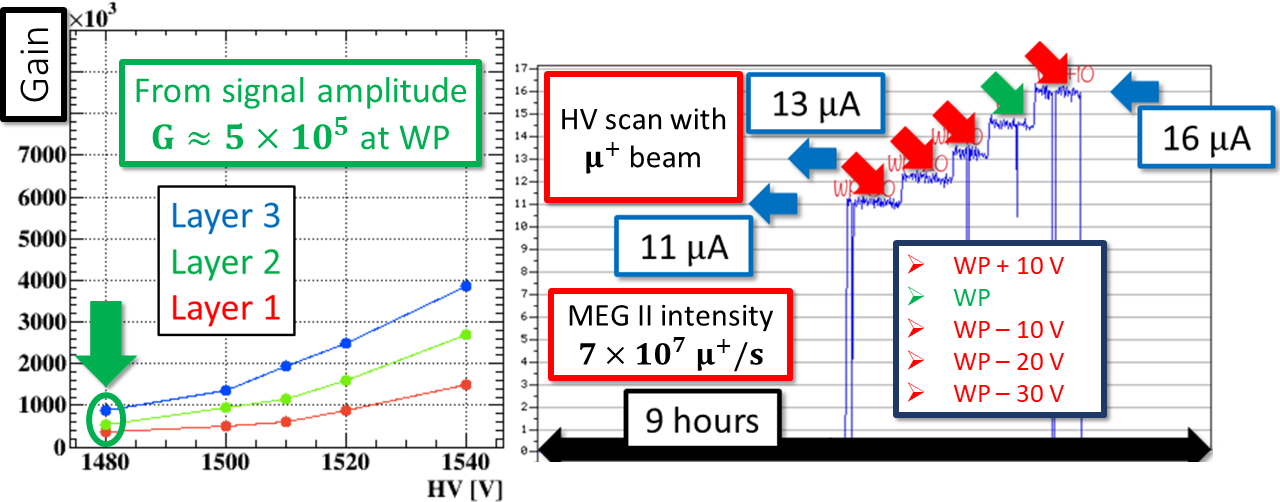
Distributions were fitted with a gaussian pedestal + Pólya distribution777Typical shape from the avalanche statistics. for signal. The mean amplitude and thus the separation from pedestal increase as the HV was set to higher values. The mean amplitude is higher for L3 than L1 at fixed HV, given the higher gain for inner layers (smaller cells). This is the reason for the HV scaling shown in table 1. The mean amplitude was then converted into the effective gas gain by means of simulations of the ionization clusters and the response of the FE amplification stage. The first calibrated gain curves, as extracted from CR data, are reported in figure 12 (left), showing agreement with simulation at the HV WP.
As aforementioned, also beam data were collected. Figure 12 (right) shows the current drawn by a HV channel in [A] as a function of the HV applied around the WP (from WP - 30 V up to WP + 10 V in step of 10 V) at a beam intensity of /s (nominal MEG II rate). The experimental gain curve showed a nearly exponential behaviour as expected from gas gain simulations.
During the 2018 and 2019 engineering runs we experienced anomalous high current levels in some sectors and layers, starting with the beam. The complete power down of the chamber was necessary to drive the big currents to zero. This behaviour needs to be carefully understood.
At present the commissioning phase at PSI is still ongoing. A full engineering run with all the upgraded detectors and the complete DAQ electronics is expected to start in 2020, followed by three years of physics data taking.
More details about the CDCH commissioning and first data taking can be found in ref. [11].
References
- [1] A. M. Baldini et al., Search for the lepton flavour violating decay with the full dataset of the MEG experiment, Eur. Phys. J. C (2016) 76:434.
- [2] L. Calibbi and G. Signorelli, Charged lepton flavour violation: An experimental and theoretical introduction, La Rivista del Nuovo Cimento, Volume 41, Serie 5, Numero 2 (2018).
- [3] F. Cei and D. Nicolò, Lepton Flavour Violation Experiments, Advances in High Energy Physics, Article ID 282915 (2014).
- [4] A. M. Baldini et al., MEG Upgrade Proposal, arXiv:1301.7225 (2013).
- [5] A. M. Baldini et al., The design of the MEG II experiment, Eur. Phys. J. C (2018) 78:380.
- [6] A. M. Baldini et al., Gas distribution and monitoring for the drift chamber of the MEG II experiment, JINST 13 (2018) P06018.
- [7] A. M. Baldini et al., Single-hit resolution measurement with MEG II drift chamber prototypes, JINST 11 (2016) P07011.
- [8] M. Chiappini et al., The new drift chamber of the MEG II experiment, Nucl. Instrum. Methods Phys. Res. A, Volume 936 (2019) 501–502.
- [9] G. Chiarello et al., The construction technique of the new MEG II tracker, Nucl. Instrum. Methods Phys. Res. A, Volume 936 (2019) 495–496.
- [10] A. M. Baldini et al., The ultra light drift chamber of the MEG II experiment, Nucl. Instrum. Methods Phys. Res. A, Volume 958 (2020) 162152.
- [11] M. Chiappini PhD Thesis (2019): https://meg.web.psi.ch/docs/theses/chiappini_phd.pdf.