11email: zhangqm@pmo.ac.cn 22institutetext: State Key Laboratory of Lunar and Planetary Sciences, Macau University of Science and Technology, Macau, PR China
33institutetext: School of Astronomy and Space Science, Nanjing University, Nanjing 210023, PR China
44institutetext: Yunnan Observatories, Chinese Academy of Sciences, Kunming 650011, PR China
Transverse coronal loop oscillations excited by homologous circular-ribbon flares
Abstract
Aims. We report our multiwavelength observations of two homologous circular-ribbon flares (CRFs) in active region 11991 on 2014 March 5, focusing on the transverse oscillations of an extreme-ultraviolet (EUV) loop excited by the flares.
Methods. The flares were observed in ultraviolet (UV) and EUV wavelengths by the Atmospheric Imaging Assembly (AIA) on board the Solar Dynamics Observatory (SDO) spacecraft. They were also observed in H line center by the one-meter New Vacuum Solar Telescope (NVST). Soft X-ray (SXR) fluxes of the flares in 0.54 and 18 Å were recorded by the GOES spacecraft.
Results. The transverse oscillations are of fast standing kink-mode. The first-stage oscillation triggered by the C2.8 flare is decayless with lower amplitudes (310510 km). The periods (115118 s) in different wavelengths are nearly the same, indicating coherent oscillations. The magnetic field of the loop is estimated to be 6578 G. The second-stage oscillation triggered by the M1.0 flare is decaying with larger amplitudes (12501280 km). The periods decreases from 117 s in 211 Å to 70 s in 171 Å, implying a decrease of loop length or an implosion after a gradual expansion. The damping time, being 147315 s, increases with the period, so that the values of are close to each other in different wavelengths. The thickness of the inhomogeneous layer is estimated to be 045 under the assumption of resonant absorption.
Conclusions. This is the first observation of the excitation of two kink-mode loop oscillations by two sympathetic flares. The results are important for understanding of the excitation of kink oscillations of coronal loops and hence the energy balance in the solar corona. Our findings also validate the prevalence of significantly amplified amplitudes of oscillations by successive drivers.
Key Words.:
Sun: magnetic fields – Sun: flares – Sun: corona – Sun: oscillations1 Introduction
Waves and oscillations are ubiquitous in the solar atmosphere (see Nakariakov & Verwichte, 2005; Wang, 2011; Nakariakov et al., 2016, and references therein). They are widely detected in sunspot (Tian et al., 2014), spicules (De Pontieu et al., 2012), coronal jets (Cirtain et al., 2007), prominences (Okamoto et al., 2007; Zhang et al., 2012b; Shen et al., 2014; Zhang et al., 2017; Luna et al., 2018), polar plumes (DeForest & Gurman, 1998), coronal loops (Wang & Solanki, 2004; Gosain, 2012; Kim et al., 2014; Li et al., 2020), and hot post flare loops (Tian et al., 2016). The magnetohydrodynamic (MHD) waves can be classified into fast mode waves (Chen & Wu, 2011; Zimovets & Nakariakov, 2015), slow mode waves (Ofman & Aschwanden, 2002; Wang et al., 2003), and Alfvén waves (Banerjee et al., 1998; Erdélyi & Fedun, 2007). Coronal loop oscillations excited by solar flares are first discovered by the TRACE mission (Aschwanden et al., 1999; Nakariakov et al., 1999). The initial amplitudes range from a few to 30 megameter (Mm). The periods (220 minutes) are found to be proportional to the loop lengths (Goddard et al., 2016). In most cases, the transverse oscillations are of standing kink mode (Nakariakov & Ofman, 2001; Aschwanden et al., 2002; Verwichte et al., 2004), which provides a useful tool to estimate the magnetic field and Alfvén speed of the coronal loops (Wang et al., 2002; Van Doorsselaere et al., 2008; Verwichte et al., 2009; White & Verwichte, 2012; Verwichte et al., 2013; Yuan & Van Doorsselaere, 2016; Li et al., 2017). Sometimes higher harmonics could be detected besides the fundamental mode (De Moortel & Brady, 2007; Van Doorsselaere et al., 2007; White et al., 2012; Guo et al., 2015). The period ratio is applied to estimate the density scale height (van Doorsselaere et al., 2009; Duckenfield et al., 2018).
The amplitude of transverse loop oscillations usually attenuates with time, with the exponential damping time () being 240 minutes (Goddard & Nakariakov, 2016). A linear fit between the damping time and period () results in (Goddard et al., 2016). Resonant absorption plays an important role in the rapid damping of kink oscillations, which acts in a finite inhomogenous layer of a flux tube and leads to a transfer of energy from kink to Alfvén mode oscillation (Goossens et al., 2002; Ruderman & Roberts, 2002). The kink mode damping rate provides a powerful diagnostic tool to estimate the coronal loop density profile (Pascoe et al., 2016). Recently, 3D numerical simulations and forward modeling of standing transverse MHD waves in coronal loops reveal that the observed signatures are dominated by the combination of the Kelvin-Helmholtz instability (KHI), resonant absorption, and phase mixing (Antolin et al., 2017). Transverse oscillations with growing amplitudes have occasionally been identified (Wang et al., 2012). Some of the low-amplitude ( Mm) oscillations hardly attenuate with time, which are termed decay-less oscillations (Anfinogentov et al., 2013, 2015; Li et al., 2018; Afanasyev et al., 2020). Nisticò et al. (2013) studied an eruptive flare in active region (AR) 11494 on 2012 May 30. Before and well after the occurrence of flare, the coronal loops in the same AR experienced low-amplitude decayless oscillations, while large-amplitude oscillations triggered by the flare decayed with time. So far, transverse oscillations triggered by successive flares have rarely been reported.
In this paper, we revisit the homologous C2.8 and M1.0 circular-ribbon flares (CRFs) on 2014 March 5 (Xu et al., 2017), focusing on the transverse coronal loop oscillations excited by the flares. In Sect. 2, we describe the data analysis. Results are presented in Sect. 3. We compare our findings with previous results in Sect. 4 and give a summary in Sect. 5.
2 Observations and data analysis
The confined flares in NOAA AR 11991 (S24W25) were observed by the Atmospheric Imaging Assembly (AIA; Lemen et al., 2012) on board the Solar Dynamics Observatory (SDO). AIA takes full-disk images in two ultraviolet (UV; 1600 and 1700 Å) and seven extreme-ultraviolet (EUV; 94, 131, 171, 193, 211, 304, and 335 Å) wavelengths. The level_1 data were calibrated using the standard solar software (SSW) program aia_prep.pro. The flares were also observed in H line center by the one-meter New Vacuum Solar Telescope (NVST; Liu et al., 2014) located at the Fuxian Solar Observatory. The raw data were reconstructed by a speckle masking method following the flat-field and dark-field processing (Xu et al., 2014). The level_1.5 H images coaligned with the 1600 Å images were used for analysis. Soft X-ray (SXR) light curves of the flares in 0.54 and 18 Å were recorded by the GOES spacecraft. Similar to the C3.1 CRF on 2015 October 16 (Zhang et al., 2016), the two flares were associated with two type III radio bursts, which were evident in the radio dynamic spectra by WIND/WAVES (Bougeret et al., 1995). The observational parameters during 01:3002:20 UT are listed in Table 1.
| Instrument | Cad. | Pix. Size | |
| (Å) | (s) | (″) | |
| SDO/AIA | 171211 | 12 | 0.6 |
| SDO/AIA | 1600 | 24 | 0.6 |
| NVST | 6562.8 | 12 | 0.165 |
| GOES | 0.54.0 | 2.05 | … |
| GOES | 18 | 2.05 | … |
| WIND/WAVES | 0.0213.825 MHz | 60 | … |
3 Results
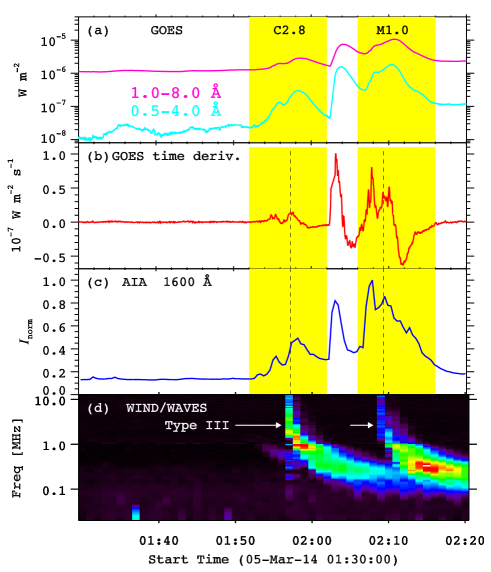
In Fig. 1, the top panel shows SXR light curves of the flares. The SXR emissions of the C2.8 flare (CRF1) started to rise at 01:52 UT and reached peak values at 01:58 UT, which were followed by a gradual decay phase until 02:02 UT. The SXR emissions of the M1.0 flare (CRF2) started to rise at 02:06 UT and reached peak values at 02:10 UT, which were followed by a decay phase until 02:16 UT. Hence, the lifetimes of CRF1 and CRF2 are only 10 minutes. Figure 1(b) shows the time derivative of the 18 Å flux, which serves as a hard X-ray (HXR) proxy according to the Neupert effect. Light curve of the flares in AIA 1600 Å, defined as the integral intensities of the flare region in Fig. 2(h), is plotted in Fig. 1(c). It is clearly seen that the major peaks in SXR derivative and 1600 Å have almost one-to-one correspondence during the two flares. Radio dynamic spectra recorded by WIND/WAVES are drawn in Fig. 1(d), featuring two type III radio bursts starting at 01:57 UT and 02:09 UT, respectively. The occurrence of type III radio burst is an indication of outward propagating nonthermal electrons accelerated by flares along open magnetic field lines (see also Fig. 8 in Xu et al. (2017)). The coincidence between the starting times of radio bursts and peaks in UV/HXR suggests bidirectional nonthermal electrons propagating upward along open field and downward along reconnected field into the chromosphere.
In Fig. 2, the top panels show snapshots of the AIA 171 Å images (see also the online movie anim171.mov). Panel (a) shows the image at the very beginning of CRF1. The brightness of flare ribbons, including a short inner ribbon (IR) and an outer circular ribbon (CR), reached their peak values simultaneously in EUV (see panels (b-c)), UV (see panel (f)), and H (see panel (e)) wavelengths. The size (26) of the CR is comparable to that of jet-related coronal bright points (Zhang et al., 2012a). For CRF2, the brightness of flare ribbons reached their peak values at 02:07 UT (see panels (d), (g), and (h)). It is noted that both flares were associated with cool surges propagating in the southwest direction (see Fig. 3(h) and Fig. 4(k) in Xu et al. (2017)).
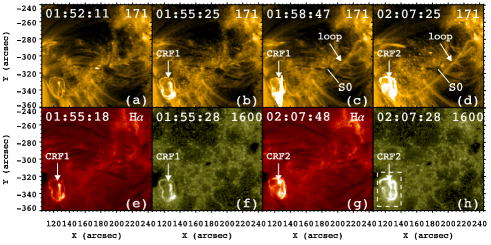
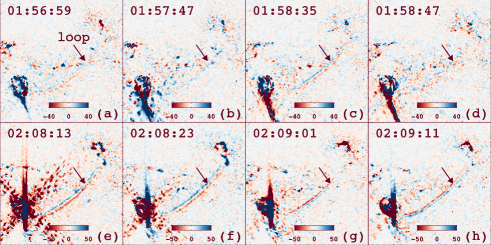
As mentioned in Xu et al. (2017), a long EUV loop connecting the flares with remote brightenings (RB), showed up during the flares, which are pointed by arrows in Fig. 2(c-d). The loop experienced transverse oscillations excited by the homologous flares. To better illustrate the displacements of the loop, we apply the running difference technique to the original EUV images. Running-difference images in 211 Å during CRF1 and CRF2 are displayed in the top and bottom panels of Fig. 3 (see also the online movie anim211.mov). The blue (red) color represents intensity enhancement (weakening), respectively. It is obviously revealed that the loop oscillated back and forth in a coherent way and the displacements of different segments of the loop are in-phase, which is indicative of fast standing kink-mode oscillations.
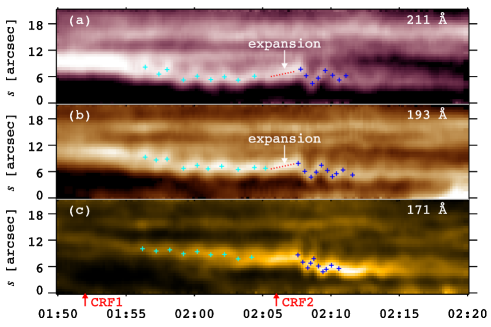
The oscillations could excellently be recognized in AIA 171, 193, and 211 Å. To investigate the characteristics of kink oscillations, we select an artificial slice (S0) with a length of 21 across the loop and close to the loop apex (see Fig. 2(d)). Time-distance diagrams of S0 in different wavelengths are displayed in Fig. 4. The cyan and blue symbols denote the central positions of the loop. The first-stage small-amplitude oscillation excited by CRF1 and second-stage large-amplitude oscillation excited by CRF2 are distinctly demonstrated.
| (Å) | (km s-1) | (km) | (s) | (km s-1) | (km) | (s) | (s) | |
|---|---|---|---|---|---|---|---|---|
| 171 | 3.1 | 32982 | 1185 | 6.6 | 1254122 | 703 | 14718 | 2.1 |
| 193 | 2.6 | 31277 | 1154 | 1.4 | 1280129 | 1004 | 25727 | 2.6 |
| 211 | 2.5 | 510110 | 1175 | 1.2 | 1283130 | 1175 | 31530 | 2.7 |
| ave. | 2.7 | 383 | 116.7 | 3.1 | 1272 | 95.7 | 240 | 2.5 |
It is noticed that the loop drifted nonlinearly in the northeast direction during the oscillations, which is probably related to the counterclockwise motion of the bright CR. The apparent drift speeds, ranging from 1 to 6 km s-1 with an average value of 3 km s-1, are listed in the second and fifth columns of Table 2. The detrended central positions of the EUV loop in different wavelengths are plotted in Fig. 5. Oscillation excited by CRF1 (cyan circles) started at 01:56 UT and lasted for 10 minutes. It is fitted with a decayless sine function (magenta lines) using the standard SSW program mpfit.pro:
| (1) |
where , , and stand for the initial amplitude, initial phase, and period, respectively. The derived values of and are listed in the third and fourth columns of Table 2. It is seen that the amplitude increases from 310 km in 193 Å to 510 km in 211 Å, with an average value of 383 km. The periods (115118 s) are almost the same, suggesting that the loop oscillates in phase with low amplitudes in different wavelengths.
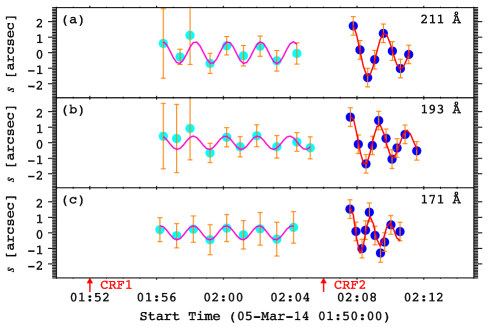
Oscillation excited by CRF2 (blue circles) started at 02:07:30 UT and lasted for 4 minutes. It is fitted with an exponentially decaying sine function (red lines):
| (2) |
where , , , and stand for the initial amplitude, initial phase, period, and damping time, respectively. The derived values of , , , and are listed in the last four columns of Table 2. It is revealed that the initial amplitudes of transverse oscillation excited by CRF2 are significantly larger than the amplitudes excited by CRF1. In other words, the low-amplitude loop oscillation is remarkably amplified or enhanced by the second flare. The period remains unchanged in 211 Å, while decreases by 15 s in 193 Å and decreases considerably by 48 s in 171 Å, meaning that the large-amplitude oscillation is no longer coherent in different wavelengths. The damping time ranges from 147 to 315 s, whereas the values of are close to each other.
In Fig. 4(a-b), a slow expansion (red dotted lines) is found before the large-amplitude oscillation, which is consistent with the gradual expansion phase before the main collapse and oscillation phase (Simões et al., 2013). Assuming that the phase speeds of the decaying and decayless kink-mode oscillations are equivalent, the decrease of periods in 171 and 193 Å may suggest a decrease of loop length, or an implosion.
4 Discussion
Since the first detection of transverse coronal loop oscillations (Aschwanden et al., 1999), there are abundant observations and numerical modelings. Coronal seismology becomes a powerful approach to diagnose the magnetic field strength of the oscillating loops, which is hard to measure directly (Andries et al., 2009). For the standing kink-mode oscillations of the EUV loop, which corresponds to the outer spine connecting the null point with RB (Xu et al., 2017), the period depends on the loop length () and phase speed () (Nakariakov et al., 1999):
| (3) |
where is the Alfvén speed of the loop, and and stand for the internal and external plasma densities. The value of is estimated to be 130 Mm, assuming a semicircular shape. is estimated to be 2200 km s-1 by adopting s. Hence, km s-1, assuming that the density ratio (Nakariakov et al., 1999). The magnetic field of a transversely oscillating loop is expressed as (Nisticò et al., 2013):
| (4) |
where is the average molecular weight in the corona. Taking the number density of the loop to be (710)109 cm-3 (Sun et al., 2013), is in the range of 6578 G.
As shown in Fig. 5, the large-amplitude kink oscillation of the EUV loop damps rapidly with time. In the case of resonant absorption (Ruderman & Roberts, 2002), is expressed as:
| (5) |
where is the loop half-width and is the thickness of the inhomogeneous layer. Based on the measured in Table 2, is estimated to be 045. The ratio is close to the value reported by Verwichte et al. (2009).
So far, the observations of transverse loop oscillations excited by successive flares are rare. For the first time, Nisticò et al. (2013) reported decayless low-amplitude oscillation followed by decaying high-amplitude oscillation, which is interpreted by a damped linear oscillator excited by a continuous low-amplitude harmonic driver and by an impulsive high-amplitude driver (e.g., a flare). Kumar et al. (2013) reported the kink oscillations of a coronal loop initially driven by a fast-mode EUV wave and later amplified by a slower EIT wave. For the first time, Hershaw et al. (2011) investigated two successive trains of large-amplitude transverse oscillations in an EUV prominence excited by two coronal waves associated with two sympathetic flares. Enhancement of amplitudes by homologous confined flares has also been discovered in longitudinal filament oscillations (Zhang et al., 2020). In our case, the EUV loop undergoes two-stage transverse oscillations: decayless low-amplitude oscillation excited by the C2.8 flare, and decaying high-amplitude oscillation excited by the M1.0 flare, which is 14 minutes later than the first one. Therefore, noticeable amplification of amplitudes by successive drivers is prevalent not only in coronal loop oscillations but also in filament oscillations.
It should be emphasized that the apparent decayless oscillation excited by the first C2.8 flare might be different from the regular decayless oscillations, which appear without any flares (Nisticò et al., 2013; Afanasyev et al., 2020). Alternatively, the first flare could cause a turn of the oscillating loop, making the plane of the oscillation polarization closer to the plane of the sky, and hence making the decay-less oscillations more visible. In Fig. 1(a), there is a clear SXR peak between the C2.8 and M1.0 flares. The emissions of the peak come from the same AR 11991. However, it is not recorded as an independent flare111https://solarmonitor.org. The low-amplitude decayless oscillation of the EUV loop is probably affected by the energy release as a non-resonant external force (Anfinogentov et al., 2013), so that it continues till the excitation of the large-amplitude oscillation by the second flare (see Fig. 4).
5 Summary
In this work, we report our multiwavelength observations of two homologous CRFs observed by SDO/AIA and NVST on 2014 March 5. Both of them excited transverse kink-mode oscillations of an EUV loop that corresponds to the outer spine connecting the null point with RB. The first-stage oscillation triggered by the C2.8 flare is decayless with lower amplitudes (310510 km). The periods (115118 s) in different wavelengths are nearly the same, indicating coherent oscillations. The magnetic field of the loop is estimated to be 6578 G. The second-stage oscillation triggered by the M1.0 flare is decaying with larger amplitudes (12501280 km). The periods decreases from 117 s in 211 Å to 70 s in 171 Å, implying a decrease of loop length or an implosion after a slow expansion. The damping time, being 147315 s, increases with the period, so that the values of are close to each other in different wavelengths. The thickness of the inhomogeneous layer is estimated to be 045 under the assumption of resonant absorption. The results are important for our understanding of the excitation of kink oscillations of coronal loops and the energy balance in the corona. Our findings also validate the prevalence of significantly amplified amplitudes of oscillations by successive drivers.
Acknowledgements.
The authors appreciate the referee for valuable suggestions to improve the quality of this paper. SDO is a mission of NASA’s Living With a Star Program. AIA data are courtesy of the NASA/SDO science teams. This work is funded by NSFC grants (No. 11773079, 11790302, 11873091, 11973092), the International Cooperation and Interchange Program (11961131002), the Youth Innovation Promotion Association CAS, Yunnan Province Basic Research Plan (No. 2019FA001), the Science and Technology Development Fund of Macau (275/2017/A), CAS Key Laboratory of Solar Activity, National Astronomical Observatories (KLSA202003, KLSA202006), the Strategic Priority Research Program on Space Science, CAS (XDA15052200, XDA15320301), and the project supported by the Specialized Research Fund for State Key Laboratories.References
- Afanasyev et al. (2020) Afanasyev, A. N., Van Doorsselaere, T., & Nakariakov, V. M. 2020, A&A, 633, L8
- Andries et al. (2009) Andries, J., van Doorsselaere, T., Roberts, B., et al. 2009, Space Sci. Rev., 149, 3
- Anfinogentov et al. (2013) Anfinogentov, S., Nisticò, G., & Nakariakov, V. M. 2013, A&A, 560, A107
- Anfinogentov et al. (2015) Anfinogentov, S. A., Nakariakov, V. M., & Nisticò, G. 2015, A&A, 583, A136
- Antolin et al. (2017) Antolin, P., De Moortel, I., Van Doorsselaere, T., et al. 2017, ApJ, 836, 219
- Aschwanden et al. (1999) Aschwanden, M. J., Fletcher, L., Schrijver, C. J., et al. 1999, ApJ, 520, 880
- Aschwanden et al. (2002) Aschwanden, M. J., de Pontieu, B., Schrijver, C. J., et al. 2002, Sol. Phys., 206, 99
- Banerjee et al. (1998) Banerjee, D., Teriaca, L., Doyle, J. G., et al. 1998, A&A, 339, 208
- Bougeret et al. (1995) Bougeret, J.-L., Kaiser, M. L., Kellogg, P. J., et al. 1995, Space Sci. Rev., 71, 231
- Chen & Wu (2011) Chen, P. F., & Wu, Y. 2011, ApJ, 732, L20
- Cirtain et al. (2007) Cirtain, J. W., Golub, L., Lundquist, L., et al. 2007, Science, 318, 1580
- DeForest & Gurman (1998) DeForest, C. E., & Gurman, J. B. 1998, ApJ, 501, L217
- De Moortel & Brady (2007) De Moortel, I., & Brady, C. S. 2007, ApJ, 664, 1210
- De Pontieu et al. (2012) De Pontieu, B., Carlsson, M., Rouppe van der Voort, L. H. M., et al. 2012, ApJ, 752, L12
- Duckenfield et al. (2018) Duckenfield, T., Anfinogentov, S. A., Pascoe, D. J., et al. 2018, ApJ, 854, L5
- Erdélyi & Fedun (2007) Erdélyi, R., & Fedun, V. 2007, Science, 318, 1572
- Goddard & Nakariakov (2016) Goddard, C. R., & Nakariakov, V. M. 2016, A&A, 590, L5
- Goddard et al. (2016) Goddard, C. R., Nisticò, G., Nakariakov, V. M., et al. 2016, A&A, 585, A137
- Goossens et al. (2002) Goossens, M., Andries, J., & Aschwanden, M. J. 2002, A&A, 394, L39
- Gosain (2012) Gosain, S. 2012, ApJ, 749, 85
- Guo et al. (2015) Guo, Y., Erdélyi, R., Srivastava, A. K., et al. 2015, ApJ, 799, 151
- Hershaw et al. (2011) Hershaw, J., Foullon, C., Nakariakov, V. M., et al. 2011, A&A, 531, A53
- Kim et al. (2014) Kim, S., Nakariakov, V. M., & Cho, K.-S. 2014, ApJ, 797, L22
- Kumar et al. (2013) Kumar, P., Cho, K.-S., Chen, P. F., et al. 2013, Sol. Phys., 282, 523
- Lemen et al. (2012) Lemen, J. R., Title, A. M., Akin, D. J., et al. 2012, Sol. Phys., 275, 17
- Li et al. (2017) Li, D., Ning, Z. J., Huang, Y., et al. 2017, ApJ, 849, 113
- Li et al. (2018) Li, D., Yuan, D., Su, Y. N., et al. 2018, A&A, 617, A86
- Li et al. (2020) Li, D., Li, Y., Lu, L., et al. 2020, ApJ, 893, L17
- Liu et al. (2014) Liu, Z., Xu, J., Gu, B.-Z., et al. 2014, Research in Astronomy and Astrophysics, 14, 705
- Luna et al. (2018) Luna, M., Karpen, J., Ballester, J. L., et al. 2018, ApJS, 236, 35
- Nakariakov et al. (1999) Nakariakov, V. M., Ofman, L., Deluca, E. E., et al. 1999, Science, 285, 862
- Nakariakov & Ofman (2001) Nakariakov, V. M., & Ofman, L. 2001, A&A, 372, L53
- Nakariakov & Verwichte (2005) Nakariakov, V. M., & Verwichte, E. 2005, Living Reviews in Solar Physics, 2, 3
- Nakariakov et al. (2016) Nakariakov, V. M., Pilipenko, V., Heilig, B., et al. 2016, Space Sci. Rev., 200, 75
- Nisticò et al. (2013) Nisticò, G., Nakariakov, V. M., & Verwichte, E. 2013, A&A, 552, A57
- Ofman & Aschwanden (2002) Ofman, L., & Aschwanden, M. J. 2002, ApJ, 576, L153
- Okamoto et al. (2007) Okamoto, T. J., Tsuneta, S., Berger, T. E., et al. 2007, Science, 318, 1577
- Pascoe et al. (2016) Pascoe, D. J., Goddard, C. R., Nisticò, G., et al. 2016, A&A, 589, A136
- Ruderman & Roberts (2002) Ruderman, M. S., & Roberts, B. 2002, ApJ, 577, 475
- Shen et al. (2014) Shen, Y., Liu, Y. D., Chen, P. F., et al. 2014, ApJ, 795, 130
- Simões et al. (2013) Simões, P. J. A., Fletcher, L., Hudson, H. S., et al. 2013, ApJ, 777, 152
- Sun et al. (2013) Sun, X., Hoeksema, J. T., Liu, Y., et al. 2013, ApJ, 778, 139
- Tian et al. (2014) Tian, H., DeLuca, E., Reeves, K. K., et al. 2014, ApJ, 786, 137
- Tian et al. (2016) Tian, H., Young, P. R., Reeves, K. K., et al. 2016, ApJ, 823, L16
- Van Doorsselaere et al. (2007) Van Doorsselaere, T., Nakariakov, V. M., & Verwichte, E. 2007, A&A, 473, 959
- Van Doorsselaere et al. (2008) Van Doorsselaere, T., Nakariakov, V. M., Young, P. R., et al. 2008, A&A, 487, L17
- van Doorsselaere et al. (2009) van Doorsselaere, T., Birtill, D. C. C., & Evans, G. R. 2009, A&A, 508, 1485
- Verwichte et al. (2004) Verwichte, E., Nakariakov, V. M., Ofman, L., et al. 2004, Sol. Phys., 223, 77
- Verwichte et al. (2009) Verwichte, E., Aschwanden, M. J., Van Doorsselaere, T., et al. 2009, ApJ, 698, 397
- Verwichte et al. (2013) Verwichte, E., Van Doorsselaere, T., Foullon, C., et al. 2013, ApJ, 767, 16
- Wang et al. (2002) Wang, T., Solanki, S. K., Curdt, W., et al. 2002, ApJ, 574, L101
- Wang et al. (2003) Wang, T. J., Solanki, S. K., Curdt, W., et al. 2003, A&A, 406, 1105
- Wang & Solanki (2004) Wang, T. J., & Solanki, S. K. 2004, A&A, 421, L33
- Wang (2011) Wang, T. 2011, Space Sci. Rev., 158, 397
- Wang et al. (2012) Wang, T., Ofman, L., Davila, J. M., et al. 2012, ApJ, 751, L27
- White & Verwichte (2012) White, R. S., & Verwichte, E. 2012, A&A, 537, A49
- White et al. (2012) White, R. S., Verwichte, E., & Foullon, C. 2012, A&A, 545, A129
- Xu et al. (2014) Xu, Z., Jin, Z., Xu, F. Y., & Liu, Z. 2014, in IAU Symp. 300, Nature of Prominences and Their Role in Space Weather, ed. B. Schmieder, J. M. Malherbe, & S. T. Wu (Cambridge: Cambridge Univ. Press), 117
- Xu et al. (2017) Xu, Z., Yang, K., Guo, Y., et al. 2017, ApJ, 851, 30
- Yuan & Van Doorsselaere (2016) Yuan, D., & Van Doorsselaere, T. 2016, ApJS, 223, 24
- Zimovets & Nakariakov (2015) Zimovets, I. V., & Nakariakov, V. M. 2015, A&A, 577, A4
- Zhang et al. (2012a) Zhang, Q. M., Chen, P. F., Guo, Y., et al. 2012a, ApJ, 746, 19
- Zhang et al. (2012b) Zhang, Q. M., Chen, P. F., Xia, C., & Keppens, R. 2012b, A&A, 542, A52
- Zhang et al. (2016) Zhang, Q. M., Li, D., & Ning, Z. J. 2016, ApJ, 832, 65
- Zhang et al. (2017) Zhang, Q. M., Li, D., & Ning, Z. J. 2017, ApJ, 851, 47
- Zhang et al. (2020) Zhang, Q. M., Guo, J. H., Tam, K. V., et al. 2020, A&A, 635, A132