The effect of social balance on social fragmentation
Abstract
With the availability of cell phones, internet, social media etc. the interconnectedness of people within most societies has increased drastically over the past three decades. Across the same timespan, we are observing the phenomenon of increasing levels of fragmentation in society into relatively small and isolated groups that have been termed filter bubbles, or echo chambers. These pose a number of threats to open societies, in particular, a radicalisation in political, social or cultural issues, and a limited access to facts. In this paper we show that these two phenomena might be tightly related. We study a simple stochastic co-evolutionary model of a society of interacting people. People are not only able to update their opinions within their social context, but can also update their social links from collaborative to hostile, and vice versa. The latter is implemented such that social balance is realised. We find that there exists a critical level of interconnectedness, above which society fragments into small sub-communities that are positively linked within and hostile towards other groups. We argue that the existence of a critical communication density is a universal phenomenon in all societies that exhibit social balance. The necessity arises from the underlying mathematical structure of a phase transition phenomenon that is known from the theory of a kind of disordered magnets called spin glasses. We discuss the consequences of this phase transition for social fragmentation in society.
Keywords: Opinion formation, co-evolutionary dynamics, social balance, phase transitions, spin glass, adaptive networks, social fragmentation, social cohesion
I Introduction
Social cohesion and social fragmentation are central topics in the organisation and functioning of large-scale societies. As such it is a central topic in sociology since its very beginning. Starting with Durkheim Durkheim (1893), who referred to the mutual dependencies between individuals as “organic solidarity”, the concept of social cohesion has evolved, however, it remains a core theme in sociology Pahl (1991); Bruhn (2009); Dubet (2013). Over the past two decades, concerns have been raised that modern societies might gradually be losing their cohesion Stanley (2003); Chan et al. (2006); Daly et al. (2008); Jenson (2010); OECD (2011); Dragolov et al. (2016). This has been attributed to several ongoing changes: globalisation, migration and ethno-cultural diversity, modern communication technologies, and the integration of states into trans-national entities, such as the European Union Schiefer and Van der Noll (2017). As the cohesion of a society declines, it faces the threat of becoming fragmented, which might come with a number of potentially catastrophic consequences, such as riots, civil wars, governmental shutdowns, or the decline of democracy Denton and Voth (2016). Hence it has become a great challenge of how to preserve social cohesion without interfering with diversity Berger and Stif (1998); Gough and Olofsson (1999).
Despite the lack of a consensus on what constitutes social cohesion, social relations have been widely regarded among the most essential aspects Schiefer and Van der Noll (2017). Both, social cohesion and fragmentation, emerge from complex interactions between individuals. One mode of collective social organisation can change to another if interactions change: individuals initially united by cooperation for a common good can become segregated once they start competing for their ethno-cultural, economical, or political values (or identities) Fukuyama (2018). In many societies transitions between fragmented and cohesive “phases” happen throughout history Bodnar (2001). In line with this view, here we define fragmentation as the regime (phase) in which society-wide collaborative efforts are broken down into local cooperation within subcommunities, with little or no collaboration between these groups.
I.1 New social media and social fragmentation
Local interactions between individuals shape and define the nature and quality of the overall social organisation. Novel communication technologies affect both the quality and the quantity of social interactions and thus might have a crucial impact on social cohesion. Among these new possibilities the effect of social media on social cohesion has been studied Bright (2018). On the one hand, social media may create so-called echo chambers in political discourse Garimella et al. (2018); Valle and Bravo (2018), where individuals reinforce their current position by repeated interactions with those of the same view. On the other hand, social media increasingly guide individuals to contents they are likely to agree with, resulting in the danger of so-called filter bubbles Pariser (2011); Flaxman et al. (2016). These phenomena might play an important role in the radicalisation of political discourse and the decline of cross-ideological exposure – one of the building blocks of democracy Sunstein (2002). Recently, several models have been proposed to better understand the formation of echo chambers and filter bubbles, as well as their effects on fragmentation Evans and Fu (2018); Sirbu et al. (2019); Baumann et al. (2020).
I.2 Modelling of social fragmentation
Modelling social fragmentation has a long history Bramson et al. (2017). In the context of cultural dynamics, Axelrod predicted fragmentation into cultural groups if individuals within a given “social neighbourhood” are more likely to interact with similar others than with dissimilar ones Axelrod (1997). The more they interact with each other, the more similar they become and thus the higher the chance is for future interactions. The dynamics continues until stable regions of identical individuals are established. However, the formation of such cultural regions is observed only for small societies; large societies reach global consensus. Recent research pointed out two properties of the Axelrod model, namely, the fragility of the fragmented phase with respect to random perturbations, such as the “mutation” of cultural features Klemm et al. (2003), and the fact that the transition from complete homogeneity to cultural diversity only happens beyond a critical number of alternative traits per feature Castellano et al. (2000). These shortcomings were later resolved by replacing the interpersonal influence in the original model by social influence Flache and Macy (2011); Battiston et al. (2017). In the context of segregation, Schelling’s celebrated model for the distribution of people of different races, assumes that individuals prefer to be in a neighbourhood with the majority of their own type Schelling (1971). Complete segregation into clusters of one type occurs as they move from one neighbourhood to another to satisfy their preferences. Subsequent research has shown that this way to understand segregation is quite robust Pancs and Vriend (2007). Axelrod’s and Schelling’s models both explain fragmentation (segregation) as an emergent collective phenomenon that results from individuals’ incentives only. A question that remains open, however, is how the transition from cohesion to fragmentation corresponds to the rearrangement of social ties.
I.2.1 Theory of social cohesion – structural balance
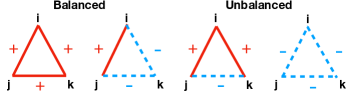
One of the seminal ideas in sociology of the 20th century was the concept of structural balance, which is based on the observation that social dynamics in cliques of individuals is determined less by pair-wise, but by triadic relations, i.e. triangle relations become the more fundamental unit. Structural balance theory was first proposed by Heider in the 1940s Heider (1946) and states that a group of three individuals forms a balanced triangle, if either all the three are mutually friends (positive relation) or two of them are friends and both have the same enemy (negative link). Three people form an unbalanced triad or triangle, if either all the three are mutual enemies, or if two of them are enemies but the third is their mutual friend, see Fig. 1.
Empirically, balanced triangles are found much more frequently than unbalanced ones in human societies, for a list of recent results, see e.g. Hummon and Doreian (2003); Szell et al. (2010); Szell and Thurner (2010, 2012); Leskovec et al. (2010); Facchetti et al. (2011, 2012); Estrada and Benzi (2014); Zheng et al. (2015); Sadilek et al. (2018); Kirkley et al. (2019); Lerner and Lomi (2020); Neal (2020). If an unbalanced situation occurs, individuals seem to strive to eliminate the associated tension by flipping the sign of one of the three links, resulting in a balanced arrangement. A perfectly balanced society would be one in which there are no unbalanced triangles – all individuals enjoy life without any tension. In contrast, a cohesive but not stress-free society is more conducive to change and/or improvement.
I.2.2 Our definition of social fragmentation
From what has been discussed so far it is clear that one must distinguish between different concepts of social fragmentation: urban fragmentation, segregation, social balance, loss of coherence because of evaporation of joint ideals, etc. These concepts all capture various aspects of social cohesion. For the following, we are interested in a broad and generic definition of social fragmentation, closely following Heider’s notion of social balance: We call a society fragmented if there are many groups that are locally collaborative with a high density of “positive links” within the group, but are often hostile to other groups. On the other hand, a society is cohesive if one finds a sufficient density of positive links between groups, such that one can “travel” from group to group, without ever having to use negative links. In other words, we define a society as cohesive, if the positive links percolate.
I.2.3 Co-evolution and adaptive networks
Collective dynamics of social systems has been studied within the framework of adaptive networks; for an overview see e.g. Thurner et al. (2018). In this approach, fragmentation results from a co-evolutionary rearrangement of social ties, together with updates of individual traits (“states”) Böhme and Gross (2011). In Holme and Newman (2006), new relationships are created between people of the same opinion by rewiring pre-existing connections with a given probability. As the rewiring rate increases, the system self-organises into many communities, such that members of the same community converge on their opinions, but strongly differ from members of other groups. In a modification of the original Axelrod model Centola et al. (2007) links between dissimilar agents (with no feature in common) are replaced by links between agents who may be either similar or dissimilar. This mechanism was shown to change the network structure from a regular lattice to a network with multiple clusters and to significantly increase the critical point of the transition from a mono- to a multicultural regime. In Kozma and Barrat (2008) only links between agents whose opinions differ from each other more than a tolerance level may be broken. New links are established to other agents, regardless of their opinions. As a consequence, the transition from consensus towards fragmentation happens at a lower tolerance level than on fixed networks.
I.2.4 Earlier models on opinion formation
Many previous approaches towards modeling social dynamics focused on a setting where individuals are characterised by a number of socio-economic traits. These become dynamical variables and one cam study their collective evolution with numerical methods. This direction has shaped the field of opinion dynamics Castellano et al. (2009); Sîrbu et al. (2017). Influential models in this field are DeGroot’s model of belief consensus DeGroot (1974), the voter model Clifford and Sudbury (1973); Holley and Liggett (1975), and the majority-rule model Galam (2002). A generic and unrealistic feature of these models is that generally global consensus is established among the agents, regardless of the detailed dynamics or the underlying network structures. There are, however, models that do exhibit either consensus or opinion fragmentation. They either rely on the “bounded confidence” assumption that states that only those whose opinions differ less than a given level can interact Deffuant et al. (2000); Hegselmann and Krause (2002), or they employ the fact that individuals only adopt their views once a certain fraction of their neighbours did Watts (2002); Klimek et al. (2008). Both types of models show a phase of global consensus if the confidence level (fraction of neighbours) exceeds a critical value. Below this threshold, clusters of different opinions of various sizes appear.
I.2.5 Opinion dynamics on signed networks
The first attempt to incorporate Heider’s social balance into opinion dynamics was in Altafini (2012, 2013); Altafini and Lini (2015).
They showed that an opinion formation process on a balanced network ends up in polarised states,
where contradictory opinions are clustered into two groups.
This result was extended to the case of time-varying signed graphs in Proskurnikov
et al. (2016); Meng et al. (2016), however,
there opinion- and network dynamics are not coupled.
In yet another class of models that is based on the Hebbian learning rule Hebb (1949) the weight of the social
link between two individuals is assumed to be a function of the correspondence between their states.
As their opinions evolve over time, the weight increases (decreases) proportional
to their opinion concordance (discordance).
Fragmentation has been
shown to emerge from such adaptive dynamics, Macy et al. (2003); Singh et al. (2014).
There the network only reacts to the change of opinions, but does not emerge from Heider’s principle
of minimising social tension. Saeedian et al. Saeedian et al. (2019) recently consider a co-evolutionary
dynamics where not only friends with opposite opinions but also enemies with similar ones can change either their opinions
or their relations to remove cognitive dissonance. In the final frozen states,
the network fragments into groups of friendly and like-minded individuals who, however, are hostile to members of the other groups.
In this paper we propose to understand the mechanism of social fragmentation as a consequence of social balance. To this end we study a minimalistic stochastic, co-evolutionary model where individuals tend to avoid social stress by either adopting their opinions, or by changing their social links from cooperative to hostile, or vice versa. Heider’s concept of social balance is explicitly taken into account by co-evolutionary evolution mechanism, rather than being imposed a priori or emerging from the dynamics of the social network alone. We will see that the model allows us to understand the emergence of echo chambers and filter bubbles as a function of the average connectivity of the society. We find a fundamental regime shift (or phase transition) that happens at critical values of social connectivity. Below the critical density we observe a largely cohesive society, above it there exists an unavoidable phase that is dominated by the existence of many small collaborative communities, characterised by hostile links towards other groups.
II The model
II.1 A co-evolutionary model of opinion- and social network formation
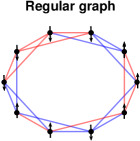
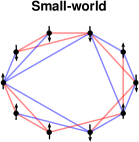
We assume that a society is made up by individuals that we label by latin indices, . Each of these individuals is embedded in a social network and has social relations to fellow individuals that are labelled by . We keep the average number of links per person as a model parameter. This number is assumed to be fixed over time. Each relation between and can be either positive, , e.g. if they are friends, or negative, , if they are enemies. If two individuals are linked with a negative link this indicates a certain level of social stress. Each individual is endowed with an opinion, . For simplicity we assume that there exists only one type of binary opinion, of the type: yes or no, Trump or Hillary, etc. In Fig. 2 we show a schematic picture of our model society in the simplest case, where a total of individuals with opinions ( and ) are linked to neighbours each in a regular way (a) and in a so-called small world network Watts and Strogatz (1998) (b) with the same average connectivity, .
Imagine that two individuals are linked through a positive link and they have opposite opinions on a given subject. We assume that this will cause a certain amount of social stress in the system. If, on the contrary, the two individuals do not like each other, , and they have opposite opinions, this will not lead to additional social stress. Both, the opinions and the quality of the social links, can be updated. Whenever changes her opinion, we have , or . The same is true for social links, whenever we change friendship to enmity, , or vice versa. We assume that on average individuals tend to update their opinions and social links such that they reduce their local levels of social stress. To keep track of the total amount of social stress, we introduce a function, , which allows us to formulate a simple stochastic co-evolutionary model.
II.2 Minimising social stress – a Hamiltonian approach
The system under study evolves to minimise overall social tension, which can be defined as
| (1) |
where denotes the opinion of an individual and represents friendship and enmity between two connected agents and , respectively (, if they are not linked). This type of cost function is called a Hamiltonian function in physics, where it captures the total energy in a system as a function of its configuration, . There it is then used to implement the principle of minimisation of energy.
In Eq. (1), the first sum describes the opinion adoption process between interacting agents. It assumes that individuals should act in such a way as to avoid cognitive dissonance among them: if and are friends, they are more likely to share the same view, otherwise, they may hold opposing opinions. Following the “social influence” theory by Festinger et al. (1950); French Jr (1956); Harary (1959), for any individual , the simultaneous influences from all its neighbours are represented by the sum over of terms. The second term explicitly takes care of Heider’s social balance: it incorporates the tendency of suppressing unbalanced triangles between individuals. This effect is implemented by the sum over all possible triadic relations between any three individuals , , and . If , they feel no social tension, otherwise social balance pushes them to switch their relations. Note that a link between and , , in general will belong to several triangles. A flip of that lowers the total number of unbalanced triads should happen with a higher probability than a flip that leads to an increase of unbalanced triangles, i.e. increases overall social stress. See the next subsection for how this is implemented. The parameter in Eq. (1) controls the relative strength of the social balance term with respect to the opinion formation contribution (first term). In accordance with Heider’s theory, must be positive so that balanced triangles do indeed dominate the unbalanced ones111 At this point it is not clear how to empirically infer the value of for a given society. We chose in the model implementation. In fact, any non-negligible value, , can be shown to yield similar results as (see SI). This choice corresponds to the assumption that the effect of social balance is comparable in importance to the opinion terms (social influence) in Eq. (1). As long as the number of links and that of triangles are of the same order of magnitude (as is the case in sparse networks), it seems reasonable to keep the contribution of the Heider term comparable to that of opinions. In physics the case corresponds to the classical Edwards-Anderson spin glass model Edwards and Anderson (1975), while the other extreme, , corresponds to the model studied in Antal et al. (2005); Marvel et al. (2009); Rabbani et al. (2019). .
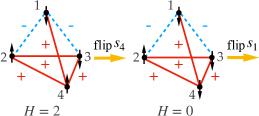
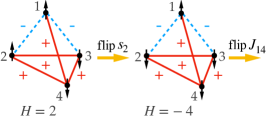
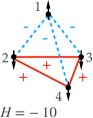
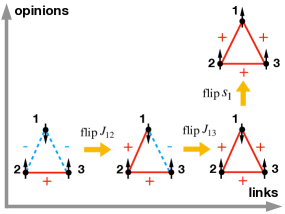
Figure 3 shows an example for how four individuals with given initial opinions and links can change social stress, , by flipping either opinions or links. The configuration starts with a situation that amounts to . When node 4 flips its opinion from to , social stress is decreased to . Next, node 1 flips its opinion to and increases stress to . This is not what happens usually, but since the dynamics is stochastic, these situations will also occur. In the next step, node 2 flips from to and thereby lowers social stress to . Finally, by 1 and 4 flipping their link from positive to negative, we arrive at a relatively stress-free situation, , that is socially balanced.
II.3 A stochastic co-evolutionary model – the Metropolis algorithm
The social stress function, , now specifies the way by which the dynamical variables, and , change over time. Assuming that humans generally tend to reduce social stress, changes that decrease are favoured over those increasing it. We implement the joint evolution of opinions and links by the so-called Metropolis algorithm Metropolis et al. (1953). Starting from a random configuration of opinions and links, the society is updated from one timestep to the next as follows:
-
1.
Compute of the current system, assume it has a value of .
-
2.
Pick a node at random and flip its opinion, . Compute again, it is now . If the value of has decreased in response to the flip, , accept the flip. If the value of increased, accept the flip only with probability, , where is the difference of stress before and after the flip. denotes the “social temperature” and is a model parameter. Pick the next node randomly and continue until opinion updates have been performed (Monte Carlo iterations).
-
3.
Compute of the system at this point, assume that it is now . We now pick one link randomly, , and flip it. Compute again, and assuming it to be , we accept the flip if , and accept it with probability , where , if . For simplicity, we assume that is the same as in step 2.
-
4.
Continue with the next timestep.
The parameter controls the relative update rate between opinions and links. The relative frequency of opinion updates versus link updates is . Depending on the choice of , which can range from zero to infinity, (and depending on the initial conditions), the opinions may or may not be given enough time to converge towards a steady state between link updates; in other words they may or may not have enough time to “equilibrate”. In the SI we show the consequences of different choices of . In the main body of the paper we set . Here we are interested in a true co-evolutionary dynamics, which is guaranteed for this choice of and the range of ’s considered in the paper. Appropriate care needs to be taken when larger systems are studied to ensure that the co-evolution is correctly implemented.
The parameter is a kind of ‘social temperature’ that characterises the average volatility of individuals in a society Bahr and Passerini (1998). The higher is, the more volatile on average an individual is. This means that he or she is more likely to update his/her opinion and social ties, regardless of which flips reduce social stress. The update rules specified by and are based on the intuition that a change that reduces social stress (lower ) is more favourable than one that increases it. The choice of an exponential function is for convenience only and has no particular meaning (as it has in physics).
II.4 Social coherence through external influences
Opinion formation is not a purely endogenous process. It can be influenced strongly by external influences, such as religion, nationalism, and so on. Within the proposed framework, such influences can be included with additional terms in the function. We propose to study a term that discourages people from maintaining hostile links. This could be the message of an exogenous religious or moral norm (“love all the others”), or some nationalist propaganda that suggests that people of the same nation should be unconditionally friendly to one another. To this end, whenever we want to model exogenous pro-social pressure, we add a third term, , where , to Eq. (1). Clearly, this term will suppress negative links in the society.
II.5 Characterising modes of collective behaviour—order parameters for social fragmentation
To characterise the degree of social cohesion or fragmentation we have to define appropriate quantities that we call order parameters. In the theory of phase transitions Landau (1936), order parameters signal regime shifts from one phase into another. To quantify the degree of social fragmentation we use the following measures:
II.5.1 Size distribution of echo chambers
A clear signal for social fragmentation is the distribution of cluster sizes. In a fragmented society there exists a large number of small groups of individuals that cooperate within their group but are hostile towards other groups. We detect these clusters by minimising the number of positive relations between them and that of negative links within them Doreian and Mrvar (1996); Traag and Bruggeman (2009); Esmailian et al. (2014). By doing that, most of the negative links will be found between the clusters. Further, in agreement with the notion of echo chambers in the literature, from the detected “positive” clusters, we select those that consist of only like-minded agents and identify them as echo chambers. The size of an echo chamber is thus given by the number of such nodes, and is denoted by , where denotes the chamber.
II.5.2 A measure for polarisation,
We introduce a simple network variable, , to measure the level of social balance in the society. It is defined as the difference of the fractions of balanced and unbalanced triangles in the network:
| (2) |
where and are the number of balanced and unbalanced triangles, respectively. means that all triangles are balanced, signals that unbalanced triangles are present. Even though could be negative, this situation is never observed in simulations. This is in agreement with both Heider’s intuition and the empirical evidence obtained in real social networks, where the value of is typically above Leskovec et al. (2010). The case corresponds to an equal number of balanced and unbalanced triangles. From Harary’s result222A network is balanced if it consists of only balanced cycles (triangles are a special case of cycle of length ). His theorem states that a signed graph is balanced if and only if the set of nodes can be partitioned into two disjoint subsets (one of which may be empty), such that all links between nodes of the same subset are positive, and all links between nodes of the different subsets are negative. Harary (1953), it follows that if the network can be partitioned into strictly positive clusters, within which all links are positive and between which links are exclusively negative, then . In reverse, the case, , is not sufficient to imply such a partition for sparse networks; however, high values of () generally correspond to a clustering that is close to this partition.
II.5.3 A measure for group homogeneity,
We need a quantity to characterise how opinions are distributed within groups. If a society fragments, it re-organises into sub-communities (clusters) of mutually befriended individuals who would be expected to hold similar opinions. We can measure the average level of opinion homogeneity within a group by
| (3) |
where denotes the -th positive cluster found by the community detection method Doreian and Mrvar (1996); Traag and Bruggeman (2009); Esmailian et al. (2014). The average, , is taken over all the detected clusters. By definition, is the average of the absolute values of the local (binary) opinions over all groups so that . if and only if all clusters are composed of like-minded individuals only. However, opinions may be different between individuals belonging to different clusters. On the contrary, corresponds to a totally cohesive society that consists of either one or many groups of befriended individuals but there is no opinion that dominates in any one of these groups. Intermediate values of signal that within a group opinions vary and there is no consensus among its members.
II.5.4 A measure for opinion diversity,
As a simple measure for the opinion diversity across groups we compute the overall opinion of the society
| (4) |
By definition, . The lower is, the more diverse opinions are. Opinions are aligned across society if . This measure can also serve as a probe of how fast opinions can converge to a consensus. This is important because in real social contexts one can change opinions and friends (or enemies) within a limited lifetime. Therefore, convergence times do matter and must be studied in detail. The time required for the system to equilibrate from different initial conditions may vary strongly.
III Results
We simulate the model given in Eq. (1) for the parameter choices of , and . We first discuss the phase diagram of the model and its consequences.
III.1 Phase diagrams
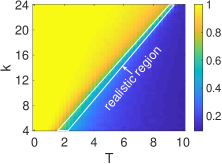
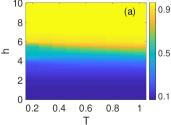
The central result of this paper is shown in Fig. 4 that shows (in colour code) as a function of the average connectivity, , and social temperature, . There is a clear separation line at which the society transitions from a well mixed situation with (blue) to a fragmented one, characterised by (yellow). In the yellow region, the emergent networks are strongly balanced and opinion clusters exist. These polarised clusters disappear and opinions become randomly distributed amongst agents in the dark blue region, where there are as many balanced as unbalanced triangles. Note, that values of are unrealistic. Real societies are balanced and show empirical values in a range around Leskovec et al. (2010); Szell et al. (2010). We indicate the realistic region with a white box. Assuming that a given society is found somewhere in the realistic region, say at a fixed , it only takes a small increase of social connectivity, , for the society to be pushed into the fragmented filter bubble phase. In recent years the average connectivity has certainly increased in societies, making it easier for them to transition into the fragmented regime. The result in Fig. 4 is obtained for a regular lattice (). We confirmed that the existence of the separation line also holds for small world network topologies; see also below.
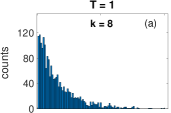
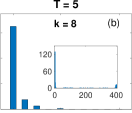
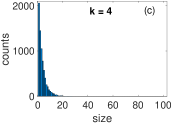
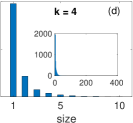
III.2 Size distribution of echo chambers
We show the echo chamber size distribution for various values of and in Fig. 5. The left column shows the situation for small social temperature, , the right column shows . The upper panels show a high average connectivity, , while the lower ones correspond to neighbours. The left column corresponds to the fragmented phase, the right column to the cohesive phase. It is clearly visible that deep in the fragmented phase there is a broad distribution of echo chamber sizes, spreading to sizes of about 100 for and to sizes of about 20 for . In the right column we observe sharply peaked distributions with maximum cluster sizes of about 2-3, meaning that there is no large cluster of unique opinion forming. This corresponds to a society where different opinions co-exist. The insets show the size distribution of the “positive” clusters found by the community detection method. Note that in (b) there is a small peak at 400, which is the maximal size of a cluster. This indicates the possibility of global cooperation of the whole society in the cohesive phase even if opinions are diverse.
III.3 Robustness
To find out if results are robust with respect to changes of parameters, we perform a series of robustness checks.
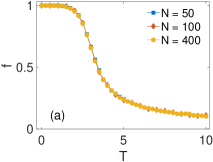
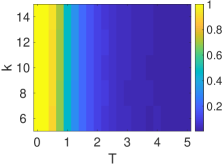
We first test the dependence on the size of the society. For a fixed value of we show a section of the phase diagram in Fig. 6 (a) for various system sizes, on regular networks. Clearly, there is no visible size dependence. It can be safely assumed that this will also hold when taking 333In this case the relative update ratio of opinions to links has to be modified appropriately.. This result is not unexpected since we keep the connectivity smaller than .
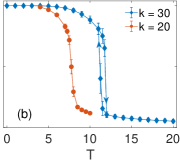
In Fig. 6 (b) we show the effect of the average connectivity on the results, where we fix and compute for various values of . As we already noted in Fig. 4 with increasing the phase diagram is shifted towards the fragmented phase (yellow region in the phase diagram). The transition appears to be discontinuous (first-order), meaning that jumps as a function of the temperature variable. Fig. 6 (b) also demonstrates a hysteresis effect (visible for ), which often accompanies first order transitions. This can be understood in the following way: If in Fig. 6 (b) we increase , starts to gradually decrease, and then drops rapidly to much lower values. If at that point one would start decreasing , would not immediately jump up to previous levels, but remain low until at a lower it would finally jump upward again. See arrows in the figure.
To test if the particular network structure has an influence on the results, we computed the phase diagrams with small-world networks Watts and Strogatz (1998). The small-world parameter, , controls the probability to re-connect a link from any node to any other node. Here we rewire the connections in such a way that the network remains connected and does not dissociate into different components. Note that means a regular network, corresponds to a random graph. Figure 6 (c) shows the result. The transition line is shifted towards the left, i.e., the critical temperature decreases with increasing . This fact can be understood as a consequence of having less triangles in the networks that are obtained with a larger value of ; see SI 12.
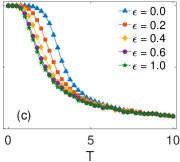
Finally, we check what happens if we lower the coupling strength of the Heider term in Eq. 1. When we take , we observe a shift of the phase transition line to the left and the dependence of the transition on the connectivity, , becomes negligible; see Fig. 8 in the SI. Obviously, for the case where the Heider term vanishes, there will be no more dependence on . The pronounced fragmentation transition at high interconnectedness is hence a direct consequence of social balance.
III.4 The role of external influences
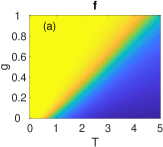
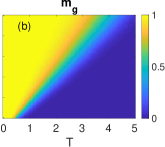
In Fig. 7 (a) we show the effect of the external influence, , designed to suppress negative links in the society, on the fragmented phase. It does what it is expected to do. Note that the terms and may compete with each other: if promotes the flip of a negative link this could result in more unbalanced triangles, meaning that it works against the effect of . As a consequence of this competition, a low value of can only remove a small fraction of negative links and a fragmented society emerges, similar to the case without the external influence. Only beyond a critical threshold, , can most of the negative links be eliminated and global consensus be reached. See SI 11 for an illustration of this phenomenon for a simple network of nodes. Since there is no transition in (it remains close to ), we use to characterise the change in the final state of the society under the effect of the external influence.
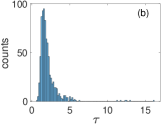
III.5 A note on time scales
In Fig. 7 (b) we analyse the times, , that are necessary for the order parameters to converge to their stationary values. This is essential to check since convergence times in this type of system can be exceedingly and unrealistically long. is the time required for the system to equilibrate at low social temperature. We observe in Fig. 7 (b) that on average is of the order of timesteps. Given that the number of links is , the distribution of with a mean means that the network updates about 4 times on average before reaching equilibrium. However, for a particular run, may vary substantially, depending also on the initial conditions. Typically, the steady state can be reached faster if the initial fraction of positive links is above . The variability becomes more pronounced in the presence of external influence, . At sufficiently low temperature, the convergence times can become very long due to the existence of many local minima, so-called “jammed states”, in the energy landscape Antal et al. (2005); Marvel et al. (2009). The social stress in a jammed state is not larger than that in any of its neighbouring states, which can be reached from this state by a single spin or link flip. Evolving on such a “rugged landscape”, the system is very likely to get trapped in local minima. The global minimum of the social tension, , hence may even become unobservable during simulation time.
IV Summary and discussion
We proposed a model that captures five key elements of human societies: (i) Agency. Humans make their decisions individually. (ii) Social context—social networks. Individuals are constantly influenced by opinions and actions of others in their social neighbourhood, or by other external influences. (iii) Stochasticity. Individuals are not fully rational and take random decisions from time to time, that do not maximise certain objective- or utility functions. (iv) Co-evolution. Individuals update their opinions as well as their social links. Most of these updates tend to avoid social tension. (v) Social balance. Social networks show robust overall structures of positive and negative social links. They follow robust patterns of social balance.
We implemented a simple model that captures these five building blocks in a stochastic manner in the framework of a Hamiltonian approach. The focus of the model rests on the notion that humans tend to update opinions and social links, so as to reduce social tension. The model exhibits a clear phase diagram, i.e. it shows at which parameter values tipping points occur where a society rapidly changes its microscopic composition and structure.
The results deliver a very clear and robust message: A society with the ability of a co-evolutionary dynamics of opinion- and link formation must be expected to have a phase diagram as the one presented in Fig. 4. This is a direct consequence of the social balance term in the model, that incorporates the empirical fact that societies are socially balanced to a high degree. The phase diagram shows the existence of a critical connectivity, , between individuals of a society at a fixed social temperature, , that controls the update frequencies of opinions and links. Below that connectivity, , society is in the cohesive phase, where opinions co-exist. Above the critical connectivity, society fragments into clusters of individuals who share positive links within the clusters and have negative links between groups. Within the clusters, large patches of uniform opinions form, and a strong reinforcement of homophily is observed. The existence of a critical connectivity is an extremely robust fact; if the connectivity increases above the critical value, society inevitably must fragment.
The model also gives clear answers to how the fragmented phase can be avoided. There are only two ways out: either to lower the connectivity below the critical density, , by reducing the number of interaction partners (social distancing) or, alternatively, to increase the social temperature, , meaning that people would update their opinions (and links) randomly more often. There are no other alternatives within the framework of this model. For the case of increasing update rates, however, the existence of the mentioned hysteresis phenomenon must be taken into account. This means that if at a fixed interaction density, update rates, , are increased, the fragmentation might transition rapidly to the mixed opinion phase, at, say . If then the update rates are again reduced, fragmentation does not immediately return, but might reappear at lower update rates, .
With the strength of the Heider term, , and the irregular patterns of the underlying networks for , the position of the critical lines can be shifted. The phase diagram remains robust to changes of the overall size of the society. We have seen that under strong exogenous influences, , such as religion or nationalism, there is a possibility of transitioning from a fragmented society to a “utopian” or fascist one; such interventions will force the society towards a global consensus.
The presented model has a number of shortcomings. Several essential features of real societies have not been included. We strongly simplified the structure of social connectivity. Whereas social systems are multi-layer networks, here we have focussed only on a single layer. It remains to be seen how the phase diagrams change under the integration of more than one layer of (positive and negative) social interactions.
We have also made simplifying assumptions about the plasticity of social networks. In reality individuals can not only switch the sign of social links, but also eliminate and establish new links. We have made a few exploratory steps in this direction, however decided to keep the topologies fixed for the sake of identifying the essential underlying mechanisms. By allowing for more plasticity in network formation, we think that the essence of the model will not be affected much.
The use of one single binary opinion is minimalistic and unrealistic. It would be much more realistic to use multiple opinions such as cultural features in the Axelrod model Axelrod (1997). The original dynamics, however, needs to be modified to account for negative links. For example, two agents connected by a positive link can become more similar after interaction, while those who are hostile to each other should grow further apart in the space of opinions. It would be interesting to compare the effect of social balance on the fragmentation in this case with the one that occurs in the presented model. The key message of our model should remain valid as the social balance ensures the existence of clusters of positive links, within each of which opinions are driven toward uniformity by the reinforcement effect of homophily, regardless of the opinion multiplicity.
The use of the same social temperature for both the opinion and link update, is not justified a priori and has been applied for the sake of simplicity. To describe situations, in which, either agents’ opinions are more frequent to change than their relations, or vice versa, we introduced the parameter, . As shown in the SI, within a range of that ensures a true co-evolutionary dynamics, the results do practically not depend on . Alternatively, a stochastic dynamics with two temperatures, one for opinions and one for links is certainly reasonable. However, in this generalisation a more complicated non-equilibrium approach is required. The structure of the phase diagram may become richer with long-lived metastable phases. Such a non-equilibrium approach has been considered recently in Saeedian et al. (2019), where the network evolution is not driven by Heider’s balance, but by another aspect of cognitive dissonance. There fragmentation emerges either as an absorbing steady state of the dynamics or from an active phase due to fluctuations in systems of finite size.
Finally, from a technical side, the model employed here is a variation of a spin glass model used in physics. With the present choice of model parameters (low connectivity, networks of finite size, ), we can not expect to find the complicated phase space structure of a mean-field spin glass Mezard et al. (1986). However, the essence of frustration imposed by the Heider term is clearly the same as in spin glasses. A more detailed technical study of the model is going to be published elsewhere.
V Final conclusion
The main conclusion of this paper is that it unambiguously shows that the presence of social balance carries the seed to social fragmentation. Fragmentation inevitably occurs in a co-evolutionary society if the average interaction density exceeds a critical threshold.
Acknowledgements
This work was supported in part by Austrian Science Fund FWF under P P 29252, and by the Austrian Science Promotion Agency, FFG project under 857136. Simulations were carried out in part at the Vienna Scientific Cluster. We thank Tobias Reisch for technical assistance with the simulations.
References
- Durkheim (1893) É. Durkheim, De la division du travail social: étude sur l’organisation des sociétés supérieures, Bibl. de philos. contemp (Alcan, 1893), URL https://books.google.at/books?id=2Gs35ZZTnD0C.
- Pahl (1991) R. E. Pahl, European Journal of Sociology 32, 345 (1991).
- Bruhn (2009) J. Bruhn, The Group Effect: Social Cohesion and Health Outcomes (Springer US, Boston, MA, 2009), chap. The Concept of Social Cohesion, pp. 31–48, ISBN 978-1-4419-0364-8, URL https://doi.org/10.1007/978-1-4419-0364-8_2.
- Dubet (2013) F. Dubet, The Dynamics and Social Outcomes of Education Systems (Palgrave Macmillan UK, London, 2013), chap. Social Cohesion as Paradigm, pp. 141–159, ISBN 978-1-137-02569-2, URL https://doi.org/10.1057/9781137025692_7.
- Stanley (2003) D. Stanley, The Canadian Journal of Sociology 28, 5 (2003), ISSN 03186431, 17101123, URL http://www.jstor.org/stable/3341872.
- Chan et al. (2006) J. Chan, H.-P. To, and E. Chan, Social Indicators Research 75, 273 (2006), URL https://doi.org/10.1007/s11205-005-2118-1.
- Daly et al. (2008) M. Daly et al., Report of high-level task force on social cohesion: Towards an active, fair and socially cohesive europe (2008).
- Jenson (2010) J. Jenson, Defining and measuring social cohesion (Commonwealth Secretariat, 2010).
- OECD (2011) OECD, Perspectives on Global Development 2012: Social Cohesion in a Shifting World, Perspectives on Global Development (OECD Publishing, 2011), ISBN 9789264113152, URL https://dx.doi.org/10.1787/persp_glob_dev-2012-en.
- Dragolov et al. (2016) G. Dragolov, Z. Ignácz, J. Lorenz, J. Delhey, K. Boehnke, and K. Unzicker, Social Cohesion in the Western World: What Holds Societies Together: Insights from the Social Cohesion Radar, SpringerBriefs in Well-Being and Quality of Life Research (Springer International Publishing, Berlin, 2016), ISBN 9783319324647, URL https://books.google.at/books?id=4HBBDAAAQBAJ.
- Schiefer and Van der Noll (2017) D. Schiefer and J. Van der Noll, Social Indicators Research 132, 579 (2017), URL https://doi.org/10.1007/s11205-016-1314-5.
- Denton and Voth (2016) R. Denton and B. Voth, Social Fragmentation and the Decline of American Democracy: The End of the Social Contract (Springer International Publishing, 2016), ISBN 9783319439228, URL https://books.google.at/books?id=i6GwDQAAQBAJ.
- Berger and Stif (1998) P. Berger and B. Stif, The Limits of Social Cohesion: Conflict and Mediation in Pluralist Societies : a Report of the Bertelsmann Foundation to the Club of Rome (Westview Press, 1998), ISBN 9780813334011, URL https://books.google.at/books?id=nkK3AAAAIAAJ.
- Gough and Olofsson (1999) I. Gough and G. Olofsson, Capitalism and social cohesion: Essays on exclusion and integration (Springer, 1999).
- Fukuyama (2018) F. Fukuyama, Identity: The Demand for Dignity and the Politics of Resentment (Farrar, Straus and Giroux, 2018), ISBN 9780374717483, URL https://books.google.at/books?id=OjpIDwAAQBAJ.
- Bodnar (2001) J. Bodnar, Critical Perspectives on Urban Redevelopment (Emerald Group Publishing Limited, 2001), chap. On fragmentation, urban and social, pp. 173–193, URL https://doi.org/10.1016/S1047-0042(01)80008-8.
- Bright (2018) J. Bright, Journal of Computer-Mediated Communication 23, 17 (2018), ISSN 1083-6101, eprint https://academic.oup.com/jcmc/article-pdf/23/1/17/23822774/zmx002.pdf, URL https://doi.org/10.1093/jcmc/zmx002.
- Garimella et al. (2018) K. Garimella, G. De Francisci Morales, A. Gionis, and M. Mathioudakis, in Proceedings of the 2018 World Wide Web Conference (International World Wide Web Conferences Steering Committee, Republic and Canton of Geneva, CHE, 2018), WWW ’18, p. 913–922, ISBN 9781450356398, URL https://doi.org/10.1145/3178876.3186139.
- Valle and Bravo (2018) M. E. D. Valle and R. B. Bravo, International Journal of Communication 12 (2018), ISSN 1932-8036, URL https://ijoc.org/index.php/ijoc/article/view/8406.
- Pariser (2011) E. Pariser, The filter bubble: How the new personalized web is changing what we read and how we think (Penguin, 2011).
- Flaxman et al. (2016) S. Flaxman, S. Goel, and J. M. Rao, Public Opinion Quarterly 80, 298 (2016), ISSN 0033-362X, eprint https://academic.oup.com/poq/article-pdf/80/S1/298/17120810/nfw006.pdf, URL https://doi.org/10.1093/poq/nfw006.
- Sunstein (2002) C. R. Sunstein, Journal of Political Philosophy 10, 175 (2002), eprint https://onlinelibrary.wiley.com/doi/pdf/10.1111/1467-9760.00148, URL https://onlinelibrary.wiley.com/doi/abs/10.1111/1467-9760.00148.
- Evans and Fu (2018) T. Evans and F. Fu, Royal Society Open Science 5, 181122 (2018), eprint https://royalsocietypublishing.org/doi/pdf/10.1098/rsos.181122, URL https://royalsocietypublishing.org/doi/abs/10.1098/rsos.181122.
- Sirbu et al. (2019) A. Sirbu, D. Pedreschi, F. Giannotti, and J. Kertész, PLOS ONE 14, 1 (2019), URL https://doi.org/10.1371/journal.pone.0213246.
- Baumann et al. (2020) F. Baumann, P. Lorenz-Spreen, I. M. Sokolov, and M. Starnini, Phys. Rev. Lett. 124, 048301 (2020), URL https://link.aps.org/doi/10.1103/PhysRevLett.124.048301.
- Bramson et al. (2017) A. Bramson, P. Grim, D. J. Singer, W. J. Berger, G. Sack, S. Fisher, C. Flocken, and B. Holman, Philosophy of Science 84, 115 (2017), eprint https://doi.org/10.1086/688938, URL https://doi.org/10.1086/688938.
- Axelrod (1997) R. Axelrod, Journal of Conflict Resolution 41, 203 (1997), eprint https://doi.org/10.1177/0022002797041002001, URL https://doi.org/10.1177/0022002797041002001.
- Klemm et al. (2003) K. Klemm, V. M. Eguíluz, R. Toral, and M. S. Miguel, Phys. Rev. E 67, 045101 (2003), URL https://link.aps.org/doi/10.1103/PhysRevE.67.045101.
- Castellano et al. (2000) C. Castellano, M. Marsili, and A. Vespignani, Phys. Rev. Lett. 85, 3536 (2000), URL https://link.aps.org/doi/10.1103/PhysRevLett.85.3536.
- Flache and Macy (2011) A. Flache and M. W. Macy, Journal of Conflict Resolution 55, 970 (2011), eprint https://doi.org/10.1177/0022002711414371, URL https://doi.org/10.1177/0022002711414371.
- Battiston et al. (2017) F. Battiston, V. Nicosia, V. Latora, and M. S. Miguel, Scientific Reports 7, 1809 (2017), URL https://doi.org/10.1038/s41598-017-02040-4.
- Schelling (1971) T. C. Schelling, The Journal of Mathematical Sociology 1, 143 (1971), eprint https://doi.org/10.1080/0022250X.1971.9989794, URL https://doi.org/10.1080/0022250X.1971.9989794.
- Pancs and Vriend (2007) R. Pancs and N. J. Vriend, Journal of Public Economics 91, 1 (2007), URL https://ideas.repec.org/a/eee/pubeco/v91y2007i1-2p1-24.html.
- Heider (1946) F. Heider, The Journal of Psychology 21, 107 (1946), pMID: 21010780, eprint https://doi.org/10.1080/00223980.1946.9917275, URL https://doi.org/10.1080/00223980.1946.9917275.
- Hummon and Doreian (2003) N. P. Hummon and P. Doreian, Social Networks 25, 17 (2003), ISSN 0378-8733, URL http://www.sciencedirect.com/science/article/pii/S0378873302000199.
- Szell et al. (2010) M. Szell, R. Lambiotte, and S. Thurner, Proceedings of the National Academy of Sciences 107, 13636 (2010), ISSN 0027-8424, eprint https://www.pnas.org/content/107/31/13636.full.pdf, URL https://www.pnas.org/content/107/31/13636.
- Szell and Thurner (2010) M. Szell and S. Thurner, Social Networks 32, 313 (2010), ISSN 0378-8733, URL http://www.sciencedirect.com/science/article/pii/S0378873310000316.
- Szell and Thurner (2012) M. Szell and S. Thurner, Advances in Complex Systems 15, 1250064 (2012), eprint https://doi.org/10.1142/S0219525912500646, URL https://doi.org/10.1142/S0219525912500646.
- Leskovec et al. (2010) J. Leskovec, D. Huttenlocher, and J. Kleinberg, in Proceedings of the SIGCHI Conference on Human Factors in Computing Systems (ACM, New York, NY, USA, 2010), CHI ’10, pp. 1361–1370, ISBN 978-1-60558-929-9, URL http://doi.acm.org/10.1145/1753326.1753532.
- Facchetti et al. (2011) G. Facchetti, G. Iacono, and C. Altafini, Proceedings of the National Academy of Sciences 108, 20953 (2011), ISSN 0027-8424, eprint https://www.pnas.org/content/108/52/20953.full.pdf, URL https://www.pnas.org/content/108/52/20953.
- Facchetti et al. (2012) G. Facchetti, G. Iacono, and C. Altafini, Phys. Rev. E 86, 036116 (2012), URL https://link.aps.org/doi/10.1103/PhysRevE.86.036116.
- Estrada and Benzi (2014) E. Estrada and M. Benzi, arXiv 1406.2132, 1 (2014), eprint 1406.2132.
- Zheng et al. (2015) X. Zheng, D. Zeng, and F.-Y. Wang, Information Systems Frontiers 17, 1077 (2015), ISSN 1572-9419, URL https://doi.org/10.1007/s10796-014-9483-8.
- Sadilek et al. (2018) M. Sadilek, P. Klimek, and S. Thurner, Journal of Computational Social Science 1, 227 (2018), ISSN 2432-2725, URL https://doi.org/10.1007/s42001-017-0010-9.
- Kirkley et al. (2019) A. Kirkley, G. T. Cantwell, and M. E. J. Newman, Phys. Rev. E 99, 012320 (2019), URL https://link.aps.org/doi/10.1103/PhysRevE.99.012320.
- Lerner and Lomi (2020) J. Lerner and A. Lomi, Social Networks 60, 11 (2020), ISSN 0378-8733, URL http://www.sciencedirect.com/science/article/pii/S0378873318300467.
- Neal (2020) Z. P. Neal, Social Networks 60, 103 (2020), ISSN 0378-8733, URL http://www.sciencedirect.com/science/article/pii/S0378873317303039.
- Thurner et al. (2018) S. Thurner, R. Hanel, and P. Klimek, Introduction to the Theory of Complex Systems (Oxford University Press, Oxford, 2018), ISBN 9780191861062, URL https://books.google.at/books?id=KlFswAEACAAJ.
- Böhme and Gross (2011) G. A. Böhme and T. Gross, Phys. Rev. E 83, 035101 (2011), URL https://link.aps.org/doi/10.1103/PhysRevE.83.035101.
- Holme and Newman (2006) P. Holme and M. E. J. Newman, Phys. Rev. E 74, 056108 (2006), URL https://link.aps.org/doi/10.1103/PhysRevE.74.056108.
- Centola et al. (2007) D. Centola, J. C. González-Avella, V. M. Eguíluz, and M. S. Miguel, Journal of Conflict Resolution 51, 905 (2007), eprint https://doi.org/10.1177/0022002707307632, URL https://doi.org/10.1177/0022002707307632.
- Kozma and Barrat (2008) B. Kozma and A. Barrat, Phys. Rev. E 77, 016102 (2008), URL https://link.aps.org/doi/10.1103/PhysRevE.77.016102.
- Castellano et al. (2009) C. Castellano, S. Fortunato, and V. Loreto, Rev. Mod. Phys. 81, 591 (2009), URL https://link.aps.org/doi/10.1103/RevModPhys.81.591.
- Sîrbu et al. (2017) A. Sîrbu, V. Loreto, V. D. Servedio, and F. Tria, in Participatory Sensing, Opinions and Collective Awareness (Springer, 2017), pp. 363–401.
- DeGroot (1974) M. H. DeGroot, Journal of the American Statistical Association 69, 118 (1974), ISSN 01621459, URL http://www.jstor.org/stable/2285509.
- Clifford and Sudbury (1973) P. Clifford and A. Sudbury, Biometrika 60, 581 (1973), ISSN 0006-3444, eprint http://oup.prod.sis.lan/biomet/article-pdf/60/3/581/576759/60-3-581.pdf, URL https://doi.org/10.1093/biomet/60.3.581.
- Holley and Liggett (1975) R. A. Holley and T. M. Liggett, The Annals of Probability 3, 643 (1975), ISSN 00911798, URL http://www.jstor.org/stable/2959329.
- Galam (2002) S. Galam, The European Physical Journal B-Condensed Matter and Complex Systems 25, 403 (2002).
- Deffuant et al. (2000) G. Deffuant, D. Neau, F. Amblard, and G. Weisbuch, Advances in Complex Systems 3, 87 (2000), eprint https://doi.org/10.1142/S0219525900000078, URL https://doi.org/10.1142/S0219525900000078.
- Hegselmann and Krause (2002) R. Hegselmann and U. Krause, Journal of Artificial Societies and Social Simulation 5, 1 (2002), URL https://ideas.repec.org/a/jas/jasssj/2002-5-2.html.
- Watts (2002) D. J. Watts, Proceedings of the National Academy of Sciences 99, 5766 (2002), ISSN 0027-8424, eprint https://www.pnas.org/content/99/9/5766.full.pdf, URL https://www.pnas.org/content/99/9/5766.
- Klimek et al. (2008) P. Klimek, R. Lambiotte, and S. Thurner, EPL 82, 28008 (2008), URL https://doi.org/10.1209%2F0295-5075%2F82%2F28008.
- Altafini (2012) C. Altafini, PLOS ONE 7, 1 (2012), URL https://doi.org/10.1371/journal.pone.0038135.
- Altafini (2013) C. Altafini, IEEE Transactions on Automatic Control 58, 935 (2013).
- Altafini and Lini (2015) C. Altafini and G. Lini, IEEE Transactions on Automatic Control 60, 342 (2015).
- Proskurnikov et al. (2016) A. V. Proskurnikov, A. S. Matveev, and M. Cao, IEEE Transactions on Automatic Control 61, 1524 (2016), ISSN 2334-3303.
- Meng et al. (2016) Z. Meng, G. Shi, K. H. Johansson, M. Cao, and Y. Hong, Automatica 73, 110 (2016), ISSN 0005-1098, URL http://www.sciencedirect.com/science/article/pii/S0005109816302497.
- Hebb (1949) D. Hebb, The Organization of Behavior: A Neuropsychological Theory, A Wiley book in clinical psychology (Wiley, 1949), ISBN 9780471367277, URL https://books.google.at/books?id=dZ0eDiLTwuEC.
- Macy et al. (2003) M. W. Macy, J. A. Kitts, A. Flache, and S. Benard, Dynamic Social Network Modeling and Analysis: Workshop Summary and Papers (The National Academies Press, Washington, DC, 2003), chap. Polarization in Dynamic Networkds: A Hopfield Model of Emergent Structure, p. 162, ISBN 978-0-309-08952-4, URL https://www.nap.edu/catalog/10735/.
- Singh et al. (2014) R. Singh, S. Dasgupta, and S. Sinha, EPL 105, 10003 (2014), URL https://doi.org/10.1209%2F0295-5075%2F105%2F10003.
- Saeedian et al. (2019) M. Saeedian, M. San Miguel, and R. Toral, Scientific Reports 9, 9726 (2019), ISSN 2045-2322, URL https://doi.org/10.1038/s41598-019-45937-y.
- Watts and Strogatz (1998) D. Watts and S. Strogatz, Nature 393, 440 (1998), URL https://doi.org/10.1038/30918.
- Festinger et al. (1950) L. Festinger, S. Schachter, and K. Back, Social Pressures in Informal Groups: A Study of Human Factors in Housing, A Publication of the Research Center for Group Dynamics, University of Michigan (Harper, 1950), ISBN 9780804701730, URL https://books.google.at/books?id=1zSsAAAAIAAJ.
- French Jr (1956) J. R. French Jr, Psychological review 63, 181 (1956).
- Harary (1959) F. Harary, Studies in social power (Univer. Michigan, 1959), chap. A criterion for unanimity in French’s theory of social power., pp. 168–182.
- Edwards and Anderson (1975) S. F. Edwards and P. W. Anderson, Journal of Physics F: Metal Physics 5, 965 (1975), URL https://doi.org/10.1088%2F0305-4608%2F5%2F5%2F017.
- Antal et al. (2005) T. Antal, P. L. Krapivsky, and S. Redner, Phys. Rev. E 72, 036121 (2005), URL https://link.aps.org/doi/10.1103/PhysRevE.72.036121.
- Marvel et al. (2009) S. A. Marvel, S. H. Strogatz, and J. M. Kleinberg, Phys. Rev. Lett. 103, 198701 (2009), URL https://link.aps.org/doi/10.1103/PhysRevLett.103.198701.
- Rabbani et al. (2019) F. Rabbani, A. H. Shirazi, and G. R. Jafari, Phys. Rev. E 99, 062302 (2019), URL https://link.aps.org/doi/10.1103/PhysRevE.99.062302.
- Metropolis et al. (1953) N. Metropolis, A. W. Rosenbluth, M. N. Rosenbluth, A. H. Teller, and E. Teller, The Journal of Chemical Physics 21, 1087 (1953), eprint https://doi.org/10.1063/1.1699114, URL https://doi.org/10.1063/1.1699114.
- Bahr and Passerini (1998) D. B. Bahr and E. Passerini, The Journal of Mathematical Sociology 23, 1 (1998), eprint https://doi.org/10.1080/0022250X.1998.9990210, URL https://doi.org/10.1080/0022250X.1998.9990210.
- Landau (1936) L. Landau, Nature 138, 840 (1936), URL https://doi.org/10.1038/138840a0.
- Doreian and Mrvar (1996) P. Doreian and A. Mrvar, Social Networks 18, 149 (1996), ISSN 0378-8733, URL http://www.sciencedirect.com/science/article/pii/0378873395002596.
- Traag and Bruggeman (2009) V. A. Traag and J. Bruggeman, Phys. Rev. E 80, 036115 (2009), URL https://link.aps.org/doi/10.1103/PhysRevE.80.036115.
- Esmailian et al. (2014) P. Esmailian, S. E. Abtahi, and M. Jalili, Phys. Rev. E 90, 042817 (2014), URL https://link.aps.org/doi/10.1103/PhysRevE.90.042817.
- Harary (1953) F. Harary, Michigan Math. J. 2, 143 (1953), URL https://doi.org/10.1307/mmj/1028989917.
- Mezard et al. (1986) M. Mezard, G. Parisi, and M. Virasoro, Spin Glass Theory and Beyond (World Scientific, Singapore, 1986), eprint https://www.worldscientific.com/doi/pdf/10.1142/0271, URL https://www.worldscientific.com/doi/abs/10.1142/0271.
VI Supplementary Material
VI.1 Dependence of fragmentation on social balance,
As shown in Fig. 4, fragmentation can occur at any level of interconnectedness if the social temperature is low enough. The fragmentation that inevitably happens is caused by social balance. Societies with weak Heider’s balance all become fragmented below a universal “critical” temperature, regardless of their communication densities. The phase diagram in Fig. 8 demonstrates this point. Here we used a very weak social balance of . The fragmented phase (yellow) extends as the relative effect of social balance, , increases, as seen in Fig. 9. Rescaling to a non-zero value simply shifts the critical line without changing the structure of the phase diagram.
VI.2 Relative update frequencies—choice of parameter
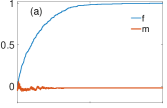
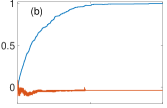
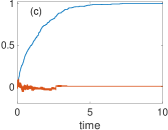
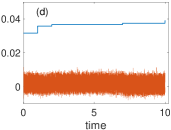
Figure 10 shows how the observables (blue) and (red) evolve over time for different values of . For values of that ensure a correct implementation of the co-evolutionary dynamics (), the system evolves in more or less the same way, see panels (a)-(c). Based on this observation we made our choice for as used in the paper. Only when links evolve very slowly compared to opinions () do we observe significant deviations; the system can no longer equilibrate during the simulation time. Note the change of scale in panel (d).
VI.3 Illustration of external influences,
To illustrate the effect of and its competing role with in some cases, in Fig. 11 we show an evolutionary path, which a system of three individuals would follow if . For this particular system at zero temperature. When , both the bipolar (bottom-left) and global consensus (top-right) states are attractors. If the system starts from any configuration in the basin of attraction of the bipolar state, it ends up in this state. This state is no longer the global minimum of the social stress, , if an external influence, , is introduced. The system will then be driven towards consensus, following, for example, the illustrated path.
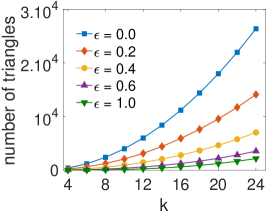
VI.4 Number of triangles in small-world networks
Figure 12 shows the number of triangles in small-world networks as a function of and the rewiring parameter, . It is obvious that less triangles exist in networks with more random connections (larger ). Therefore, the effect of Heider’s balance on the dynamics via triadic relations must become weaker as increases. This heuristically explains why the critical line is shifted towards the left, i.e., the fragmented phase shrinks with increasing .