The cell adaptation time sets a minimum length scale for patterned substrates
Abstract
The structure and dynamics of tissue cultures depend strongly on the physical and chemical properties of the underlying substrate. Inspired by previous advances in the context of inorganic materials, the use of patterned culture surfaces has been proposed as an effective way to induce space-dependent properties in cell tissues. However, cells move and diffuse and the transduction of external stimuli to biological signals is not instantaneous. Here, we show that the fidelity of patterns depends on the relation between the diffusion () and adaptation () times. Numerical results for the self-propelled Voronoi model reveal that the fidelity decreases with , a result that is reproduced by a continuum reaction-diffusion model. We derive a minimum length scale for the patterns that depends on and can be much larger than the cell size.
I Introduction
The regulated growth and maintenance of a living tissue under controlled conditions is a major challenge for cell biology and tissue engineering. The standard procedure consists in the use of culture surfaces to support and guide the cells Lo et al. (2000); Griffith and Naughton (2002); Rabodzey et al. (2008); Tambe et al. (2011); Park et al. (2015). An extensive body of research shows that the cell morphology and dynamics are sensitive to the physical and chemical properties of the substrate Lo et al. (2000); Discher et al. (2005); Guo et al. (2006); Neuss et al. (2009); Tambe et al. (2011); Murrell et al. (2011); Song and Mano (2013); Sunyer et al. (2016); Janmey et al. (2020). For example, it has been shown that substrate stiffness can significantly affect the geometry of cultured cells, including their spreading area Yeung et al. (2005); Janmey et al. (2020), volume Guo et al. (2017), and shape elongation Devany et al. (2019). In addition, the nanotopography of the substrate can alter cell polarization, shape, and motility Davis et al. (2011); Tseng et al. (2013); Jeon et al. (2015); Mengsteab et al. (2016). Thus, the effort has been in the design of biocompatible substrates that regulate the individual and collective dynamics of cells.
There is a sustained interest in the possibility of generating spatial patterns of cells with different properties, which is critical for morphogenesis, collective cell motion, and wound healing Nelson et al. (2005); Richert et al. (2008); Davis et al. (2011); Tseng et al. (2013); Jeon et al. (2015); Mengsteab et al. (2016); Horejs (2018); Pérez-Gonzáles et al. (2018); Brasch et al. (2019). In development, the processes that typically generate two tissue types separated by a boundary have been studied extensively Steinberg (1963); Harris (1976); Brodland (2002); Foty and Steinberg (2005); Amack and Manning (2012), and often occur because two different cell types, through various mechanisms, prefer to be surrounded by cells of the same type Maître et al. (2012); Krieg et al. (2008); Manning et al. (2010); Sussman et al. (2018); Sahu et al. (2020). However, in vitro, an alternative approach is to culture a single cell type on a patterned substrate, and allow the patterned substrate to change the properties of cells to generate a pattern Jeon et al. (2015); Richert et al. (2008); Mengsteab et al. (2016); Davis et al. (2011).
Patterned substrates have been used to a large extent in the context of inorganic materials Kumacheva et al. (2002); Fustin et al. (2003); Dziomkina and Vancso (2005); Cadilhe et al. (2007). However, their use for biological systems raises several additional difficulties. Besides the need for biocompatible materials, the transduction of external stimuli into biological signals that control the cell morphology and mechanics is not instantaneous. It requires a hierarchy of biochemical processes, which sets a characteristic adaptation time that can extend over hours Ebara (2015). The problem is that, within the adaptation time scale, cells might move around and explore other regions of the substrate. Thus, the fidelity of patterns in the regulation of cell tissues should depend on how the adaptation time compares with the other relevant time scales. This is precisely what we study here.
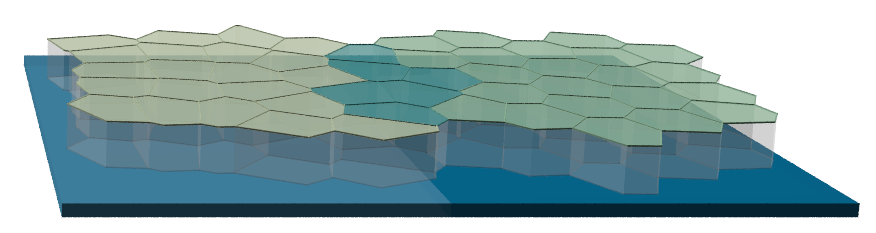
We consider an epithelial confluent tissue on a simple patterned substrate, consisting of two halves that solely differ in the cell-substrate interaction (see Fig. 1). We describe the tissue with the self-propelled Voronoi model, where the cell-substrate interaction is included in the preferential geometry of each cell, as cell shapes change as a function of substrate properties Yeung et al. (2005), and cell shape in turn governs the rate of cell diffusion in monolayers Park et al. (2015). We show that the fidelity of the pattern in the regulation of the tissue properties is compromised significantly when the adaptation time competes with the diffusion time of cells.
II Model
We model the confluent tissue as a monolayer of cells using the self-propelled Voronoi model Bi et al. (2016, 2014, 2015). Each cell is represented by its center and its shape is given by the Voronoi tesselation of the space. The stochastic trajectories of cells are obtained from a set of Langevin equations of motion,
| (1) |
where is the net force acting on cell , is the mobility of the cell, the self-propulsion speed, and is a polarity vector which sets the direction of the self-propulsion force. For simplicity, we consider that is a Brownian process given by,
| (2) |
where is a uncorrelated random process of zero mean and its variance sets the rotational diffusion .
The net force describes the multibody cell-cell interaction and it is given by , where is the energy functional for cell Farhadifar et al. (2007); Fletcher et al. (2014),
| (3) |
where and are the area and perimeter of cell , respectively, and and are their target values. The first term accounts for the cell incompressibility and the resistance to height fluctuations. The second term accounts for the active contractility of the actomyosin subcellular cortex and effective cell membrane tension, due to cell-cell adhesion and cortical tension. and are the area and perimeter moduli. By rescaling energy in units of , we obtain four adimensional quantities: two that characterize the area and the perimeter of the cell ( and ), a shape parameter , and (see Supplementary Information). Without loss of generality, below, all lengths are in units of and time is in units of .
Cells diffuse with a diffusion coefficient that depends on the four control parameters: the speed of self-propulsion , the rotational diffusion , the shape index , and the ratio . For fixed values of and , as considered here, the model yields a rigidity transition at a threshold value of the shape index : from a solid-like state with finite shear modulus, for , to a fluid-like state of zero rigidity, for , where cell rearrangements are more frequent Bi et al. (2016); Merkel et al. (2019).
We consider a squared substrate of linear length , where the value of the target shape index () is spatially dependent. As schematized in Fig. 1, we split the substrate in half, with different values of in each side. Thus, cells on the left-hand side have a target , while the ones on the right-hand side have , where . When a cell diffuses from one side to the other, their target value of the shape index in Eq. (3) changes accordingly, within a characteristic adaptation time . Thus, we consider that the time dependence of the shape index for cell is given by,
| (4) |
where is the time interval since the cell crossed the line dividing the substrate, for the last time. is the shape index of cell before crossing and is the target value in the new side.
III Results
To study the role of the adaptation time , we first consider a pair of values for the shape index for which the confluent tissue is in a fluid-like state at both sides of the substrate: and . For these values, the cell diffusion coefficients on each side differ by less than : and , obtained from the mean squared displacement. Below, we assume .
Initially, all cells are fully adapted to the underlying substrate (see Methods). As time evolves, cells diffuse and cross from one side to the other. However, due to the finite adaptation time, their target shape index changes in time, as given by Eq. (4), and thus cells of different shape indices mix in both sides of the substrate. To characterize this mixing, we measure the demixing parameter, , defined as,
| (5) |
where the out sum is over all cells and the inner sum is over the neighbors of cell Sahu et al. (2020). is the Heaviside step function and is a threshold that we set to (see Supplementary Information for the dependence on ). For the cells in the confluent tissue are completely segregated by their shape index, whereas for they are fully mixed, i.e., each cell is surrounded by cells with a different shape index.
Figure 2(a) shows the time dependence of the demixing parameter for different values of the adaptation time , where time is rescaled by . As cells mix, decreases and saturates asymptotically. Different curves are for different values of , where is the diffusion time. In Fig. 2(b) is the asymptotic value of as a function of for different numbers of cells (same density). A data collapse is observed, which shows that finite-size effects are negligible. The monotonic decrease of the asymptotic value of with hints at a competition between two time scales: the adaptation and the diffusion time. When the adaptation time is negligible (), cells adapt rapidly to the underlying substrate, with . When the two time scales compete, the value of should depend on the ratio between the two. In the limit where they are of the same order, should vanish, for the cell changes sides before fully adapting to the new shape index. Thus, large values of the adaptation time compromise the control over the shape of the tissue boundaries via patterned substrates.
The demixing parameter is not uniformly distributed in space. In Fig. 2(c) are three snapshots of the tissue obtained at time , for different values of . The color of cells depends on the value of the demixing parameter. Cells that are surrounded by cells of the same target shape index are in green (), the ones surrounded by cells of a different are in red (). The ones with intermediate values of are in blue. One clearly sees that the green cells are in the center of each half, whereas red cells are concentrated around the boundaries: middle and borders, due to the periodic boundary conditions. However, the width of the regions of green and red cells depends on the value of .
We define as the fraction of cells that are green () at time , where is the spatial coordinate along the horizontal direction. To compute numerically, we divide the system into vertical slices and measure the fraction of cells with within each slice. The results for , for different values of are shown in Fig. 3(a), for . As suggested by Fig. 2(c), there are more green cells at but, the fraction of cells and the width of the profile decreases with . The latter scales with as expected for a diffusive process (see Fig. 3(b)).
To describe the competition between cell diffusion and adaptation time, we now propose a continuum model to describe the time evolution of . For simplicity, we take advantage of the symmetry of the problem and only focus on . We consider a reaction-diffusion equation for ,
| (6) |
where is the time derivative and is the second space derivative. The first term on the right-hand side is a diffusive term that describes the collective diffusion of cells, with an effective diffusion coefficient . The second term is a reaction term, which describes the adaptation of cells to the local environment. The adaptation is proportional to the fraction of cells that are not adapted, i.e. , and occurs at a rate that is proportional to the inverse of the adaptation time . Since we start from a demixed state, the initial conditions are and the boundary conditions are at all times.
As derived in the Supplementary Information, the control parameter for the dynamics of the continuum model is the ratio . Since and , then , which is the ratio between the diffusion and adaptation time scales. We define , where is a prefactor that depends on the geometry of the substrate and the value of the shape index on both sides. Asymptotically, converges to a stationary state ,
| (7) |
where . As shown in Fig. 3(a), this analytical solution (solid lines) is in qualitative and quantitative agreement with the numerical results for the self-propelled Voronoi model, where we set for all curves, obtained by a fit using the least squares method.
To compute the demixing parameter from the profile in the stationary state, , we consider a mean-field approach, where the probability that two neighboring cells are in the same state is and so , which gives,
| (8) |
This solution is the solid line in Fig. 2(b), which is in quantitative agreement with the numerical results.
The numerical and analytical results suggest that the fidelity of a patterned substrate in the control of the morphology of a tissue is significantly dependent on the ratio between the diffusion and the adaptation time. Ideally, full control would imply . The lower is the value of , the less efficient is the use of a pattern. Let us define such that a tissue with is considered mixed. Since increases monotonically with (see Fig. 2(b)), we take the limit of vanishing and . From a Taylor expansion about , we obtain . Thus, there is a minimum length,
| (9) |
below which the cells in the tissue are mixed, which sets a lower bound for the size of the patterns.
So far, we considered a pair of target shape indices such that both sides are in a fluid-like state. We study now the solid-fluid case, by setting and (as before). Figure 4(a) shows the time dependence of the demixing parameter for the side , , and both sides. Different from the fluid-fluid case, where the time dependence of was similar for both sides, here we observe that vanishes for the liquid-like side, whereas in the solid-like side it saturates at . This break of symmetry is observed for a wide range of parameters, as seen in Fig. 4(b) from the dependence of the value of on the left- and right-hand sides on , where is the one for the liquid-like state. For all values of the demixing parameter is higher in the solid-like state than in the liquid one. This asymmetry stems from the difference in the effective value of the diffusion coefficient in both sides. For the solid-like state, and thus adaptation is much faster than diffusion. Cells have enough time to adapt to the new target shape index, which yields a high value of that does not depend strongly on (see also snapshot for different values of in Fig. 2(c)). By contrast, for the liquid-like state, the value of strongly depends on the value of as in the liquid-liquid case, see Fig. 2. In fact, the dependence of on in Fig. 4 for the liquid-like side is well described by Eq. (8), solid curve in Fig. 4(b) (further results for different substrates are discussed in the Supplementary Information).
IV Conclusion
We included the adaptation time of cells to external stimuli in a minimal model for confluent tissues. We found that the use of patterned substrates to regulate the tissue properties is compromised significantly when the adaptation time competes with the cell diffusion time. The latter depends on the characteristic length of the pattern . From a continuum description based on a reaction-diffusion equation, we derived an analytic expression for the minimum length for the pattern to be effective. For , cells have enough time to adapt to the local cell-substrate interaction and the heterogeneous distribution of cell shapes reproduces the symmetries of the pattern, with a clear segregation by shape index. By contrast, for , cells do not fully adapt to the local cell-substrate interaction and their shape index depends on their individual trajectories.
For inorganic materials, the goal has been to reduce the length scale of the patterns and achieve a control at the level of an individual particle Cadilhe et al. (2007); Araújo et al. (2008). By contrast, in the case of cell tissues, we show that the relevant length scale is set by the dynamics. Experimentally, it was shown that cells cultured on a shape memory polymer substrate take about hours to adapt to changes in the structure of the substrate Ebara et al. (2014). If we consider a typical diffusion coefficient of a cell in a confluent tissue of Park et al. (2015), from Eq. (9), we obtain that , which is roughly four times the size of a single cell.
We considered a simple pattern but, it is straightforward to extend the conclusions to other patterns. In fact, the competition between diffusion and adaptation is so general that it should apply even to heterogeneous random substrates. These substrates are usually characterized by a correlation length that plays the role of . So, only for , cells are expected to segregate based on their shape index, as defined by the local properties of the substrate.
The identification of the mechanisms responsible for the emergence of spatial cell patterns in a developing organism has been a subject of intensive research and discussion over the years Steinberg (1963); Manning et al. (2010); Mertz et al. (2012); Maître et al. (2012). A recent study combines theory and experiments to show that cell sorting and compartmentalization in living organisms might be driven by surface tension due to differential adhesion Sahu et al. (2020). However, the use of cell mixtures in vitro encompasses multiple challenges, which include the lack of control over the spatial distribution of cell types. We have shown that, above a certain length scale, the spatial distribution of cell properties can be controlled by the substrate pattern.
For simplicity, we assumed that the cell-cell and cell-substrate interactions depend on the substrate but not on the cell itself. A recent study shows that a broad distribution of the shape index of cells affects the tissue rigidity and, consequently, the cell diffusion coefficient Li et al. (2019). Understanding the role of cell heterogeneities in the adapation time is a question of interest for future studies.
V Methods
To simulate the confluent tissue, we used a recently developed hybrid CPU/GPU software package, cellGPU (Sussman, 2017), for the self-propelled Voronoi model. The equations of motion (1) are integrated using the Euler method, with a time step of . We impose periodic boundary conditions, , , and , the latter to guarantee that fluctuations in the cell area are negligible when compared to the ones in the perimeter. For the considered set of parameters, the rigidity transition occurs for Bi et al. (2016). To generate the initial configuration, we generate positions at random and let the system relax over time steps, with for all cells. Then, we set for the cells in the left- and for the ones in the right-hand side of the substrate.
VI Acknowledgments
The authors acknowledge financial support from the Portuguese Foundation for Science and Technology (FCT) under Contracts no. PTDC/FIS-MAC/28146/2017 (LISBOA-01-0145-FEDER-028146), UIDB/00618/2020, UIDP/00618/2020 and SFRH/BD/131158/2017. MLM and GET acknowledge support from the Simons Foundation (#446222) and from NSF-DMR-1352184 (MLM).
VII Supplementary Information
VII.1 Reduced units
If we rescale energy in units of , the energy functional given by Eq. (3) is,
| (10) |
where , and are the area and perimeter of cell in adimensional units, is the shape index, and the ratio sets the ratio between the area and the perimeter moduli.
VII.2 Influence of on the results
In Eq. (2), the definition of alike cells depends on a threshold , which we fixed at . In practice, the value of these will depend on the experimental resolution to segregate cells by their type. Here, we study the dependence on .
Figure 5 shows the time dependence of the demixing parameter for different values of for the fluid-fluid case as in the main paper. The larger is the value of , the more cells are considered to be alike and therefore, the value of is larger. To compare results for different values of , we compute the time that takes for a cell to adapt to a new target shape index, within a threshold . If the time evolution of the shape index is given by Eq. (4),
| (11) |
where is the change in shape index. In the inset of Fig. 5 we show that a data collapse is obtained for a wide range of values of (three orders of magnitude), if we plot as a function of .
VII.3 Time dependent solution for the continuum model
To solve Eq. (6), we define a characteristic length and time , respectively, and introduce two adimensional variables,
| (12) |
Using the chain rule, we get the following identities,
| (13) |
By replacing them in Eq. (6), we obtain,
| (14) |
where . The initial and boundary conditions are then,
| (15) | |||
| (16) |
In the results section, we present the stationary state solution obtained by setting . Here, to derive the time dependent solution, we define,
| (17) |
Substituting in Eq. (14) gives,
| (18) |
and the boundary conditions are now,
| (19) | |||
| (20) |
This set of equations is solved by separation of variables, , which gives,
| (21) |
Imposing the initial and boundary conditions, we obtain,
| (22) |
which, in the limit gives the stationary solution in the main paper.
VII.4 Dependence on
As discussed in the main text, the properties of the tissue on each side of the substrate depend, not only on the target shape index of that side but also on the target value on the other side. Here, we explore the dependence on , defined as the difference in the target shape indices of both sides. For simplicity, we fix and change .
Figure 6 shows the time dependence of the demixing parameter for different values of . For all values, initially decreases and saturates asymptotically. In the inset, we plot the asymptotic value of as a function of , which reveals a non-monotonic behavior. From Eq. 11, we see that the time it takes for a cell to fully adapt to the new side depends on both and . So, for vanishing , cells crossing sides swiftly adapt to the local target shape index, leading to an increase in .
References
- Lo et al. (2000) C.-M. Lo, H.-B. Wang, M. Dembo, and Y.-L. Wang, “Cell movement is guided by the rigidity of the substrate,” Byophys. J. 79, 144 (2000).
- Griffith and Naughton (2002) L. G. Griffith and G. Naughton, “Tissue engineering—current challenges and expanding opportunities,” Science 295, 1009 (2002).
- Rabodzey et al. (2008) A. Rabodzey, P. Alcaide, F. W. Luscinskas, and B. Ladoux, “Mechanical forces induced by the transendothelial migration of human neutrophils,” Biophys. J. 95, 1428 (2008).
- Tambe et al. (2011) D. T. Tambe, C. C. Hardin, T. E. Angelini, K. Rajendran, C. Y. Park, X. Serra-Picamal, E. H. Zhou, M. H. Zaman, J. P. Butler, D. A. Weitz, J. J. Fredberg, and X. Trepat, “Collective cell guidance by cooperative intercellular forces,” Nat. Mater. 10, 469 (2011).
- Park et al. (2015) J.-A. Park, J. H. Kim, D. Bi, J. A. Mitchel, N. T. Qazvini, K. Tantisira, C. Y. Park, M. McGill, S.-H. Kim, B. Gweon, J. Notbohm, R. S. Jr, S. Burger, S. H. Randell, A. T. Kho, D. T. Tambe, C. Hardin, S. A. Shore, E. Israel, D. A. Weitz, D. J. Tschumperlin, E. P. Henske, S. T. Weiss, M. L. Manning, J. P. Butler, J. M. Drazen, and J. J. Fredberg, “Unjamming and cell shape in the asthmatic airway epithelium,” Nat. Mater. 14, 1040 (2015).
- Discher et al. (2005) D. E. Discher, P. Janmey, and Y. Wang, “Tissue cells feel and respond to the stiffness of their substrate,” Science 310, 1139 (2005).
- Guo et al. (2006) W. Guo, M. T. Frey, N. A. Burnham, and Y. Wang, “Substrate rigidity regulates the formation and maintenance of tissues,” Biophys. J. 90, 2213 (2006).
- Neuss et al. (2009) S. Neuss, I. Blomenkamp, R. Stainforth, D. Boltersdorf, M. Jansen, N. Butz, A. Perez-Bouza, and R. Knüchel, “The use of a shape-memory poly(-caprolactone)dimethacrylate network as a tissue engineering scaffold,” Biomaterials 30, 1697 (2009).
- Murrell et al. (2011) M. Murrell, R. Kamm, and P. Matsudaira, “Substrate viscosity enhances correlation in epithelial sheet movement,” Biophys. J. 101, 297 (2011).
- Song and Mano (2013) W. Song and J. F. Mano, “Interactions between cells or proteins and surfaces exhibiting extreme wettabilities,” Soft Matter 9, 2985 (2013).
- Sunyer et al. (2016) R. Sunyer, V. Conte, J. Escribano, A. Elosegui-Artola, A. Labernadie, L. Valon, D. Navajas, J. M. García-Aznar, J. J. Muñoz, P. Roca-Cusachs, and X. Trepat, “Collective cell durotaxis emerges from long-range intercellular force transmission,” Science 353, 1157 (2016).
- Janmey et al. (2020) P. A. Janmey, D. A. Fletcher, and C. A. Reinhart-King, “Stiffness sensing by cells,” Physiol. Rev. 100, 695 (2020).
- Yeung et al. (2005) T. Yeung, P. C. Georges, L. A. Flanagan, B. Marg, M. Ortiz, M. Funaki, N. Zahir, W. Ming, V. Weaver, and P. A. Janmey, “Effects of substrate stiffness on cell morphology, cytoskeletal structure, and adhesion,” Cytoskeleton 60, 24 (2005).
- Guo et al. (2017) M. Guo, A. F. Pegoraro, A. Mao, E. H. Zhou, P. R. Arany, Y. Han, D. T. Burnette, M. H. Jensen, K. E. Kasza, J. R. Moore, F. C. Mackintosh, J. J. Fredberg, D. J. Mooney, J. Lippincott-Schwartz, and D. A. Weitz, “Cell volume change through water efflux impacts cell stiffness and stem cell fate,” PNAS 114, E8618 (2017).
- Devany et al. (2019) J. Devany, D. M. Sussman, M. L. Manning, and M. L. Gardel, “Cell division rate controls cell shape remodeling in epithelia,” bioRxiv (2019).
- Davis et al. (2011) K. A. Davis, K. A. Burke, P. T. Mather, and J. H. Henderson, “Dynamic cell behavior on shape memory polymer substrates,” Biomaterials 32, 2285 (2011).
- Tseng et al. (2013) L.-F. Tseng, P. T. Mather, and J. H. Henderson, “Shape-memory-actuated change in scaffold fiber alignment directs stem cell morphology,” Acta Biomater. 9, 8790 (2013).
- Jeon et al. (2015) H. Jeon, S. Koo, W. M. Reese, P. Loskill, C. P. Grigoropoulos, and K. E. Healy, “Directing cell migration and organization via nanocrater-patterned cell-repellent interfaces,” Nat. Mater. 14, 918 (2015).
- Mengsteab et al. (2016) P. Y. Mengsteab, K. Uto, A. S. T. Smith, S. Frankel, E. Fisher, Z. Nawas, J. Macadangdang, M. Ebara, and D.-H. Kim, “Spatiotemporal control of cardiac anisotropy using dynamic nanotopographic cues,” Biomaterials 86, 1 (2016).
- Nelson et al. (2005) C. M. Nelson, R. P. Jean, J. L. Tan, W. F. Liu, N. J. Sniadecki, A. A. Spector, and C. S. Chen, “Emergent patterns of growth controlled by multicellular form and mechanics,” PNAS 102, 11594 (2005).
- Richert et al. (2008) L. Richert, F. Vetrone, J. Yi, S. F. Zalzal, J. D. Wuest, F. Rosei, and A. Nanci, “Surface nanopatterning to control cell growth,” Adv. Mater. 20, 1488 (2008).
- Horejs (2018) C. Horejs, “A fluid state of mind,” Nat. Rev. Mater. 3, 256 (2018).
- Pérez-Gonzáles et al. (2018) C. Pérez-Gonzáles, R. Alert, C. Blanch-Mercander, M. Gómez-González, T. Kolodziej, E. Bazellieres, J. Casademunt, and X. Trepat, “Active wetting of epithelial tissues,” Nat. Phys. 15, 79 (2018).
- Brasch et al. (2019) M. E. Brasch, G. Passucci, A. C. Gulvady, C. E. Turner, M. L. Manning, and J. H. Henderson, “Nuclear position relative to the golgi body and nuclear orientation are differentially responsive indicators of cell polarized motility,” PLOS One 14, 1 (2019).
- Steinberg (1963) M. S. Steinberg, “Reconstruction of tissues by dissociated cells,” Science 141, 401 (1963).
- Harris (1976) A. K. Harris, “Is cell sorting caused by differences in the work of intercellular adhesion? a critique of the steinberg hypothesis,” J. Theor. Biol 61, 267 (1976).
- Brodland (2002) G. W. Brodland, “The differential interfacial tension hypothesis (dith): A comprehensive theory for the self-rearrangement of embryonic cells and tissues,” J. Biomech. Eng. 124, 188 (2002).
- Foty and Steinberg (2005) R. A. Foty and M. S. Steinberg, “The differential adhesion hypothesis: a direct evaluation,” Dev. Biol. 278, 255 (2005).
- Amack and Manning (2012) J. D. Amack and M. L. Manning, “Knowing the boundaries: Extending the differential adhesion hypothesis in embryonic cell sorting,” Science 338, 212 (2012).
- Maître et al. (2012) J.-L. Maître, H. Berthoumieux, S. F. G. Krens, G. Salbreux, F. Jülicher, E. Paluch, and C.-P. Heisenberg, “Adhesion functions in cell sorting by mechanically coupling the cortices of adhering cells,” Science 338, 253 (2012).
- Krieg et al. (2008) M. Krieg, Y. Arboleda-Estudillo, P.-H. Puech, J. Käfer, F. Graner, D. J. Müller, and C.-P. Heisenberg, “Tensile forces govern germ-layer organization in zebrafish,” Nat. Cell Biol. 10, 429 (2008).
- Manning et al. (2010) M. L. Manning, R. A. Foty, M. S. Steinberg, and E.-M. Schoetz, “Coaction of intercellular adhesion and cortical tension specifies tissue surface tension,” PNAS 107, 12517 (2010).
- Sussman et al. (2018) D. M. Sussman, J. M. Schwarz, M. C. Marchetti, and M. L. Manning, “Soft yet sharp interfaces in a vertex model of confluent tissue,” Phys. Rev. Lett. 120, 058001 (2018).
- Sahu et al. (2020) P. Sahu, D. M. Sussman, M. Rübsam, A. F. Mertz, V. Horsley, E. R. Dufresne, C. M. Niessen, M. C. Marchetti, M. L. Manning, and J. M. Schwarz, “Small-scale demixing in confluent biological tissues,” Soft Matter 16, 3325 (2020).
- Kumacheva et al. (2002) E. Kumacheva, R. K. Golding, M. Allard, and E. H. Sargent, “Colloid crystal growth on mesoscopically patterned surfaces: Effect of confinement,” Adv. Matter 14, 221 (2002).
- Fustin et al. (2003) C.-A. Fustin, G. Glasser, H. W. Spiess, and U. Jonas, “Site-selective growth of colloidal crystals with photonic properties on chemically patterned surfaces,” Adv. Matter 15, 1025 (2003).
- Dziomkina and Vancso (2005) N. V. Dziomkina and G. J. Vancso, “Colloidal crystal assembly on topologically patterned templates,” Soft Matter 1, 265–279 (2005).
- Cadilhe et al. (2007) A. Cadilhe, N. A. M. Araújo, and Vladimir Privman, “Random sequential adsorption: From continuum to lattice and pre-patterned substrates,” J. of Phys.: Condens. Matter 19, 065124 (2007).
- Ebara (2015) M. Ebara, “Shape-memory surfaces for cell mechanobiology,” Sci. Technol. Adv. Mater 16, 014804 (2015).
- Bi et al. (2016) D. Bi, X. Yang, M. C. Marchetti, and M. L. Manning, “Motility-driven glass and jamming transitions in biological tissues,” Phys. Rev. X 6, 021011 (2016).
- Bi et al. (2014) D. Bi, J. H. Lopez, J. M. Schwarz, and M. L. Manning, “Energy barriers and cell migration in densely packed tissues,” Soft Matter 10, 1885 (2014).
- Bi et al. (2015) D. Bi, J. H. Lopez, J. M. Schwarz, and M. L. Manning, “A density-independent rigidity transition in biological tissues,” Nat. Phys. 11, 1074 (2015).
- Farhadifar et al. (2007) R. Farhadifar, J.-C. Röper, B. Aigouy, S. Eaton, and F. Jü, “The influence of cell mechanics, cell-cell interactions, and proliferation on epithelial packing,” Curr. Biol. 17, 2095 (2007).
- Fletcher et al. (2014) A. G. Fletcher, M. Osterfield, R. E. Baker, and S. Y. Shvartsman, “Vertex models of epithelial morphogenesis,” Biophys. J. 106, 2291 (2014).
- Merkel et al. (2019) M. Merkel, K. Baumgarten, B. P. Tighe, and M. L. Manning, “A minimal-length approach unifies rigidity in underconstrained materials,” PNAS 116, 6560 (2019).
- Araújo et al. (2008) N. A. M. Araújo, A. Cadilhe, and V. Privman, “Morphology of fine-particle monolayers deposited on nanopatterned substrates,” Phys. Rev. E 77, 031603 (2008).
- Ebara et al. (2014) M. Ebara, K. Uto, N. Idota, J. Hoffman, and T. Aoyagi, “The taming of the cell: shape-memory nanopatterns direct cell orientation,” Int. J. Nanomed 9, 117 (2014).
- Mertz et al. (2012) A. F. Mertz, S. Banerjee, Y. Che, G. K. German, Y. Xu, C. Hyland, M. C. Marchetti, V. Horsley, and E. R. Dufresne, “Scaling of traction forces with the size of cohesive cell colonies,” Phys. Rev. Lett. 108, 198101 (2012).
- Li et al. (2019) X. Li, A. Das, and D. Bi, “Mechanical heterogeneity in tissues promotes rigidity and controls cellular invasion,” Phys. Rev. Lett. 123, 058101 (2019).
- Sussman (2017) D. M. Sussman, “cellgpu: Massively parallel simulations of dynamic vertex models,” Comput. Phys. Commun. 219, 400 (2017).