J. P. Lees
V. Poireau
V. Tisserand
Laboratoire d’Annecy-le-Vieux de Physique des Particules (LAPP), Université de Savoie, CNRS/IN2P3, F-74941 Annecy-Le-Vieux, France
E. Grauges
Universitat de Barcelona, Facultat de Fisica, Departament ECM, E-08028 Barcelona, Spain
A. Palano
INFN Sezione di Bari and Dipartimento di Fisica, Università di Bari, I-70126 Bari, Italy
G. Eigen
University of Bergen, Institute of Physics, N-5007 Bergen, Norway
D. N. Brown
Yu. G. Kolomensky
Lawrence Berkeley National Laboratory and University of California, Berkeley, California 94720, USA
M. Fritsch
H. Koch
T. Schroeder
Ruhr Universität Bochum, Institut für Experimentalphysik 1, D-44780 Bochum, Germany
R. CheaibbC. HeartyabT. S. MattisonbJ. A. McKennabR. Y. SobInstitute of Particle Physics; University of British Columbiab, Vancouver, British Columbia, Canada V6T 1Z1
V. E. BlinovabcA. R. BuzykaevaV. P. DruzhininabV. B. GolubevabE. A. KozyrevabE. A. KravchenkoabA. P. OnuchinabcS. I. SerednyakovabYu. I. SkovpenabE. P. SolodovabK. Yu. TodyshevabBudker Institute of Nuclear Physics SB RAS, Novosibirsk 630090a, Novosibirsk State University, Novosibirsk 630090b, Novosibirsk State Technical University, Novosibirsk 630092c, Russia
A. J. Lankford
University of California at Irvine, Irvine, California 92697, USA
B. Dey
J. W. Gary
O. Long
University of California at Riverside, Riverside, California 92521, USA
A. M. Eisner
W. S. Lockman
W. Panduro Vazquez
University of California at Santa Cruz, Institute for Particle Physics, Santa Cruz, California 95064, USA
D. S. Chao
C. H. Cheng
B. Echenard
K. T. Flood
D. G. Hitlin
J. Kim
Y. Li
D. X. Lin
T. S. Miyashita
P. Ongmongkolkul
J. Oyang
F. C. Porter
M. Röhrken
California Institute of Technology, Pasadena, California 91125, USA
Z. Huard
B. T. Meadows
B. G. Pushpawela
M. D. Sokoloff
L. Sun
Now at: Wuhan University, Wuhan 430072, China
University of Cincinnati, Cincinnati, Ohio 45221, USA
J. G. Smith
S. R. Wagner
University of Colorado, Boulder, Colorado 80309, USA
D. Bernard
M. Verderi
Laboratoire Leprince-Ringuet, Ecole Polytechnique, CNRS/IN2P3, F-91128 Palaiseau, France
D. BettoniaC. BozziaR. CalabreseabG. CibinettoabE. FioravantiabI. GarziaabE. LuppiabV. SantoroaINFN Sezione di Ferraraa; Dipartimento di Fisica e Scienze della Terra, Università di Ferrarab, I-44122 Ferrara, Italy
A. Calcaterra
R. de Sangro
G. Finocchiaro
S. Martellotti
P. Patteri
I. M. Peruzzi
M. Piccolo
M. Rotondo
A. Zallo
INFN Laboratori Nazionali di Frascati, I-00044 Frascati, Italy
S. Passaggio
C. Patrignani
Now at: Università di Bologna and INFN Sezione di Bologna, I-47921 Rimini, Italy
INFN Sezione di Genova, I-16146 Genova, Italy
B. J. Shuve
Harvey Mudd College, Claremont, California 91711, USA
H. M. Lacker
Humboldt-Universität zu Berlin, Institut für Physik, D-12489 Berlin, Germany
B. Bhuyan
Indian Institute of Technology Guwahati, Guwahati, Assam, 781 039, India
U. Mallik
University of Iowa, Iowa City, Iowa 52242, USA
C. Chen
J. Cochran
S. Prell
Iowa State University, Ames, Iowa 50011, USA
A. V. Gritsan
Johns Hopkins University, Baltimore, Maryland 21218, USA
N. Arnaud
M. Davier
F. Le Diberder
A. M. Lutz
G. Wormser
Université Paris-Saclay, CNRS/IN2P3, IJCLab, F-91405 Orsay, France
D. J. Lange
D. M. Wright
Lawrence Livermore National Laboratory, Livermore, California 94550, USA
J. P. Coleman
E. Gabathuler
D. E. Hutchcroft
D. J. Payne
C. Touramanis
University of Liverpool, Liverpool L69 7ZE, United Kingdom
A. J. Bevan
F. Di Lodovico
Now at: King’s College, London, WC2R 2LS, UK
R. Sacco
Queen Mary, University of London, London, E1 4NS, United Kingdom
G. Cowan
University of London, Royal Holloway and Bedford New College, Egham, Surrey TW20 0EX, United Kingdom
Sw. Banerjee
D. N. Brown
C. L. Davis
University of Louisville, Louisville, Kentucky 40292, USA
A. G. Denig
W. Gradl
K. Griessinger
A. Hafner
K. R. Schubert
Johannes Gutenberg-Universität Mainz, Institut für Kernphysik, D-55099 Mainz, Germany
R. J. Barlow
Now at: University of Huddersfield, Huddersfield HD1 3DH, UK
G. D. Lafferty
University of Manchester, Manchester M13 9PL, United Kingdom
R. Cenci
A. Jawahery
D. A. Roberts
University of Maryland, College Park, Maryland 20742, USA
R. Cowan
Massachusetts Institute of Technology, Laboratory for Nuclear Science, Cambridge, Massachusetts 02139, USA
S. H. RobertsonabR. M. SeddonbInstitute of Particle Physics; McGill Universityb, Montréal, Québec, Canada H3A 2T8
N. NeriaF. PalomboabINFN Sezione di Milanoa; Dipartimento di Fisica, Università di Milanob, I-20133 Milano, Italy
L. Cremaldi
R. Godang
Now at: University of South Alabama, Mobile, Alabama 36688, USA
D. J. Summers
University of Mississippi, University, Mississippi 38677, USA
P. Taras
Université de Montréal, Physique des Particules, Montréal, Québec, Canada H3C 3J7
G. De Nardo
C. Sciacca
INFN Sezione di Napoli and Dipartimento di Scienze Fisiche, Università di Napoli Federico II, I-80126 Napoli, Italy
G. Raven
NIKHEF, National Institute for Nuclear Physics and High Energy Physics, NL-1009 DB Amsterdam, The Netherlands
C. P. Jessop
J. M. LoSecco
University of Notre Dame, Notre Dame, Indiana 46556, USA
K. Honscheid
R. Kass
Ohio State University, Columbus, Ohio 43210, USA
A. GazaM. MargoniabM. PosoccoaG. SimiabF. SimonettoabR. StroiliabINFN Sezione di Padovaa; Dipartimento di Fisica, Università di Padovab, I-35131 Padova, Italy
S. Akar
E. Ben-Haim
M. Bomben
G. R. Bonneaud
G. Calderini
J. Chauveau
G. Marchiori
J. Ocariz
Laboratoire de Physique Nucléaire et de Hautes Energies,
Sorbonne Université, Paris Diderot Sorbonne Paris Cité, CNRS/IN2P3, F-75252 Paris, France
M. BiasiniabE. ManoniaA. RossiaINFN Sezione di Perugiaa; Dipartimento di Fisica, Università di Perugiab, I-06123 Perugia, Italy
G. BatignaniabS. BettariniabM. CarpinelliabAlso at: Università di Sassari, I-07100 Sassari, Italy
G. CasarosaabM. ChrzaszczaF. FortiabM. A. GiorgiabA. LusianiacB. OberhofabE. PaoloniabM. RamaaG. RizzoabJ. J. WalshaL. ZaniabINFN Sezione di Pisaa; Dipartimento di Fisica, Università di Pisab; Scuola Normale Superiore di Pisac, I-56127 Pisa, Italy
A. J. S. Smith
Princeton University, Princeton, New Jersey 08544, USA
F. AnulliaR. FacciniabF. FerrarottoaF. FerroniaAlso at: Gran Sasso Science Institute, I-67100 L’Aquila, Italy
A. PilloniabG. PireddaaINFN Sezione di Romaa; Dipartimento di Fisica, Università di Roma La Sapienzab, I-00185 Roma, Italy
C. Bünger
S. Dittrich
O. Grünberg
M. Heß
T. Leddig
C. Voß
R. Waldi
Universität Rostock, D-18051 Rostock, Germany
T. Adye
F. F. Wilson
Rutherford Appleton Laboratory, Chilton, Didcot, Oxon, OX11 0QX, United Kingdom
S. Emery
G. Vasseur
IRFU, CEA, Université Paris-Saclay, F-91191 Gif-sur-Yvette, France
D. Aston
C. Cartaro
M. R. Convery
J. Dorfan
W. Dunwoodie
M. Ebert
R. C. Field
B. G. Fulsom
M. T. Graham
C. Hast
W. R. Innes
P. Kim
D. W. G. S. Leith
S. Luitz
D. B. MacFarlane
D. R. Muller
H. Neal
B. N. Ratcliff
A. Roodman
M. K. Sullivan
J. Va’vra
W. J. Wisniewski
SLAC National Accelerator Laboratory, Stanford, California 94309 USA
M. V. Purohit
J. R. Wilson
University of South Carolina, Columbia, South Carolina 29208, USA
A. Randle-Conde
S. J. Sekula
Southern Methodist University, Dallas, Texas 75275, USA
H. Ahmed
St. Francis Xavier University, Antigonish, Nova Scotia, Canada B2G 2W5
M. Bellis
P. R. Burchat
E. M. T. Puccio
Stanford University, Stanford, California 94305, USA
M. S. Alam
J. A. Ernst
State University of New York, Albany, New York 12222, USA
R. Gorodeisky
N. Guttman
D. R. Peimer
A. Soffer
Tel Aviv University, School of Physics and Astronomy, Tel Aviv, 69978, Israel
S. M. Spanier
University of Tennessee, Knoxville, Tennessee 37996, USA
J. L. Ritchie
R. F. Schwitters
University of Texas at Austin, Austin, Texas 78712, USA
J. M. Izen
X. C. Lou
University of Texas at Dallas, Richardson, Texas 75083, USA
F. BianchiabF. De MoriabA. FilippiaD. GambaabINFN Sezione di Torinoa; Dipartimento di Fisica, Università di Torinob, I-10125 Torino, Italy
L. Lanceri
L. Vitale
INFN Sezione di Trieste and Dipartimento di Fisica, Università di Trieste, I-34127 Trieste, Italy
F. Martinez-Vidal
A. Oyanguren
IFIC, Universitat de Valencia-CSIC, E-46071 Valencia, Spain
J. AlbertbA. BeaulieubF. U. BernlochnerbG. J. KingbR. KowalewskibT. LueckbI. M. NugentbJ. M. RoneybA. SibidanovbR. J. SobieabN. TasneembInstitute of Particle Physics; University of Victoriab, Victoria, British Columbia, Canada V8W 3P6
T. J. Gershon
P. F. Harrison
T. E. Latham
Department of Physics, University of Warwick, Coventry CV4 7AL, United Kingdom
R. Prepost
S. L. Wu
University of Wisconsin, Madison, Wisconsin 53706, USA
Abstract
We report on a precision measurement of the ratio
using data collected with the BABAR detector at the SLAC PEP-II
collider. The measurement is based on a
data sample collected at a center-of-mass
energy of corresponding to a sample
of 122 million mesons. The ratio is measured to be
and is in
agreement with the Standard Model prediction of 0.9948 within 2
standard deviations. The uncertainty in is almost an order of
magnitude smaller than the only previous measurement.
The BABAR Collaboration
In the Standard Model (SM) the width of a spin 1 bound state of a
quark and antiquark decaying into a charged lepton-antilepton pair in
the absence of radiation effects has been known since the model’s
inception VanRoyen:1967nq to be:
where is the decay width to two leptons of
flavor (e.g., muon or lepton), is the fine
structure constant, is the quark charge, is the value
of the radial wave function evaluated at the origin, is the
resonance mass, and is the lepton mass. The ratio of widths
to final-state leptons with different flavor is free of hadronic
uncertainties, and for heavy spin 1 resonances, such as the family of
the bound states mesons, differs from unity
only by a small mass correction. Consequently, leptonic decays of the
mesons are good candidates to test SM predictions and
to search for phenomena beyond the SM. For example, the CP-odd Higgs
boson proposed in Ref. SanchisLozano:2003ha couples more
strongly to heavier fermions. This would introduce the decay chain with a rate
substantially higher than that of the chain and result in a larger value of the ratio
than
predicted in the SM. The only measurement to date of that ratio was
made by the CLEO collaboration, Besson:2006gj . It has also been
remarked Aloni:2017eny that measuring this ratio could shed
light on the suggestion for new physics seen in Amhis:2016xyh . A new precise measurement will further
constrain new physics models.
In this Letter we present a precision measurement of the ratio using a novel technique to discriminate between resonant and
non-resonant (i.e., continuum) dimuon production based on differences
in the dimuon mass distributions associated with initial state
radiation (ISR). In the resonant process, , ISR is heavily suppressed compared to the non-resonant,
, process. Details of how we estimate the
non- contribution to the dimuon sample using this
technique are described below. We account for the number of
non-resonant events using information from the
continuum values of the number of dimuons together with the ratio of
the selected number of to events in the
data control sample, corrected for center-of-mass
dependent phase-space effects. This method ensures that the measured
ratio is fully inclusive of radiation effects and does not require a
precise luminosity determination.
The data samples used for these studies were collected with the
BABAR detector at the PEP-II asymmetric-energy collider at
the SLAC National Accelerator Laboratory. The BABAR experiment
collected data between 1999 and 2008 at center-of-mass energies of the
, , and resonances, as well
as at nonresonant energies. The PEP-II positron beam energy was
, while the electron beam energy was at
the and at the , resulting
in different boosts of the final-state system and different detector
acceptances in the center-of-mass frame. We measure the ratio
using a sample of 122 million
decays corresponding to an integrated luminosity of
lumi collected at
during 2008 (referred to as Run 7), where is the
center-of-mass energy. We also employ three data control samples:
data collected at the in 2007 (referred to as Run 6)
corresponding to , data taken
below the resonance (termed “off-resonance”)
corresponding to , and data taken
below the resonance corresponding to
. All data used in this analysis were
collected with the same detector configuration after the last major
upgrade in 2007. These data control samples are used to evaluate
properties of the background, to study systematic effects, and to
calculate corrections to Monte Carlo (MC) based efficiencies. We
employ a blind analysis ref:blindanalysis in which only a small
subset of of the total
sample is used in the pre-unblinding stage during which selection
criteria are optimized.
BABAR was a general purpose detector and is described in detail
elsewhere ref:aubert ; ref:NIMUpdate . Its magnetic spectrometer,
used to measure momenta of charged particles, comprised a 5-layer
silicon vertex tracker (SVT) surrounded by a 40-layer cylindrical
drift chamber (DCH) placed inside a superconducting
solenoid with its axis aligned nearly parallel to the beams.
Charged hadron identification was performed by using ionization
measurements in the SVT and DCH and by using a ring-imaging Cherenkov
detector (DIRC), which formed a cylinder surrounding the DCH. The
BABAR electromagnetic calorimeter (EMC), composed of an array of
6580 CsI(Tl) crystals located between the DIRC and the solenoid, was
used to measure energies and directions of photons as well as to
identify electrons. Muons and neutral hadrons were identified by
arrays of resistive plate chambers or limited steamer-tube detectors
inserted into gaps in the steel of the Instrumented Flux Return (IFR)
of the magnet. An upgrade of the IFR was completed in 2007 prior to
Run 6.
The major irreducible background process is continuum dilepton
production. The KKMC event generator ref:ward is used to
simulate continuum and production taking
into account radiative effects. For the Bhabha process the
BHWIDEref:BHWIDE event generator is employed. The EvtGen generator ref:lange is used to simulate hadronic continuum
events and generic decays, with the final-state
radiation effects modeled by means of the PHOTOS package photos . The simulated , , and
generic samples correspond to roughly twice the number
of events in the dataset, while the Bhabha sample
corresponds to roughly half the number of events. In addition, the
and signal
decays are simulated using the KKMC generator with ISR turned off.
Thus the same MC generator, KKMC, is employed for both the signal and
continuum, which enables a consistent evaluation of the corrections to
the discrepancies between data and MC. This signal MC sample is about
three times the size of the data sample. Particle interactions with
the detector and its response are modeled within the GEANT4 framework ref:agostine .
As mentioned above, the selection criteria are developed using a
subsample (approximately
one-tenth of the total data) to avoid possible biases. The dimuon
candidate requires two and only two reconstructed high momentum
collinear () charged particles in the center-of-mass
frame with opposite charges and with associated energy depositions in
the EMC consistent with the muon hypothesis. We apply a polar angle
selection of
and
, where
and are polar angles in the center-of-mass
frame of negative and positive muon candidates respectively. This
selection provides the same efficiency at the borders of the sensitive
volume for different boost values at different energies in the
laboratory frame. Misidentified Bhabha events are additionally
suppressed with a requirement that at least one of the muon candidates
in an event has a response in the IFR. The scaled invariant mass
of the two muons must be in the range
. These selection criteria provide a
dimuon sample with 99.9% purity, according to MC studies.
We consider -pairs where both taus have a single charged
particle in their decay, where one of the charged particles is an
electron and the other is not an electron. The
candidate selection proceeds by requiring two and only two
reconstructed tracks with opposite charges in the event. One of the
tracks is required to be identified as an electron based on energy
deposition in the tracking system and EMC, whereas the other track
must fail the same electron selection requirements. Backgrounds are
further suppressed by requiring the angle between the two tracks to be
greater than in the center-of-mass frame. The total
energy registered in the EMC must be less than of
the initial energy in the laboratory frame. The
acollinearity between the two tracks in the azimuthal plane must be
greater than . The missing mass, ,
which is based on the two tracks and up to the ten most energetic
clusters in the EMC identified as photons, must satisfy the
requirement that . The missing momentum
vector must point to the sensitive part of the detector, defined as
in the center-of-mass frame. To
further suppress the Bhabha background, the acollinearity angle
between the non-electron track and the combination of the identified
electron track and the most energetic photon must be greater than
in both azimuthal and polar angles in the
center-of-mass frame.
A large fraction of the background comes from two-photon processes
where tracks have low transverse momenta. Since this region is also
populated by the signal events, a two-dimensional cut
on the transverse momentum of the positive lepton that of the
negative lepton is developed to remove the background and maintain an
acceptable efficiency for the signal events. These selection criteria
provide a sample with 99% purity, according to MC
studies.
The off-resonance and
off-resonance samples are
used to correct for differences between MC and data
selection efficiency ratios. For the
experimental data and their corresponding MC samples, the number of
dilepton candidates (MC scaled to the data luminosity) and
corresponding efficiency corrections are shown in
Table 1. For the and
off-resonance data samples, the dilepton
candidate ratios are and ,
respectively. These are in excellent agreement and show that for
these selections the efficiency ratio does not depend on the
center-of-mass energy or the different boost associated with the two
samples. The corresponding MC samples show the same behavior and
allow us to extract data-driven corrections to the MC efficiency
ratio. The average correction to the MC efficiency ratio between
samples is .
Table 1: The numbers of dilepton candidates in
and
off-resonance data and
MC samples and the correction for data and MC efficiency
discrepancies. The numbers of MC events are scaled according to the
measured luminosity.
Sample
1,538,569
1,554,208
179,466
178,569
4,422,407
4,398,983
515,067
505,133
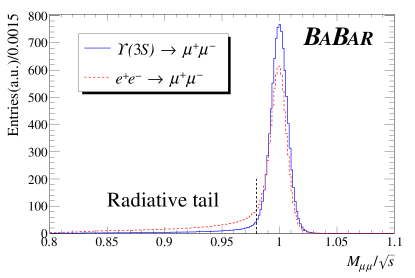
The method to discriminate between decays
and the continuum production is based on the
fact that the resonance is very narrow and thus the ISR
effects are highly suppressed for the signal, but not the continuum
background. If the ISR photons have an energy greater than a few MeV
(an amount associated with the PEP-II beam energy spread), then the
interaction energy is too low to form the bound
state. This effect results in a significant difference in the
radiative tail of the distribution for the continuum and
resonance production processes for reconstructed dimuon candidates, as
shown in Fig. 1. About 23% of the continuum
candidates are in the low mass radiative tail region
(; of invariant mass resolution
corresponds to approximately 0.02 in these units) whereas for the
resonance decays this number is only 7%, and is associated with final
state radiation effects.
Figure 1: Comparison of
distributions for the continuum production
in data at off-resonance energy and decays in MC, where only final-state radiation is
expected. The distributions are normalized to the same number of
events. The vertical dashed line shows the border .
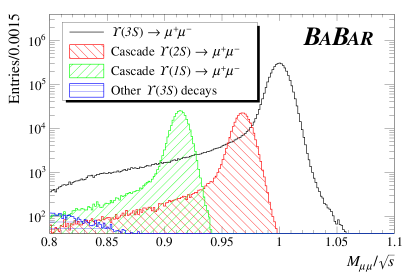
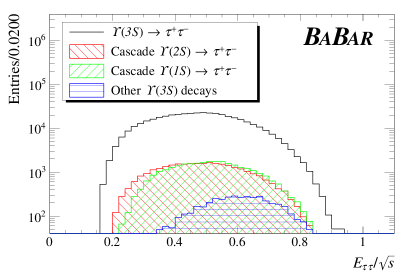
In Fig. 2 the selected signal events are shown for
simulated decays. For the dimuon events, the
variable is plotted whereas for the
events the total reconstructed event energy, scaled to
center-of-mass energy, , is plotted. In the
dimuon events, decays of the to lower mass
or resonances via radiative and hadronic
transitions, where the or then decay
into a dimuon pair, are clearly seen and separated. In this paper we
refer to such processes, including analogous processes with a
final state, as “cascade decays”. Owing to the
excellent momentum resolution of the tracking system, the
distribution provides not only an estimate of
the number of events but also a direct
evaluation of the contributions from the cascade decays. In the
channel, however, these cascade decay channels all have
the same broad distribution in and are nearly
indistinguishable.
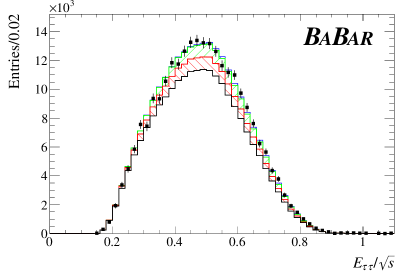
Figure 2: Distributions of
(top plot) and
(bottom plot) variables in MC. Cascade decays are clearly
separated in dimuon events and nearly indistinguishable in
events.
In order to extract the ratio that takes into account
correlations between components, a binned maximum likelihood fit
procedure based on the and
distributions is employed. The fit procedure
is based on the template-fitting method of Ref. Barlow and
takes into account the finite number of events in the fit-template
components. The and
templates are taken from the KKMC-based
MC without ISR effects. The templates for
and
via cascade decays, as well as
the remaining small contributions from hadronic decays,
are taken from the EvtGen-based MC. The continuum templates use data
control samples, as described in the following paragraph.
The amount of BABAR data collected on-resonance is about ten times
larger than off-resonance. Consequently, when the continuum template
is based only on the off-resonance data, the small size of that sample
dominates the statistical uncertainty of the ratio. To overcome this
limitation, on-resonance Run 6 data, with an integrated
luminosity of and the same detector
configuration as Run 7, is used for the continuum template in the fit.
Since the leptonic width of the is negligible compared
to the total width, only continuum-produced dilepton events are
expected in the sample. However, other
decays appear in the data continuum template via the ISR process. The
radiative return processes have been extensively studied by
BABAR (e.g., a narrow resonance production described in
Ref. Aubert:2003sv ) and based on this approach, the amount of
ISR-produced mesons are estimated and subtracted from
the continuum template.
The number of events and the
raw ratio are free
parameters of the fit. In the non-signal templates, this ratio is
fixed either as in data for the continuum background or to the
simulation prediction for the other templates.
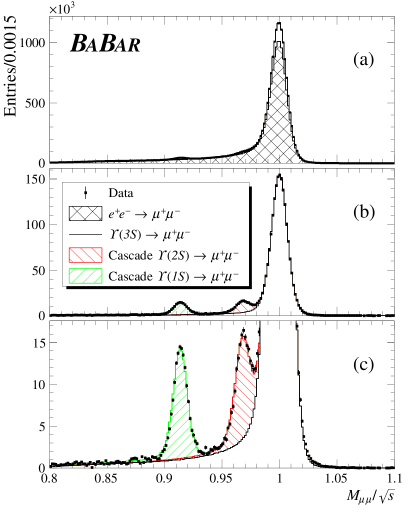
A graphical representation of the fit result is shown in
Figs. 3 and 4. The fit yields a raw ratio
of The MC-based selection efficiencies and their ratio, which
are needed to obtain the ratio , are shown in
Table 2.
Table 2: MC selection efficiencies in percent for
. The quoted uncertainties reflect MC
statistics.
(%)
(%)
/
Figure 3: The result of the template fit to the
data in the variable. In (a)
all events are shown, in (b) and (c) the dominant continuum
background is subtracted, and (c) is a
magnified view of (b) to better show cascade decays and the
radiative tail region.Figure 4: The result of the template fit to the
data in the variable after the
continuum background is subtracted.
Data are depicted as points with error bars.
The legend is the same as in
the corresponding plot in Fig. 2.
Low multiplicity decays, such as
semileptonic decays, can potentially mimic -pair events and then
pass the selection criteria. These would modify the
-based continuum template. Note that significant numbers
of events are not expected in the final
dimuon sample since of such candidates is too small. To
estimate this effect, a MC sample of million events was processed, which is about three times the size of
the data, and resulted in 15 dimuon and 7644
candidates. Thus, the contribution to the
muon template can be safely neglected whereas the amount of
candidates translates into a correction of
to the expected number of
candidates and is applied to the ratio
.
Combining the fit result , the ratio of MC
efficiencies , the
data/MC correction , and the correction from
events , the ratio is
where uncertainties from the
data/MC correction and MC efficiencies are included in the statistical
uncertainty.
The sources of the systematic uncertainty in are summarized in
Table 3.
Table 3: The summary of systematic
uncertainties.
Source
Uncertainty (%)
Particle identification
0.9
Cascade decays
0.6
Two-photon production
0.5
0.4
MC shape
0.4
contribution
0.2
ISR subtraction
0.2
Total
1.4
To assess the particle identification uncertainty, three additional
classifiers were considered. The first used tighter
electron selectors for both the to electron and the to
non-electron selection. The second had a tighter electron selector
for the to non-electron selection. The third replaced the
to non-electron selection with an explicit requirement that the
non-electron particle be identified as a muon or a pion. Even though
the data-driven corrections associated with each of these separate
classifiers were applied, and despite the highly
correlated statistics in these samples, there remains a 0.9%
difference between one of these three test classifiers and the default
classifier, which we assign as the particle identification systematic
uncertainty.
The ratio of the number of dimuon and events from the
cascade decays in the MC fit templates are fixed according to
lepton-flavor universality. To assess the effect of this assumption,
the ratio was varied according to the current experimental
uncertainties in branching fractions for and
to dimuon and final states, resulting in
a maximum difference in to be 0.6%, which is
taken as the systematic uncertainty.
As there is no reliable two-photon fusion MC, the contribution to the
systematic uncertainty arising from the two-photon fusion background
is estimated by varying the selection on the transverse momentum,
which reduces the selection efficiency to almost half
its nominal value. These variations result in a maximal deviation in
of 0.5%.
The simulation of other generic decays shows that a
small fraction of background events (about 0.1% of dimuon and 1% of
samples) still pass the selection criteria. These
backgrounds do not exhibit any features that allow them to be easily
separated in the fit itself. Because of this, the amount of this
background is fixed to the MC prediction and a 0.4% systematic
uncertainty is assessed by varying by 50% the background, which is
dominated by the hadrons that primarily
contaminate the sample.
To estimate the systematic uncertainty associated with imperfect
modeling of radiative effects, the KKMC-based templates for
decays used in the fit are replaced with
templates created using EvtGen with PHOTOS. This primarily modifies
the shape associated with radiative tail, shown in
Fig. 3, resulting in a change in
of 0.2%. There is a small % difference in
resolution between and data, as well as
the same order of magnitude difference between data and MC. To
estimate the systematic uncertainty due to this difference, the mass
resolution in the MC is degraded to be up to 10% worse than the
resolution in data. This results in a shift in
of up to 0.4%. From this study, the uncertainty from the MC template
shape mismodeling of is conservatively
estimated to be 0.4%. The total systematic uncertainty from the MC
shape modelling associated with the radiative and resolution effects
is 0.4%.
The uncertainty from the background in the continuum
template is estimated by varying the expected amount of the background
by 50%, resulting in a 0.2% change in the ratio.
The systematic uncertainty associated with mesons
produced by the radiative return process in the continuum template is
estimated by accounting for experimental uncertainties of total widths
and leptonic branching fractions of these mesons and by varying the
overall amount of these produced mesons by 10% in order to
conservatively account for radiator function uncertainties. We assign
a value of 0.2% as the systematic uncertainty coming from these
various effects.
All of the systematic uncertainties described in the paragraphs above
are combined in quadrature, giving total systematic uncertainty of
1.4%.
In conclusion, based on the data collected by the BABAR detector
near the and resonances, the ratio of
the leptonic branching fractions of the meson is
measured to be
This is in agreement with the SM prediction of
0.9948 Aloni:2017eny within two standard deviations and its
uncertainty almost an order of magnitude smaller than the only
previous measurement reported by the CLEO
collaboration Besson:2006gj .
We are grateful for the excellent luminosity and machine conditions
provided by our PEP-II colleagues,
and for the substantial dedicated effort from
the computing organizations that support BABAR.
The collaborating institutions wish to thank
SLAC for its support and kind hospitality.
This work is supported by
DOE
and NSF (USA),
NSERC (Canada),
CEA and
CNRS-IN2P3
(France),
BMBF and DFG
(Germany),
INFN (Italy),
FOM (The Netherlands),
NFR (Norway),
MES (Russia),
MINECO (Spain),
STFC (United Kingdom),
BSF (USA-Israel).
Individuals have received support from the
Marie Curie EIF (European Union)
and the A. P. Sloan Foundation (USA).
References
(1)
R. Van Royen and V. F. Weisskopf,
Nuovo Cim. A 50, 617 (1967);
Erratum: Nuovo Cim. A 51, 583 (1967).
(2)
M. A. Sanchis-Lozano, Int. J. Mod. Phys. A 19, 2183 (2004).
(3)
D. Besson et al. (CLEO Collaboration), Phys. Rev. Lett. 98, 052002 (2007).
(4)
D. Aloni, A. Efrati, Y. Grossman and Y. Nir, J. High Energ. Phys. 06, 019 (2017).
(5)
Y. Amhis et al. (HFLAV Group), Eur. Phys. Jour. C 77, no.12, 895 (2017).
(6)
J.P. Lees et al. (BABAR Collaboration), Nucl. Instrum. Methods Phys. Res., Sect. A 726, 203 (2013).
(7)
J. R. Klein and A. Roodman, Ann. Rev. Nucl. Part. Sci. 55, 141 (2005).
(8)
B. Aubert et al. (BABAR Collaboration), Nucl. Instrum. Methods Phys. Res., Sect. A 479, 1 (2002).
(9)
B. Aubert et al. (BABAR Collaboration), Nucl. Instrum. Methods Phys. Res., Sect. A 729, 615 (2013).
(10)
B. F. L. Ward, S. Jadach and Z. Was, Nucl. Phys. Proc. Suppl. 116, 73 (2003).
(11)
S. Jadach, W. Placzek, B. F. L. Ward, Phys. Lett. B 390, 298 (1997).
(12)
D. J. Lange, Nucl. Instrum. Methods Phys. Res., Sect. A 462, 152 (2001).
(13)
E. Barberio and Z. Was, Comput. Phys. Commun. 79, 291 (1994).
(14)
S. Agostinelli et al. (GEANT4 Collaboration), Nucl. Instrum. Methods Phys. Res., Sect. A 506, 250 (2003).
(15)
R. J. Barlow and C. Beeston, Comput. Phys. Commun. 77, 219 (1993).
(16)
B. Aubert et al. (BABAR Collaboration), Phys. Rev. D69, 011103 (2004).