A study of daytime convective vortices and turbulence in the martian Planetary Boundary Layer based on half-a-year of InSight atmospheric measurements and Large-Eddy Simulations
Abstract
Studying the atmospheric Planetary Boundary Layer (PBL) is crucial to understand the climate of a planet. The meteorological measurements by the instruments onboard InSight at a latitude of 4.5∘N make a uniquely rich dataset to study the active turbulent dynamics of the daytime PBL on Mars. Here we use the high-sensitivity continuous pressure, wind, temperature measurements in the first 400 sols of InSight operations (from northern late winter to midsummer) to analyze wind gusts, convective cells and vortices in Mars’ daytime PBL. We compare InSight measurements to turbulence-resolving Large-Eddy Simulations (LES). The daytime PBL turbulence at the InSight landing site is very active, with clearly identified signatures of convective cells and a vast population of 6000 recorded vortex encounters, adequately represented by a power-law with a 3.4 exponent. While the daily variability of vortex encounters at InSight can be explained by the statistical nature of turbulence, the seasonal variability is positively correlated with ambient wind speed, which is supported by LES. However, wind gustiness is positively correlated to surface temperature rather than ambient wind speed and sensible heat flux, confirming the radiative control of the daytime martian PBL; and fewer convective vortices are forming in LES when the background wind is doubled. Thus, the long-term seasonal variability of vortex encounters at the InSight landing site is mainly controlled by the advection of convective vortices by ambient wind speed. Typical tracks followed by vortices forming in the LES show a similar distribution in direction and length as orbital imagery.
Plain Language Summary
InSight is a lander sent to the surface of Mars with a weather station capable, like never before, to measure pressure, temperature and winds continuously and at high cadence. We use this InSight atmospheric data set acquired over half a Martian year, along with computer simulations, to study the intense turbulence that develops in the daytime hours on Mars. InSight detect periodic variations in the measurements of the weather station, corresponding to air motions driven by convection. We also detect a large population of 6000 whirlwinds passing close to the InSight lander and causing the pressure at the weather station to suddenly drop. The number of those whirlwind encounters vary from day to day, because of the random turbulence, and on a seasonal basis, because of the varying ambient wind that transports the whirlwinds towards InSight. Unlike the population of whirlwinds, the strength of wind gusts follow the ground temperature varying with season. Whirlwinds also leave graffiti-like dark tracks at the surface of Mars that can be imaged by satellites in the InSight region and reproduced by our numerical simulations.
1 Introduction
Mars is a cold desert; yet its near-surface atmosphere, the so-called Planetary Boundary Layer (PBL), is prone to strong turbulent motions in the daytime (Petrosyan et al., (2011) and references therein). Daytime turbulent motions in the thin martian atmosphere include spectacular vortices that may appear as dust devils if they raise sufficient dust, strong updrafts at the borders of convective cells, and powerful wind gusts. These motions result in a mixing of heat, momentum, dust particles and chemical species over altitudes of several kilometers above the surface, making PBL processes on Mars a crucial step to understand the meteorology and climate. The Martian PBL also exhibits interesting differences with the terrestrial PBL, notably a strong control on the daytime PBL turbulence by the near-surface atmospheric absorption of surface infrared emission Haberle et al., (1993); Sävijarvi, (1999); Spiga et al., (2010).
Phenomena related to daytime turbulence on Mars cause pressure, wind, and temperature to fluctuate at timescales shorter than a Martian hour (defined as 1/24 of a martian day or sol). Such signatures have been recorded in the in situ meteorological measurements of Viking Hess et al., (1977); Tillman et al., (1994), Pathfinder Schofield et al., (1997); Larsen et al., (2002), Phoenix Ellehoj et al., (2010); Holstein-Rathlou et al., (2010), Spirit and Opportunity Smith et al., (2006), and Curiosity Steakley and Murphy, (2016); Kahanpää et al., (2016); Ordonez-Etxeberria et al., (2018), as is summarized in the review by Martínez et al., (2017). Turbulence-resolving numerical modeling referred to as Large-Eddy Simulations (LES) can help to make sense of the PBL events arising in time series obtained by single-station measurements (e.g., pressure drops, wind gusts, quasi-periodic temperature fluctuations) in the broader context of convective turbulence in the PBL (see Spiga et al., (2016) for a review).
The instrumentation implemented on the InSight spacecraft, which landed on Mars on the flat plains of Elysium Planitia (4.5∘N 135.6∘E) on November 28 2018, is particularly suitable to conduct studies of PBL turbulence Spiga et al., (2018); Banfield et al., (2020); Banerdt et al., (2020). The pressure sensor is characterized by its unprecedented sensitivity and high-frequency acquisition Banfield et al., (2018). The wind and temperature measurements, albeit similar to the ones performed on board Curiosity Gómez-Elvira et al., (2012), benefit for the first time from the simultaneous use of two booms facing in opposite directions – inadvertent destruction of one of the Curiosity wind sensors by flying debris at landing produced observational biases which made only winds coming from certain directions reliably measurable Newman et al., (2017), making the Curiosity wind retrieval challenging Viúdez-Moreiras et al., (2019). Another key novel characteristic of InSight’s in situ meteorological observations is that measurements of pressure, temperature, and wind are made continuously Spiga et al., (2018), as they are needed to constrain the atmosphere-induced seismic noise Murdoch et al., (2017); Kenda et al., (2017); Garcia et al., (2020) at all times in order to assess how much of the seismic signal corresponds to the activity in the interior of Mars. Those direct atmospheric measurements are complemented by surface brightness temperature sensing Mueller et al., (2020), color imaging Maki et al., (2018), and, for the first time at the surface of Mars, seismic measurements Lognonné et al., (2020). Furthermore, solar array currents can also be used for atmospheric investigations Lorenz et al., 2020a .
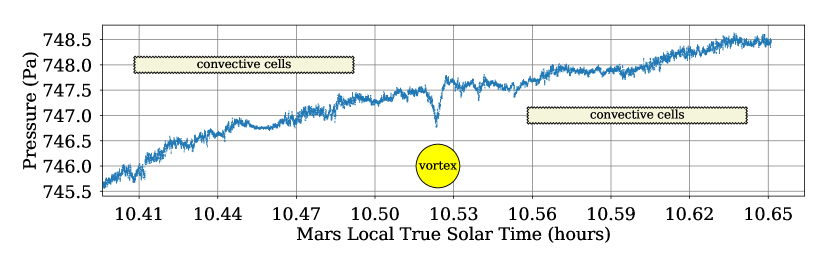
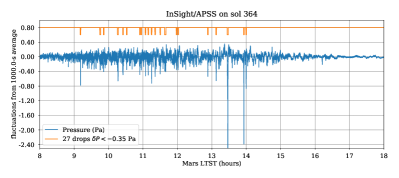
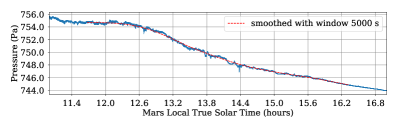
The potential of InSight to study the daytime PBL turbulence was actually unveiled the very first time the pressure sensor was switched on for a 900 second test, at about 10:30 Mars local time on InSight sol 4. Figure 1 shows the occurrence of a sudden, short-duration pressure drop of amplitude 0.6 Pa, characteristic of a convective vortex, in the midst of longer, 100-second-period fluctuations of pressure of amplitude 0.1 Pa, characteristic of convective cells.
The goal of the present study is to use InSight measurements in the first half year of operations in order to explore the atmospheric PBL dynamics in the daytime, especially convective cells and vortices, and to propose a preliminary assessment of the seasonal variability thereof and the vortex population statistics. This paper focuses on PBL turbulent structures and convective vortices, regardless of whether they carry dust particles or not. The question as to whether the identified vortices in this study are carrying a sufficient amount of dust particles to be visible as dust devils in InSight’s cameras is left for future studies; as is described in Banfield et al., (2020), despite extensive imaging campaigns, no dust devil were observed by InSight (this extends to the sols 0-400 spanned by the current study). The diagnostics drawn from InSight observations are compared to turbulence-resolving LES using the model described in Spiga et al., (2010).
The topics related to PBL dynamics left out of the current study are detailed in other papers of this issue: notable individual dust devil events Lorenz et al., 2020b , seismic signatures of vortices (Murdoch et al., in revision, Kenda et al., (2020)), orbital observations of vortex tracks Perrin et al., (2020) and aeolian science with InSight (Charalambous et al. and Baker et al., in revision for this issue). As is shown in Banfield et al., (2020), InSight has a great potential too for studies of the nighttime, shear-driven turbulence associated with the nocturnal inversion. This topic is out of the scope of the present paper, which focuses on the daytime PBL dynamics, but will be developed in future papers.
2 Methods
2.1 InSight observations
This study includes observations acquired in the first 400 sols of Insight operations at the surface of Mars. To indicate seasons on Mars, the Mars-Sun angle, referred to as the areocentric solar longitude in degrees (∘), is used with the standard convention that 0∘ corresponds to northern spring equinox. InSight landing on November 26th, 2018 corresponds to InSight sol 0 and (northern late winter). The last sol considered in this paper, sol 400, corresponds to (northern mid-summer). As far as local time is concerned, in order to permit the analysis on seasonal timescales and the comparison of InSight observations with models, we use the sundial-equivalent Mars Local True Solar Time (LTST) in which noon corresponds precisely to the moment when the sun crosses the meridian.
The characteristics of the InSight instruments relevant for atmospheric science are summarized in Spiga et al., (2018) and the Methods section of Banfield et al., (2020). The current paper uses measurements from the pressure, temperature and wind sensors on board InSight, which in addition to the magnetometer form the Auxiliary Payload Sensor Suite (APSS). Details of the calibration of the pressure sensor and the Temperature and Winds for INSight (TWINS) sensors can be found in Banfield et al., (2018). APSS measurements of pressure, wind, temperature are continuously performed – except during brief, random anomalies of APSS electronics that cause measurements to stop during a couple of days, and the solar conjunction between sols 269 and 283 that prevented data transmission from Mars to Earth.
The Insight pressure measurements are routinely carried out at 10 Hz with a noise level of 10 mPa Hz-1/2 from 0.1-1 Hz (typical noise at 1 Hz is thus of the order 10-2 Pa) rising to 50 mPa Hz-1/2 at 0.01 Hz. Downlink limitations caused the InSight pressure datasets to be downsampled at 2 Hz in the sol intervals 14–167 and 262–269. This is significantly higher frequencies and lower noise levels than the previous pressure sensors sent to Mars Martínez et al., (2017) and is appropriate to study expected daytime turbulent signatures: gusts, vortices, and cells Spiga et al., (2018).
As is described in the Methods section of Banfield et al., (2020), the inclusion of an inlet tubing often does not prevent the pressure signal above 2 Hz to be correlated with wind speed – pointing towards either a loss of effectiveness of the pressure inlet, or mechanical or electrical noise in the pressure sensor. Thus, we consider herein only the pressure signal at frequencies 2 Hz: before our pressure drop search is performed, the signal is smoothed using a window of 0.5 s – i.e. pressure is low-pass-filtered with a 2 Hz cutoff. This is appropriate for the search of vortex-induced pressure drops of duration above 1 second, which makes the majority of events according to existing studies, see e.g. Murphy et al., (2016).
The TWINS sensor booms are similar to those on board the Curiosity rover Gómez-Elvira et al., (2012). The booms are located on the InSight platform, facing outward in opposite directions over the two solar panels. Their altitude from the surface is respectively 121.5 cm and 111.5 cm for the west and east booms Banfield et al., (2020). Wind and air temperature are acquired at a frequency of 1 Hz and an accuracy of 1 m s-1 for wind speed, 22.5∘ for wind direction, and 5 K for temperature. Owing to downlink limitations, the InSight TWINS dataset is available with a frequency of 0.1 Hz on sol intervals 32–182 and 262–269, 0.5 Hz on sol intervals 14–30, 183–230, 284–292, and 1 Hz on sol intervals 4–10, 231–261, 293–400. The wind measurements are obtained from the TWINS booms’ sensor acquisitions using look-up tables built on wind-tunnel calibration experiments and correcting from the influence of the lander platform elements using computational fluid dynamics simulations Banfield et al., (2018). The measurements from the boom facing the prevailing wind are preferentially selected. In practice, the TWINS booms’ wind measurements may be discarded because of sensor saturation (usually when wind speed is high, typically wind gusts 20 m s-1) and/or low Reynolds number (usually when wind speed is low, typically below 2.8 m s-1, see Banfield et al., (2020)) and/or unfavorable wind direction (e.g., perpendicular to both booms). The actual frequency of TWINS wind and temperature measurements is thus typically Hz.
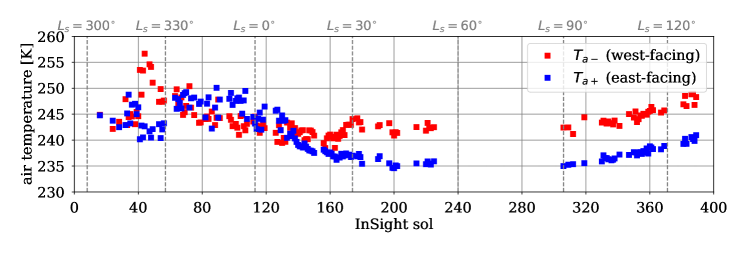
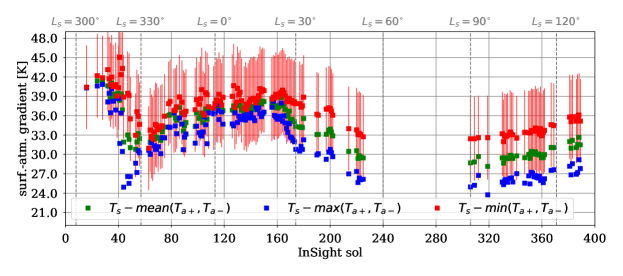
The use of atmospheric temperatures retrieved by InSight deserves particular care. In daytime, the differences in air temperatures measured by the two booms can be large (Figure 2). In sustained wind conditions, thermal contamination by the lander elements (deck and solar panels) perturbs the air temperature measurements of the TWINS boom facing the incoming ambient wind Banfield et al., (2020). As is reported in Viúdez-Moreiras et al., (2020), during the dust storm from sol 40 to sol 60, temperature measurements by the west-facing boom are clearly anomalous; an increase in daytime air temperature is observed rather than the decrease expected in dustier conditions and correctly detected by the east-facing boom. This difference can be related to the southeasterly wind direction at that time: before the atmospheric flow reaches the west-facing boom, enhanced convective heat transfer between the lander and the boom causes the measured air temperature to be strongly overestimated by 15 K compared to the east-facing boom. A 10-K daytime excess in the temperature measurements of the west-facing boom, compared to the east-facing boom, is also found repeatedly from sol 160 to sol 400 characterized by steady southeasterly winds. This bias is stable in this 240-sol interval. In weak wind conditions (sol 60 to 160), the two TWINS booms yield consistent diagnostics for temperature, although with higher uncertainties associated with smaller Reynolds number (similarly to wind measurements, see Banfield et al., (2020)). Discrepancies between the two booms’ measured air temperature remain within the 5 K limit, which is the sensor uncertainty.
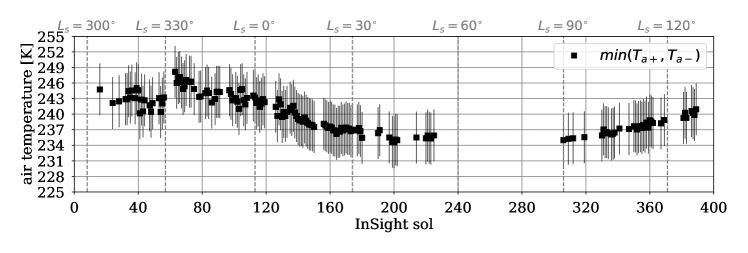
A strategy to mitigate those effects in the daytime is to consider, at each time, the minimum of the two temperature values deduced from each TWINS booms. In what follows, what is named “air temperature” and denoted refers to this quantity. This is the simplest and most efficient method to date to select the boom performing the most reliable air temperature measurements. In what follows, we use this TWINS air temperature mostly to compute the surface-to-atmosphere temperature gradient. Our conclusions still stand if another air-temperature estimate is considered (such as the maximum of the two temperatures from each of the booms, or an average of those temperatures, see Figure 8) since only the relative seasonal variations of atmospheric temperatures (and related quantities, such as surface-to-atmosphere temperature gradients) are analyzed.
Surface (i.e., ground) brightness temperature measurements are performed by the HP3 radiometer on board the InSight lander. The details on this sensor calibration are described in Mueller et al., (2020). The HP3 radiometer sensors measure the surface brightness temperature in three spectral bands (8-14 m, 8-10 m, 15-19 m) at two different spots relative to the InSight lander, named the close spot and the far spot Spohn et al., (2018). In what follows, we only use the surface brightness temperature retrieved in the far spot that, contrary to the close spot, is devoid of lander contamination (shadowing, thermal effects). The solar panel shadows pass through the near spot during the northern winter and can result in up to 20 K cooler temperatures in the afternoon and a up to 10 K cooler daily average temperature. Considering the larger calibration uncertainties of the two spectral bands 8-10 m and 15-19 m Mueller et al., (2020), in what follows surface brightness temperature is based on the sole 8-14 m spectral band. Daytime conditions are the most favorable for surface temperature retrievals which uncertainty is better than 1.5 K between local times 10:00 and 15:30.
2.2 Vortex detection method
Convective vortices developing in the martian PBL, and passing closely enough to the InSight lander, manifest as sudden pressure drops which amplitude ranges from 0.1 Pa to 10 Pa and duration ranges from several seconds to several tens of seconds. This is the most distinctive signature of those vortices in the atmospheric sensors at the surface (see Murphy et al., (2016) for a review). Frequent – albeit not systematic – wind direction reversals are also associated with those encounters, as well as an increase of wind speed.
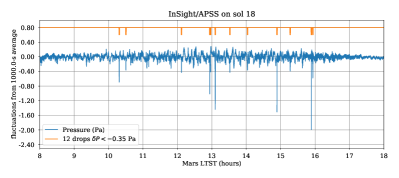
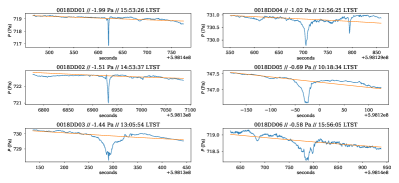
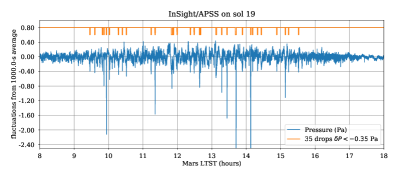
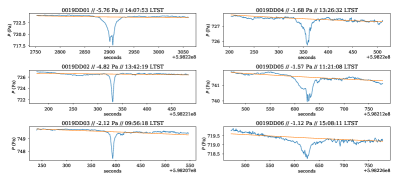
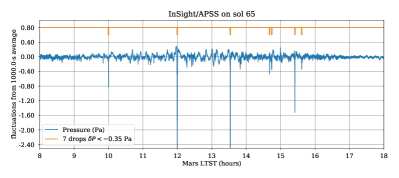
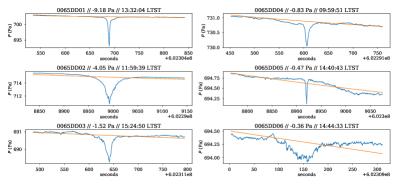
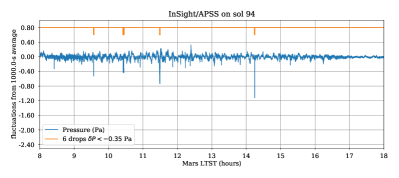
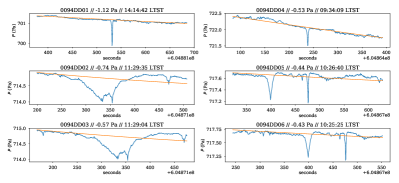
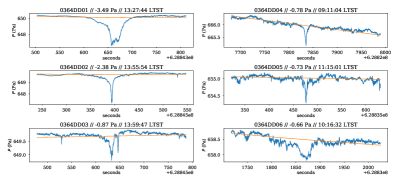
The method of detecting vortex pressure drops in the time series of InSight is slightly different than most published studies (e.g., Kahanpää et al., (2016)). Those existing studies adopt a method detecting locally the drop of pressure from the ambient pressure measured just before the passage of a vortex. Here we adopt a method detecting globally pressure drops over the record of pressure of a full day. This simply appeared as more efficient and straightforward in the (unprecedentedly continuous) pressure records obtained on board the InSight lander. We do not complement our vortex detection by analysis of the duration of vortex event – this is discussed in the paper by Murdoch et al. (in revision). An example of five typical InSight sols with vortex detection using pressure time series is shown in Figure 3.
Our detection algorithm for vortex-induced pressure drop is set as follows. Firstly, the InSight pressure signal over a complete sol is detrended from the diurnal cycle of pressure by subtracting a 1000-second window average from the signal; then a search of the minima of pressure is performed between LTST 08:00 and 17:00 (which covers the local time of occurrence of drop events, see section 3), starting from the deepest pressure drops and gradually removing the detected drops from the signal. This removal is realized on a window 30 seconds around the pressure local minimum, meaning that one limitation of the method is that double-dip pressure drops are counted as one event, unless the two local pressure minimum are occurring more than 60 s apart (as is the case for instance for sols 18 & 94 in Figure 3). Using a removal window 50 seconds rather than 30 seconds yields a population of detected pressure drops about 10% less abundant, yet similar results on statistics and seasonality.
How do we know that a detected pressure minimum correspond to a convective vortex event? Compared to vortex-induced signatures, the variations of pressure associated with convective cells develop on longer timescales (several hundreds seconds) and convective cells induce alternating pressure highs and lows, the cell-induced lows being less deep than the vortex-induced drops Lorenz, (2012); Spiga, (2012). This distinction between daytime PBL vortices and cells is illustrated, for instance, in the observed pressure signal shown in Figure 1 and the modeling results in Figure 13. In the literature, a method to select vortex-induced pressure drops over cell-induced pressure lows is to select only pressure drops deeper than a certain threshold. A threshold value of -0.3 Pa is usually adopted Ellehoj et al., (2010), although for pressure sensors with a higher noise level, a conservative -0.5 Pa limit is used Kahanpää et al., (2016).
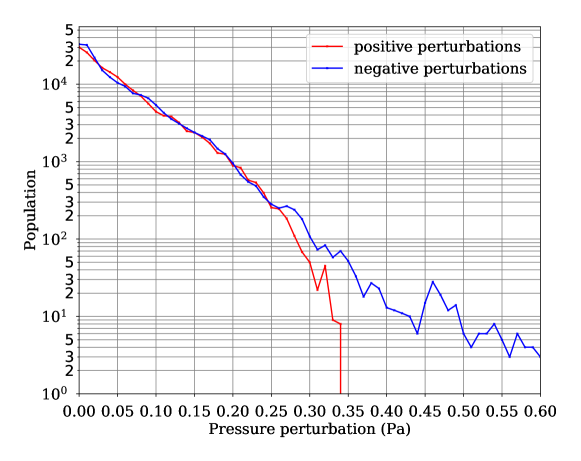
We can take advantage of the continuous InSight pressure data to discuss the choice of the threshold value for vortex detection in pressure time series. We examined the distribution of daytime pressure fluctuations from the 1000-second window smoothed signal, separating positive and negative perturbations (a typical example is shown in Figure 4). A good threshold to discriminate between convective cells and vortices corresponds to the value for which the distributions of positive and negative perturbations differ significantly, i.e. negative pressure perturbations are more abundant than positive counterparts hence cannot be attributed to convective cells. Figure 4 illustrates that the threshold value of -0.3 Pa employed in the literature is acceptable, yet adopting a threshold of -0.35 Pa is a more conservative choice for which pressure minimum can be more unambiguously attributed to convective vortices. We built two catalogs using the two distinct thresholds and found that the results discussed in this paper on drop statistics and seasonal variability are not significantly altered by the choice of threshold. In what follows, results obtained with the most conservative catalog (using a -0.35 Pa threshold value) are shown.
Detrending with 500-s to 2000-s smoothing windows was tested and the 1000-s window was finally selected as an optimum for vortex detection. A shorter window of 500-s tends to make vortex-induced pressure drops to become part of the smoothed signal and no longer considered as perturbations by the algorithm: as a result, long-lasting weak pressure drops are not detected and the other pressure drops are underestimated. We found that about 20% pressure drops detected with the 1000-s window are left undetected with the 500-s window. A longer window of 2000 s causes long-period fluctuations of pressure attributed to convective cells to be almost systematically included in the perturbation (detrended) signal rather than the smoothed signal; as a result, more than 30% of detected pressure drops are related to convective cells rather than convective vortices.
2.3 Large-Eddy Simulations (LES)
The results obtained from the InSight measurements are compared with turbulence-resolving Large-Eddy Simulations (LES). The principle of LES is to run a hydrodynamical solver of the Navier-Stokes equations at fine enough spatial resolution – on Mars, several tens of meters – to resolve the largest turbulent eddies in the daytime PBL, responsible for most of the transport of heat and momentum there Toigo and Richardson, (2003); Michaels and Rafkin, (2004); Spiga et al., (2010). Such computationally-expensive simulations are usually performed following the idealized setting of an infinite flat plain through doubly-periodic boundary conditions. The turbulent eddies resolved by LES include the convective cells, gusts, and vortices developing in the daytime PBL – only the very-small-scale “local” turbulence is not resolved by LES.
Here we use the model described in Spiga and Forget, (2009) and Spiga et al., (2010) which couples the Weather Research and Forecast (WRF) hydrodynamical solver Skamarock and Klemp, (2008), run at high spatial and temporal resolutions typical of LES Moeng et al., (2007), to the physical parameterizations, notably radiative transfer, developed for Mars at the Laboratoire de Météorologie Dynamique (LMD, see e.g. Forget et al., (1999) and Madeleine et al., (2011)).
Large-Eddy Simulations performed for this study dedicated to InSight extend those developed as pre-landing investigations in Kenda et al., (2017), Murdoch et al., (2017), and Spiga et al., (2018). The first two papers used LES with a resolution of 50 m and the third paper presented LES with a resolution of 10 m. Both are appropriate to resolve convective cells, provided the horizontal domain is sufficiently large to include several convective cells so as to avoid boundary effects Mason, (1989); Michaels and Rafkin, (2004). However, as far as vortices are concerned, the 50-m configuration only allows the largest vortices to be resolved and the 10-m configuration is too computationally expensive to be run on the whole local time period in which vortex activity takes place. Moreover, our objective in this study is to perform several LES runs in order to explore the sensitivity of vortex activity to local time, seasonal conditions and ambient wind speed, which makes the 10-m-resolution approach untractable for this purpose.
We thus carry out in the present study LES with a spatial resolution of 25 m (using an integration timestep of 1/4 second), hence resolving vortices of diameters above 50 meters.. The horizontal domain extends over grid points in the horizontal directions, which makes the total extent of the simulation domain km km. The top of the model is set at 10 km altitude (about twice the expected PBL depth) with 241 vertical levels. The surface temperature calculations in the model use a thermal inertia of 180 J m-2 K-1 s-1/2 and an albedo of 0.16, corresponding to the conditions encountered at the InSight landing site, based on the HP3 radiometer far spot measurements considered to be representative of regional average conditions Golombek et al., (2020). Radiative transfer computations assume the longitude and latitude of the InSight landing site for the whole LES horizontal domain.
LES runs are initialized with a vertical temperature profile set to be uniformly similar at all model grid points and extracted at the relevant season and location from Global Climate Model simulations (GCM, Forget et al., (1999); Millour et al., (2015)). A random (noise) perturbation of 0.1 K amplitude is added to the initial temperature field to break its symmetry and help trigger convective motion. The LES integrations are started at 07:00 local time (LTST) and the diurnal evolution of incoming sunlight and temperature profile in the PBL are computed online during the LES integrations by the radiative transfer scheme (visible column dust opacity considered in the model is 0.8). An uniform and constant profile of ambient wind speed (positive in the direction) is prescribed in the model. Surface friction and turbulence alter this prescribed profile during the LES integrations, so that the value of prescribed ambient wind represents wind conditions in the free atmosphere above the PBL; the value of ambient wind speed is about at the height relevant for InSight comparisons (1.165 m, see section 2.1). The two values 10 and 20 m s-1 of ambient wind speed prescribed in LES thus correspond to the near-surface ambient wind conditions encountered in the distinct sequences identified from Figure 8 and discussed in section 4.1.
3 Vortex population and statistics
3.1 General population
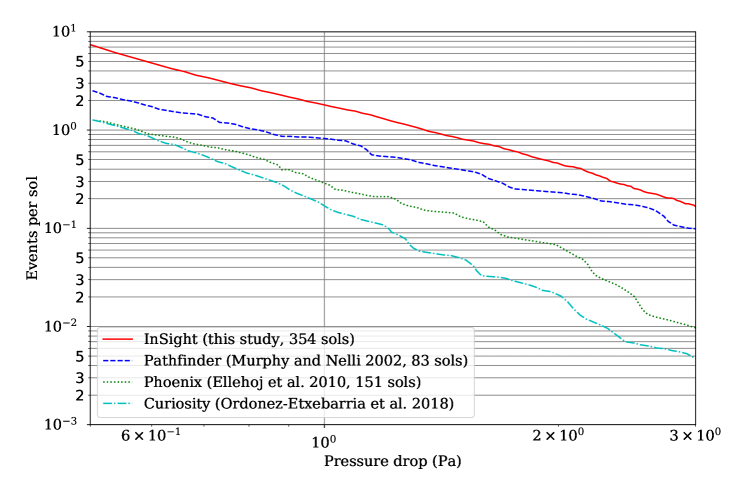
Convective vortices are known to be ubiquitous on Mars Fenton et al., (2016), yet InSight appeared as a particularly active site for convective vortices. This has been demonstrated with 200 sols of observations by InSight in Banfield et al., (2020). Figure 5 confirms, after 400 sols of InSight observations, that the InSight lander operates in a location prone to numerous vortex encounters compared to previous missions equipped with a pressure sensor: Pathfinder Murphy and Nelli, (2002), Phoenix Ellehoj et al., (2010), Curiosity Kahanpää et al., (2016); Ordonez-Etxeberria et al., (2018). Considering the 1-Pa pressure drops as a proxy for the total number of vortex events per sol, the InSight lander experiences from northern late winter to midsummer ten times more convective vortices than the near-equatorial Curiosity lander did on average all year long and about twice as many as the tropical Pathfinder lander did in the northern summer season. This is all the more striking since, in the first 400 sols considered here for analysis, the annual peak of surface temperature has not been reached yet at the near-equatorial site of InSight (see section 4.1).
A total of about 6000 vortex-induced pressure drop events deeper than 0.35 Pa are detected between sol 0 and sol 400 of InSight operations. The strongest detected pressure drop is 9.2 Pa Banfield et al., (2020); Lorenz et al., 2020a , which is the deepest vortex-induced pressure drop detected to date on Mars. The sample of vortex detections shown in Figure 3 for five typical sols illustrates the strong diurnal, daily, and seasonal variability of detected vortex encounters at the InSight landing site.
3.2 Local time
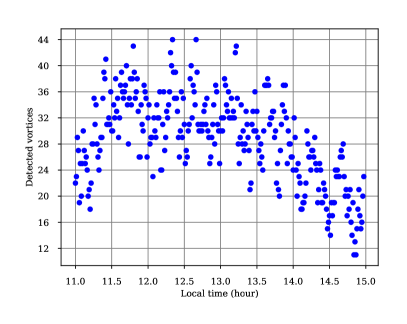
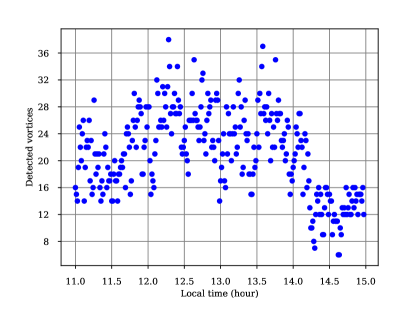
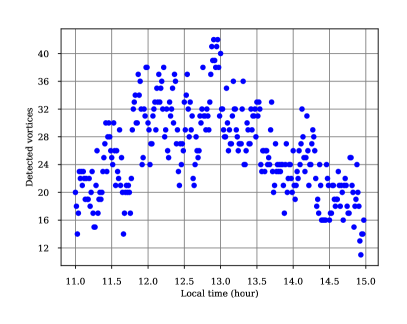
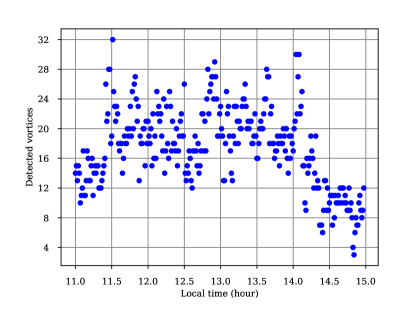
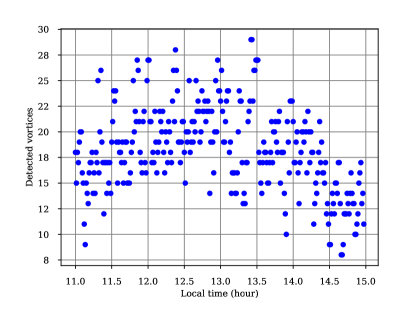
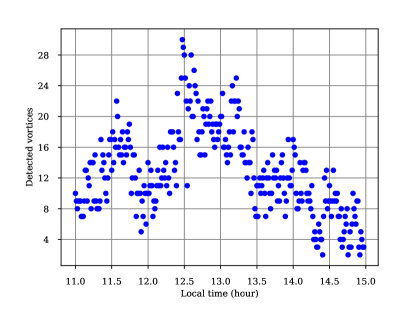
The local time of occurrence of convective vortices at the InSight landing site is between LTST 08:00 and 17:00 (Figure 6). The latest vortex-induced pressure drop deeper than 0.35 Pa detected at the InSight landing site in the first 400 sols of operations is at LTST 16:29. No detection prior to LTST 08:00 is obtained in the first 400 sols of Insight operations.
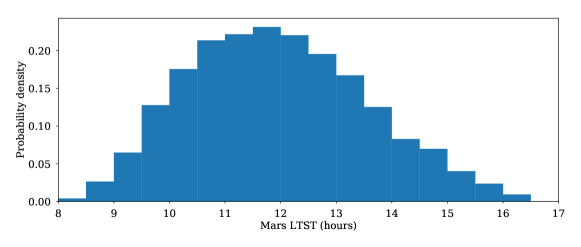
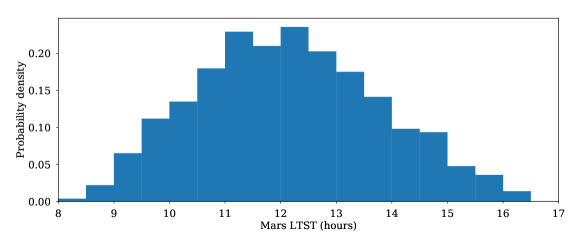
Overall, at the InSight landing site, the vortex activity is high between local times LTST 10:00 and 14:00. As is shown in Figure 6, the peak of activity for pressure drops is between 11:00 and 12:00 LTST, with an extent towards 12:30 for pressure drops stronger than 0.5 Pa. The mean of the distribution is found at respectively 11:57 LTST and 12:09 LTST; the standard deviation of the two distributions shown in e Figure 6 is 1.6 hour. This is, apparently, an earlier peak than expected from studies based on missions other than InSight which exhibit a maximum occurrence of vortex-induced pressure drops around noon Murphy et al., (2016); Kahanpää et al., (2016). However, Ordonez-Etxeberria et al., (2018) (their Figure 12) found that the distribution of daytime pressure drops detected by Curiosity peaked between 11:00 and 12:00 LTST when considering only local spring and summer, which are also the seasons covered by the present study addressing the first half a year of InSight operations. In the InSight data, there is also a tendency of the peak of vortex activity to occur earlier in the summer season, by about half an hour LTST. In local summer, Newman et al., (2019) found that the vortex encounters detected by Curiosity exhibited a double-peak structure at LTST 10:00 - 11:00 and 13:00 - 14:00 (see also simulations by Chapman et al., (2017)). This double-peak structure is not found during the first northern summer season experienced by InSight.
3.3 Statistical distribution of pressure drops
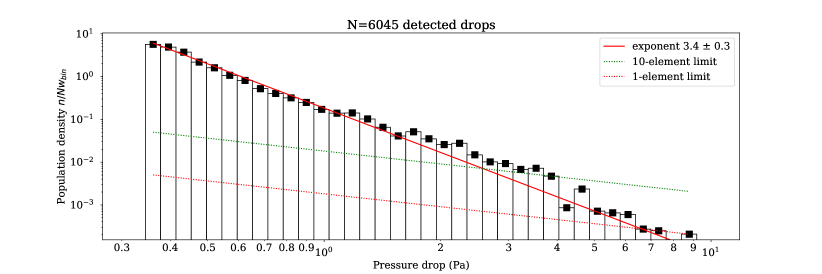
A question discussed at length in the existing literature Lorenz, (2011); Jackson and Lorenz, (2015); Kurgansky, (2019) is whether the distribution of pressure drops caused by convective vortices (Figure 5) follows a power law or not, and what is the exponent of this power law. Clearly, the rich InSight dataset permits the exploration of this question with an interesting new statistical perspective, given the large population of detected vortex events. The upper panel of Figure 7 shows a normalized log-log distribution (with logarithmic-sized bins) of all the vortices detected in the first 400 sols of InSight operations. A power-law distribution would appear as a linear trend in this diagram. Normalized distribution means that the number of events per bin is divided by the bin widths Lorenz, (2011), which allows the differential distribution in pressure drops to be retrieved Kahanpää et al., (2016).
The optimal fit we obtain in Figure 7 (upper panel), with a non-linear Levenberg-Marquardt least-squares approach, suggests that the observed distribution of pressure drops at the InSight landing site is well represented by a power-law distribution with a 3.4 0.3 exponent. The fit is particularly good for vortices having pressure drops between 0.3 and 1.5 Pa. This is reasonably close to the exponent 3.7 - 3.8 found for Curiosity observations Steakley and Murphy, (2016); Kurgansky, (2019) and to the exponent of 3 - 3.5 obtained from corrected Phoenix observations Jackson et al., (2018). Here we caution the reader that we did not attempt to perform a statistical analysis on the choice of function to fit the pressure-drop population. We adopted the power law as a means to compare the distributions obtained by InSight observations versus other measurements and numerical simulations, but our analysis does not rule out other possible functions to fit the distribution.
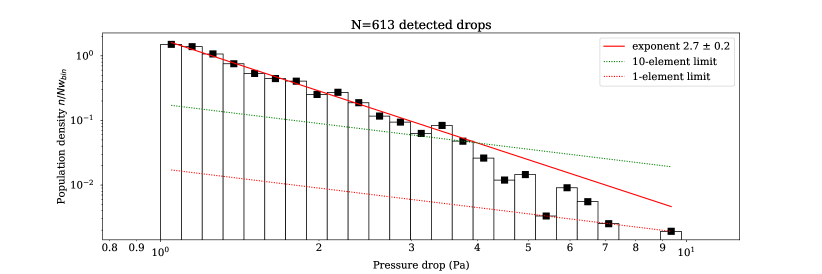
For pressure drops deeper than 1.5 Pa, the 3.4-exponent power law appears to underestimate the number of events actually detected by InSight. For that particular population, a power law with an exponent of 2.7 0.2 provides a better fit, as is shown in the lower panel of Figure 7. We did not identify problems or biases in our detection method that would explain why the deepest pressure drops might be systematically overestimated, as would be implied by Figure 7 (top panel) if we assume that the 3.4-exponent power law is the reality. This power-law slope break might be due to the fact that the total number of the deepest detected drops is not sufficient to draw statistically-meaningful conclusions about power-law exponents. This possibility is supported by the fact that the drop distribution did follow a 2.6-exponent power law when we considered the statistics of all pressure drops deeper than 0.3 Pa after only 40 sols of InSight operations.
4 Daytime turbulence and seasonal variability observed by InSight
4.1 Environmental conditions and PBL forcings
The seasonal evolution of the conditions relevant for turbulence in the daytime PBL is summarized in Figure 8.
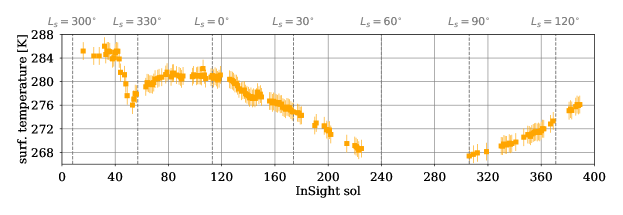
Surface temperature behaves as expected from the seasonal evolution at the equator, given InSight values of albedo and thermal inertia typical of Martian bare soil. A seasonal decrease of surface temperature is observed from northern winter () to northern summer (), then surface temperatures rise again, pointing towards an expected seasonal peak at northern fall equinox () as predicted, e.g., from the Mars Climate Database Millour et al., (2015). This behavior could appear as counter-intuitive, however the behaviour of surface temperature observed at the InSight landing site in Figure 8 is explained by the near-equatorial position of the spacecraft.
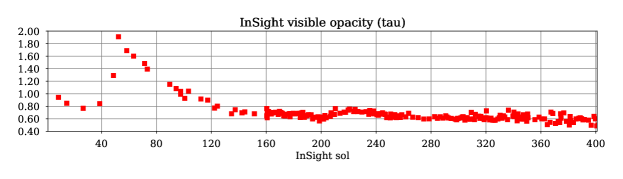
A notable dip of daytime surface temperature – departing from the sine-shaped seasonal evolution – occurred from sol 40 to sol 80 and corresponds to a large regional dust storm outside the InSight landing site region that doubled the dust optical depth in the InSight landing site region Banfield et al., (2020); Viúdez-Moreiras et al., (2020) (see Figure 8 lowermost panel). As a result, at the InSight landing site, the incoming sunlight reaching the Martian surface is lower as a result of enhanced absorption and scattering by the additional dust particles present in the atmosphere, hence the dip in daytime surface temperature.
What drives PBL convection in daytime is the near-surface convective instability that we could diagnose by computing the surface-atmosphere gradient . The seasonal evolution of this gradient follows to first order the seasonal evolution of surface temperature; yet the impact of the local dust storm from sol 40 to sol 80 appears more prominent than it is on the surface temperature signal (Figure 8). The surface-atmosphere gradient also stays quite high on sol 150 while the surface temperature has started its seasonal decrease.
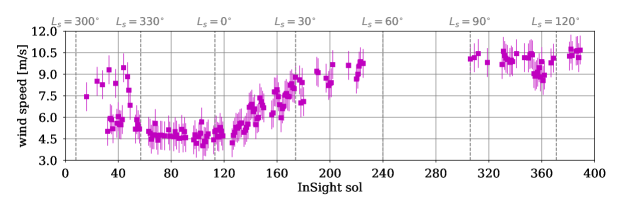
Another important control on PBL convection is the near-surface ambient wind speed . Discussing the physical mechanisms underlying the seasonal evolution of large-scale wind speeds is out of the scope of the present paper (see Spiga et al., (2018), Banfield et al., (2020)). Suffice to say here that the high daytime wind speeds in northern winter (beginning of the InSight mission, ) and northern spring to summer (), and the decrease in late northern winter correspond to the transition between two annual wind regimes driven by a combination of large-scale (Hadley cells) and regional (western boundary currents) circulations.
From the seasonal evolution of surface-atmosphere temperature gradient and ambient wind speed, three sequences in the first half year of InSight can be drawn – the indicated season references the northern hemisphere.
-
1.
Early mission (late northern winter, sols 0 to 40, ). This sequence is characterized by both high surface-atmosphere temperature gradient, mostly as a result of surface temperature being high, and high ambient wind speed in the northern winter “windy” season.
-
2.
Dust storm and spring (early northern spring, sols 40 to 160, ). Following the rise of dust opacity at the InSight landing site caused by a regional dust storm that started on sol 40 (Banfield et al., (2020), Viúdez-Moreiras et al., this issue), both the surface-atmosphere temperature gradient and the ambient wind speed decrease. The decrease in surface-atmosphere temperature gradient is significant (from about 45 K to about 32 K) but, even in those regional dust storm conditions, near-surface temperature gradients on Mars remain super-adiabatic. The behavior of the wind speed is more subtle and less clearly related to the regional dust storm than temperature. Wind speed actually remains high at the beginning of the regional dust storm from sol 40 to sol 45. Then, the decrease in wind speed starting at sol 50 at is predicted as a normal seasonal evolution by the pre-landing LMD GCM simulations in Spiga et al., (2018) even with no regional dust storm at this season (see their Figure 8). Indeed, the transition from northern winter solstice to spring equinox cause the wind speed to decrease, as a prelude to the seasonal reversal of the Hadley circulation closer to northern summer solstice. This difference of evolution between temperature and wind speed is also clear in the aftermath of the regional dust storm. When the dust opacity returns to levels seen at the beginning of the mission (around sol 100), both surface temperature and surface-atmosphere temperature gradient has risen again to close to pre-storm values, to follow the sine-shaped long-term seasonal variations; conversely, ambient wind speed remains low, in agreement with the seasonal evolution predicted by models (see Spiga et al., (2018) and also Baker et al. in revision for this issue).
-
3.
Aphelion season (from northern mid-spring to summer, sols 160 to 400, ). Starting from sol 160, both the surface temperature and the surface-to-atmosphere temperature gradient decrease dramatically (-10 K), while at the same time the ambient wind speed rises by almost a factor 2 to reach values slightly larger than in the Early mission sequence. This sequence is interesting for the seasonal evolution of turbulence, since it combines a wind speed equivalent to the Early mission sequence but surface temperature conditions 30 K colder than during this earlier sequence. Note that there is a gap in the range , due to a combination of HP3 radiometer troubleshooting and solar conjunction, but the pressure, temperature, and wind measurements available in this range shows that the atmospheric conditions are equivalent to those before and after the data gap.
4.2 Seasonal evolution of turbulence
4.2.1 Convective vortices
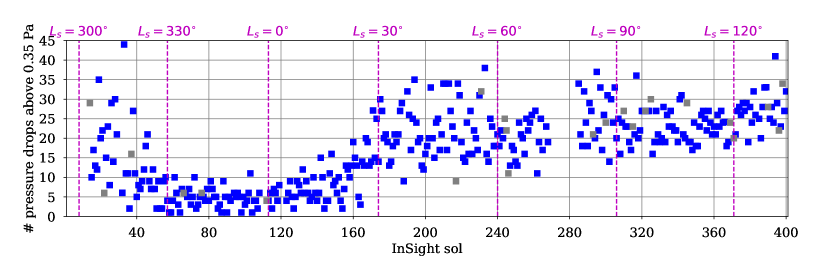
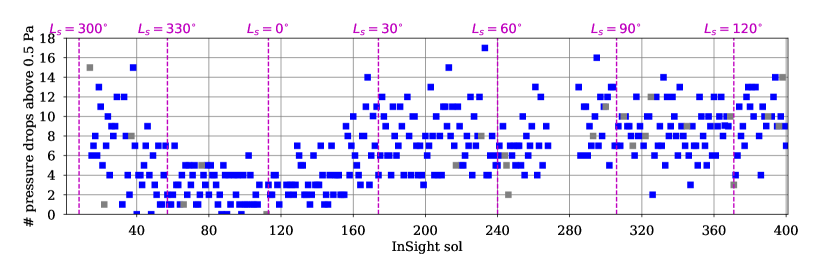
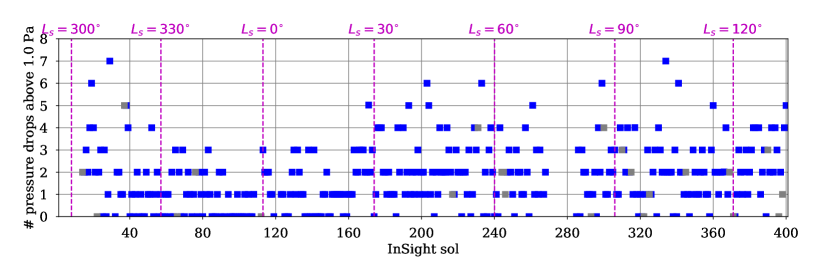
Figure 9 shows the seasonal evolution of the number of convective-vortex pressure drops detected at the InSight landing site. In the literature, a quantity named the “Dust Devil Activity”, combining the sensible heat flux with PBL depth Renno et al., (1998); Newman et al., (2017), is used to relate ambient conditions to vortex activity. It is difficult to use this diagnostic with InSight data since PBL depth estimates are not robust enough (see section 6) and, as is explained above, sensible heat flux is a degenerate diagnostic. We use instead more direct diagnostics to interpret the seasonal evolution of detected vortices: surface temperature, surface-to-atmosphere gradient and ambient wind speed.
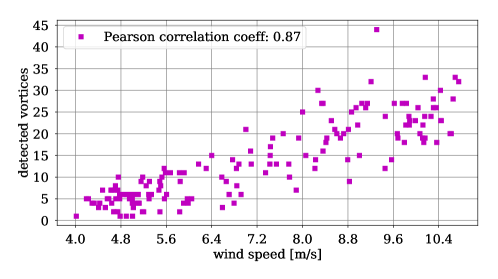
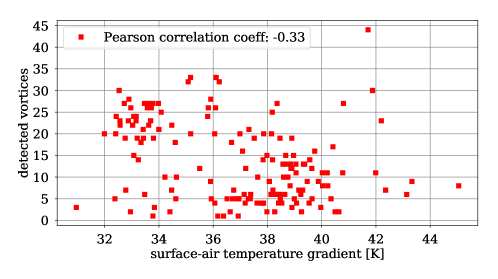
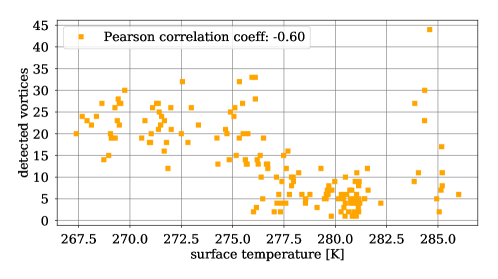
Figure 9 clearly indicates, over half a year of InSight observations, a much clearer correlation of the number of detected vortices with the ambient wind speed than with the surface-to-atmosphere gradient (or surface temperature) – whether the total population of vortices or the population of deepest-drop vortices are considered. The vortex activity at the InSight landing site is as intense in the Aphelion season sequence as in the Early mission sequence, despite a significant drop in surface-to-atmosphere gradient. In the Dust storm and spring sequence, the vortex activity also closely follows the evolution of ambient wind speed and, in the latest stages of this sequence, rises while the surface-to-atmosphere gradient is dropping significantly as a result of seasonal evolution. We note that past studies also reported an increase in vortex detections in frontal conditions when the ambient wind speed was likely to be significantly higher Ellehoj et al., (2010); Steakley and Murphy, (2016); Kahanpää et al., (2016). The strong correlation between InSight vortex detections and ambient wind speed is confirmed quantitatively in Figure 10: the Pearson correlation coefficient is close to 0.9 (positive linear correlation), while vortex detections are not correlated to surface-air temperature gradient, and weakly anti-correlated to surface temperature (at odds with physical expectations given the surface forcing of daytime PBL convection).
This correlation between the activity of convective vortices and ambient wind speed is degenerate. Higher ambient wind speed causes larger sensible heat flux, hence a putatively more active turbulence – although on Mars the radiative forcing of the daytime PBL is dominant. However, vortices are also advected by the ambient wind Balme et al., (2012); Reiss et al., (2014) hence move faster if the ambient wind is large. Thus, if we assume a similar vortex formation rate at low and high wind conditions, the probability of encounter by a fixed station such as InSight would be larger in the high-wind case. Large-Eddy Simulations are proposed in section 5 to further investigate this question. At the same time, it should be noted that shearing may prevent the formation of convective vortices if the ambient wind speed is too high Kurgansky et al., (2011); Balme et al., (2012). This does not seem to be the case at the InSight landing site where, even in the low-surface-temperature and high-wind-speed conditions of the Aphelion season sequence, the number of vortex encounters is very high.
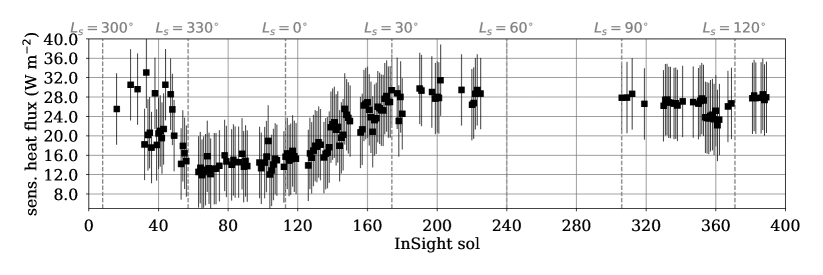
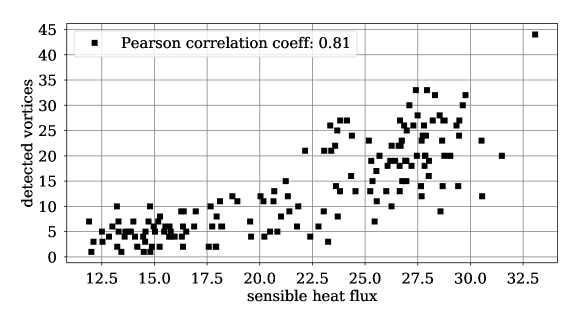
The seasonal variability of sensible heat flux deserves further comments; this quantity can be calculated from InSight observations (Figure 11) using the bulk formulation where friction velocity and temperature scale are computed from equations 3 and 4 in Spiga et al., (2018) using the InSight observations of respectively ambient wind speed and surface-atmosphere gradient , while atmospheric density is computed from pressure and air temperature observed by InSight, and is specific heat capacity on Mars. Interestingly, as is shown in Figure 11, the seasonal variability of the number of vortex encounters at the InSight landing site is well correlated to the observed sensible heat flux. Drawing conclusions on the driving mechanisms for vortices from this correlation is tantalizing; we consider, however, that sensible heat flux is an ambiguous diagnostic for two reasons.
-
1.
Contrary to Earth, in the low-density martian atmosphere, the near-surface instability that drives the daytime turbulence is mostly a result of radiative warming through CO2 (and, to lesser extent, H2O and dust) absorption of incoming surface infrared flux (see Haberle et al., (1993), Sävijarvi, (1999), and Spiga et al., (2010) section 4). Sensible heat flux still plays a role in driving daytime turbulence on Mars, but less so than radiative contributions (see section 4.2.2), in contrast to the terrestrial case. The contribution of sensible heat flux on the Martian PBL only becomes dominant in extreme regional wind conditions encountered over steep slopes Spiga et al., (2011).
-
2.
Computing sensible heat flux mixes environmental variables controlling both the formation rate of vortices (e.g., near-surface instability) and the advection of vortices (e.g., ambient wind speed). Consequently, a valuable physical interpretation of the correlation between vortices and sensible heat flux is difficult.
4.2.2 Wind gustiness
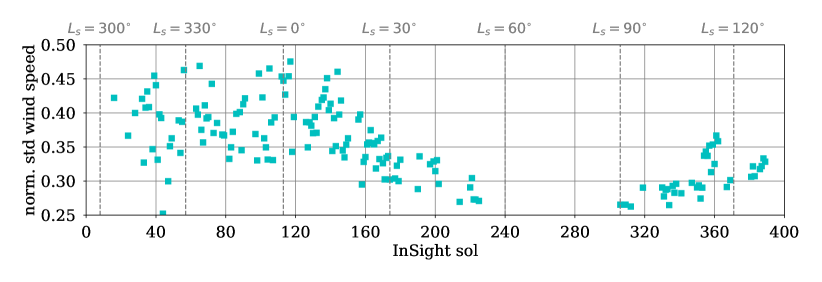
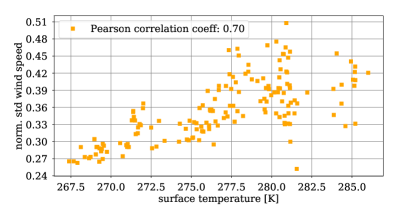
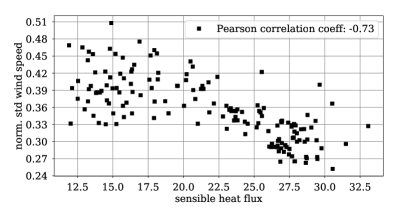
Figure 12 (top) shows the normalized daytime gustiness, obtained from the standard deviation of wind speed divided by the mean wind speed (computed over intervals of local times 11:00-14:00 LTST). Interestingly, in both the Early mission and the Dust storm and spring sequences, the gustiness remains roughly constant at values 35-45%. There is no apparent influence of the local dust storm on this normalized gustiness: the strong decrease in vortex encounters noticed at sol 50 in Figure 9 is not observed in the normalized gustiness. Gustiness and vortices are two integral parts of daytime convective turbulence in the PBL; however, contrary to the vortex count, the local normalized gustiness is supposedly corrected of the effect of advection by the wind normalization (a vortex count normalized by ambient wind speed is sometimes used also, see Ellehoj et al., (2010) and Holstein-Rathlou et al., (2010)). The fact that, in the Dust storm and spring sequence, vortex count decreases, while normalized gustiness does not, suggests that the advection effect is the dominant explanation for the seasonal correlation between vortex encounters and ambient wind speed at the InSight landing site.
What Figure 12 (top) also indicates is a decrease of gustiness in the Aphelion season sequence, from a value of 40% to 25%. This decrease of gustiness appears to be associated with the decrease of both the surface-to-atmosphere gradient and the surface temperature shown in Figure 8, while the ambient wind speed increases. However, the seasonal evolution puts the surface-to-atmosphere gradient at the same values at as during the local dust storm at ; this is not the case for surface temperature which reaches much lower values at . This, and the fact that normalized gustiness has not decreased during the local dust storm while it has decreased significantly at , indicates that normalized gustiness is primarily sensitive to surface temperature. Furthermore, Figure 12 (bottom) indicates a positive correlation (Pearson coefficient 0.7) between daytime gustiness and surface temperature, while a negative correlation is observed between daytime gustiness and sensible heat flux (or wind speed). This is in agreement with the martian daytime PBL turbulence being mainly driven by radiative contributions rather than sensible heat flux, contrary to Earth – and further reinforces our claim in section 4.2.1 that sensible heat flux could be well correlated to vortex encounters, without it being the actual driver of daytime turbulence on Mars. Lower daytime surface temperature in the Aphelion season sequence implies lower infrared flux from the surface to the atmosphere, hence lower radiative flux absorbed by the CO2 atmosphere overlying the Martian surface, and as a result less intense convective turbulence Sävijarvi, (1999); Spiga et al., (2010). The Aphelion season sequence, during which gustiness is lower than in the Early mission sequence while vortex encounters are as numerous, strongly suggests that advection by ambient wind speed is a key element for explaining sequences of sustained vortex encounters at the InSight landing site.
The slight increase of normalized gustiness from 25% to 30% close to is also correlated with the slow seasonal increase of surface temperature at the end of norther summer. What remains to be explained is why the drop in daytime surface temperature during the regional dust storm is not associated with a drop of normalized gustiness. A possibility is that the dust particles injected by the distant regional dust storm and present in the PBL at the InSight landing site cause an increase of infrared absorption in the PBL that would add up to the CO2 absorption and compensate (approximately) the decrease in energy input coming from the surface that received less sunlight because of dust absorption and scattering.
5 Comparison with Large-Eddy Simulations (LES)
| season (∘) | 300 | 300 | 0 | 0 | 30 | 30 | 120 | 120 |
| ambient wind (m/s) | 10 | 20 | 10 | 20 | 10 | 20 | 10 | 20 |
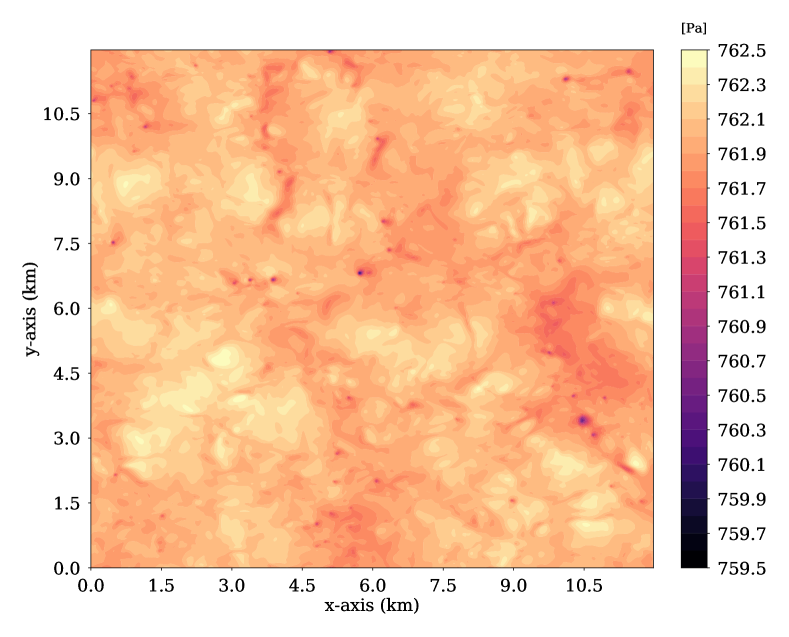
We performed eight LES runs which all share the same simulation configuration described in section 2.3. Table 1 summarizes the parameters chosen for the exploration of environmental conditions encountered at the InSight landing site during the first 400 sols of operation. What differs from one simulation to the other is the ambient wind speed, and the season considered for the LES radiative transfer computations (and, accordingly, the initial temperature profile). This is designed to explore the impact of the seasonal variations of environmental conditions described in section 4.1. A typical pressure field predicted by LES is shown in Figure 13, with localized vortex-induced pressure drops forming at the intersection of larger-scale convective cells Kanak, (2006); Toigo and Richardson, (2003); Michaels and Rafkin, (2004); Spiga et al., (2016). It should be emphasized here that the results we discuss in this paper with our 25-m LES will be in need to be confirmed by future work using higher-resolution LES (typically 5 m, a factor of five better) to better resolve the population of small-radius vortices Nishizawa et al., (2016); Giersch et al., (2019).
5.1 Vortex statistics
To compare the vortex statistics predicted by our LES runs with those obtained from InSight observations (see section 3), LES time series of pressure “measurements” emulating InSight’s are generated by randomly picking up a given grid point in the LES domain for each different sol (this is a practical application of the ergodic principle). We generate by this procedure 576 different “sols” for each LES listed in Table 1. Then, the exact same pressure-drop detection algorithm as is used for the InSight data, described in section 2.2, is applied to the LES time series for each generated “sol”.
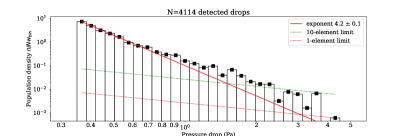
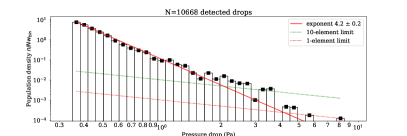
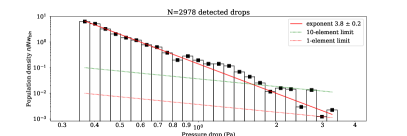
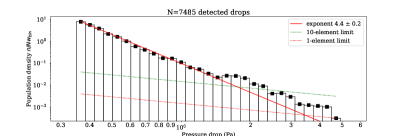
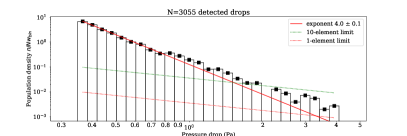
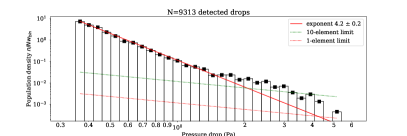
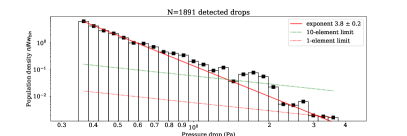
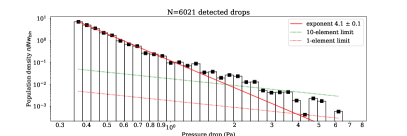
A first result that can be discussed is the distribution of pressure drops obtained in the LES. As is shown in Figure 14, the differential distribution of pressure drops caused by convective vortices are suitably represented by power laws with exponents close to 4, which is in agreement with the results obtained with Insight (3.4 exponent; see Figure 7). We also note that, at all seasons, there is systematically about 2 - 3 times more vortex encounters in the case with higher ambient wind speed. The exponent of the optimum power-law distribution also appears to change with ambient wind speed (the larger the wind speed, the larger the exponent – further work on LES will be needed to confirm this point). How the power-law exponent changes with season is much less clear; no particularly clear trend can be drawn. We also note that the tendency found in InSight observations (section 3.3) of the deepest pressure drops departing from a power law with exponent 3 - 4 appears to be reproduced by our LES runs. Future studies with a more extended period of time covered by InSight (e.g., two complete martian years), thereby including more of the deepest vortex encounters, will allow this question to be fully addressed.
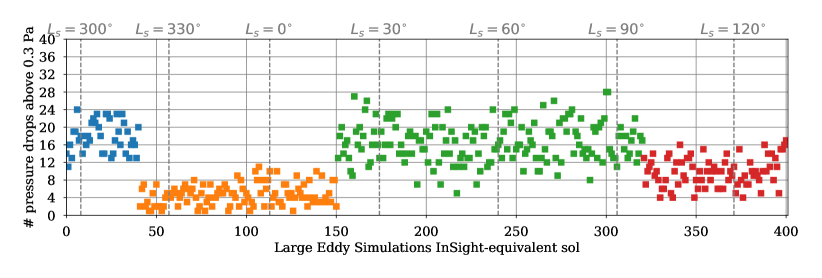
Figure 15 summarizes the emulated “daily” and seasonal variability of convective vortices obtained in LES. This figure is obtained by assembling the four LES cases corresponding to the seasons and the wind conditions experienced by InSight so far: high-wind cases for (Early mission sequence), (early Aphelion season sequence), (late Aphelion season sequence) and low-wind case for (Dust storm and spring sequence). A random selection amongst the 576 available “sols” for each considered case emulates the daily variability.
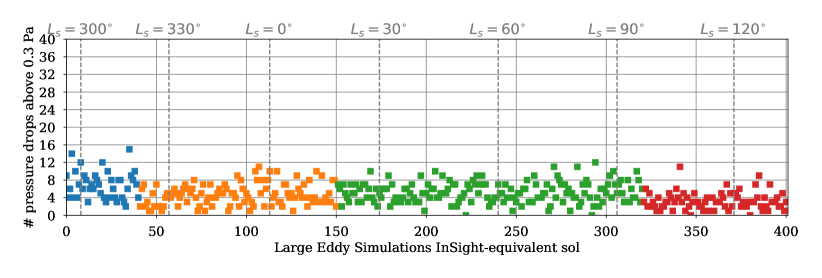
A first remark is that, for all the cases displayed in Figure 15, the typical number of detected vortex encounters per sol is in agreement between the InSight observations and the LES. Secondly, the LES-reconstructed “daily” variability of vortex encounters within a given sequence can be quite large, as is observed by InSight. This shows that the daily variability of vortex encounters observed by InSight can be described in great part by the statistical nature of turbulence. Each sol of InSight observations would be an instance of InSight being placed at a different location in the horizontal structure of the PBL daytime turbulence (exhibited for instance in Figure 13). Thirdly, the overall seasonal variability of convective vortices observed by InSight, and the three above-mentioned sequences, are well reproduced by the set of LES runs. A notable exception is the decrease of vortex encounters at onwards, that is predicted by the LES but not observed by InSight (Figure 9).
5.2 Advection effects
The results in section 5.1 provide confidence that LES are valuable tool to help to interpret the InSight vortex statistics. Can we confirm with LES the conclusion suggested in section 4.2 that ambient wind speed seems to be a dominant driver of the seasonal variability of the number of vortex encounters? Figure 16 shows the LES-generated seasonal plot of vortex variability as in Figure 15, except that the LES runs are considered at the relevant seasons but with the choice of same ambient wind throughout (10 m/s). This figure demonstrates that, if not for the seasonal variability in ambient wind speed, the vortex encounter at the InSight landing should have decreased steadily, following the tendency of surface temperature (see Figure 8). This is a similar tendency as the one drawn for normalized gustiness in section 4.2.2: the surface is colder and colder, meaning the surface infrared flux is lower and lower, thereby reducing the major energy input in the martian PBL (i.e. absorption of surface infrared flux by CO2 particles in the lowest part of the PBL) hence the strength of convective turbulent activity.
LES support the ambient wind speed as the major influence on the seasonal variability of vortex encounters observed at the InSight landing site. Now, as is discussed in section 4.2, the influence of ambient wind speed might be twofold. On the one hand, ambient wind speed influences vortex activity through the advection effect: stronger ambient wind advects more vortices to a given point, making the encounters on a given sol more frequent. On the other hand, ambient wind speed influences vortex activity through the formation rate: stronger wind on Mars could make the sensible heat flux term less negligible compared to the radiative term on the PBL energy budget, hence leading to stronger turbulence and more vortices forming – provided that enhanced shearing effects would not prevent the formation of vortices. We can use the LES to distinguish the two effects in a different fashion than what is permitted by the InSight time series. Instead of a vortex count performed along the time dimension to mimic InSight detections, we performed vortex counting on the whole horizontal LES domain of 144 km2, identifying pressure minima in the complete pressure field as in Figure 13. This allows formation-rate effects to be emphasized, rather than advection effects.
The results are shown in Figure 17. We found that in our LES, for all the four seasons considered and consistently at all relevant local times, fewer convective vortices are forming when the background wind is doubled from 10 to 20 m/s. This could be considered as a counter-intuitive result since large ambient wind speed enhances horizontal vorticity known to be a precursor of convective vortex formation Toigo and Richardson, (2003); Rafkin et al., (2016). Yet, as is mentioned above in the text, this robust conclusion that less vortices form in larger-ambient-wind LES runs could be explained by shearing effects: strong ambient wind is deforming the convective cells and adversely affecting the formation of vortices; in terrestrial field studies, windy days are well-known to be met with far fewer, if any, dust-devil vortex encounters Balme et al., (2012); Kurgansky et al., (2011); Lorenz et al., (2016). Another potential line of explanation is a possible lower longevity of convective vortices in the high-wind case – since vortices would be more short-lived in the high-wind case, fewer of them would be detected in the horizontal LES pressure field. This was also found in the high-resolution terrestrial LES by Giersch et al., (2019): low-wind conditions favor more long-lasting vortices than high-wind conditions.
The analysis of LES thus strongly suggests that the seasonal variability of vortex encounters observed at the InSight landing site is dominated by the seasonal variability of wind speed, most probably through an advection effect.
5.3 Vortex tracks
Although no visible dust devils have been detected by the InSight cameras Banfield et al., (2020), numerous fresh tracks were detected from orbit in the region of the InSight landing site Perrin et al., (2020), sometimes corresponding to tracks identified by InSight cameras (Banerdt et al., (2020) and Charalambous et al., in revision for this issue). Those dark tracks are putatively formed by convective vortices able to lift enough bright dust particles from the surface to make the underlying darker material apparent – although those vortices probably do not carry enough dust particles in their vortical structures to be seen as dust devils by the InSight cameras.
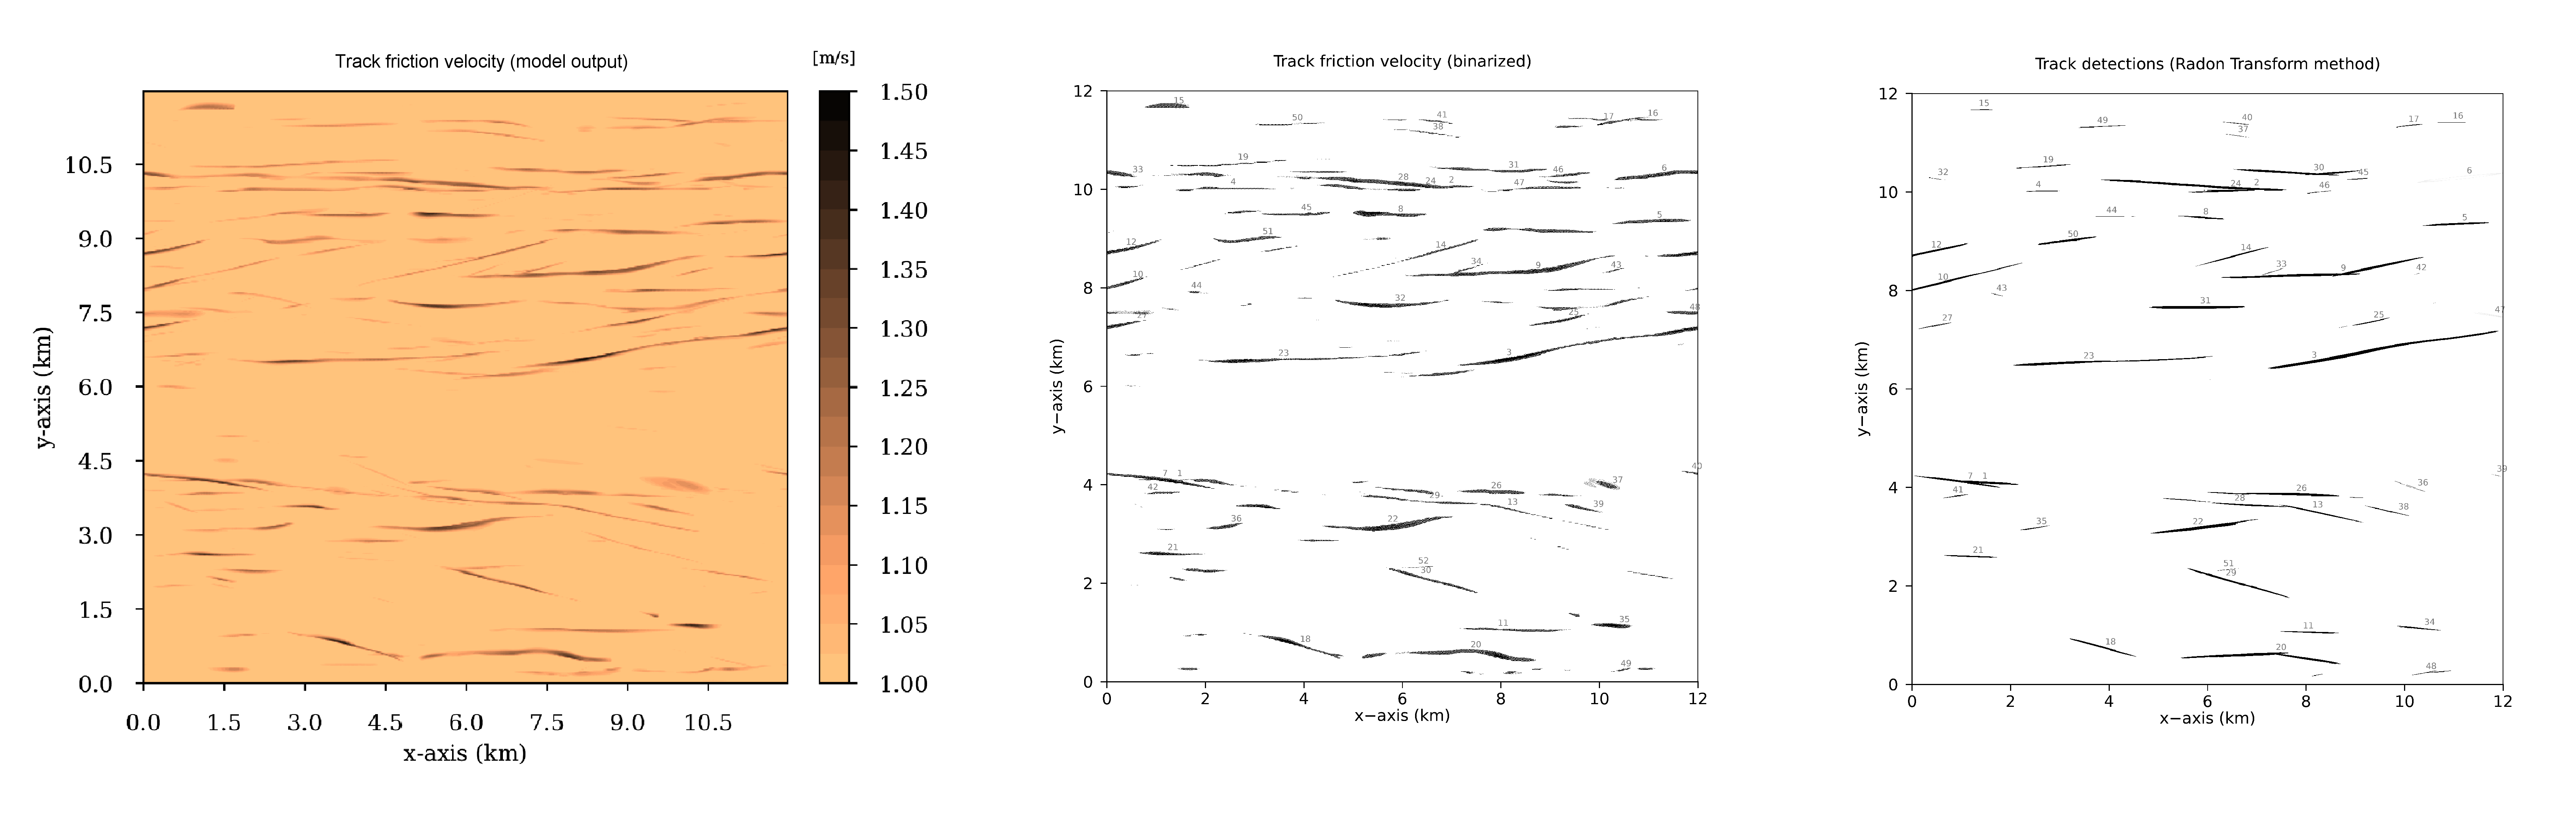
The formation of dark tracks seen from orbit can be emulated by LES. Assuming the above formation mechanism, tracks would correspond to locations where the wind stress would exceed a certain lifting/saltation threshold value (Michaels, (2006); see also Baker et al. in revision for this issue). We show in Figure 18 a possible mapping of tracks produced by our LES integrations, obtained by calculating the maximum of friction velocity (see section 6.1 in Spiga et al., (2018)) at each grid point during an active daytime one-hour interval of the LES simulation. The “contrast” of the image is set by defining the same color for all friction velocities below 1 m/s, this color acting as a proxy for undisturbed martian soil devoid of dark tracks. The “equivalent orbital image” of dark tracks obtained from LES is then analyzed with the exact same semi-automated tracking procedure explained in Perrin et al., (2020).
On Figure 18, a total of 51 tracks are detected on the 144 km2 LES domain within one hour. Considering 6 hours of daytime vortex activity (Figure 6) and assuming for simplicity a constant formation rate, this translates to a maximum track formation rate of 2 tracks per sol per km2. This is clearly much larger than the minimum formation rate of 0.04 - 0.06 tracks per sol per km2 found by Perrin et al., (2020), even considering the very exceptional period of intense dust devil activity at the beginning of the InSight mission (i.e. 0.68 tracks per sol per km2). Actually, this “threshold” value of 1 m/s is chosen to be permissive to detect enough tracks to form a reasonable statistics to compare to images in Perrin et al., (2020) in the next paragraph. A normal track formation rate, like in Perrin et al., (2020) and the pre-landing estimates by Reiss and Lorenz, (2016), yields about 1 track per hour for a LES domain size of 144 km2. This means that only the darkest track in Figure 18, obtained for friction velocities of about 1.4-1.5 m/s (200 values amongst the values output by LES over the considered hour), would correspond to a realistic case of the orbital images of Perrin et al., (2020), which illustrates the stringent conditions for lifting dust particles from the surface in the vicinity of the InSight landing site. This is echoed by the scarcity of surface change events witnessed by InSight cameras, which corresponds to the strongest pressure drops and associated wind gusts monitored by InSight APSS (see Charalambous et al. and Baker et al., in revision for this issue).
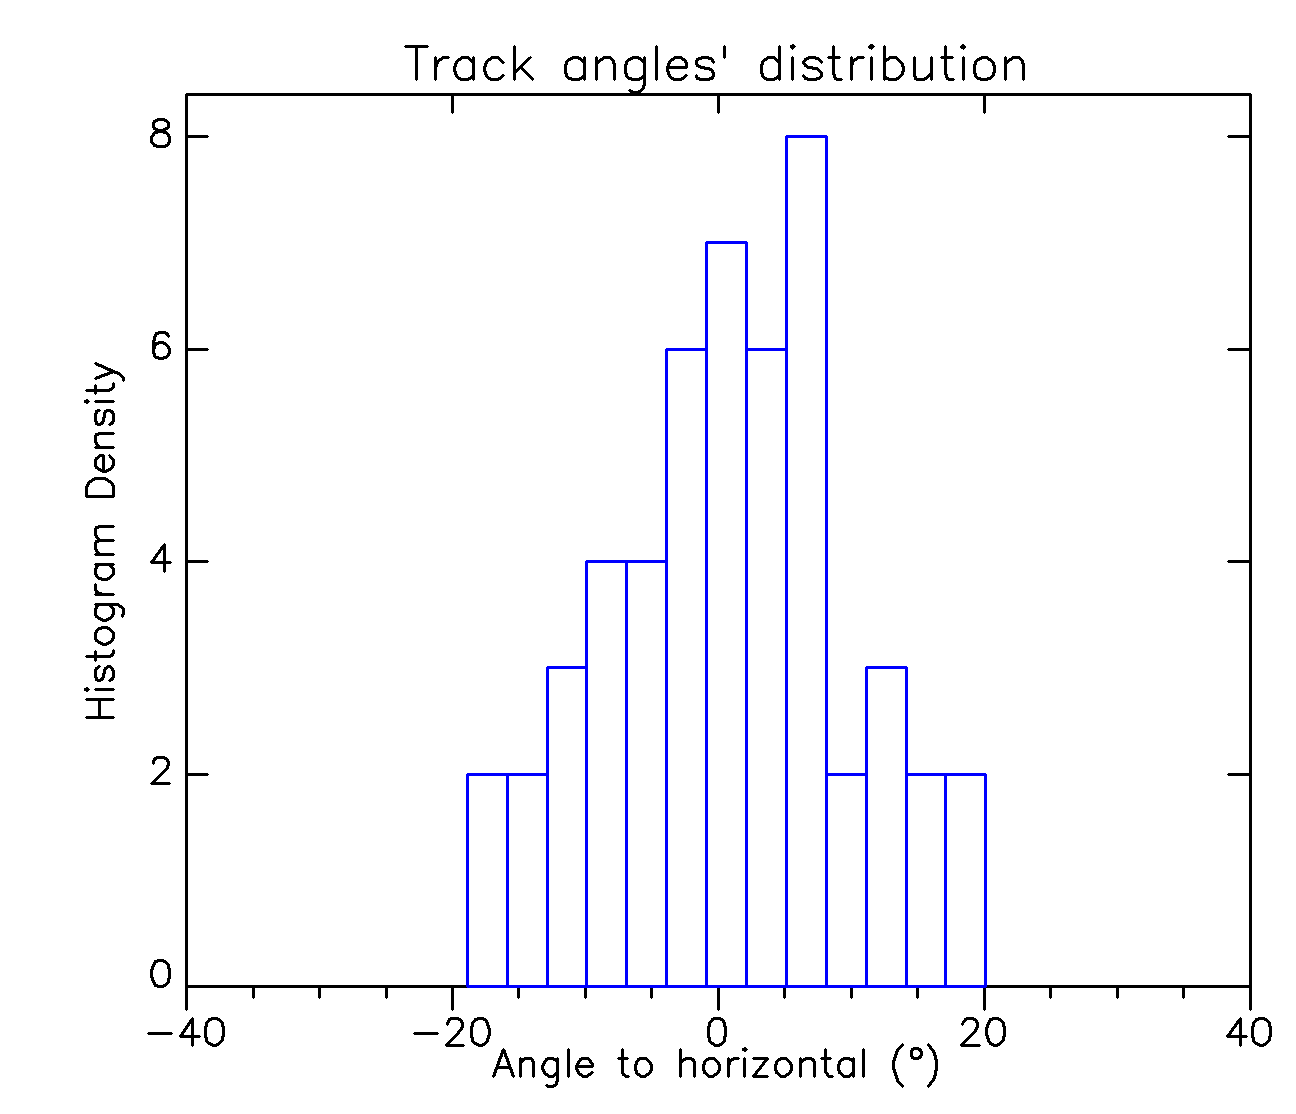
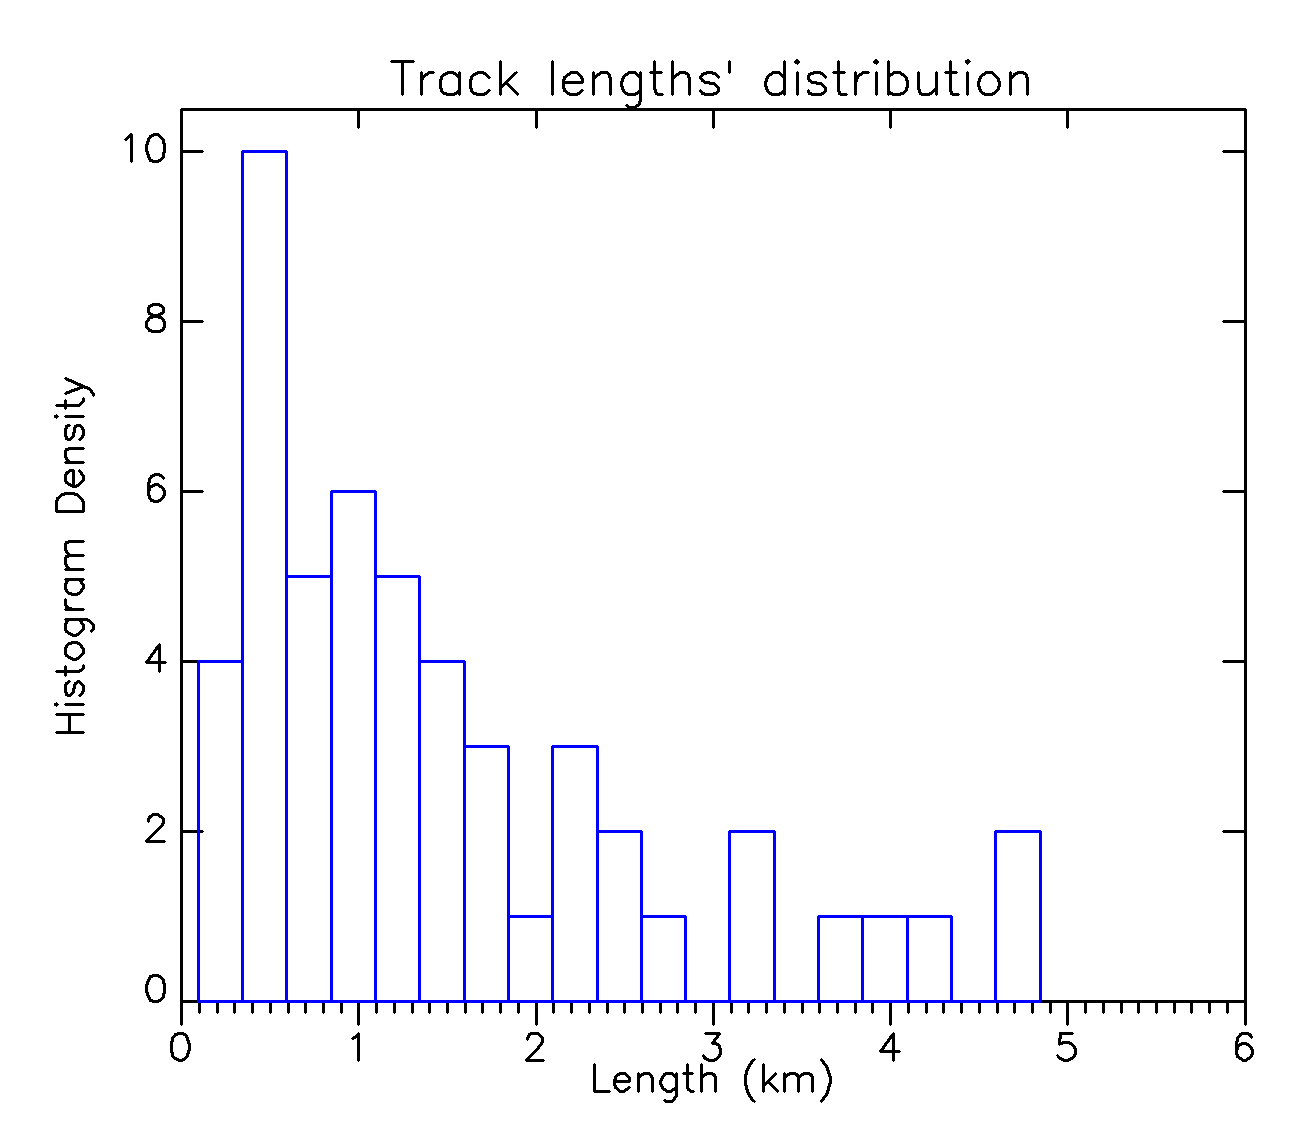
The typical track length (ranging from 500 m to about 5 km) and the distribution angle (ranging 20∘ apart from the ambient wind direction, with a standard deviation of 9∘) are in good agreement with the values obtained with HiRISE orbital images with the same method Perrin et al., (2020). Furthermore, the low standard deviation of tracks under fairly high ambient wind speed (10 m/s) confirm that the linearity of tracks increases with the ambient wind speed (see Balme et al., (2012); Perrin et al., (2020) on Earth and on Mars, respectively).
6 Convective cells and an estimate of the convective PBL depth
The pressure sensor on board InSight is more sensitive than any pressure sensor sent on a lander to Mars Banfield et al., (2018). This allows the signal of convective cells to be detected as quasi-periodic signals in the pressure time series, on longer timescales than vortices and gusts (see Figure 1) because their spatial scales are larger (see the brightest areas in Figure 13). Here we report a first analysis on a typical case, but a more in-depth analysis is warranted in the future.
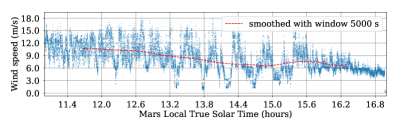
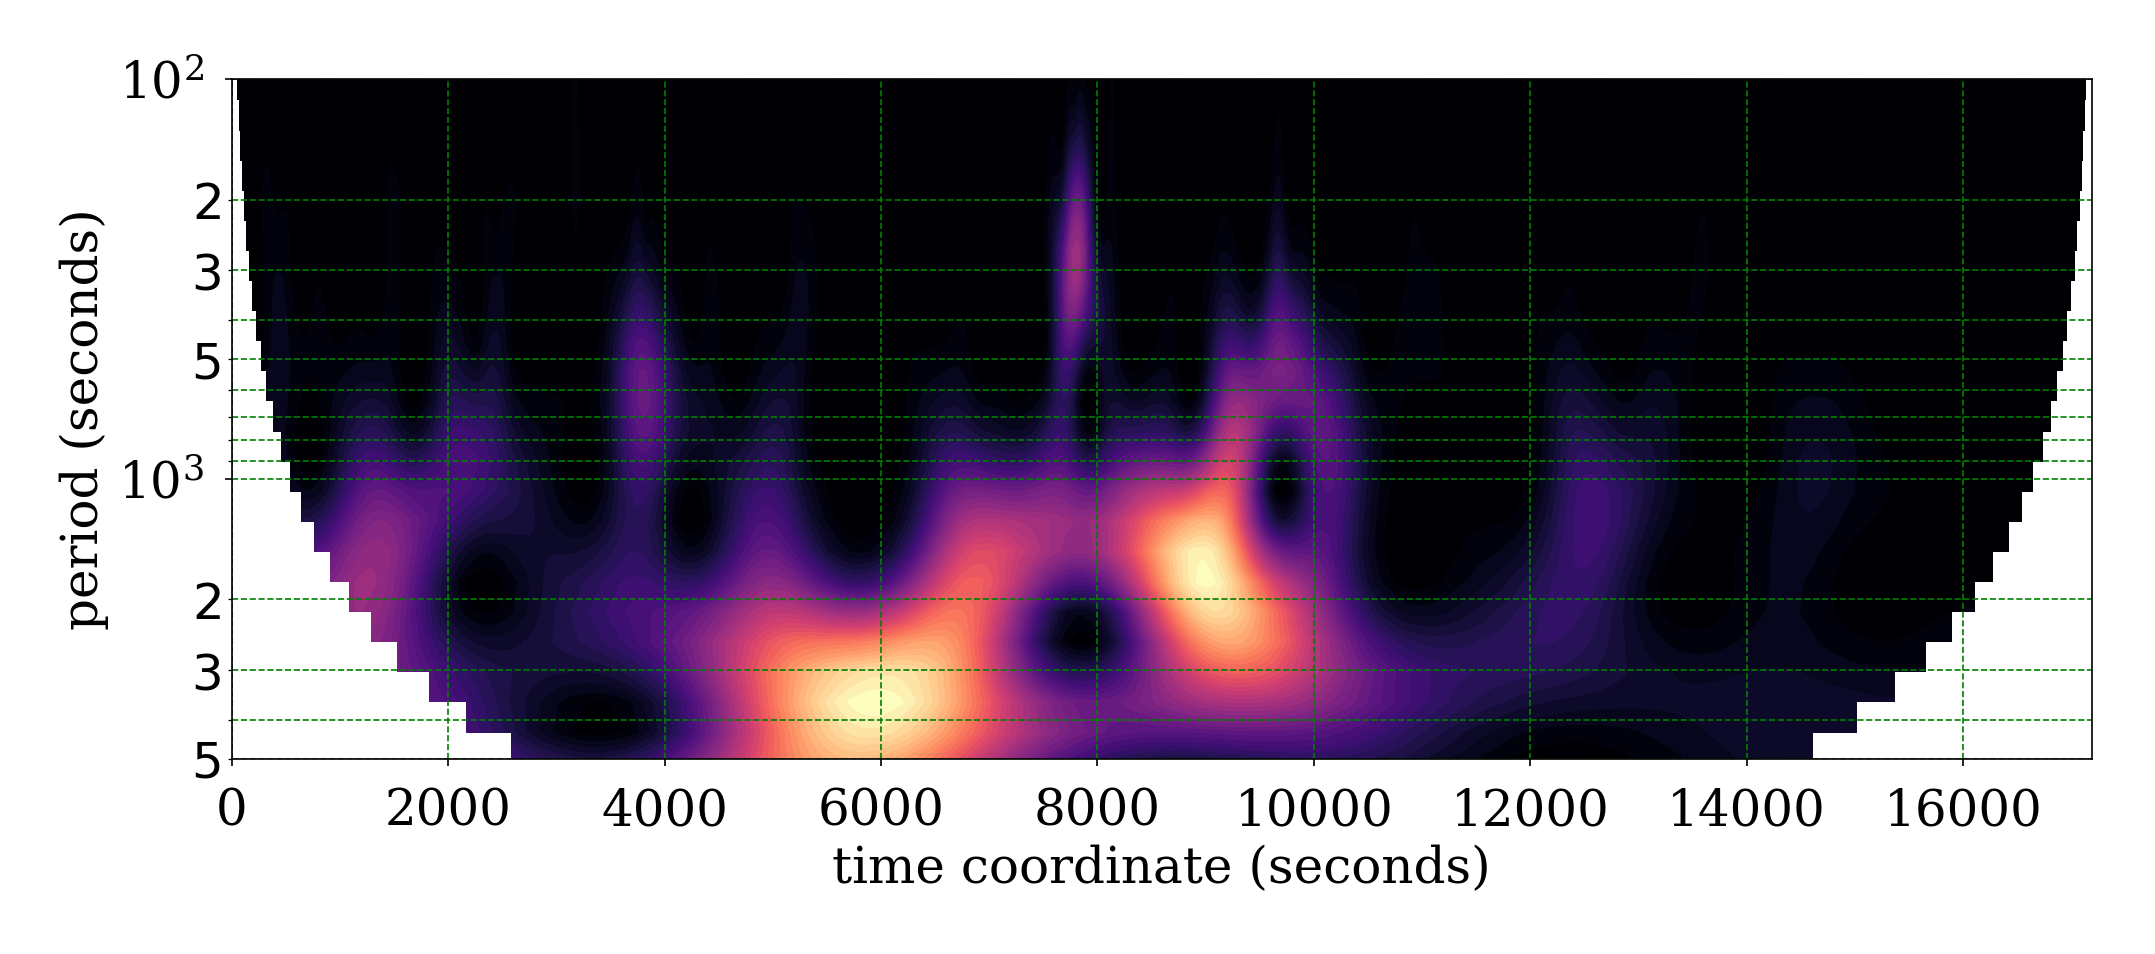
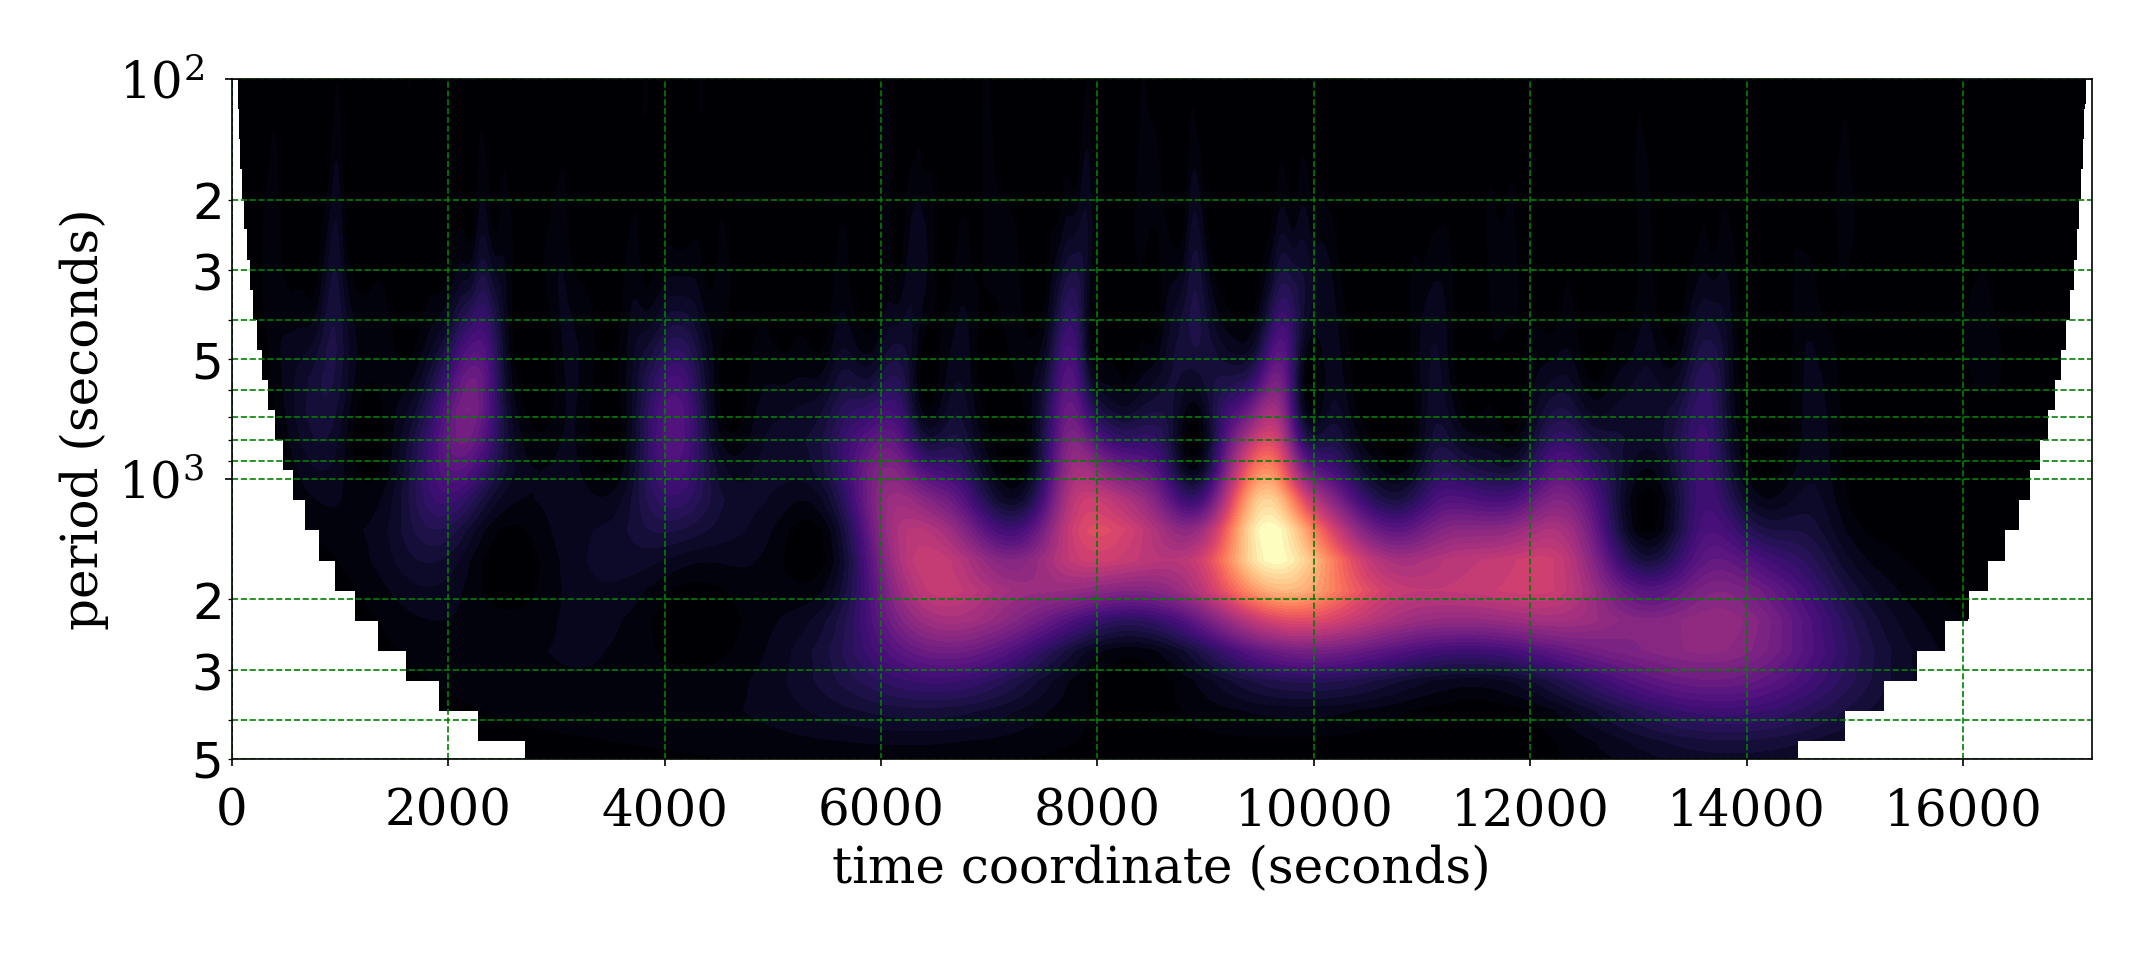
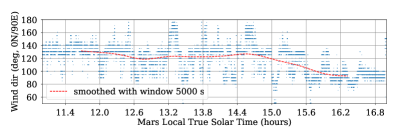
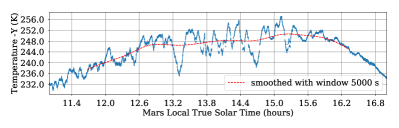
A particularly clear example is provided in Figure 19. On all atmospheric measurements (pressure, wind speed, wind direction, atmospheric temperature), quasi-periodic variations with periods 1500-2000 seconds are observed (a similar signal is also found on the solar array data, see Lorenz et al., 2020a ). This is also observed in the field on Earth Lorenz, (2012) and predicted by Large-Eddy Simulations Spiga, (2012); Spiga et al., (2018).
Quasi-periodic variations of pressure, wind, temperature are caused by the advection of convective cells by the ambient wind. In other words, this signal in the InSight data is another illustration of the key role played by advection of PBL turbulent structures by the ambient wind. The width of convective cells scales with the PBL mixing height (Willis and Deardorff, (1979) found the former is a factor of the latter), hence the quasi-periodic signal makes it possible to estimate the PBL mixing height.
In the case considered in Figure 19, the ambient wind is about 7-8 m s-1 when the quasi-periodic oscillations appear, which means the width of the convective cells (hence, the PBL depth) ranges from 10.5 km to 16 km, assuming direct advection of the cell-induced pressure signatures by the ambient wind speed. It is important to note here that, in a LES case where the PBL depth is known, Spiga, (2012) found that multiplying the quasi-period with the ambient wind yields an estimate of PBL depth that is about twice the real value of the PBL depth deduced from studying the vertical mixing depth in LES (e.g., Spiga et al., (2010)). We conclude that the PBL depth in the case of the InSight observations ranges from 5 km to 8 km, which is typical of active Martian daytime PBL conditions Tillman et al., (1994); Hinson et al., (2008); Fenton and Lorenz, (2015). However, this range is also large and corresponds to the typical regional variability of the PBL depth on Mars Hinson et al., (2008); Spiga et al., (2010); Hinson et al., (2019). Furthermore, the typical PBL depth obtained for the LES with InSight conditions is about 5-6 km, i.e. corresponding to the lower range obtained by the above estimate.
This makes the estimate of PBL depth by the quasi-periodic signal probably valid only to an order of magnitude. As a result, by this method, it was difficult to obtain the variability of the PBL depth with local time and season. Furthermore, the case displayed in Figure 19 is one of the most favorable: while quasi-periodic signals are very often detected in the daytime measurements by InSight, clearly determining their period has resulted to be challenging – especially given the challenges posed by InSight temperature measurements (see section 2.1). A systematic exploration is warranted as future work and considered out of the scope of the present paper.
7 Conclusions
The conclusions of our study may be summarized as follows.
-
1.
High-sensitivity continuous pressure, wind, temperature measurements by InSight exhibit signatures of gusts, convective cells and vortices, associated with daytime Planetary Boundary Layer (PBL) turbulence. InSight measurements can be fruitfully compared to turbulence-resolving Large-Eddy Simulations (LES).
-
2.
Simultaneous quasi-periodic variations of pressure, temperature, and winds, with periods 1000 to 2000 seconds, are attributed to the advection of convective cells by the ambient wind. The typical daytime PBL mixing depth obtained from this signal is in the range 5-8 km.
-
3.
The InSight landing site is particularly prone to vortex encounters. More than 6000 pressure drops deeper than 0.35 Pa are detected in the first 400 sols of InSight operations.
-
4.
The differential distribution of observed vortex-induced pressure drops at the InSight landing can be well represented by a power-law with a 3.4 0.3 exponent, although the power-law fit for the vortices with the deepest pressure drops appears to differ from this whole-population fit.
-
5.
The equivalent distribution in LES is close to InSight observations, exhibiting exponents around 4.
-
6.
With the help of LES, the variability of vortex encounters from one sol to the other at the InSight landing site can be explained in great part by the statistical nature of daytime PBL turbulence.
-
7.
On a seasonal basis, the vortex encounters at the InSight landing site are much more correlated to the ambient wind speed than with the surface temperature and surface-to-atmosphere temperature gradients. This conclusion is supported by LES.
-
8.
Normalized wind gustiness (i.e., standard deviation of wind speed over mean wind speed) is positively correlated to surface temperature rather than sensible heat flux, confirming the radiative control of the daytime martian PBL.
-
9.
An analysis of vortex population in the horizontal pressure field of the LES runs indicates that fewer convective vortices are forming when the background wind is doubled from 10 to 20 m/s.
- 10.
-
11.
Typical tracks followed by vortices forming in the LES show a similar distribution in direction and length as orbital imagery of the InSight region; to match the rate of track formation, only the strongest vortex-induced wind gusts predicted by LES (close to friction velocities 1.5 m s-1) has to lead to bright dust particles being moved on the surface.
The meteorological measurements by the instruments on board InSight make a uniquely rich dataset to study the daytime PBL dynamics, as is already demonstrated by the first 400 sols of InSight operations. It is not possible to fully unleash here, in one study, the potential of the InSight measurements to study atmospheric turbulence. Some conclusions reached in this paper will have to be revisited once a more extended period of time has been monitored by InSight (covering in particular northern fall, the season at which the annual maximum of surface temperature is reached at the near-equator landing site of InSight). We also emphasize here that further comparisons between turbulence-resolving models and in situ high-frequency continuous measurements at the surface of Mars will allow the broadening of knowledge on PBL turbulence both on Mars and elsewhere.
Acknowledgments
All co-authors acknowledge NASA, CNES and its partner agencies and institutions (UKSA, SSO, DLR, JPL, IPGP-CNRS, ETHZ, IC, MPS-MPG) and the flight operations team at JPL, CAB, SISMOC, MSDS, IRIS-DMC and PDS for providing InSight data. The members of the InSight engineering and operations teams are warmly acknowledged for their dedication and hard work in allowing InSight to perform the numerous measurements used in this paper. The first author and all French co-authors acknowledge support from the Centre National d’Études Spatiales (CNES). Additional funding support was provided by Agence Nationale de la Recherche (ANR-19-CE31-0008-08 MAGIS). The modeling part of this work was granted access to the High-Performance Computing (HPC) resources of Centre Informatique National de l’Enseignement Supérieur (CINES) under the allocation A006-0110391 made by Grand Equipement National de Calcul Intensif (GENCI). A portion of this research was carried out at the Jet Propulsion Laboratory, California Institute of Technology, under a contract with the National Aeronautics and Space Administration. Additional work was supported by NASA’s InSight Participating Scientist Program. Spanish co-authors acknowledge funding by the Centro de Desarrollo Tecnológico e Industrial (CDTI), Ministerio de Economía y Competitividad, and the Instituto Nacional de Técnica Aeroespacial (INTA). We thank John Clinton and the Mars Quake Service for monitoring of the atmospheric events in addition to the seismic events.
The datasets produced to obtain the Figures in this study, along with the Python codes used for the data analysis, are available in the citable online archive https://doi.org/10.14768/2ddaba56-cf61-4d5b-83b7-e4a079ed836b hosted at the Institut Pierre-Simon Laplace (IPSL) datacenter. All InSight data used in this study are publicly available in the Planetary Data System. Data from the APSS pressure sensor and the temperature and wind (TWINS) sensor referenced in this paper is publicly available from the PDS (Planetary Data System) Atmospheres node. The direct link to the InSight data archive at the PDS Atmospheres node is: https://atmos.nmsu.edu/data_and_services/atmospheres_data/INSIGHT/insight.html. Surface brightness temperature measured by the HP3 radiometer is publicly available from the PDS Geosciences node: https://pds-geosciences.wustl.edu/missions/insight/hp3rad.htm (DOI reference https://doi.org/10.17189/1517568). The code for the Large-Eddy Simulations carried out for this study is managed on an online repository at LMD (access granted upon request); this paper uses the revision 1937 of the code. This paper is InSight Contribution Number 115.
References
- Balme et al., (2012) Balme, M. R., Pathare, A. V., Metzger, S. M., Towner, M. C., Lewis, S. R., Spiga, A., Fenton, L., Renno, N. O., Elliot, H. M., Saca, F. A., Michaels, T., Russell, P., and Verdasca, J. A. (2012). Field measurements of horizontal forward motion velocities of terrestrial dust devils: towards a proxy for ambient winds on mars and earth. Icarus, 221(2):632–645.
- Banerdt et al., (2020) Banerdt, W. B., Smrekar, S. E., Banfield, D., Giardini, D., Golombek, M., Johnson, C. L., Lognonné, P., Spiga, A., Spohn, T., Perrin, C., Staehler, S. C., co authors, and the InSight team (2020). Initial results from the InSight mission on mars. Nature Geoscience (in press).
- Banfield et al., (2018) Banfield, D., Rodriguez-Manfredi, J. A., Russell, C. T., Rowe, K. M., Leneman, D., Lai, H. R., Cruce, P. R., Means, J. D., Johnson, C. L., Mittelholz, A., Joy, S. P., Chi, P. J., Mikellides, I. G., Carpenter, S., Navarro, S., Sebastian, E., Gomez-Elvira, J., Torres, J., Mora, L., Peinado, V., Lepinette, A., The TWINS Team, Hurst, K., Lognonné, P., Smrekar, S. E., and Banerdt, W. B. (2018). Insight auxiliary payload sensor suite (apss). Space Science Reviews, 215(1):4.
- Banfield et al., (2020) Banfield, D., Spiga, A., and co authors (2020). The atmosphere of mars as observed by InSight. Nature Geoscience.
- Chapman et al., (2017) Chapman, R. M., Lewis, S. R., Balme, M., and Steele, L. J. (2017). Diurnal variation in martian dust devil activity. Icarus, 292:154–167.
- Ellehoj et al., (2010) Ellehoj, M. D., Gunnlaugsson, H. P., Taylor, P. A., Kahanpää, H., Bean, K. M., Cantor, B. A., Gheynani, B. T., Drube, L., Fisher, D., Harri, A.-M., Holstein-Rathlou, C., Lemmon, M. T., Madsen, M. B., Malin, M. C., Polkko, J., Smith, P. H., Tamppari, L. K., Weng, W., and Whiteway, J. (2010). Convective vortices and dust devils at the Phoenix Mars mission landing site. Journal of Geophysical Research (Planets), 115(E14):E00E16.
- Fenton et al., (2016) Fenton, L., Reiss, D., Lemmon, M., Marticorena, B., Lewis, S., and Cantor, B. (2016). Orbital observations of dust lofted by daytime convective turbulence. Space Science Reviews, 203(1):89–142.
- Fenton and Lorenz, (2015) Fenton, L. K. and Lorenz, R. (2015). Dust devil height and spacing with relation to the martian planetary boundary layer thickness. Icarus, 260:246–262.
- Forget et al., (1999) Forget, F., Hourdin, F., Fournier, R., Hourdin, C., Talagrand, O., Collins, M., Lewis, S. R., Read, P. L., and Huot., J.-P. (1999). Improved general circulation models of the Martian atmosphere from the surface to above 80 km. J. Geophys. Res., 104:24,155–24,176.
- Garcia et al., (2020) Garcia, R. F., Kenda, B., Kawamura, T., Spiga, A., Murdoch, N., Lognonné, P. H., Widmer-Schnidrig, R., Compaire, N., Orhand-Mainsant, G., Banfield, D., and Banerdt, W. B. (2020). Pressure Effects on the SEIS-InSight Instrument, Improvement of Seismic Records, and Characterization of Long Period Atmospheric Waves From Ground Displacements. Journal of Geophysical Research (Planets), 125(7):e06278.
- Giersch et al., (2019) Giersch, S., Brast, M., Hoffmann, F., and Raasch, S. (2019). Toward large-eddy simulations of dust devils of observed intensity: Effects of grid spacing, background wind, and surface heterogeneities. Journal of Geophysical Research: Atmospheres, 124(14):7697–7718.
- Golombek et al., (2020) Golombek, M., co-authors (including A. Spiga), and the InSight team (2020). Geology of the InSight landing site, Mars. Nature Communications (in press).
- Gómez-Elvira et al., (2012) Gómez-Elvira, J., Armiens, C., Castañer, L., Domínguez, M., Genzer, M., Gómez, F., Haberle, R., Harri, A.-M., Jiménez, V., Kahanpää, H., Kowalski, L., Lepinette, A., Martín, J., Martínez-Frías, J., McEwan, I., Mora, L., Moreno, J., Navarro, S., de Pablo, M. A., Peinado, V., Peña, A., Polkko, J., Ramos, M., Renno, N. O., Ricart, J., Richardson, M., Rodríguez-Manfredi, J., Romeral, J., Sebastián, E., Serrano, J., de la Torre Juárez, M., Torres, J., Torrero, F., Urquí, R., Vázquez, L., Velasco, T., Verdasca, J., Zorzano, M.-P., and Martín-Torres, J. (2012). REMS: The Environmental Sensor Suite for the Mars Science Laboratory Rover. Space Science Reviews, 170:583–640.
- Haberle et al., (1993) Haberle, R., Houben, H. C., Hertenstein, R., and Herdtle, T. (1993). A boundary layer model for Mars: Comparison with Viking Lander and entry data. Journal of the Atmospheric Sciences, 50:1544–1559.
- Hess et al., (1977) Hess, S. L., Henry, R. M., Leovy, C. B., Ryan, J. A., and Tillman, J. E. (1977). Meteorological results from the surface of Mars: Viking 1 and 2. J. Geophys. Res., 82:4559–4574.
- Hinson et al., (2008) Hinson, D. P., Pätzold, M., Tellmann, S., Häusler, B., and Tyler, G. L. (2008). The depth of the convective boundary layer on Mars. Icarus, 198:57–66.
- Hinson et al., (2019) Hinson, D. P., Tyler, D., Lewis, S. R., Pätzold, M., Tellmann, S., Häusler, B., and Tyler, G. L. (2019). The Martian daytime convective boundary layer: Results from radio occultation measurements and a mesoscale model. Icarus, 326:105–122.
- Holstein-Rathlou et al., (2010) Holstein-Rathlou, C., Gunnlaugsson, H. P., Merrison, J. P., Bean, K. M., Cantor, B. A., Davis, J. A., Davy, R., Drake, N. B., Ellehoj, M. D., Goetz, W., Hviid, S. F., Lange, C. F., Larsen, S. E., Lemmon, M. T., Madsen, M. B., Malin, M., Moores, J. E., Nørnberg, P., Smith, P., Tamppari, L. K., and Taylor, P. A. (2010). Winds at the Phoenix landing site. Journal of Geophysical Research (Planets), 115(12):E00E18.
- Jackson and Lorenz, (2015) Jackson, B. and Lorenz, R. (2015). A multiyear dust devil vortex survey using an automated search of pressure time series. Journal of Geophysical Research (Planets), 120:401–412.
- Jackson et al., (2018) Jackson, B., Lorenz, R., and Davis, K. (2018). A framework for relating the structures and recovery statistics in pressure time-series surveys for dust devils. Icarus, 299:166–174.
- Kahanpää et al., (2016) Kahanpää, H., Newman, C., Moores, J., Zorzano, M.-P., Martín-Torres, J., Navarro, S., Lepinette, A., Cantor, B., Lemmon, M. T., Valentín-Serrano, P., Ullán, A., and Schmidt, W. (2016). Convective vortices and dust devils at the MSL landing site: Annual variability. Journal of Geophysical Research (Planets), 121:1514–1549.
- Kanak, (2006) Kanak, K. M. (2006). On the numerical simulation of dust devil-like vortices in terrestrial and Martian convective boundary layers. Geophys. Res. Lett., 33:19.
- Kenda et al., (2020) Kenda, B., Drilleau, M., Garcia, R. F., Kawamura, T., Murdoch, N., Compaire, N., Lognonné, P., Spiga, A., Widmer-Schnidrig, R., Delage, P., Ansan, V., Vrettos, C., Rodriguez, S., Banerdt, W. B., Banfield, D., Antonangeli, D., Christensen, U., Mimoun, D., Mocquet, A., and Spohn, T. (2020). Subsurface Structure at the InSight Landing Site From Compliance Measurements by Seismic and Meteorological Experiments. Journal of Geophysical Research (Planets), 125(6):e06387.
- Kenda et al., (2017) Kenda, B., Lognonné, P., Spiga, A., Kawamura, T., Kedar, S., Banerdt, W. B., Lorenz, R., Banfield, D., and Golombek, M. (2017). Modeling of ground deformation and shallow surface waves generated by martian dust devils and perspectives for near-surface structure inversion. Space Science Reviews.
- Kurgansky, (2019) Kurgansky, M. V. (2019). On the statistical distribution of pressure drops in convective vortices: Applications to Martian dust devils. Icarus, 317:209–214.
- Kurgansky et al., (2011) Kurgansky, M. V., Montecinos, A., Villagran, V., and Metzger, S. M. (2011). Micrometeorological Conditions for Dust-Devil Occurrence in the Atacama Desert. Boundary-Layer Meteorology, 138(2):285–298.
- Larsen et al., (2002) Larsen, S. E., Jørgensen, H. E., Landberg, L., and et al. (2002). Aspects Of The Atmospheric Surface Layers On Mars And Earth. Boundary-Layer Meteorology, 105:451–470.
- Lognonné et al., (2020) Lognonné, P., co-authors (including A. Spiga), and the InSight team (2020). Constraints on the shallow elastic and anelastic structure of mars from InSight seismic data. Nature Geoscience (in press).
- Lorenz, (2011) Lorenz, R. (2011). On the statistical distribution of dust devil diameters. Icarus, 215:381–390.
- (30) Lorenz, R., Lemmon, M., and co authors (2020a). Scientific observations with the insight solar arrays: Dust, clouds and eclipses on mars. Earth and Space Science.
- Lorenz, (2012) Lorenz, R. D. (2012). Observing desert dust devils with a pressure logger. Geoscientific Instrumentation, Methods and Data Systems, 1(2):209–220.
- Lorenz et al., (2016) Lorenz, R. D., Balme, M. R., Gu, Z., Kahanpää, H., Klose, M., Kurgansky, M. V., Patel, M. R., Reiss, D., Rossi, A. P., Spiga, A., Takemi, T., and Wei, W. (2016). History and Applications of Dust Devil Studies. Space Science Reviews, 203:5–37.
- (33) Lorenz, R. D., Spiga, A., Lognonné, P., Plasman, M., Newman, C. E., and Charalambous, C. (2020b). The whirlwinds of elysium: A catalog and meteorological characteristics of “dust devil” vortices observed by insight on mars. Icarus, page 114119.
- Madeleine et al., (2011) Madeleine, J.-B., Forget, F., Millour, E., Montabone, L., and Wolff, M. J. (2011). Revisiting the radiative impact of dust on Mars using the LMD Global Climate Model. Journal of Geophysical Research (Planets), 116:11010.
- Maki et al., (2018) Maki, J. N., Golombek, M., Deen, R., Abarca, H., Sorice, C., Goodsall, T., Schwochert, M., Lemmon, M., Trebi-Ollennu, A., and Banerdt, W. B. (2018). The color cameras on the insight lander. Space Science Reviews, 214(6):105.
- Martínez et al., (2017) Martínez, G. M., Newman, C. N., De Vicente-Retortillo, A., Fischer, E., Renno, N. O., Richardson, M. I., Fairén, A. G., Genzer, M., Guzewich, S. D., Haberle, R. M., Harri, A.-M., Kemppinen, O., Lemmon, M. T., Smith, M. D., de la Torre-Juárez, M., and Vasavada, A. R. (2017). The modern near-surface martian climate: A review of in-situ meteorological data from viking to curiosity. Space Science Reviews, 212(1):295–338.
- Mason, (1989) Mason, P. (1989). Large-Eddy Simulation of the Convective Atmospheric Boundary Layer. Journal of the Atmospheric Sciences, 46(11):1492–1516.
- Michaels, (2006) Michaels, T. I. (2006). Numerical modeling of Mars dust devils: Albedo track generation. Geophys. Res. Lett., 33:19–+.
- Michaels and Rafkin, (2004) Michaels, T. I. and Rafkin, S. C. R. (2004). Large eddy simulation of atmospheric convection on Mars. Q. J. R. Meteorol. Soc., 130:1251–1274.
- Millour et al., (2015) Millour, E., Forget, F., Spiga, A., Navarro, T., Madeleine, J.-B., Montabone, L., Pottier, A., Lefevre, F., Montmessin, F., Chaufray, J.-Y., Lopez-Valverde, M. A., Gonzalez-Galindo, F., Lewis, S. R., Read, P. L., Huot, J.-P., Desjean, M.-C., and MCD/GCM development Team (2015). The Mars Climate Database (MCD version 5.2). European Planetary Science Congress 2015, 10:EPSC2015–438.
- Moeng et al., (2007) Moeng, C., Dudhia, J., Klemp, J., and Sullivan, P. (2007). Examining Two-Way Grid Nesting for Large Eddy Simulation of the PBL Using the WRF Model. Monthly Weather Review, 135(6):2295–2311.
- Mueller et al., (2020) Mueller, N., Knollenberg, J., and co authors (2020). Calibration of the HP3 radiometer on insight. Earth and Space Science.
- Murdoch et al., (2017) Murdoch, N., Kenda, B., Kawamura, T., Spiga, A., Lognonné, P., Mimoun, D., and Banerdt, W. B. (2017). Estimations of the seismic pressure noise on mars determined from large eddy simulations and demonstration of pressure decorrelation techniques for the insight mission. Space Science Reviews.
- Murphy et al., (2016) Murphy, J., Steakley, K., Balme, M., Deprez, G., Esposito, F., Kahanpää, H., Lemmon, M., Lorenz, R., Murdoch, N., Neakrase, L., Patel, M., and Whelley, P. (2016). Field measurements of terrestrial and martian dust devils. Space Science Reviews, 203(1):39–87.
- Murphy and Nelli, (2002) Murphy, J. R. and Nelli, S. (2002). Mars Pathfinder convective vortices: Frequency of occurrence. Geophys. Res. Lett., 29(23):230000–1.
- Newman et al., (2017) Newman, C. E., Gómez-Elvira, J., Marin, M., Navarro, S., Torres, J., Richardson, M. I., Battalio, J. M., Guzewich, S. D., Sullivan, R., de la Torre, M., Vasavada, A. R., and Bridges, N. T. (2017). Winds measured by the rover environmental monitoring station (rems) during the mars science laboratory (msl) rover’s bagnold dunes campaign and comparison with numerical modeling using marswrf. Icarus, 291(Supplement C):203 – 231.
- Newman et al., (2019) Newman, C. E., Kahanpää, H., Richardson, M. I., Martínez, G. M., Vicente-Retortillo, A., and Lemmon, M. T. (2019). MarsWRF Convective Vortex and Dust Devil Predictions for Gale Crater Over 3 Mars Years and Comparison With MSL-REMS Observations. Journal of Geophysical Research (Planets), 124(12):3442–3468.
- Nishizawa et al., (2016) Nishizawa, S., Odaka, M., Takahashi, Y. O., Sugiyama, K.-i., Nakajima, K., Ishiwatari, M., Takehiro, S.-i., Yashiro, H., Sato, Y., Tomita, H., and Hayashi, Y.-Y. (2016). Martian dust devil statistics from high-resolution large-eddy simulations. Geophysical Research Letters, 43(9):4180–4188. 2016GL068896.
- Ordonez-Etxeberria et al., (2018) Ordonez-Etxeberria, I., Hueso, R., and Sánchez-Lavega, A. (2018). A systematic search of sudden pressure drops on Gale crater during two Martian years derived from MSL/REMS data. Icarus, 299:308–330.
- Perrin et al., (2020) Perrin, C., Rodriguez, S., Jacob, A., Lucas, A., Spiga, A., and co authors (2020). Monitoring of dust-devil tracks around the insight landing site, mars, and comparison with in-situ atmospheric data. Geophysical Research Letters.
- Petrosyan et al., (2011) Petrosyan, A., Galperin, B., Larsen, S. E., Lewis, S. R., Määttänen, A., Read, P. L., Renno, N., Rogberg, L. P. H. T., Savijärvi, H., Siili, T., Spiga, A., Toigo, A., and Vázquez, L. (2011). The Martian atmospheric boundary layer. Reviews of Geophysics, 49:3005.
- Rafkin et al., (2016) Rafkin, S. C. R., Pla-Garcia, J., Kahre, M., Gomez-Elvira, J., Hamilton, V. E., Marín, M., Navarro, S., Torres, J., and Vasavada, A. (2016). The meteorology of Gale Crater as determined from Rover Environmental Monitoring Station observations and numerical modeling. Part II: Interpretation. Icarus, 280:114–138.
- Reiss and Lorenz, (2016) Reiss, D. and Lorenz, R. D. (2016). Dust devil track survey at Elysium Planitia, Mars: Implications for the InSight landing sites. Icarus, 266:315–330.
- Reiss et al., (2014) Reiss, D., Spiga, A., and Erkeling, G. (2014). The horizontal motion of dust devils on Mars derived from CRISM and CTX/HiRISE observations. Icarus, 227:8–20.
- Renno et al., (1998) Renno, N. O., Burkett, M. L., and Larkin, M. P. (1998). A simple thermodynamical theory for dust devils. J. Atmos. Sci., 55:3244–3252.
- Sävijarvi, (1999) Sävijarvi, H. (1999). A model study of the atmospheric boundary layer in the Mars Pathfinder lander conditions. Quarterly Journal of the Royal Meteorological Society, 125(554):483–493.
- Schofield et al., (1997) Schofield, J. T., Crisp, D., Barnes, J. R., Haberle, R. M., Magalhaães, J. A., Murphy, J. R., Seiff, A., Larsen, S., and Wilson, G. (1997). The Mars Pathfinder Atmospheric Structure Investigation/Meteorology (ASI/MET) experiment. Science, 278:1752–1757.
- Skamarock and Klemp, (2008) Skamarock, W. C. and Klemp, J. B. (2008). A time-split nonhydrostatic atmospheric model for weather research and forecasting applications. Journal of Computational Physics, 227:3465–3485.
- Smith et al., (2006) Smith, M. D., Wolff, M. J., Spanovich, N., Ghosh, A., Banfield, D., Christensen, P. R., Landis, G. A., and Squyres, S. W. (2006). One Martian year of atmospheric observations using MER Mini-TES. Journal of Geophysical Research (Planets), 111(E10):12–+.
- Spiga, (2012) Spiga, A. (2012). Comment on ”observing desert dust devils with a pressure logger” by lorenz (2012) - insights on measured pressure fluctuations from large-eddy simulations. Geoscientific Instrumentation, Methods and Data Systems, 1(2):151–154.
- Spiga et al., (2018) Spiga, A., Banfield, D., Teanby, N. A., Forget, F., Lucas, A., Kenda, B., Rodriguez Manfredi, J. A., Widmer-Schnidrig, R., Murdoch, N., Lemmon, M. T., Garcia, R. F., Martire, L., Karatekin, Ö., Le Maistre, S., Van Hove, B., Dehant, V., Lognonné, P., Mueller, N., Lorenz, R., Mimoun, D., Rodriguez, S., Beucler, É., Daubar, I., Golombek, M. P., Bertrand, T., Nishikawa, Y., Millour, E., Rolland, L., Brissaud, Q., Kawamura, T., Mocquet, A., Martin, R., Clinton, J., Stutzmann, É., Spohn, T., Smrekar, S., and Banerdt, W. B. (2018). Atmospheric Science with InSight. Space Science Reviews, 214:109.
- Spiga et al., (2016) Spiga, A., Barth, E., Gu, Z., Hoffmann, F., Ito, J., Jemmett-Smith, B., Klose, M., Nishizawa, S., Raasch, S., Rafkin, S., Takemi, T., Tyler, D., and Wei, W. (2016). Large-Eddy Simulations of Dust Devils and Convective Vortices. Space Science Reviews, 203:245–275.
- Spiga and Forget, (2009) Spiga, A. and Forget, F. (2009). A new model to simulate the Martian mesoscale and microscale atmospheric circulation: Validation and first results. Journal of Geophysical Research (Planets), 114:E02009.
- Spiga et al., (2010) Spiga, A., Forget, F., Lewis, S. R., and Hinson, D. P. (2010). Structure and dynamics of the convective boundary layer on mars as inferred from large-eddy simulations and remote-sensing measurements. Quarterly Journal of the Royal Meteorological Society, 136:414–428.
- Spiga et al., (2011) Spiga, A., Forget, F., Madeleine, J., Montabone, L., Lewis, S. R., and Millour, E. (2011). The impact of Martian mesoscale winds on surface temperature and on the determination of thermal inertia. Icarus, 212:504–519.
- Spohn et al., (2018) Spohn, T., Grott, M., Smrekar, S. E., Knollenberg, J., Hudson, T. L., Krause, C., Müller, N., Jänchen, J., Börner, A., Wippermann, T., Krömer, O., Lichtenheldt, R., Wisniewski, L., Grygorczuk, J., Fittock, M., Rheershemius, S., Spröwitz, T., Kopp, E., Walter, I., Plesa, A. C., Breuer, D., Morgan, P., and Banerdt, W. B. (2018). The heat flow and physical properties package (hp3) for the insight mission. Space Science Reviews, 214(5):96.
- Steakley and Murphy, (2016) Steakley, K. and Murphy, J. (2016). A year of convective vortex activity at Gale crater. Icarus, 278:180–193.
- Tillman et al., (1994) Tillman, J. E., Landberg, L., and Larsen, S. E. (1994). The boundary layer of Mars : fluxes stability, turbulent spectra and growth of the mixed layer. J. Atmos. Sci., 51(12):1709–1727.
- Toigo and Richardson, (2003) Toigo, A. D. and Richardson, M. I. (2003). Meteorology of proposed Mars Exploration Rover landing sites. J. Geophys. Res., 108(E12):8092–+.
- Torrence and Compo, (1998) Torrence, C. and Compo, G. P. (1998). A practical guide to wavelet analysis. Bulletin of the American Meteorological society, 79(1):61–78.
- Viúdez-Moreiras et al., (2019) Viúdez-Moreiras, D., Gómez-Elvira, J., Newman, C. E., Navarro, S., Marin, M., Torres, J., de la Torre-Juárez, M., and MSL Team (2019). Gale surface wind characterization based on the Mars Science Laboratory REMS dataset. Part I: Wind retrieval and Gale’s wind speeds and directions. Icarus, 319:909–925.
- Viúdez-Moreiras et al., (2020) Viúdez-Moreiras, D., Newman, C. E., Forget, F., Lemmon, M., Banfield, D., Spiga, A., Lepinette, A., Rodriguez-Manfredi, J. A., Gómez-Elvira, J., Pla-García, J., Muller, N., Grott, M., and the TWINS/InSight team (2020). Effects of a large dust storm in the near-surface atmosphere as measured by insight in elysium planitia, mars. comparison with contemporaneous measurements by mars science laboratory. Journal of Geophysical Research: Planets, 125(9):e2020JE006493. e2020JE006493 2020JE006493.
- Willis and Deardorff, (1979) Willis, G. and Deardorff, J. (1979). Laboratory observations of turbulent penetrative-convection planforms. Journal of Geophysical Research, 84(C1):295–302.