Electromagnetically Induced Transparency in a mono-isotopic 167Er:7LiYF4 crystal below 1 Kelvin
Abstract
Electromagnetically induced transparency allows for controllable change of absorption properties which can be exploited in a number of applications including optical quantum memory. In this paper, we present a study of the electromagnetically induced transparency in 167Er:6LiYF4 crystal at low magnetic fields and ultra-low temperatures. Experimental measurement scheme employs optical vector network analysis which provides high precision measurement of amplitude, phase and pulse delay. We found that sub-Kelvin temperatures are the necessary requirement for studying electromagnetically induced transparency in this crystal at low fields. A good agreement between theory and experiment is achieved taking into account the phonon bottleneck effect.
I Introduction
Electromagnetically induced transparency (EIT) is a quantum interference effect which can be observed in a multilevel atomic system where the interference of two different excitation pathways leads to appearance of a narrow transparency window inside the atomic absorption spectrum Harris (1997); Fleischhauer et al. (2005). Such a controllable change of absorption properties, which is accompanied by a strong dispersion and enhanced nonlinearity, can be used in a number of fascinating applications including slow light Kash et al. (1999); Hau et al. (1999); Budker et al. (1999), optical storage Liu et al. (2001); Phillips et al. (2001) and quantum memory (QM) Chanelière et al. (2005); Eisaman et al. (2005). In particular, the latter is currently considered as a basic ingredient for long-distance quantum communication via quantum repeaters and for scalable optical quantum computers, which makes it a topic of active research Bussières et al. (2013); Heshami et al. (2016). In this respect, significant experimental progress has been achieved in demonstrating EIT-based QM in cold atomic ensembles Chen et al. (2013); Vernaz-Gris et al. (2018); Hsiao et al. (2018); Wang et al. (2019). On the other hand, among the most discussed systems suitable for memory implementation are solids doped with rare-earth (RE) ions Thiel et al. (2011), which exhibit extremely long spin coherence times at low temperatures Zhong et al. (2015), high optical densities, and compatibility with photonic integrated circuits Zhong et al. (2017). Moreover, solids doped with Kramers RE ions (ions having even number of electrons) provide optical transitions inside telecom bands thereby making frequency conversion unnecessary, and hyperfine transitions in 1-10 GHz range that is compatible with microwave quantum photonics. Therefore, studying EIT in these materials is of interest for both developing optical QM and interfacing to superconducting quantum devices.
EIT has been extensively studied in the crystals doped with praseodymium ions Ham et al. (1997); Ichimura et al. (1998); Turukhin et al. (2001); Longdell et al. (2005); Akhmedzhanov et al. (2006); Goldner et al. (2009); Heinze et al. (2013); Schraft et al. (2016); Fan et al. (2019), but much less in those doped with Kramers RE ions such as erbium and neodymium Baldit et al. (2010); Akhmedzhanov et al. (2018). In the present work, we report the first observation of EIT in a mono-isotopic 167Er3+:7LiYF4 (Er:LYF) crystal. Isotopically purified LYF crystals, where only the 7Li isotope is present, have long been known for their ultra-narrow optical inhomogeneous broadening ( MHz) Macfarlane et al. (1992, 1998); Thiel et al. (2011); Kukharchyk et al. (2018a). Due to this feature, the hyperfine structure of the optical transitions can be clearly resolved so that observing EIT needs no special ensemble preparation using spectral hole burning. For the same reason, the system is very attractive for implementing off-resonant Raman quantum memory protocols Moiseev and Tittel (2011); Moiseev (2013); Zhang et al. (2013); Kalachev and Kocharovskaya (2013); Zhang et al. (2014), and studying EIT in this crystal may be considered as the first step towards their realisation.
The optical/spin coherence properties of LYF system were studied in 1990’s Ganem et al. (1991); Meltzer et al. (1993). Today, LYF crystals are again in the focus of spectroscopic research, but now within the context of QM applications Gerasimov et al. (2016); Marino et al. (2016); Akhmedzhanov et al. (2016); Kukharchyk et al. (2018b); Akhmedzhanov et al. (2018). It turns out that Er:LYF system is a quite challenging material, because it requires high magnetic field T at low temperature K for establishing optical coherence time at s timescale Ganem et al. (1991); Meltzer et al. (1993); Marino et al. (2016). In our recent work, however, we have demonstrated an increase of optical coherence time by deep freezing of the crystal to ultra-low temperatures, i.e., K Kukharchyk et al. (2018b), and by taking advantage of an optical clock transition that appears at a low magnetic field. In the present work, we use the same approach with respect to spin transitions of the impurity ions, which makes it possible to observe EIT in Er:LYF crystal below 1 Kelvin by identifying a -system with a zero-first-order-Zeeman (ZEFOZ) spin transition. In doing so, we use the optical vector network analysis (OVNA) technique Marpaung et al. (2013); Kukharchyk et al. (2018a), which provides high-precision measurements of absorption and dispersion properties of the EIT medium.
II Experimental setup
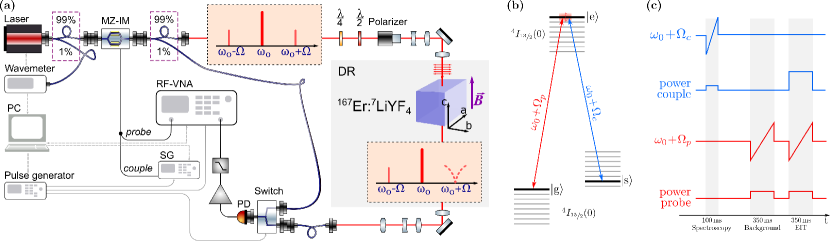
We investigate a single Er:LYF crystal doped with 0.0025% atomic concentration of 167Er3+ ions. The crystal is grown by Bridgman-Stockbarger method as described in Kukharchyk et al. (2018b) and has dimensions of 5 mm x 5 mm x 5 mm. The crystal axis is directed along the applied magnetic field and along the light propagation direction, see Fig. 1(a). The crystal is thermally anchored to the mixing chamber of the dilution refrigerator by using a silver-based conducting glue, see Ref. Kukharchyk et al. (2018b) for further detail.
For the optical spectroscopy and for the observation of EIT we employ OVNA setup, as outlined in Fig. 1(a). The erbium doped free running fiber laser (NKT Photonics Adjustik E15) emits a continuous signal at GHz, which corresponds to the transition of the 167Er impurity ions. The laser field is polarized perpendicular () to the crystal axis. The laser frequency is stabilized by using an optical wavelength-meter (High-Finesse WS6-200). Signals emitted by a radio-frequency vector network analyzer (RF-VNA) and a radio-frequency signal generator (SG) modulate the laser field via a Mach-Zehnder intensity modulator (MZ-IM). This scheme employs the homo-heterodyne measurement technique, as described in Kukharchyk et al. (2018a). The modulated optical signal contains three frequencies (carrier and two sidebands) out of which only one sideband interacts with the crystal. The carrier frequency is far-detuned from the absorption feature. The resulting beat signal is then detected by a high speed InGaAs photoreceiver, filtered on undesired higher order beats, amplified and returned to the VNA. The background is analysed by putting a small portion of the modulated light directly to the photoreceiver.
The described OVNA method allows to simplify construction of the setup for heterodyne detection and guarantees a phase match of the sidebands with the main frequency, where the last one serves as the heterodyne. The VNA provides the fast and direct extraction of the amplitude, phase and electrical delay of the signal with a high precision. Implementation of this method narrows down the gap between the optical and microwave fields. Though in general this method requires a post-processing of the measured signal, see Kukharchyk et al. (2018a), in case of small amplitudes and phases, the signal can be treated as undistorted with a simple polynomial conversion of the absorption dB-signal into optical depth.
The measurement sequence for the EIT contains three data-readout steps, see Fig. 1(c). First step is spectroscopy on the coupling transition, see Fig. 1(b) for energy level schematics, which allows to obtain the frequency of the coupling transition via fitting the spectral line and thus allows to minimize the detuning of the coupling transition at each measurement step. Following after several seconds delay on the device reconfiguration, the absorption on the probe transition is first measured with the couple laser off and with the probing intensity of 0.2 W cm-2, which is the second step of the measurement sequence. At the third step, the second absorption profile on is measured with the coupling beam of 6.5 W cm-2 intensity on the transition.
III Optical spectroscopy
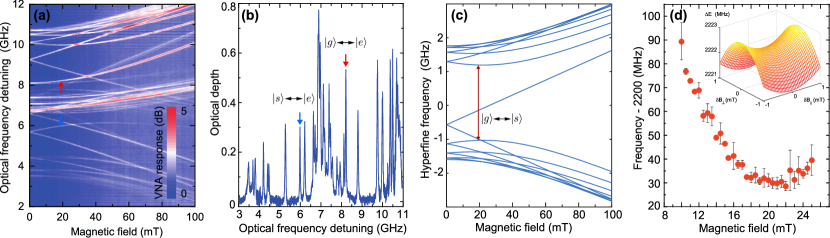
The absorption spectrum of transition is measured as a function of the longitudinal magnetic field in the range from 0 to 100 mT at the base temperature of the dilution refrigerator, shown in Fig. 2(a). Three groups of lines can be identified at higher fileds. Two groups at frequencies below 5 GHz and above 9 GHz correspond to the two transitions with spin-flip, and respectively. The third, central, group of lines covering frequencies between 5 GHz and 9 GHz has small g-factors and corresponds to the transitions without spin-flip, .
The structure of the optical spectrum is determined by the Zeeman splitting of the ground- and excited-state Kramers doublets of 167Er and hyperfine interaction. To simulate it, we take advantage of the effective spin Hamiltonian for the ground and excited states:
| (1) | |||||
where is the Bohr magneton; and are the components of the factor parallel and perpendicular to the axis, respectively; are the components of the external magnetic field; and are the electron- and nuclear-spin operators, respectively; and are the hyperfine parameters; and is the quadrupole constant. Here is the effective electron spin, and is the nuclear spin for 167Er. The ground state parameters have long been known from EPR measurements Sattler and Nemarich (1971): MHz, MHz, and . The excited state parameters can be determined from the measured optical spectra by a fitting procedure as was done in Macfarlane et al. (1992, 1998). As a result, for the excited state we obtain MHz, MHz, MHz, and . The value of is close to the previously estimated values of 1.52 Gerasimov et al. (2016) and 1.6 Marino et al. (2016).
In possession of the effective spin Hamiltonian parameters for the ground and excited states, we are able to find an appropriate structures of optical transitions for observing EIT. For the longest spin coherence times to be achieved, it is desirable to use the zero first order Zeeman (ZEFOZ) transitions Fraval et al. (2004); Lovrić et al. (2011); McAuslan et al. (2012); Zhong et al. (2015); Ortu et al. (2017), while the most efficient Raman interaction requires symmetrical structure. Numerics show that both conditions can be satisfied in the present crystal at the longitudinal magnetic field of about 20 mT. In this case, a couple of hyperfine sublevels of the ground state, namely
| (2) | |||||
| (3) |
(here are the eigenstates of the Hamiltonian in Eq. 1), form ZEFOZ transition, while the hyperfine sublevel of the excited state
| (4) |
is equally coupled to only these states thereby providing a symmetric and isolated -structure.
Absorption spectrum at 20 mT is demonstrated in Fig. 2(b), where optical transitions forming the -structure are marked by red arrows. The observed difference of optical depth is due to equilibrium population distribution between sublevels and at low temperature. The linewidth of both optical transitions is about 32 MHz.
The simulated structure of the spin-levels is plotted in Fig. 2(c), indicating the point of ZEFOZ transition by red arrow. Frequency of the microwave transition is extracted from the frequency difference of the probe and couple transitions at each magnetic field value is plotted in Fig. 2(d). We observe the expected ZEFOZ point at approximately 20 mT, where the microwave frequency takes minimal value. The inset shows the simulated spin transition frequency in dependence on the detuning of the magnetic field from the ZEFOZ point, where longitudinal, , and transverse, , detunings are along and perpendicular to the axis, respectively.
IV Electromagnetically induced transparency
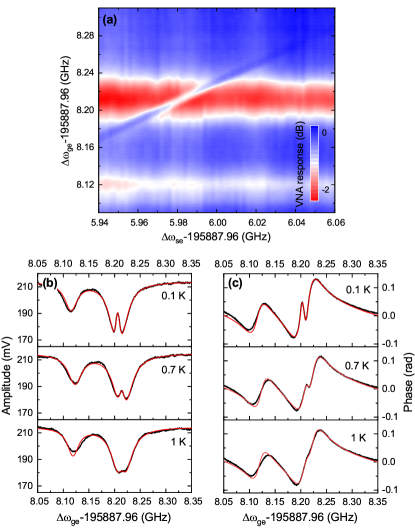
The EIT feature appears when the coupling frequency is swept through the resonance, as shown in Fig. 3(a). The probe transition appears as wide red line at approx. 8.21 GHz. At 8.12 GHz we have another week absorption line which is close to the probe transition and is, thus, fit together with it. The observed EIT resonance, as shown in Fig. 3(b,c), vanishes with increase of temperature and does not reveal any superhyperfine structure. Previously, the superhyperfine structure was found in the Electron Paramagnetic Resonance spectra of Nd:LiYF4 crystals Aminov et al. (2013). Recently, splitting of the EIT line into 9 lines due to the superhyperfine interaction has been observed by Akhmedzhanov et. al. Akhmedzhanov et al. (2018) in monoisotopic Nd:LiYF4. While Nd and some other rare earth ions, e.g. Ce and Yb, revealed superhyperfine structure in LiYF4 and other substrates, observation of superhyperfine structure in Er:LiYF4 spectra has not been reported yet. We did not observe any signature of the superhyperfine interaction in the EIT feature as well. This is explained by large broadening of the spin line, 5 MHz, which cannot be further reduced even when working at the clock transition and sub-Kelvin temperatures and, thus, leads to the smearing out of the superhyperfine structure.
We derive the amplitude and the phase of the EIT spectrum by fitting the experimental data to the OVNA model as explained in Kukharchyk et al. (2018a). Absorption depth and phase of the EIT spectral feature are derived as imaginary, , and real, , parts of the susceptibility. We then fit the experimental data to the OVNA model Kukharchyk et al. (2018a) as follows:
| (5) | |||||
| (6) |
The imaginary and real parts of the susceptibility are derived from Goldner et al. (2009):
| (7) |
where and are the detunings of the probe and coupling beams, respectively; is the coupling Rabi frequency. and are the linewidths of the excited, , and auxiliary, , states, respectively, and comprise of the natural linewidth , dephasing rate , and the inhomogeneous broadening as follows:
| (8) |
We further use the notation and , which are the full width at half maximum (FWHM) of the optical and spin transitions, respectively. The dephasing component of the both decay rates, , is then sensitive to the direct and indirect flip-flops and to the direct and phonon bottleneck processes.
We have measured the EIT feature in the range of magnetic field from 10 mT to 25 mT and in the temperature range from 100 mK to 1 K at the magnetic field of 19 mT. Fitting the experimental data to Eqs. (5-7) allows to extract the optical and spin FWHM linewidth, and coupling strength . The group delay is derived directly by the RF-VNA as . Examples of the fits of the absorption amplitude and phase profiles at three selected temperatures are shown in Fig.3(b,c). Fitting of the transition at 8.12 GHz simultaneously with the EIT-line allows for better precision of the derived parameters.
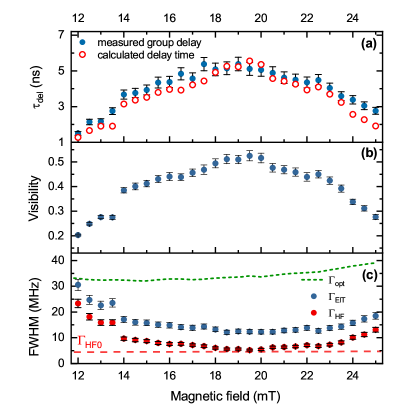
Extracted optical and spin linewidths are shown in Fig. 4(c) and Fig. 5(c). The optical linewidth does not depend on temperature and shows weak broadening with an increase of the magnetic field: at 19 mT it equals MHz and increases up to MHz at 25 mT. Such increase is related to the inhomogeneity of the g-factor, , which leads to an associated broadening . On change of the magnetic field, takes minimal value in the vicinity of the ZEFOZ point. Converse to the , the group delay and visibility increse when approaching ZEFOZ point. The coupling frequency is independent of the magnetic field and temperature and equals MHz, which proves that we work in the pure EIT regime, .
In the vicinity of the ZEFOZ transition, the dependence of on decoherence and relaxation processes is overshadowed by the sensitivity of the spin system to the fluctuations of the magnetic field amplitude caused by the flip-flops, which is given by gradient, , and curvature, , of the spin transition frequency in the magnetic field Kukharchyk et al. (2018b):
| (9) |
where is the detuning of the magnetic field from the ZEFOZ point, and is the detuning-independent inhomogeneous broadening of microwave transition. The amplitude of the magnetic noise, , is the total amplitude of the external magnetic field fluctuations experienced by the erbium ions over the time of the measurement. Equation (9) does not include any linear inhomogeneous spin broadening associated with the g-factor inhomogeneity, Kukharchyk et al. (2018b). We can nevertheless assume that it is similar to the broadening of the optical linewidth and becomes relevant only at the magnetic fields above 23 mT, see Fig. 4(c). Values of the curvature, , and gradient, , are extracted from the absorption spectra of the spin transition, see Fig. 2(d). Inserting these values into Eq. (9), we derive the minimal broadening of the spin transition, MHz, and the magnitude of the magnetic noise, mT.
In order to obtain the visibility of the EIT signal, , and the width of the EIT transparency window, , we use the theory published in Refs. Kuznetsova et al. (2002); Fan et al. (2019), in which the standard model in Eq. (7) is generalized for the inhomogeneously broadened solid-state system. For large inhomogeneous spin broadening, the linewidth of the EIT feature is larger than the spin linewidth and depends on the ratio of the square of coupling strength to the product of optical and spin broadenings Kuznetsova et al. (2002):
| (10) |
The EIT linewidth is thus broader than the spin width by the add-up of MHz. The EIT visibility is derived as Kuznetsova et al. (2002):
| (11) |
In the vicinity of the ZEFOZ point, mT, we have MHz which gives maximum visibility of . We observe the visibility reduction when detuning the magnetic field from the ZEFOZ point, Fig. 4(b), and with the increase of the temperature, Fig. 5(b), so that the EIT feature is well-visible below 0.7 K, see Fig. 3(b). In order to attain , the coupling strength must be much larger than the optical and microwave inhomogeneities, , which is not feasible at our experimental condition.
V Temperature dependence of the spin width
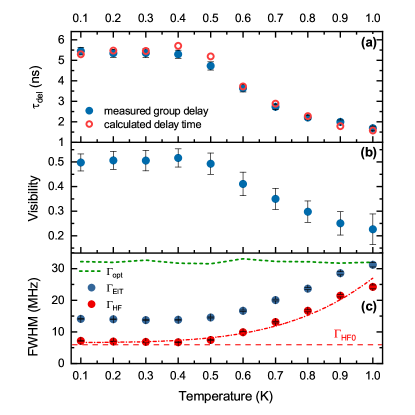
Temperature dependence of the EIT parameters is measured in the range from 0.1 K to 1 K at 19 mT and is plotted in Fig. 5. Width of the optical transition remains constant in the full range of temperatures, MHz, see Fig. 5(c). Width of the spin transition increases with the increase of temperature, while visibility decreases, as shown in Fig. 5(b).
The spin linewidth decreases with the decrease of temperature till it saturates below 0.5 K, which is associated with reaching the minimal attainable temperature of the sample, . The temperature dependence of below 1 K can be governed by spin-flip process, direct process and phonon bottleneck process. In some works, the phonon bottleneck (PB) has already been observed when studying optical coherence Kukharchyk et al. (2019) and spin relaxation Budoyo et al. (2018) phenomena in Er:Y2SiO5 below 1 K. In the previous study of optical coherence in 166Er:LiYF4 below 1 K Kukharchyk et al. (2018b), in the absence of a reliable model for effective temperature, it was not possible to extract the flip-flop and bottleneck rates from the experimental data.
According to the present study, the dependence of the on temperature is dominated by the bottleneck process, which is associated with the presence of non-equilibrium phonons (NQP). Both NQP and PB describe influence of the same physical phenomenon on relaxation and coherence in the spin ensemble. Speaking of the line-broadening due to the PB, we stick to the term of the non-equilibrium phonons, which are the actual source of the effects. Line broadening due to the NQP can be described as Graf et al. (1998); Abragam and Bleaney (1970):
| (12) |
where nm2 is the collision cross-section of the phonons Wu et al. (2013); Graf et al. (1998), Minisini et al. (2005), is the frequency of the microwave transition, is the linewidth of the spin transition, and K. Based on Eq. (12), we fit to the following expression:
| (13) |
where is the NQP-independent linewidth, is the dimensionless coefficient.
In our previous studies of optical coherence in Erbium-doped crystals below 1 K, we found that the temperature in vicinity of the excited Erbium ensemble differs from what we measure on the temperature sensor on the cryostat. Therefore, we introduce an effective temperature, , which is the true temperature of the spin-ensemble and is given by Kukharchyk et al. (2019)
| (14) |
where is the minimal temperature attained by the sample at particular experimental conditions.
The fitting results are shown in Fig. 5(c). The obtained parameters agree quite well with the expected values: MHz, , and K. Current results suggest that presence of NQP is major limiting factor for coherence at milli-Kelvin temperatures.
VI Group delay
Dispersive properties of an EIT medium are attrctive in application to the variable time-delays and the on-demand storage and retrieval of optical pulses Novikova et al. (2012); Fleischhauer et al. (2005). These is possible due to reduction of the group velocity of light when EIT is achieved. In OVNA experiment, the group delay is directly calculated by the VNA: for each frequency segment, VNA detects change of the phase of the received signal with respect to the initial phase. This method offers a straightforward way of direct identification of the delay associated with the slowdown of the light pulses in EIT medium.
Slow light is associated with the concept of dark polaritons: simultaneous propagation of the light and spin waves with reduced speed Fleischhauer and Lukin (2002). The contribution of spin component in the polariton state is proportional to the collective light-ion coupling strength , which is estimated as MHz, where the transition dipole moment equals Cm, is the optical frequency of the probe field, and cm-3 is the concentration of the atoms. The relative contribution of the optical component is described by so called mixing angle, which reads as and equals to under present experimental conditions, which means that most of the energy is concentrated in the spin component Fleischhauer and Lukin (2002). The delay time estimated in terms of polariton propagation is Fleischhauer and Lukin (2002); Kuznetsova et al. (2002), where is the speed of light in vacuum. Calculated values are presented in Fig. 4(a) and Fig. 5(a). We find very good correlation of the experimental and theoretical values.
VII Conclusion
In conclusion, we have presented a detailed study of electromagnetically induced transparency (EIT) in mono-isotopic 167Er:LiYF4 crystal measured at sub-Kelvin temperatures. We have found that the EIT process at low magnetic fields can only be observed at milli-Kelvin temperatures. The detected transparency window has a minimal FWHM linewidth of 12 MHz and maximal transparency of 50% at the minimal attainable temperature of 500 mK. Measured experimental parameters agree with the theoretical model involving the phonon bottleneck effect.
Optical vector network analysis approach is successfully employed in the measurement scheme and is thus proved as an efficient method of measuring the electromagnetically induced transparency. It can be further deployed in other quantum memory schemes.
Though cooling down below 1 K allowed to suppress most of the decoherence processes, we found that efficiency of the EIT is limited by rather high minimal attainable temperature, 500 mK. Such elevated effective temperature is due to high optical excitation power as well as to poor thermal interface and thermal conductance of the crystal medium below 1 K. As the consequence, dependence of the spin width on the temperature is limited by dynamics of non-equilibrium phonons.
Upon improvement of the thermal interface between sample and cryostat, it is possible to have a further enhancement of the coherence properties while working at low magnetic field. Also, Nd:LiYF crystal would be another interesting candidate for low-temperature experiments due to observation of the hyperfine structure. This will allow to develop reliable quantum memory feasible for low-magnetic-field applications.
VIII Acknowledgement
This work is supported by DFG through the grant BU 2510/2-1. A.K. acknowledges financial support from the Government of the Russian Federation (Mega-Grant No. 14.W03.31.0028). P.B. acknowledges Jürgen Eschner and Giovanna Morigi for the valuable discussions.
References
- Harris (1997) S. E. Harris, Physics Today 50, 36 (1997).
- Fleischhauer et al. (2005) M. Fleischhauer, A. Imamoglu, and J. P. Marangos, Reviews of Modern Physics 77, 633 (2005).
- Kash et al. (1999) M. M. Kash, V. A. Sautenkov, A. S. Zibrov, L. Hollberg, G. R. Welch, M. D. Lukin, Y. Rostovtsev, E. S. Fry, and M. O. Scully, Phys. Rev. Lett. 82, 5229 (1999), URL https://link.aps.org/doi/10.1103/PhysRevLett.82.5229.
- Hau et al. (1999) L. V. Hau, S. E. Harris, Z. Dutton, and C. H. Behroozi, Nature 397, 594 (1999).
- Budker et al. (1999) D. Budker, D. F. Kimball, S. M. Rochester, and V. V. Yashchuk, Phys. Rev. Lett. 83, 1767 (1999), URL https://link.aps.org/doi/10.1103/PhysRevLett.83.1767.
- Liu et al. (2001) C. Liu, Z. Dutton, C. H. Behroozi, and L. V. Hau, Nature 409, 490 (2001).
- Phillips et al. (2001) D. F. Phillips, A. Fleischhauer, A. Mair, R. L. Walsworth, and M. D. Lukin, Phys. Rev. Lett. 86, 783 (2001), URL https://link.aps.org/doi/10.1103/PhysRevLett.86.783.
- Chanelière et al. (2005) T. Chanelière, D. N. Matsukevich, S. D. Jenkins, S.-Y. Lan, T. A. B. Kennedy, and A. Kuzmich, Nature 438, 833 (2005).
- Eisaman et al. (2005) M. D. Eisaman, A. André, F. Massou, M. Fleischhauer, A. S. Zibrov, and M. D. Lukin, Nature 438, 837 (2005).
- Bussières et al. (2013) F. Bussières, N. Sangouard, M. Afzelius, H. de Riedmatten, C. Simon, and W. Tittel, Journal of Modern Optics 60, 1519 (2013).
- Heshami et al. (2016) K. Heshami, D. G. England, P. C. Humphreys, P. J. Bustard, V. M. Acosta, J. Nunn, and B. J. Sussman, Journal of Modern Optics 63, 2005 (2016).
- Chen et al. (2013) Y.-H. Chen, M.-J. Lee, I.-C. Wang, S. Du, Y.-F. Chen, Y.-C. Chen, and I. A. Yu, Phys. Rev. Lett. 110, 083601 (2013), URL https://link.aps.org/doi/10.1103/PhysRevLett.110.083601.
- Vernaz-Gris et al. (2018) P. Vernaz-Gris, K. Huang, M. Cao, A. S. Sheremet, and J. Laurat, Nature Communications 9, 363 (2018).
- Hsiao et al. (2018) Y.-F. Hsiao, P.-J. Tsai, H.-S. Chen, S.-X. Lin, C.-C. Hung, C.-H. Lee, Y.-H. Chen, Y.-F. Chen, I. A. Yu, and Y.-C. Chen, Physical Review Letters 120, 183602 (2018).
- Wang et al. (2019) Y. Wang, J. Li, S. Zhang, K. Su, Y. Zhou, K. Liao, S. Du, H. Yan, and S.-L. Zhu, Nature Photonics 13, 346 (2019).
- Thiel et al. (2011) C. W. Thiel, T. Böttger, and R. L. Cone, Journal of Luminescence 131, 353 (2011).
- Zhong et al. (2015) M. Zhong, M. P. Hedges, R. L. Ahlefeldt, J. G. Bartholomew, S. E. Beavan, S. M. Wittig, J. J. Longdell, and M. J. Sellars, Nature 517, 177 (2015).
- Zhong et al. (2017) T. Zhong, J. M. Kindem, J. G. Bartholomew, J. Rochman, I. Craiciu, E. Miyazono, M. Bettinelli, E. Cavalli, V. Verma, S. W. Nam, et al., Science 357, 1392 (2017).
- Ham et al. (1997) B. S. Ham, M. S. Shahriar, and P. R. Hemmer, Optics Letters 22, 1138 (1997).
- Ichimura et al. (1998) K. Ichimura, K. Yamamoto, and N. Gemma, Physical Review A 58, 4116 (1998).
- Turukhin et al. (2001) A. V. Turukhin, V. S. Sudarshanam, M. S. Shahriar, J. A. Musser, B. S. Ham, and P. R. Hemmer, Physical Review Letters 88, 023602 (2001).
- Longdell et al. (2005) J. J. Longdell, E. Fraval, M. J. Sellars, and N. B. Manson, Physical Review Letters 95, 063601 (2005).
- Akhmedzhanov et al. (2006) R. Akhmedzhanov, L. Gushin, E. Kuznetsova, A. Litvak, V. Yasenkov, and N. Zharova, Journal of Modern Optics 53, 2449 (2006).
- Goldner et al. (2009) P. Goldner, O. Guillot-Noël, F. Beaudoux, Y. Le Du, J. Lejay, T. Chanelière, J.-L. Le Gouët, L. Rippe, A. Amari, A. Walther, et al., Phys. Rev. A 79, 033809 (2009), URL https://link.aps.org/doi/10.1103/PhysRevA.79.033809.
- Heinze et al. (2013) G. Heinze, C. Hubrich, and T. Halfmann, Physical Review Letters 111, 033601 (2013).
- Schraft et al. (2016) D. Schraft, M. Hain, N. Lorenz, and T. Halfmann, Physical Review Letters 116, 073602 (2016).
- Fan et al. (2019) H. Q. Fan, K. H. Kagalwala, S. V. Polyakov, A. L. Migdall, and E. A. Goldschmidt, Phys. Rev. A 99, 053821 (2019), URL https://link.aps.org/doi/10.1103/PhysRevA.99.053821.
- Baldit et al. (2010) E. Baldit, K. Bencheikh, P. Monnier, S. Briaudeau, J. A. Levenson, V. Crozatier, I. Lorgeré, F. Bretenaker, J.-L. Le Gou’́et, O. Guillot-No’́el, et al., Physical Review B 81, 144303 (2010).
- Akhmedzhanov et al. (2018) R. Akhmedzhanov, L. Gushchin, N. Nizov, V. Nizov, D. Sobgayda, I. Zelensky, and A. Kalachev, Phys. Rev. B 97, 245123 (2018), URL https://link.aps.org/doi/10.1103/PhysRevB.97.245123.
- Macfarlane et al. (1992) R. M. Macfarlane, A. Cassanho, and R. S. Meltzer, Phys. Rev. Lett. 69, 542 (1992).
- Macfarlane et al. (1998) R. M. Macfarlane, R. S. Meltzer, and B. Z. Malkin, Phys. Rev. B 58, 5692 (1998).
- Kukharchyk et al. (2018a) N. Kukharchyk, D. Sholokhov, O. Morozov, S. L. Korableva, , J. H. Cole, A. A. Kalachev, and P. A. Bushev, Opt. Lett. 43, 935 (2018a).
- Moiseev and Tittel (2011) S. A. Moiseev and W. Tittel, New Journal of Physics 13, 063035 (2011).
- Moiseev (2013) S. A. Moiseev, Physical Review A 88, 012304 (2013).
- Zhang et al. (2013) X. Zhang, A. Kalachev, and O. Kocharovskaya, Physical Review A 87, 013811 (2013).
- Kalachev and Kocharovskaya (2013) A. Kalachev and O. Kocharovskaya, Physical Review A 88, 033846 (2013).
- Zhang et al. (2014) X. Zhang, A. Kalachev, and O. Kocharovskaya, Physical Review A 90, 052322 (2014).
- Ganem et al. (1991) J. Ganem, Y. P. Wang, D. Boye, R. S. Meltzer, W. M. Yen, and R. M. Macfarlane, Phys. Rev. Lett. 66, 695 (1991).
- Meltzer et al. (1993) R. S. Meltzer, J. Ganem, Y. P. Wang, D. Boye, W. M. Yen, D. P. Landau, R. Wannemacher, and R. M. Macfarlane, J. Lumin. 53, 1 (1993).
- Gerasimov et al. (2016) K. I. Gerasimov, M. M. Minnegaliev, B. Z. Malkin, E. I. Baibekov, and S. A. Moiseev, Phys. Rev. B 94, 054429 (2016).
- Marino et al. (2016) R. Marino, I. Lorgeré, O. Guillot-No’́el, H. Vezin, A. Toncelli, M. Tonelli, J.-L. L. Gou’́et, and P. Goldner, J. of Lumin. 169, Part B, 478 (2016).
- Akhmedzhanov et al. (2016) R. A. Akhmedzhanov, L. A. Gushchin, A. A. Kalachev, S. L. Korableva, D. A. Sobgayda, and I. V. Zelensky, Laser Physics Letters 13, 015202 (2016).
- Kukharchyk et al. (2018b) N. Kukharchyk, D. Sholokhov, O. Morozov, S. L. Korableva, A. A. Kalachev, and P. A. Bushev, New Journal of Physics 20, 023044 (2018b).
- Marpaung et al. (2013) D. Marpaung, C. Roeloffzen, R. Heideman, A. Leinse, S. Sales, and J. Capmany, Laser Photonics Rev. 7, 506 (2013).
- Sattler and Nemarich (1971) J. P. Sattler and J. Nemarich, Physical Review B 4, 1 (1971).
- Fraval et al. (2004) E. Fraval, M. J. Sellars, and J. J. Longdell, Physical Review Letters 92, 077601 (2004).
- Lovrić et al. (2011) M. Lovrić, P. Glasenapp, D. Suter, B. Tumino, A. Ferrier, P. Goldner, M. Sabooni, L. Rippe, and S. Kröll, Physical Review B 84, 104417 (2011).
- McAuslan et al. (2012) D. L. McAuslan, J. G. Bartholomew, M. J. Sellars, and J. J. Longdell, Physical Review A 85, 032339 (2012).
- Ortu et al. (2017) A. Ortu, A. Tiranov, S. Welinski, F. Fröwis, N. Gisin, A. Ferrier, P. Goldner, and M. Afzelius, arXive p. 1712.08615 (2017).
- Aminov et al. (2013) L. K. Aminov, I. N. Kurkin, , and B. Z. Malkin, Physics of the Solid State 55, 1343 (2013), URL https://doi.org/10.1134/S1063783413070020.
- Kuznetsova et al. (2002) E. Kuznetsova, O. Kocharovskaya, P. Hemmer, and M. O. Scully, Phys. Rev. A 66, 063802 (2002), URL https://link.aps.org/doi/10.1103/PhysRevA.66.063802.
- Kukharchyk et al. (2019) N. Kukharchyk, D. Sholokhov, A. A. Kalachev, and P. A. Bushev, arXiv p. 1910.03096 (2019).
- Budoyo et al. (2018) R. P. Budoyo, K. Kakuyanagi, H. Toida, Y. Matsuzaki, W. J. Munro, H. Yamaguchi, and S. Saito, Applied Physics Express 11, 043002 (2018), URL https://doi.org/10.7567%2Fapex.11.043002.
- Graf et al. (1998) F. R. Graf, A. Renn, G. Zumofen, and U. P. Wild, Phys. Rev. B 58, 5462 (1998), URL https://link.aps.org/doi/10.1103/PhysRevB.58.5462.
- Abragam and Bleaney (1970) A. Abragam and B. Bleaney, Electron paramagnetic resonance of transition ions (OUP OXFORD, 1970).
- Wu et al. (2013) D. Wu, A. S. Petersen, and S. J. Poon, AIP Advances 3, 082116 (2013), eprint https://doi.org/10.1063/1.4818972, URL https://doi.org/10.1063/1.4818972.
- Minisini et al. (2005) B. Minisini, Q. A. Wang, and F. Tsobnang, Journal of Physics: Condensed Matter 17, 4953 (2005), URL https://doi.org/10.1088%2F0953-8984%2F17%2F33%2F001.
- Novikova et al. (2012) I. Novikova, R. Walsworth, and Y. Xiao, Laser & Photonics Reviews 6, 333 (2012), eprint https://onlinelibrary.wiley.com/doi/pdf/10.1002/lpor.201100021, URL https://onlinelibrary.wiley.com/doi/abs/10.1002/lpor.201100021.
- Fleischhauer and Lukin (2002) M. Fleischhauer and M. D. Lukin, Phys. Rev. A 65, 022314 (2002), URL https://link.aps.org/doi/10.1103/PhysRevA.65.022314.