Hybrid Traversal: Efficient Source Code Analysis at Scale
Abstract.
Source code analysis at a large scale is useful for solving many software engineering problems, however, could be very expensive, thus, making its use difficult. This work proposes hybrid traversal, a technique for performing source code analysis over control flow graphs more efficiently. Analysis over a control flow graph requires traversing the graph and it can be done using several traversal strategies. Our observation is that no single traversal strategy is suitable for different analyses and different graphs.
Our key insight is that using the characteristics of the analysis and the properties of the graph it is possible to select a most efficient traversal strategy for a ¡analysis, input graph¿ pair. Our evaluation using a set of analyses with different characteristics and a large dataset of graphs with different properties shows up to 30% reduction in the analysis time. Further, the overhead of our technique for selecting the most efficient traversal strategy is very low; between 0.01%-0.2%.
1. Introduction
Performance of source code analysis over graphs heavily depends on the order of the nodes visited during the traversals: the traversal strategy. While graph traversal is a well-studied problem, and various traversal strategies exists, e.g., depth-first, post-order, reverse post-order, etc, no single strategy works best for different kinds of analyses and different kinds of graphs. Our contribution is hybrid traversal, a novel source code analysis optimization technique for source code analyses expressed as graph traversals.
The current approaches either select a single traversal strategy for all graphs or let user pick one. Our observation is that, for analyzing millions of graphs, no single traversal strategy performs best across different kinds of analyses and graphs. Certain characteristics of the analysis, such as data flow sensitivity, sensitivity to cycles in the graph, and direction of the graph traversal (top-down or bottom-up), influence the selection of the traversal strategy for an analysis. Similarly, graph properties such as branching factor and cyclicity plays an important role. Our key intuition is that, by combining the characteristics of the analysis and properties of the graph, an optimal traversal strategy can be selected for each ¡analysis, graph¿ pair.
2. Approach: Hybrid Traversal
A source code analysis over control flow graphs (CFGs) performs one or more traversal of the CFG. A traversal visits nodes in the CFG to perform certain computation and generates analysis results for nodes. The analysis model that we assume is a standard control and data flow analysis.
Figure 1 provides an overview of our approach and its key components. Given a source code analysis and a dataset that contains a collection of CFGs, our technique automatically selects a traversal strategy from a set of candidate strategies for each CFG in the dataset. For selecting the traversal strategy, our technique first computes a set of properties of the analysis by statically analyzing the code of the analysis, such as data flow sensitivity and loop sensitivity. The analysis properties are then combined with graph properties, such as branching factor and cyclicity to select a traversal strategy for each CFG. The static properties of the traversals are computed only once for each analysis at compile-time, whereas graph properties are determined for every input graph in the dataset when executing the analysis.
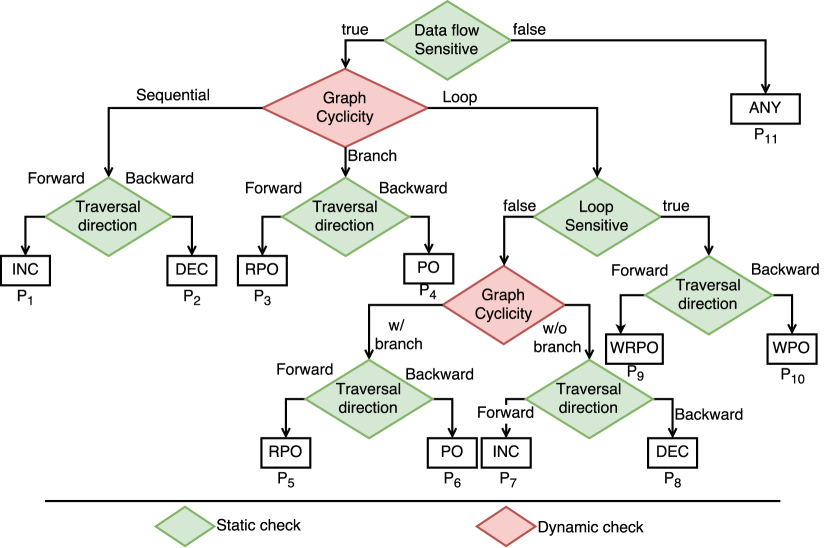
Given a set of analysis properties and graph properties, a decision diagram is carefully designed to select the strategy as shown in Figure 2. The list of candidate traversal strategies includes: Any order (ANY), Increasing order of node ids (INC), Decreasing order of node ids (DEC), Post-Order (PO), Reverse Post-Order (RPO), Worklist with Post-Order (WPO), Worklist with Reverse Post-Order (WRPO). The decision tree contains 11 unique paths ( to ) leading to a traversal strategy (the leaf nodes). The intermediate nodes are conditions involving either an analysis property or a graph property. The order in which the checks are performed is intuitive. For example, it only makes sense to check the connectivity of the nodes (whether certain nodes have multiple parents), if the analysis is data-sensitive (in which case the outputs of neighbors influence the output of a node). Similarly, if the graph does not contain cycles, it is not necessary to check if the analysis is sensitive to a loop. Our decision tree design ensures that all necessary conditions are checked and only the necessary conditions are checked. While it is difficult to argue the correctness of our decision tree, instead we measured the misprediction rate and found it to be a near zero, where a misprediction happens when our decision tree selects a strategy that is sub-optimal.
| Analysis | Ts | ||||||||||
|---|---|---|---|---|---|---|---|---|---|---|---|
| Flw | Lp | Dir | Flw | Lp | Dir | Flw | Lp | Dir | |||
| 1 | Copy propagation (CP) | 3 | ✗ | ✗ | — | ✓ | ✓ | ✗ | ✗ | — | |
| 2 | Common sub-expression detection (CSD) | 3 | ✗ | ✗ | — | ✓ | ✓ | ✗ | ✗ | — | |
| 3 | Dead code (DC) | 3 | ✗ | ✗ | — | ✓ | ✓ | ✗ | ✗ | — | |
| 4 | Loop invariant code (LIC) | 3 | ✗ | ✗ | — | ✓ | ✓ | ✗ | ✗ | — | |
| 5 | Upsafety analysis (USA) | 3 | ✗ | ✗ | — | ✓ | ✓ | ✗ | ✗ | — | |
| 6 | Valid FileReader (VFR) | 3 | ✗ | ✗ | — | ✓ | ✓ | ✗ | ✗ | — | |
| 7 | Mismatched wait/notify (MWN) | 3 | ✗ | ✗ | — | ✓ | ✓ | ✗ | ✗ | — | |
| 8 | Available expression (AE) | 2 | ✗ | ✗ | — | ✓ | ✓ | ||||
| 9 | Dominator (DOM) | 2 | ✗ | ✗ | — | ✓ | ✗ | ||||
| 10 | Local may alias (LMA) | 2 | ✗ | ✗ | — | ✓ | ✓ | ||||
| 11 | Local must not alias (LMNA) | 2 | ✗ | ✗ | — | ✓ | ✓ | ||||
| 12 | Live variable (LV) | 2 | ✗ | ✗ | — | ✓ | ✓ | ||||
| 13 | Nullness analysis (NA) | 2 | ✗ | ✗ | — | ✓ | ✓ | ||||
| 14 | Post-dominator (PDOM) | 2 | ✗ | ✗ | — | ✓ | ✗ | ||||
| 15 | Reaching definition (RD) | 2 | ✗ | ✗ | — | ✓ | ✓ | ||||
| 16 | Resource status (RS) | 2 | ✗ | ✗ | — | ✓ | ✓ | ||||
| 17 | Very busy expression (VBE) | 2 | ✗ | ✗ | — | ✓ | ✓ | ||||
| 18 | Safe Synchronization (SS) | 2 | ✗ | ✗ | — | ✓ | ✓ | ||||
| 19 | Used and defined variable (UDV) | 1 | ✗ | ✗ | — | ||||||
| 20 | Useless increment in return (UIR) | 1 | ✗ | ✗ | — | ||||||
| 21 | Wait not in loop (WNIL) | 1 | ✗ | ✗ | — | ||||||
3. Evaluation
To measure the effectiveness of our hybrid approach, we measured the analysis execution times and compared it against the analysis execution times of six standard traversal strategies: DFS, PO, RPO, WPO, WRPO, and ANY, that use a single strategy for all kinds of analysis and graphs. We used 21 source code analyses that traverse CFG and a large dataset of CFGs that contains 287 thousand CFGs, generated from the DaCapo 9.12 benchmark. Table 1 lists the 21 analyses along with their properties.
| Analysis | DFS | PO | RPO | WPO | WRPO | ANY | Analysis | DFS | PO | RPO | WPO | WRPO | ANY |
|---|---|---|---|---|---|---|---|---|---|---|---|---|---|
| CP | 17% | 83% | 9% | 66% | 11% | 72% | LV | 38% | 30% | 84% | 11% | 56% | 75% |
| CSD | 41% | 93% | 39% | 74% | 4% | 89% | NA | 26% | 88% | 30% | 50% | 10% | 80% |
| DC | 41% | 30% | 89% | 7% | 64% | 81% | PDOM | 51% | 41% | 95% | 10% | 72% | 95% |
| LIC | 17% | 84% | 8% | 67% | 7% | 73% | RD | 15% | 80% | 7% | 62% | 9% | 68% |
| USA | 36% | 92% | 34% | 72% | 9% | 87% | RS | 31% | 31% | 30% | 31% | 28% | 30% |
| VFR | 20% | 41% | 18% | 51% | 15% | 62% | VBE | 40% | 36% | 88% | 13% | 76% | 81% |
| MWN | 21% | 35% | 16% | 35% | 22% | 49% | SS | 26% | 39% | 22% | 37% | 25% | 57% |
| AE | 40% | 14% | 39% | 73% | 14% | 87% | UDV | 6% | 5% | 6% | 10% | 9% | 3% |
| DOM | 54% | 97% | 48% | 70% | 6% | 95% | UIR | 2% | 2% | 1% | 3% | 3% | 0% |
| LMA | 35% | 46% | 28% | 74% | 6% | 46% | WNIL | 3% | 4% | 5% | 6% | 8% | 2% |
| LMNA | 29% | 39% | 22% | 68% | 9% | 41% | Overall | 31% | 83% | 70% | 55% | 35% | 81% |
Table 2 shows the percentage reduction in the analysis time of our hybrid approach against the six standard strategies. For all 21 analyses, our approach was able to reduce the analysis time and the reduction is between 1%-28% (taking least value in column 2-7 for each analysis in Table 2). For UDV, UIR, and WNIL, our approach saw less benefit, because these are data flow insensitive analyses, in which all nodes are visited exactly once and the order does not matter, hence all traversal strategies would perform similar. We also measured the overhead of our technique for computing the characteristics of the analysis and properties of the graphs and the overhead is negligible, between 0.01%-0.2%.
4. Related Work
Atkinson and Griswold (atkinson2001implementation) proposed techniques for improving the efficiency of data-flow analysis. Tok et al. (tok-etal) proposed a new worklist algorithm for accelerating inter-procedural flow-sensitive data-flow analysis. Hind and Pioli (hind-pioli) proposed an optimized priority-based worklist algorithm for pointer alias analysis. Bourdoncle (bourdoncle93) proposed the notion of weak topological ordering (WTO) for dataflow analysis and abstraction interpretation domains. These works propose new traversal strategies for improving the efficiency of certain class of source code analysis, whereas our work proposes a novel technique for selecting the optimal traversal strategy from a list of candidate traversal strategies.
5. Conclusion
Scaling source code analyses to large code bases is an ongoing research direction. Our work proposes hybrid traversal, a technique for optimizing source code analysis over control flow graphs. Our key intuition is that by combining the analysis properties and graph properties, a suitable traversal strategy can be decided for any analysis and graph pair. Our initial results indicates that up to 30% reduction in the analysis time can be achieved.