∎
2626email: 89hariharan@gmail.com 2727institutetext: B. Hariharan∗ 2828institutetext: M. Chakraborty 2929institutetext: S.R. Dugad 3030institutetext: S.K. Gupta 3131institutetext: P. Jagadeesan 3232institutetext: A. Jain 3333institutetext: V.B. Jhansi 3434institutetext: P.K. Mohanty 3535institutetext: S.D. Morris 3636institutetext: P.K. Nayak 3737institutetext: D. Pattanaik 3838institutetext: P.S. Rakshe 3939institutetext: K. Ramesh 4040institutetext: B.S. Rao 4141institutetext: L.V. Reddy 4242institutetext: Tata Institute of Fundamental Research, Dr Homi Bhabha Road, Mumbai 400005, India
4343institutetext: B. Hariharan∗ 4444institutetext: S.S.R. Inbanathan∗ 4545institutetext: Post Graduate & Research Department of Physics, The American College, Madurai 625002, India
4545email: 89hariharan@gmail.com, ssrinbanathan@gmail.com 4646institutetext: S.S.R. Inbanathan∗ 4747institutetext: Department of Applied Science, The American College, Madurai 625002, India
4747email: ssrinbanathan@gmail.com 4848institutetext: S. Ahmad 4949institutetext: A. Chandra 5050institutetext: M. Zuberi 5151institutetext: Aligarh Muslim University, Aligarh 202002, India
5252institutetext: Y. Hayashi 5353institutetext: S. Kawakami 5454institutetext: Graduate School of Science, Osaka City University, 558-8585 Osaka, Japan 5555institutetext: H. Kojima 5656institutetext: A. Oshima 5757institutetext: S. Shibata 5858institutetext: College of Engineering, Chubu University, Kasugai, Aichi 487-8501, Japan 5959institutetext: P. Jain 6060institutetext: F. Varsi 6161institutetext: Indian Institute of Technology Kanpur, Kanpur 208016, India
Energy sensitivity of the GRAPES-3 EAS array for primary cosmic ray protons ††thanks: ∗Corresponding author
Abstract
Low energy ground-based cosmic ray air shower experiments generally have energy threshold in the range of a few tens to a few hundreds of TeV. The shower observables are measured indirectly with an array of detectors. The atmospheric absorption of low energy secondaries limits their detection frequencies at the Earth’s surface. However, due to selection effects, a tiny fraction of low energy showers, which are produced in the lower atmosphere can reach the observational level. But, due to less information of shower observables, the reconstruction of these showers are arduous. Hence, it is believed that direct measurements by experiments aboard on satellites and balloon flights are more reliable at low energies. Despite having very small efficiency (0.1%) at low energies, the large acceptance (5 m2sr) of GRAPES-3 experiment allows observing primary cosmic rays down below to 1 TeV and opens up the possibility to measure primary energy spectrum spanning from a few TeV to beyond cosmic ray knee (up to 1016 eV), covering five orders of magnitude. The GRAPES-3 energy threshold for primary protons through Monte Carlo simulations are calculated, which gives reasonably good agreement with data. Furthermore, the total efficiencies and acceptance are also calculated for protons primaries. The ability of GRAPES-3 experiment to cover such a broader energy range may provide a unique handle to bridge the energy spectrum between direct measurements at low energies and indirect measurements at ultra-high energies.
Keywords:
Cosmic rays GRAPES–3 CORSIKA1 Introduction
Energy spectrum and composition studies are the key objectives of any cosmic ray (CR) experiment to understand its origin and acceleration mechanisms. Majority of the CRs are lighter elements such as proton (90%), helium (9%), and the remaining (1%) are heavier elements including carbon, nitrogen, oxygen, aluminum, and iron. The primary cosmic rays (PCRs) have been observed over an extraordinary energy range of 108–1020 eV, spanning twelve orders of magnitude. The energy spectrum is represented by power law distribution with two prominent features including the “knee” at about 31015 eV where the spectral index changes from -2.7 to -3.1 and “ankle” at 31018 eV where the spectral index again changes from -3.1 to -2.8. It is believed that these features are due to transition of CR sources from galactic to extragalactic origin. However, this still remains an unsolved mystery.
Upon entering into Earth’s atmosphere, the PCR collides with atmospheric gaseous molecules and produces secondary particles that includes pions, kaons, etc. The charged pion decays into a muon and its associated neutrino where the muon subsequently decays into an electron and two neutrinos. The neutral pion decays into two -rays that further develop into an electromagnetic cascade through bremsstrahlung and pair production processes. These chain of interactions are continued until the particles are decayed or stopped as they propagate down to observational level. The entire process of the development is called extensive air shower (EAS) or cascade shower. At a particular stage, the shower development reaches its maximum number of particles, which is known as shower maximum and it can be represented by . The shower development is also characterized by a parameter called age () where =0 corresponds to the first interaction, =1 at the shower maximum, and =2 represents the death of the shower. The number of secondaries and their lateral spread in an EAS at the observational level depends on PCR energies. For an ultra-high energy primary (1018 eV), the number of particles may reach in excess of billions spread over hundreds of square kilometers. The EAS measurement technique is used to determine the information by sampling the secondaries at the observational level in the particle detectors. Typical air shower experiments consist of an array of detectors deployed over a large area. The primary parameters are reconstructed by using the information from the secondaries with aid of Monte Carlo simulations.
Direct measurements of PCRs are carried out by detectors aboard on balloons or satellites. However, these instruments do not have enough sensitivity above 100 TeV due to low flux of PCRs, short exposure time, and limited detector size. Satellite based experiments such as PAMELA pamela_1 , AMS-02 ams2_1 , and DAMPE dampe and balloon-borne experiments such as CAPRICE caprice , BESS bess , and CREAM cream_1 primarily use calorimeters for energy measurements and particle’s time of flight (TOF) in the detector for measuring arrival directions of the primaries. The CRs energy, composition, and arrival direction measurements done by balloon and satellite based experiments are fairly precise. However, they lack statistics at higher energies, which restrict their measurements to below 100 TeV. The PCRs of energy above 100 TeV are indirectly studied by using EAS technique with an array of detectors placed on the ground level like ARGO-YBJ argo , Tibet AS tibetas KASCADE kascade , KASCADE-Grande grande , AUGER auger , and TA ta . However, these experiments are sensitive at different energy ranges such that ARGO-YBJ and Tibet AS which have operating energy from few a TeV to below the knee region (1015 eV), KASCADE and KASCADE-Grande operated around knee region, and experiments like AUGER and TA are mainly aimed to explore the origin of ultra high energy cosmic rays so they are sensitive to much higher energies beyond knee (1019 eV).
The energy threshold of an EAS experiment is decided by the inter-detector separation whereas its total physical area covered by decides its upper energy end. Generally, most of the low energy showers get absorbed in the atmosphere and do not reach up to ground level. However, a small fraction of young low energy showers, which are produced deep into the atmosphere may survive till ground level. However, these showers have very low triggering efficiencies and recorded with limited information, which makes their reconstruction difficult. Due to these low efficiencies, the ground-based experiments generally make observations at higher energies. So, historically it is believed that the direct measurements are more reliable at lower energies (below 100 TeV) whereas indirect measurements stay above these energies. In such scenario, the contributions of experiments from ARGO-YBJ, Tibet AS, and GRAPES-3 are vital if the low energy PCRs can be used to provide in the extended energy range of TeV–PeV to bridge direct and indirect measurements. The energy threshold of proton initiated EAS for GRAPES-3 is estimated to be few TeV by using Monte Carlo simulations with reasonably good agreement with data. From these simulations, the triggering and reconstruction efficiencies, and geometrical acceptance are also estimated as a function of energy. It is found that only a small fraction (i.e. 0.1% of incident) of such low energy showers are detected and reconstructed, which can be used for further studies. Due to the larger physical area coverage, the geometrical acceptance of GRAPES-3 is larger compared to direct measurements like PAMELA (20.5 cm2sr) pamela_2 , AMS-02 (0.5 m2sr) ams2_2 , DAMPE (0.1 m2sr) dampe , BESS (0.3 m2sr) bess , and CREAM (0.322 m2sr) cream_2 . The GRAPES-3 acceptance is estimated to be 5 m2sr for 1 TeV protons. Maximum efficiency has been achieved at 100 TeV with the acceptance of 20000 m2sr. Though, the efficiencies are small at low energies but due to immense flux of incident primaries, and larger acceptance, the GRAPES-3 records large number of usable low energy EAS that can provide energy spectrum and mass composition of PCRs in the broad energy span to overlap with low and ultra-high energy measurements from direct and indirect experiments respectively.
2 The GRAPES-3 experiment
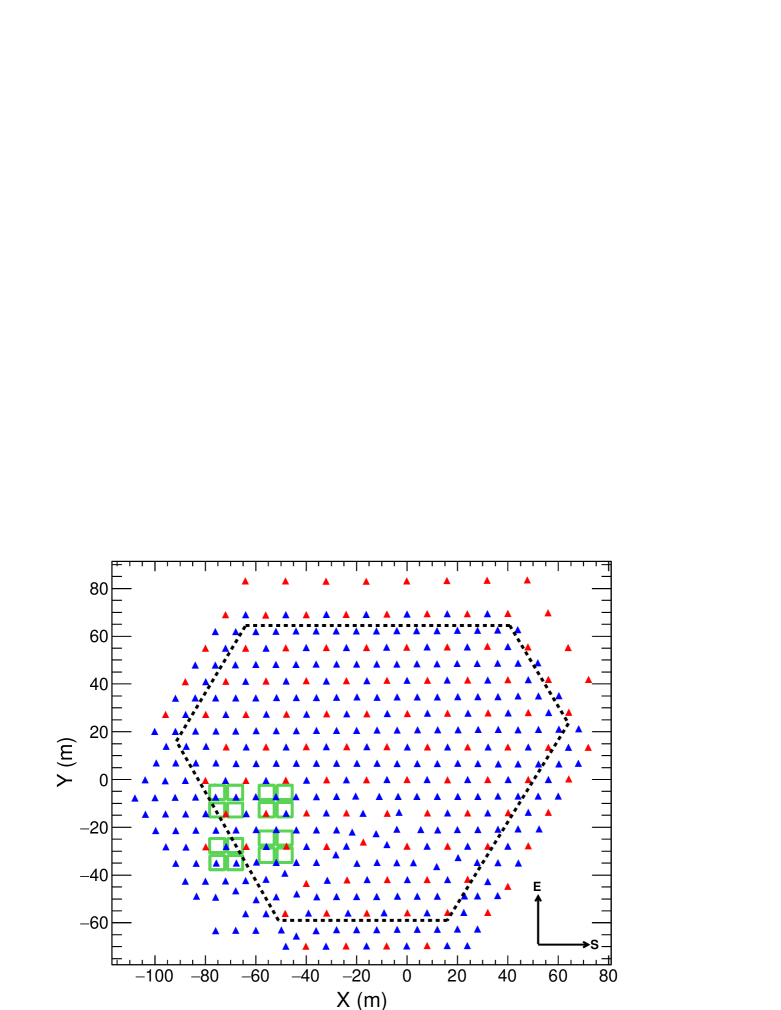
The GRAPES-3, which stands for Gamma Ray Astronomy at PeV EnergieS – phase 3 is a ground-based EAS experiment located at Ooty in southern India (11.4∘N, 76.7∘E, and 2200 m above msl). It is designed to study high energy particles in different astrophysical settings including acceleration in the atmosphere during thunderstorms, solar phenomena, energy spectrum and composition of PCRs, and diffuse -rays. It consists of two major detector components. One of them comprises an array of 400 scintillator detectors covering a physical area of 25000 m2 Gupta05 . The scintillator detectors with an area of 1 m2 each are placed in a hexagonal geometry with an inter-detector separation of 8 m as shown in Fig-1. An additional photomultiplier tube (PMT) is used in 105 plastic scintillation detectors to overcome the PMT saturation problem due to large particle densities especially when the shower core lands close to the detector. Thus, the two-PMT configuration allows the extension of particle density measurements to over 10,000 m-2 resulting precise estimation of shower size () for large EAS Anuj15 .
The second major component comprises a large area tracking muon telescope (G3MT) Hayashi05 . The G3MT consists of 3712 proportional counters (PRCs) arranged in 16 muon telescope modules with a total area of 560 m2. The PRCs are made up of mild steel tube of 600 cm in length and 10 cm10 cm in cross-section with wall thickness of 2.3 mm. Each muon telescope module houses four layers of PRCs with alternate layers arranged orthogonal to each other. The layers are sandwiched by 15 cm thick concrete blocks. Above the muon modules, 2 m thick concrete blocks are stacked in the form of an inverted pyramidal shape that serves as absorber. The entire mass overburden of 550 gcm-2 provides 1 sec() GeV threshold for muons incident at zenith angle . The four layer configuration allows the incident muons to be reconstructed into 169 directions covering 2.3 sr in the sky with 4∘ accuracy. The GRAPES-3 records 3106 EAS per day in the energy range of 1 TeV–10 PeV and 4109 muons above 1 GeV. The muon flux recorded by G3MT is mostly produced by PCRs of energy 10 GeV–10 TeV. The recorded muon flux has been successfully corrected for atmospheric effects and detector efficiency variations that can be used to study long-term CR variation and transient phenomenon Mohanty2016_1 ; Arunbabu2017 . The high quality data of G3MT allowed us to probe interesting physics phenomenon such as measurement of 1.3 GV electric potential in thunderclouds Hari19 and discovery of a muon burst caused by a transient weakening of Earth’s magnetic shield Mohanty2016_2 ; Mohanty2018 .
3 EAS reconstruction
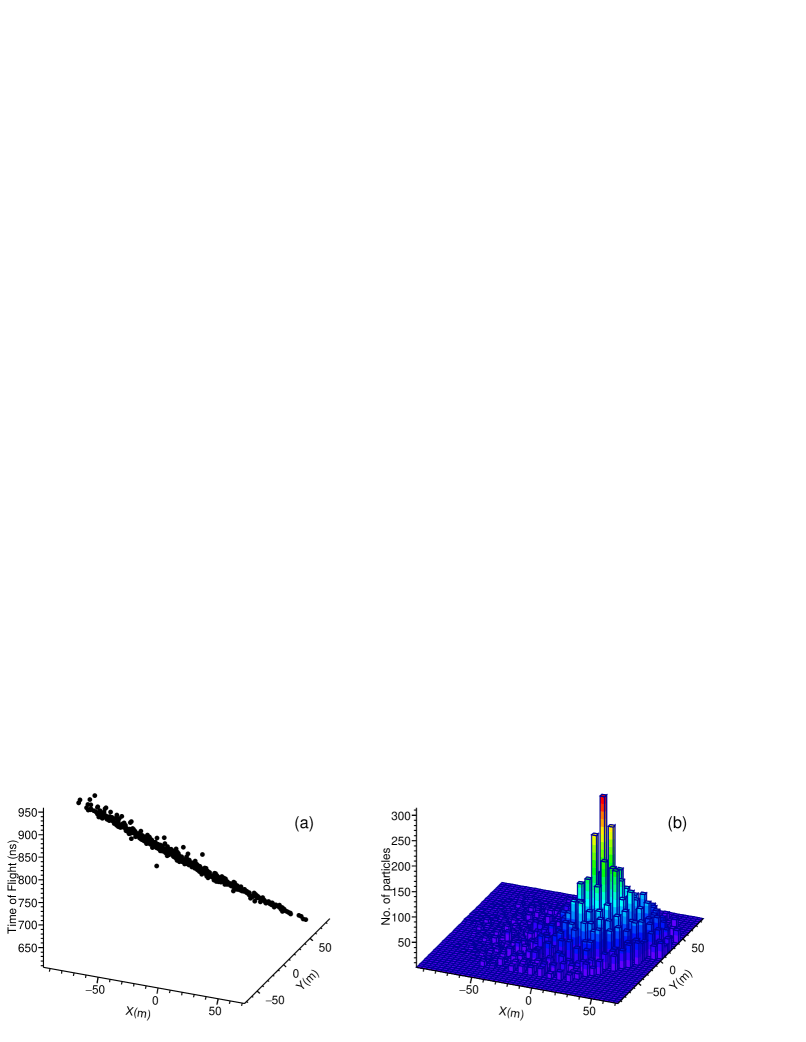
The GRAPES-3 experiment records the particle densities and their relative arrival times in an EAS from all 400 plastic scintillation detectors by using high precision electronics. The two-level trigger system is used to eliminate small but locally developed showers and also very large showers whose cores are landed very far away. An EAS trigger is generated on the basis of the following criteria: (i) consecutive three-line coincidence in north-south oriented line of detectors, which is called Level-0 and (ii) minimum 10 detector hits within the trigger region called Level-1 Gupta05 . The energy deposited by the EAS particles is measured by using charge integrating analog-to-digital converter (ADC). The ADC information is further converted into equivalent number of muons by using single muon calibration called as particle densities. The distribution of particle densities for an EAS is shown in Fig-2. The relative arrival time of particles are measured by using a 32-channel high performance time-to-digital converter (HPTDC) developed in-house Gupta2012 . The arrival time distribution for the same EAS is shown in Fig-2. The true direction of incident PCR is obtained by fitting the EAS front Jhansi2019 . The observed particle densities are fitted with a lateral density distribution function known as Nishimura-Kamata-Greisen (NKG) nkg given by Eq-1 and through a minimization of negative log-likelihood algorithm using MINUIT. Various EAS parameters including the core location (, ), shower size (), and age () are obtained from this fit Tanaka2012 .
| (1) |
| (2) |
Here is the distance of detector from the shower core (, ). is the Molière radius (distance from the shower core within which 90% of the EAS energy is deposited), =103 m for the Ooty observational level.
4 Monte Carlo simulations
The EAS simulations are carried out using CORSIKA which is a widely used Monte Carlo package for studying the development of EAS in the Earth’s atmosphere corsika . The CORSIKA allows the simulation of various primaries in the entire span of cosmic ray energy spectrum. It has been interfaced with several hadronic interaction models such as EPOS-LHC eposlhc , QGSJET01C qgsjet , QGSJETII-04 qgsII , SIBYLL sibyll_2.1 , VENUS venus , DPMJET dpmjet , and NEXUS nexus for high energy (calculation of cross-sections above 80 GeV) and GHEISHA gheisha , FLUKA fluka , and UrQMD urqmd for low energy interactions. It carries out four dimensional simulations to study the shower development including various hadronic and electromagnetic interactions, and decays. The secondary particles are tracked down to the ground level until they decay or till the kinetic energy is above the user-defined energy threshold. The physical quantities like position, momentum, and arrival time of secondary particles can be recorded up to maximum of ten desired observational levels. The CORSIKA generated secondary particles can be converted into observables of an experiment by using Geant4, which is a detector simulation toolkit developed by CERN that allows studying response of various type of particles and interactions in the material of any arbitrary geometry geant . By this method the simulated data is prepared, which can be directly compared with the experimental data.
In GRAPES-3, the simulations are performed in three stages: (i) CORSIKA showers are simulated with a set of user-defined inputs, (ii) the simulated secondary particles from each shower are subjected to in-house simulation code to do pseudo random arrival of EAS to generate triggers and also Geant4 response of collected particles in each plastic scintillation detectors, and (iii) reconstruction of angle and NKG parameters using TOF and particle densities respectively. The primary energy for simulation is randomly selected from a user-defined energy spectrum of and following a power-law with a spectral index of -2.7. The CORSIKA simulated showers are randomly tossed into the fiducial area (14560 m2, i.e. 56% of total physical area) defined in the GRAPES-3 array shown in Fig-1 to ensure maximum sampling of spatial distribution. Then the particles which fall over 1 m2 area of each scintillator are converted into particle density by using pre-simulated Geant4 calibration. The Geant4 response of the plastic scintillation detectors with full geometrical implementations are studied in-depth for gamma, electron, muon, proton, neutron, and pion, that attribute to most of the secondaries found at the detector level. Each of these particles is simulated for its response on a wide range of energy and incident direction. The simulated response of each type of particles is transformed into integral probability that is further used to calculate the energy deposit for an incident particle with the inclusion of Poisson fluctuations. Similarly, the single muon response is also simulated using Geant4. Then the particle density of each scintillation detector is calculated by using the energy deposited by the particles, which are passing through the sensitive area of the detector. Similarly, the first arrival time of the particles for each detector is accounted as it is directly available in CORSIKA output. Each detector should have a minimum energy deposit that can pass through discriminator level to be treated as a triggered detector. The discriminator level used for scintillators in the GRAPES-3 experiment is equivalent to 50% of energy deposit by single muon response obtained from calibration. Subsequently, the logical EAS trigger generation is done as discussed in previous section. The estimated particle density and TOF are used to calculate the primary properties that may be used to assess systematics of the measurements.
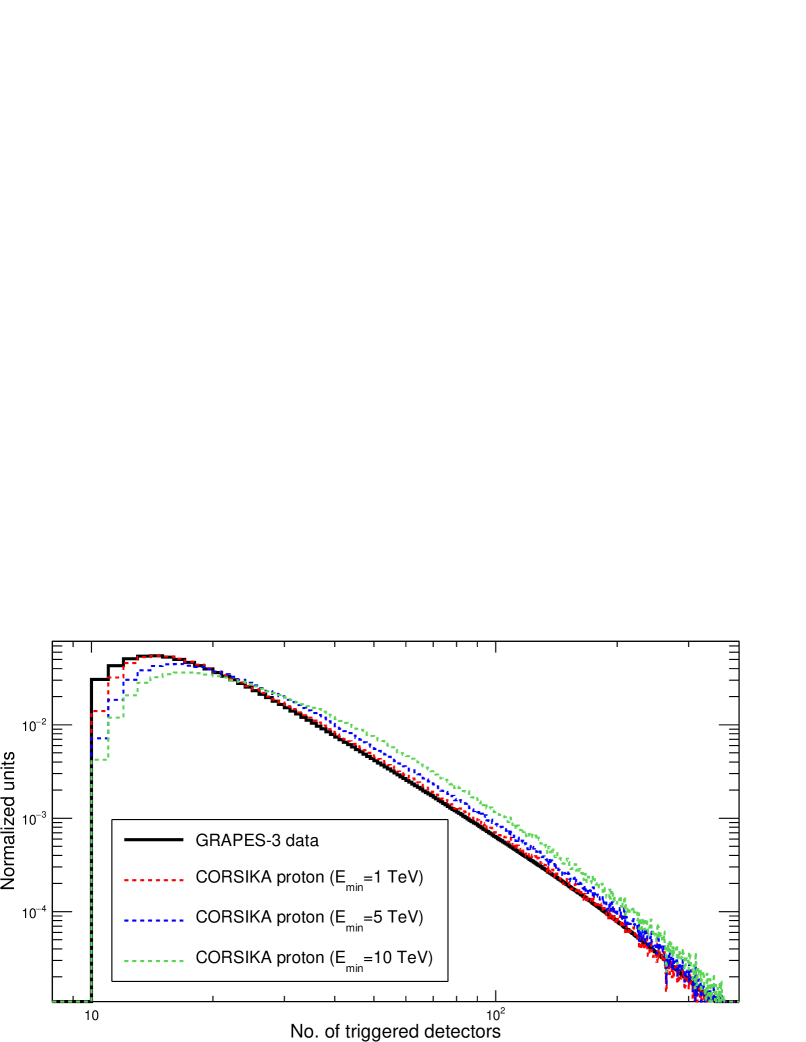
The simulation parameters can be optimized to reproduce the data. For example, one such important observable is shown in Fig-3 contains distribution of triggered detectors from EAS collected by the GRAPES-3. The triggered detectors distribution for data is generated with 6.6108 EAS collected during year 2014. In order to reproduce this distribution, the Monte Carlo simulations are carried out for proton primaries in the angular range of 0–45∘ and 0–360∘ for zenith (), and azimuth () angles respectively. For this study, SIBYLL and FLUKA combination of hadronic interaction models are used. Electromagnetic processes are treated by EGS code. The energy thresholds of secondaries are set to 50 MeV, 10 MeV, 1 MeV, and 1 MeV for hadrons, muons, electrons, and electromagnetic components respectively. The secondary particles are tracked down to Ooty observational level. In Fig-3, the simulated distribution of triggered detectors for different and fixed Emax=3 PeV generated with spectral index of -2.7 are shown. Here, the distributions are normalized to integral count for comparison.
At first, the simulations are carried out for =10 TeV to obtain distribution of triggered detectors. One can notice the simulated distribution for 10 TeV–3 PeV has large discrepancy in most part of the distribution. At the peak position of the data (i.e. 14 triggered detectors), the discrepancy with the simulation is found to be 40%. The discrepancy increased to 90% at 100 detectors, reduced to 66% at 200 detectors, and further dropped to 50% at 300 detectors and beyond. Especially at smaller number of triggered detectors, the disagreement indicates the triggering of low energy EAS. This could also be the cause of discrepancy found at larger side due to relative abundance between low to high energy EAS which are actually triggered. Motivated by this idea, the simulations are carried out by reducing systematically starting from 5 TeV, 3 TeV, and 1 TeV. As the simulation energy is lowered the disagreement, which is seen with =10 TeV has reduced from 40% to 10% at data peak for =1 TeV. The discrepancies at other regions are also reduced from 90% to 14% and from 66% to 4% at 100 and 200 triggered detectors respectively. Above 300 detectors, the spectra of data and 1 TeV simulation are indistinguishable. However, the statistical errors in simulation are large compared to data due to smaller number of simulated high energy EAS. Notably, the peak position of data and 1 TeV simulation (i.e. at 14 triggered detectors) are matching compared to 10 TeV. Also, at the peak of triggered detectors, there is no disagreement between data and simulation at 1 TeV compared to 34% found for 10 TeV. This confirms the detection of TeV showers in GRAPES-3. The simulated distributions shown in Fig-3 are only for starting with 1 TeV, 5 TeV, and 10 TeV for better visibility. The GRAPES-3 EAS are selected for shower cores within the fiducial area and zenith angle up to 45∘ as done for simulations.
5 Calculation of efficiencies and acceptance
5.1 Trigger () and total efficiencies ()
By using the optimized =1 TeV, the energy range of 1 TeV–10 PeV is used to carry out detailed simulations for further studies. This energy range is divided into 20 equal intervals in logarithmic scale (width of 0.2). All the remaining other inputs are kept unchanged. The proton primaries are simulated and subjected to trigger generation in each energy interval. The number of simulated showers in each logarithmic interval is shown in Fig-LABEL:tab01. It is to be noted that the simulated showers are reused ten times by randomizing the shower core and secondary particles locations to enhance the statistics. Due to large area and randomized locations, reuse of showers help to boost the statistics unbiased.
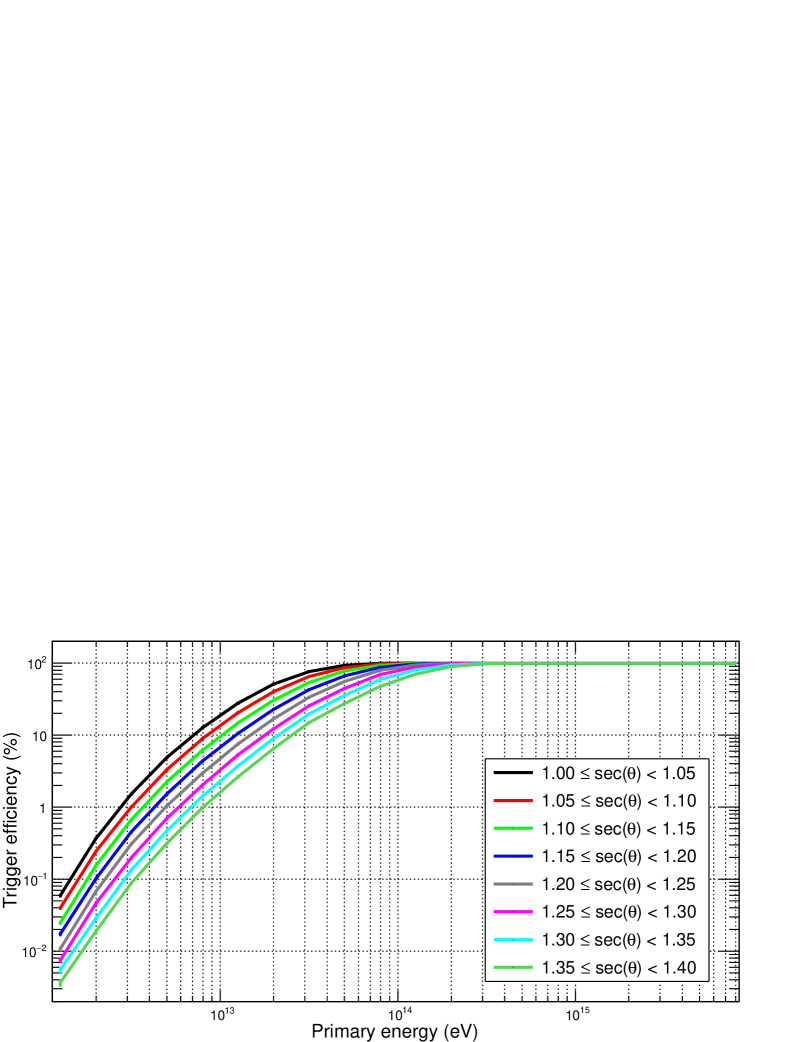
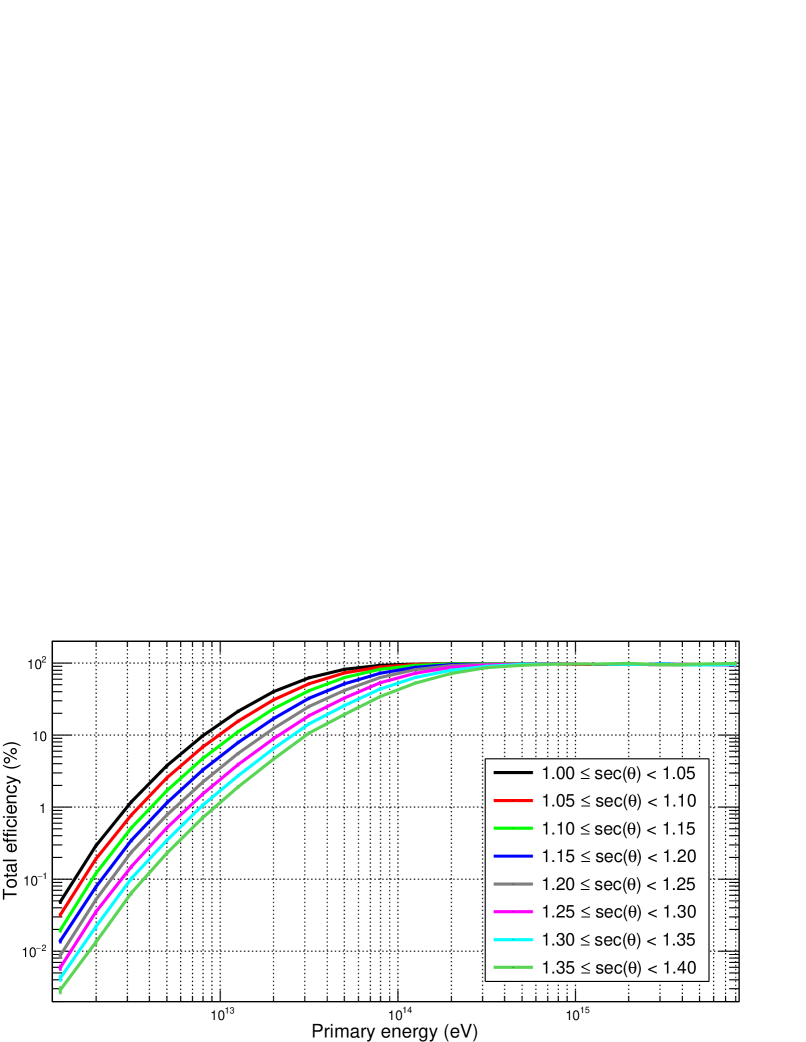
The showers are divided into eight equal sec() intervals (width of 0.05) up to 45∘ for further study of angular dependence. The fraction of triggered showers over total incident is treated as the triggering efficiency () as shown in Fig-4 for various sec() intervals as a function of energy. As discussed in previous section, the triggering efficiency is tiny (0.1%) at low energies and increases to maximum beyond 100 TeV. The inclined showers undergoes more interactions due to increased grammage in the atmosphere as they propagate down to observational level, which results in reduced particle densities and subsequently results lower triggering efficiencies. Afterwards, the triggered showers are reconstructed with NKG and the fit parameters are calculated. The number of usable showers further drops by a small factor due to inefficiency in reconstruction. This reconstruction efficiency is combined with the trigger efficiency and quoted as total efficiency () as shown in Fig-5 for proton initiated EAS as a function of energy and direction. These efficiencies determine the amount of usable showers available for analysis. Also, these inefficiencies have to be corrected in the flux calculations required for composition studies.
5.2 Total acceptance ()
The total efficiency () calculated by the above mentioned method is used to determine the acceptance () viewed by GRAPES-3 in the sky. The acceptance is defined by the field of view of the detector area with the inclusion of energy dependent efficiency (Eq-3). The parameter can be treated as a constant for a set of given energy and zenith angle bin. This can be expressed as Eq-4 in-terms of and to include angular dependent efficiency.
| (3) |
| (4) |
where = total fiducial area covered (14560 m2), = number of angular intervals, and = lower and upper edge of the angular interval, and = median energy in the logarithmic energy interval.
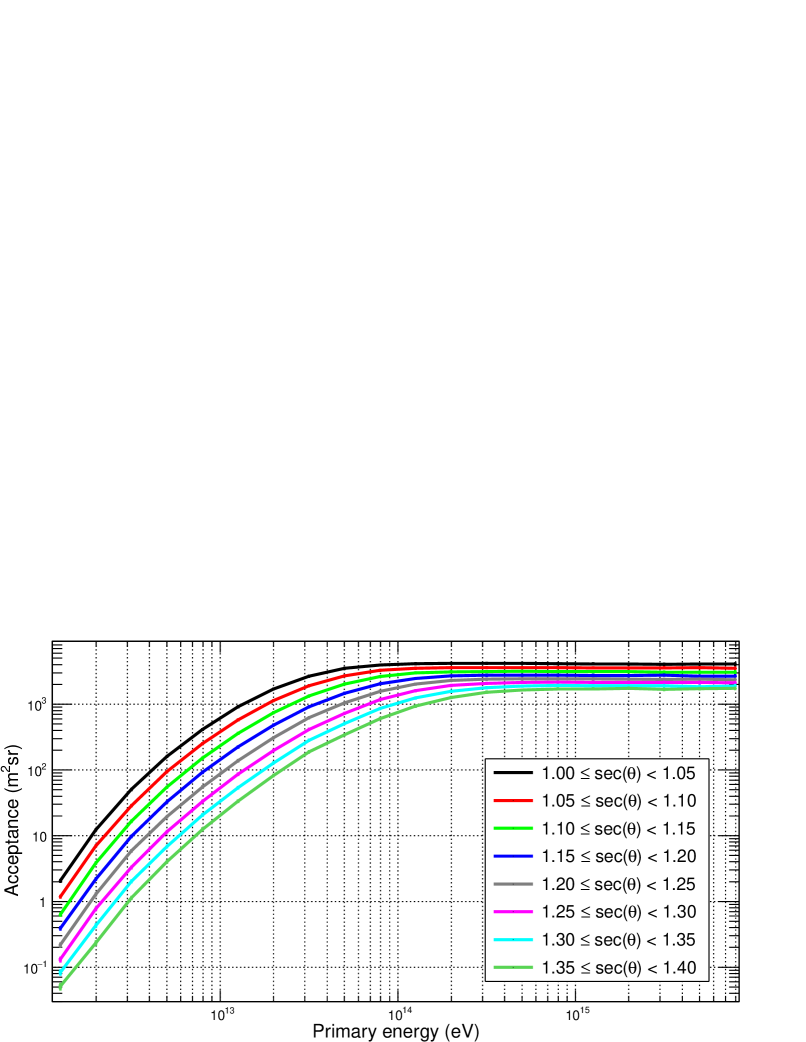
Eq-4 is evaluated for median value of every energy and lower, and upper limits of angular intervals. Fig-6 shows the total acceptance for proton primaries measured by GRAPES-3. Also, the total acceptance values are shown in Table-LABEL:tab01 that varies from 5 m2sr to 21000 m2sr. Especially at low energies, the total acceptance is larger compared to direct measurements by satellites and balloon borne experiments that are 0.5 m2sr dampe ; bess ; pamela_2 ; ams2_2 ; cream_2 .
6 Discussions
Detailed Monte Carlo simulations are carried out by using CORSIKA, Geant4, and in-house simulation framework to estimate the energy threshold, efficiencies, and acceptance of proton initiated EAS for GRAPES-3. The initial simulations are carried out to match the number of triggered detectors distribution obtained from the data. The simulation energy range is optimized by systematically reducing lower boundary of the energy range starting from Emin=10 TeV, 5 TeV, 3 TeV, and 1 TeV to Emax=3 PeV. A reasonably good agreement with data can be seen by simulations starting from 1 TeV compared to 10 TeV as shown in Fig-3, which indicates the detection of TeV proton EAS by GRAPES-3. Further simulations are carried out in the energy range of 1 TeV–10 PeV by equally dividing the energy range into logarithmic intervals. Also, each energy bin is further divided into sec() angular intervals and their dependences are studied. As shown in Fig-4, the trigger efficiency at 1 TeV is 0.1% and reaching to 100% at 100 TeV for near vertical protons. The trigger efficiency decreases with increasing angle. By combining this with NKG reconstruction, the total efficiency is estimated as shown in Fig-5. Due to the limited information recorded, the inefficiency of NKG reconstruction reduces the total efficiency by a small factor in most of the low energy regions. The efficiencies remain maximum at higher energies. The parameter gives the amount of usable EAS recorded by the GRAPES-3 in each energy interval. However, at higher energies, the showers are successfully reconstructed and and are unaffected. Because of the power-law nature of PCR energy spectrum, majority of the incident PCR are low energy primaries (i.e. in the given energy range of 1 TeV–10 PeV, almost 98% are below 10 TeV). At low energies, though the efficiencies are tiny, because of the large number of incident PCR, the GRAPES-3 records most of the low energy primaries useful for physics analysis.
This can be quantified with the parameter for a given experiment derived by combining , area, and solid angle as a function of energy. The geometrical acceptance is estimated to be 5 m2sr for protons of energy starting from 1 TeV and increasing to 20000 m2sr above 100 TeV as shown in Table-LABEL:tab01. The minor variations seen in the higher energy bins are an artifact of statistical fluctuations due to smaller number of simulated protons. It is important to note that the geometrical acceptance of GRAPES-3 has practical implications in measuring sizable amount of low energy primaries. The large sensitive area (2% of total physical area 25000 m2) of GRAPES-3 experiment allows to measure proton initiated EAS energies as small as 1 TeV. Especially, the acceptance of 5 m2sr at lower energy region is larger than direct measurements from balloon borne experiments and space probes, which are not more than 0.5 m2sr. This unique capability of GRAPES-3 experiment has been exploited in one of the recent work where PCR energy spectrum is reported to have fine features in the low energy region Fahim19 . A knee-like structure is observed at (45.40.3) TeV.
7 Conclusions
The energy threshold of the GRAPES-3 EAS array for primary proton is estimated to be 1 TeV through Monte Carlo simulations with reasonably good agreement with data. Further detailed simulations are carried out to estimate various efficiencies as a function of energy and direction. These simulations are carried out in the energy range of 1 TeV–3 PeV and zenith range of 0–45∘ by dividing into equal intervals. The total efficiency is estimated to be 0.1% for 1 TeV, and reaching maximum at 100 TeV. Though, the efficiency is tiny at low energies, the number of usable primaries are large due to immense flux of low energy PCRs. Similarly, the total acceptance of EAS array is estimated to be 5 m2sr for 1 TeV, and with a maximum of 20000 m2sr. The acceptance of 5 m2sr at 1 TeV is large compared to direct measurements. Thus, GRAPES-3’s measurements allow to overlap the energy spectrum from direct measurements at low energies. Also, the extension of energy measurements beyond knee by GRAPES-3 allows to overlap with indirect measurements at ultra-high energies. Hence, the GRAPES-3 may provide a unique handle to bridge the PCR energy spectrum from direct and indirect measurements.
Acknowledgements.
We thank D.B. Arjunan, A.S. Bosco, V. Jeyakumar, S. Kingston, N.K. Lokre, K. Manjunath, S. Murugapandian, S. Pandurangan, B. Rajesh, K. Ramadass, R. Ravi, V. Santhoshkumar, S. Sathyaraj, M.S. Shareef, C. Shobana, R. Sureshkumar, and other colleagues for their help in running and maintenance of the GRAPES-3 experiment.References
-
(1)
M. Casolino et al., Launch of the space experiment PAMELA. Advances in Space.
Research, Volume 42, Issue 3, 2008, Pages 455-466, -
(2)
B. Alpat, Alpha Magnetic Spectrometer (AMS02) experiment on the International
Space Station (ISS).
Nuclear Science and Techniques, 2003 August; 14(3): 182-194. -
(3)
J. Chang et al., The DArk Matter Particle Explorer mission.
Astroparticle Physics 95 (2017) 6–24. -
(4)
M. Boezio et al., The Cosmic–Ray Proton and Helium Spectra measured with the
CAPRICE98 balloon experiment.
Astropart.Phys. 19 (2003) 583-604. -
(5)
J.W. Mitchell et al., The BESS Program.
Nuclear Physics B - Proceedings Supplements, Volume 134, 2004, Pages 31-38. -
(6)
E.S. Seo, et al., Cosmic-ray energetics and mass (CREAM) balloon project.
Adv. Space. Res. 33 (2004) 1777–1785. -
(7)
G. Aielli et al., Highlights from the ARGO-YBJ experiment.
Nuclear Instruments and Methods in Physics Research A 661 (2012) S50–S55. -
(8)
M. Amenomori et al., Cosmic-ray energy spectrum around the knee obtained by the
Tibet experiment and future prospects.
Advances in Space Research Volume 47, Issue 4, 15 February 2011, Pages 629-639. -
(9)
T. Antoni et al., The cosmic ray experiment KASCADE.
Nucl. Instrum. Methods A 513 (2003) 490-510. -
(10)
G. Navarra et al., KASCADE-Grande: A large acceptance, high-resolution
cosmic-ray detector up to 1018 eV.
Nucl.Instrum.Meth. A518 (2004) 207-209. -
(11)
The Pierre Auger Collaboration, The Pierre Auger Cosmic Ray Observatory.
Nuclear Instruments and Methods in Physics Research A 798 (2015) 172–213. -
(12)
T. Abu-Zayyad et al., The surface detector array of the Telescope Array
experiment.
Nucl.Instrum.Meth. A689 (2012) 87–97. -
(13)
A. Menicucci et al., PAMELA: A matter-antimatter experiment in space.
http://articles.adsabs.harvard.edu//full/2003foap.conf..675M/0000679.000.html
2003foap.conf..675M. -
(14)
L. Arruda et al., Particle identification with the AMS-02 RICH
detector: and separation.
arXiv:0801.3243. -
(15)
Y.S. Yoon et al., Proton and Helium Spectra from the CREAM-III Flight.
The Astrophysical Journal, 839:5 (8pp), 2017. -
(16)
S.K. Gupta et al., GRAPES-3 A high-density air shower array for studies on the
structure in the cosmic-ray energy spectrum near the knee.
Nucl. Instrum. Methods A 540, 311 (2005). -
(17)
A. Chandra et al., Extending the range of particle densities observed by
GRAPES-3.
Proceedings of Science, PoS(ICRC2017)479. -
(18)
Y. Hayashi et al., A large area muon tracking detector for ultra-high energy
cosmic ray astrophysics - the GRAPES-3 experiment.
Nucl. Instrum. Methods A 545, 643 (2005). -
(19)
P.K. Mohanty et al., Fast fourier transform to measure pressure coefficient of
muons in the GRAPES- 3 experiment.
Astropart. Phys. 79, 23–30 (2016). -
(20)
K.P. Arunbabu et al., Dependence of the muon intensity on the atmospheric
temperature measured by the GRAPES-3 experiment.
Astropart. Phys. 94, 22–28 (2017). -
(21)
B. Hariharan et al., Measurement of the Electrical Properties of a Thundercloud
Through Muon Imaging by the GRAPES-3 Experiment.
Phys. Rev. Lett. 122, 105101 (2019). -
(22)
P.K. Mohanty et al., Transient weakening of Earth’s magnetic shield probed by a
cosmic ray burst.
Phys. Rev. Lett. 117, 171101 (2016). -
(23)
P.K. Mohanty et al., Was the cosmic ray burst detected by the GRAPES-3 muon
telescope on 22 June 2015 caused by a transient weakening of the geomagnetic
field or by an interplanetary anisotropy?
Phys. Rev. D 97, 082001 (2018). -
(24)
S.K. Gupta et al., Measurement of arrival time of particles in extensive air
showers using TDC32.
Experimental Astronomy, DOI 10.1007/s10686-012-9320-3. -
(25)
V.B. Jhansi et al., The angular resolution of GRAPES-3 EAS array after
correction for the shower front curvature.
arXiv:1911.04715. -
(26)
K. Kamata, J. Nishimura, The Lateral and the Angular Structure Functions of
Electron Showers.
Progress of Theoretical Physics Supplement, No. 6, pp. 93-155.
K. Greisen, Cosmic Ray Showers. Annual Review of Nuclear and Particle Science, vol. 10, pp.63-108. -
(27)
H. Tanaka et al., Studies of the energy spectrum and composition of the primary
cosmic rays at 100-1000 TeV from the GRAPES-3 experiment.
Journal of Physics G: Nuclear and Particle Physics, 39 (2012) 025201. -
(28)
D. Heck, J. Knapp, J.N. Capdevielle, G. Schatz, and
T. Thouw, Report FZKA 6019 (1998), Forschungszentrum
Karlsruhe; available from
http://www-ik.fzk.de/corsika/physics_description/corsika_phys.html - (29) T. Pierog et al., arXiv:1306.0121[hep-ph] (2013).
- (30) N.N. Kalmykov, S.S. Ostapchenko, and A.I. Pavlov, Nucl. Phys. B (Proc. Suppl.) 52B (1997) 17.
- (31) S.S. Ostapchenko, Phys. Rev. D83 (2011) 014018.
- (32) R. Engel, T.K. Gaisser, P. Lipari, and T. Stanev, Proc. Int. Cosmic Ray Conf., Salt Lake City (USA), 1 (1999) 415; E.-J. Ahn, R. Engel, T.K. Gaisser, P. Lipari, and T. Stanev, Phys. Rev. D80 (2009) 094003.
- (33) K. Werner, Phys. Rep. 232 (1993) 87.
- (34) J. Ranft, Phys. Rev. D51 (1995) 64; arXiv:hep-ph/9911213 and hep-ph/9911232 (1999).
- (35) H.J. Drescher, M. Hladik, S. Ostapchenko, T. Pierog, and K. Werner, Phys. Rep. 350 (2001) 93 (preprint hep-ph/0007198 (2000)).
- (36) H. Fesefeldt, Report PITHA-85/02 (1985), RWTH Aachen; available from: http://cds.cern.ch/record/162911/files/CM-P00055931.pdf
- (37) A. Fassò, A. Ferrari, S. Roesler, P.R. Sala, G. Battistoni, F. Cerutti, E. Gadioli, M.V. Garzelli, F. Ballarini, O.Ottolenghi, A. Empl and J. Ranft, The physics models of FLUKA: status and recent developments, Computing in High Energy and Nuclear Physics 2003 Conference (CHEP2003), La Jolla, CA (USA), March 24-28, 2003 (paper MOMT005); eConf C0303241 (2003); arXiv:hep-ph/0306267; http://www.fluka.org/references.html
- (38) S.A. Bass et al., Prog. Part. Nucl. Phys. 41 (1998) 225; M. Bleicher et al., J. Phys. G: Nucl. Part. Phys. 25 (1999) 1859; http://urqmd.org/
-
(39)
V.N. Ivanchenko et al., Geant4 toolkit for simulation of HEP experiments.
Nucl.Instrum.Meth. A502 (2003) 666-668. -
(40)
F. Varsi et al., Energy spectrum and composition measurements of cosmic rays
from GRAPES-3 experiment.
Proceedings of Science, PoS(ICRC2019)449.