An Epidemic Model SIPHERD and its application for prediction of the spread of COVID-19 infection for India and USA
Abstract
We propose an epidemic model SIPHERD in which three categories of infection carriers Symptomatic, Purely Asymptomatic, and Exposed are considered with different rates of transmission of infection that are taken dependent on the lockdown and social distancing. The rate of detection of the infected carriers is taken dependent on the tests done per day. The model is applied for the COVID outbreak in Germany and South Korea to validate its predictive capabilities and then applied to India and the United States for the prediction of its spread with different lockdown situations and testing in the coming months.
I Introduction
The outbreak of pandemic Coronavirus disease 2019 (COVID-19) has led to more than 4 million total infections and 285 thousand deaths worldwide worldo , and serious efforts are needed for its containment. The Coronavirus SARS-CoV-2 has affected not just the public health but made a drastic impact on the economy of the world as well due to the lockdown situations in many countries.
Pandemics have hit humanity many times in the past as well, and mathematical models are already available for infectious diseases. Modeling and simulation can help to predict the extent of the contagious disease and can give useful inputs on correction measures for its containment. In order to devise the lockdown strategy, it is important that the prediction of the disease spread is available to the decision-makers. COVID-19 is different from the previously known SARS (Severe acute respiratory syndrome) infection, such as the existence of purely asymptomatic cases diamond and the spread of the infection from them as well as from the exposed ones in the incubation period german . Our proposed mathematical model, SIPHERD incorporates the above facts for the COVID-19 epidemic.
Many epidemiological models exist in the literature, and the basic SIR model SIR is the widely used one, which needs to be modified to incorporate the complexities involved in Coronavirus spread and control. An approximate mathematical model of the COVID-19 is initially reported in the literature ref4 based on the Between-Countries Disease Spread (Be-CoDiS), which is a spatial epidemiological model for the study of the spread of human diseases between and within the countries.
An improved mathematical model for the spread of COVID-19 is proposed in ref5 , by taking into account the infected and undetected cases. But this study and forecast is particularly based only on China.
An extended SIR model is proposed in sidarthe , in which the entire people in the country are divided into eight compartments. Though it is an improved version of the SIR model, the study and simulation results are done only for Italy, and the model does not take into account purely Asymptomatic cases and the role of tests done per day. Another compartmental epidemic model SEIR ref8 forecast for few countries and the impact of the quarantine on the COVID-19 is investigated. A better adaptive and improved version of the SIR model is illustrated in ref9 . In this method, the time dependency of some parameters used for the analysis makes it more robust than the conventional SIR method. Some other curve fitting based methods are also available in the literature for the forecast of COVID-19 in ref10 , ref11 and ref12 . Although these methods can track the available data correctly, they are not developed based on the physical insights that affect the rate of spreading of the disease and also it is extremely sensitive to the initial conditions.
In this paper, we formulate the mathematical model SIPHERD for the COVID-19 epidemic and apply it for forecasting the number of active cases, confirmed cases, daily new cases, and deaths for India and USA, depending on the lockdown strategy and the number of tests performed per day.
II Model
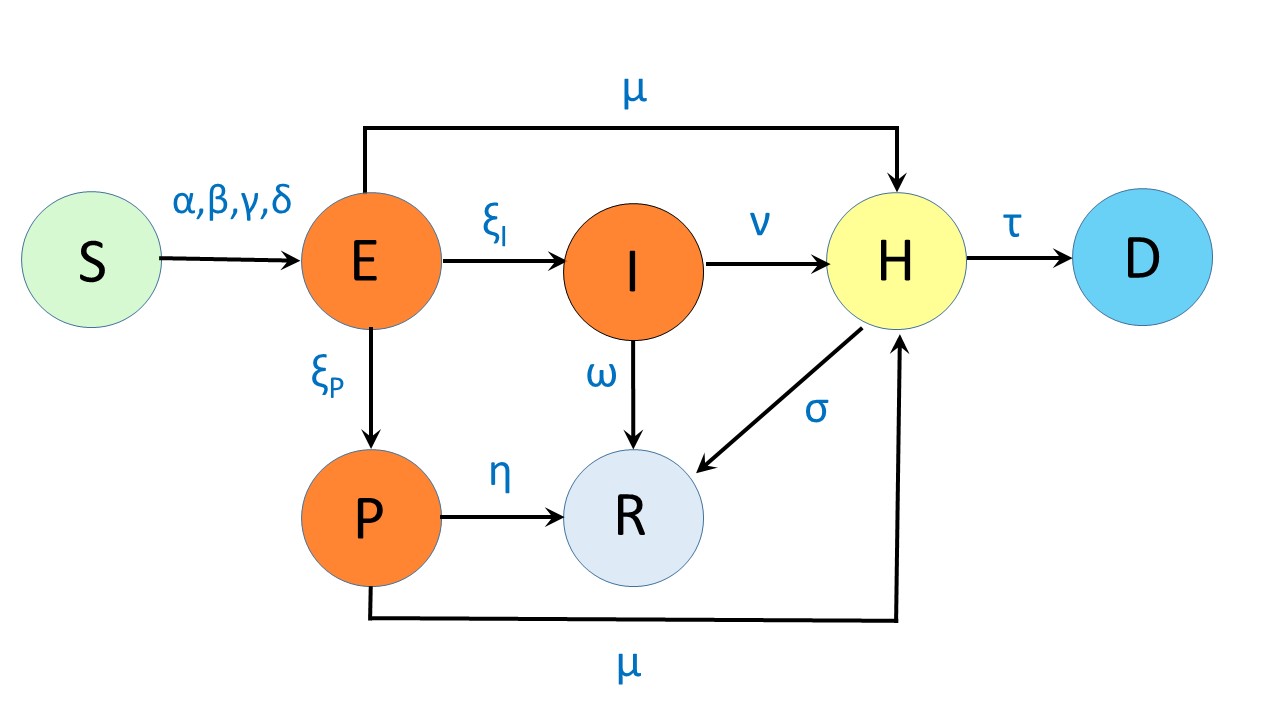
We model the evolution of the COVID-19 disease by dividing the population into different categories as listed below. As seen in FIG. 1, the rates of transfer from one category to another can are the model parameters and a set of differential equations for the entity in each category can be formed. We write the model equations that are independent of the population of the country by considering the fraction of the people in each category.
-
•
S - fraction of the total population that is healthy and has never caught the infection
-
•
E - fraction of the total population that is exposed to infection, transmit the infection and turn into either Symptomatic or purely Asymptomatic, and not detected
-
•
I - fraction of the total population infected by the virus that shows symptoms and undetected
-
•
P - fraction of the total population infected by the virus that doesn’t show symptoms even after the incubation period and undetected. These are the purely Asymptomatic cases
-
•
H - fraction of the total population that are found positive in the test and either hospitalized or quarantined
-
•
R - fraction of the total population that has recovered from the infection
-
•
D - fraction of the total population that are extinct due to the infection.
The SIPHERD model equations are a set of coupled ordinary differential equations (1 to 7) for the defined entities (S,I,P,H,E,R,D), where initial conditions E(0), P(0) and I(0) are not exactly known. The various rates listed in TABLE 1 are the parameters of the problem which are also not known, and only possible range is available. Some of the parameters such as rates of infection (, , ) change with time in steps, depending on the conditions such as lockdown.
| (1) | |||||
| (2) | |||||
| (3) | |||||
| (4) | |||||
| (5) | |||||
| (6) | |||||
| (7) |
where, and are the delay associated with the recovery and death respectively with respect to active cases . We have taken into account this delay because the active cases are reported after the testing and admission to healthcare or quarantine center and the number of recovery and death of the admitted will not immediately follow the active or category number. All fractions add up to unity that can also be seen from summing the above equations.
| (8) |
| Parameter | Description |
|---|---|
| Rate of transmission of infection from E to S | |
| Rate of transmission of infection from I to S | |
| Rate of transmission of infection from P to S | |
| Rate of transmission of infection from H to S | |
| Rate of conversion from the E to I,P | |
| Rate of home recovery of H | |
| Rate of home recovery of P | |
| Probability of E and P being detected | |
| Probability of I being detected |
The probability of getting the infection is assumed uniform among the susceptible people, although the disease spreads localised in hot-spots.
The asymptomatic proportion of the infected persons onboard the Diamond Princess cruise ship is estimated in diamond . Among the 634 tested positive onboard, 328 were found asymptomatic i.e., more than 50 percent of the confirmed cases were not showing any specific symptoms of COVID-19. This factor is incorporated in the model by considering the purely Asymptomatic category. The ratio of purely Asymptomatic (P) to total Asymptomatic (E+P) cases is reported to be 0.35 and the ratio of purely Asymptomatic to the total infected (E+P+I) is 0.179 diamond . These reported numbers are used to fix the proportion between and as 0.36 and the proportion of initial conditions , and as well. In other words, out of 100 exposed cases, after the incubation period, 36 will turn to be purely asymptomatic, and 74 will have symptoms.
Coronavirus-nCoV2 has shown particular characteristics that the asymptomatic patients do transmit the disease. The infection can be transmitted from the person who is not showing illness during the incubation period german . This can be included in the model by considering category people and their transmission as well. Hospitalized and quarantined cases can also transmit the disease, and this small rate is taken as parameter .
The detection of the Asymptomatic and Symptomatic cases can be taken dependent on the number of tests done per day (). For the Symptomatic cases, the detection is more probable as the infected person can approach for the tests and more likely to be tested. The detection of Symptomatic is taken in two parts, one a constant and another part proportional to the tests done per day. This can be written in terms of parameters as,
| (9) |
| (10) |
where, , , and are positive constants. Recovery of Asymptomatic cases is taken faster than the Symptomatic cases. The total confirmed cases are the addition of the active cases, extinct cases, and a part of the recovered that were detected. This can be written as
| (11) |
III Numerical Implementation and Simulation
The set of coupled ordinary differential equations for the model can be readily solved numerically for a given set of parameters and initial values. The non-trivial part is the accurate determination of the parameters that will mimic the situation on the ground. The mathematical problem is to take into account the four actual data sets of the total number of confirmed cases, active cases on a particular day, cumulative deaths and tests done per day, and find the set of parameters that will provide the best possible match between the data and model. The extraction of the parameters is also to be automated so that the model can be run on data for various countries. A cost function is written in terms of errors between the actual and solver data sets. The minimizer of the cost can be found to obtain the optimized set of parameters that best fit with the data available till date. The model and the optimization scheme is implemented in MATLAB.
IV Results and Discussion
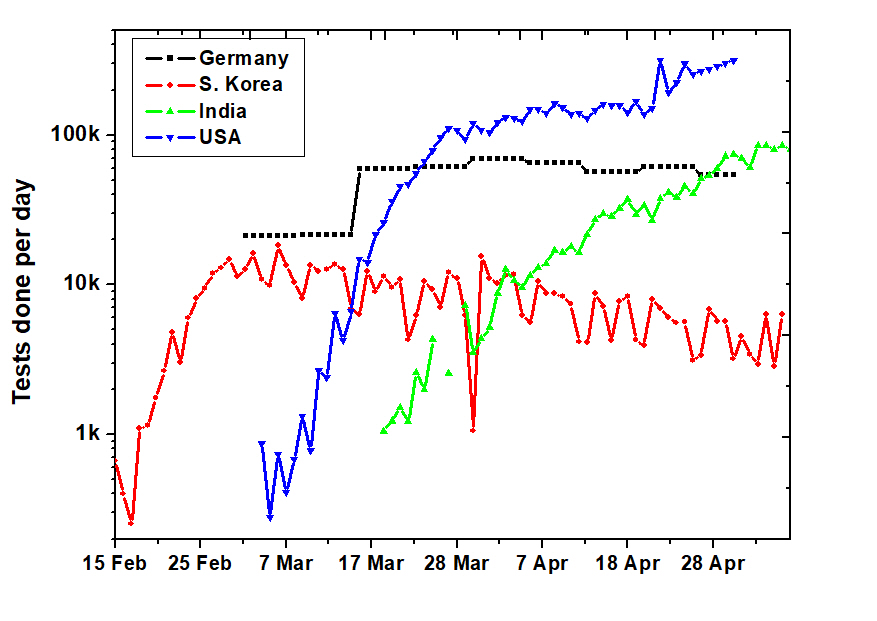
We collected the number of total positive or confirmed cases, present active cases and deaths from worldo , covid19india , and the number of tests per day from worldo1 , which is plotted in FIG. 2. The day on which lockdown is imposed in a country is also taken into account as changes in the slopes of the data are observed according to it. The rate of transmission of infection from the Asymptomatic carrier (, ) for a country is taken higher than the Symptomatic ones () as the Asymptomatic carrier may not be aware of his/her infection, and Susceptible may not be keeping distance as no symptoms are seen. The mortality rate () is taken different for different countries as it depends on the immunity and how effectively the critical patients are taken care of by the hospitals.
The home recovery rates of Asymptomatic () and Symptomatic (), rate of transmission of infection from hospitalized and quarantined (), and rate of self-reporting of the Symptomatic people () are taken uniform for all countries. The transfer rate is the inverse of the incubation period, whose mean is reported 5.2 days zhang_lancet . The parameters determined by our model are listed in TABLE 2 for the countries we studied.
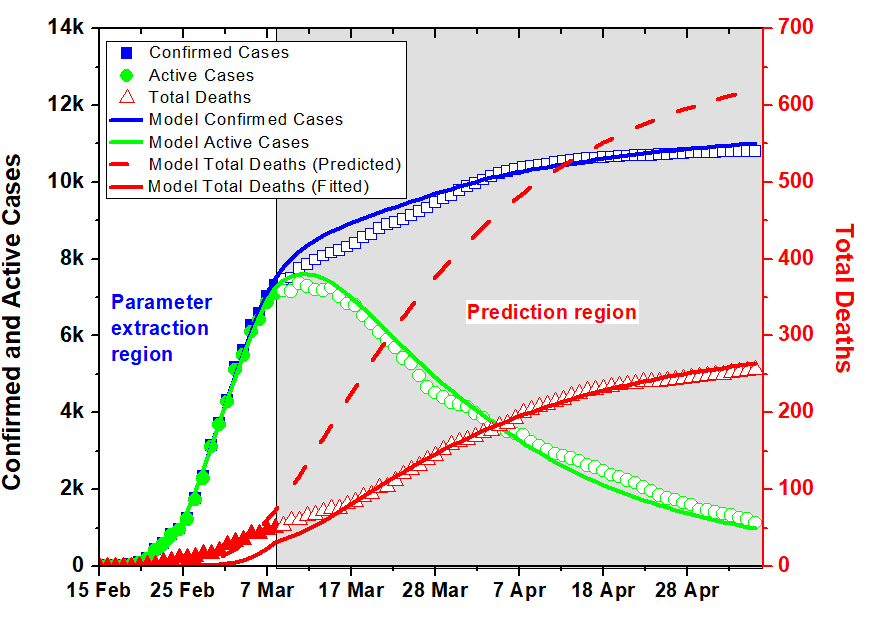
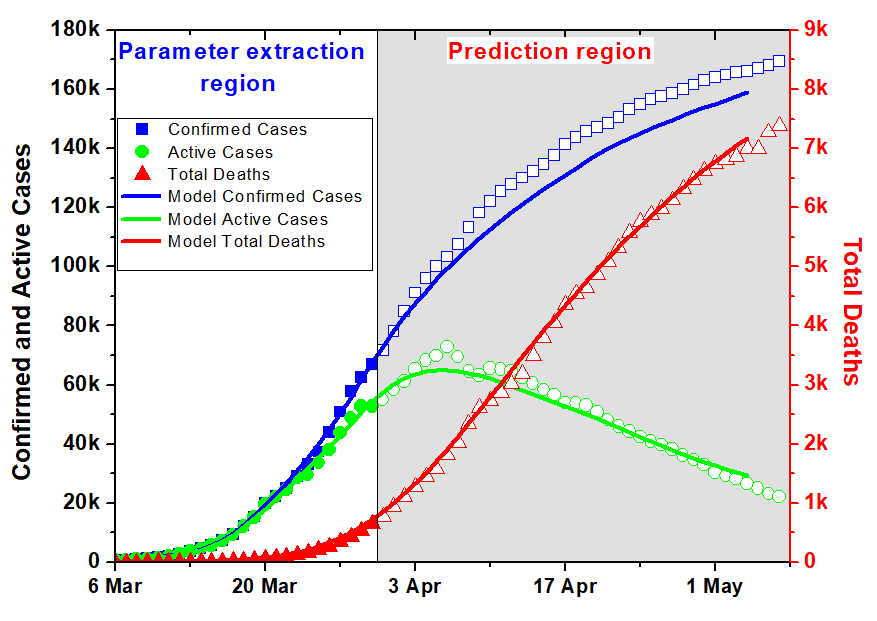
IV.1 Model Validation
We apply the SIPHERD model to South Korea and Germany for exhibiting the predictive capability of our model as the disease has almost reached the end stages in these countries. We used the data for the first 23 and 40 days, respectively, for these counties i.e., till March and March and compared the future evolution generated by the model to the actual data as shown in the grey region in FIG. 3 for South Korea and in FIG.4 for Germany. Model predicted higher deaths for South Korea as the mortality rate 2.2E-3 was higher before March 9 that improved later to fitted value 0.9E-3.
IV.2 Predictions for India
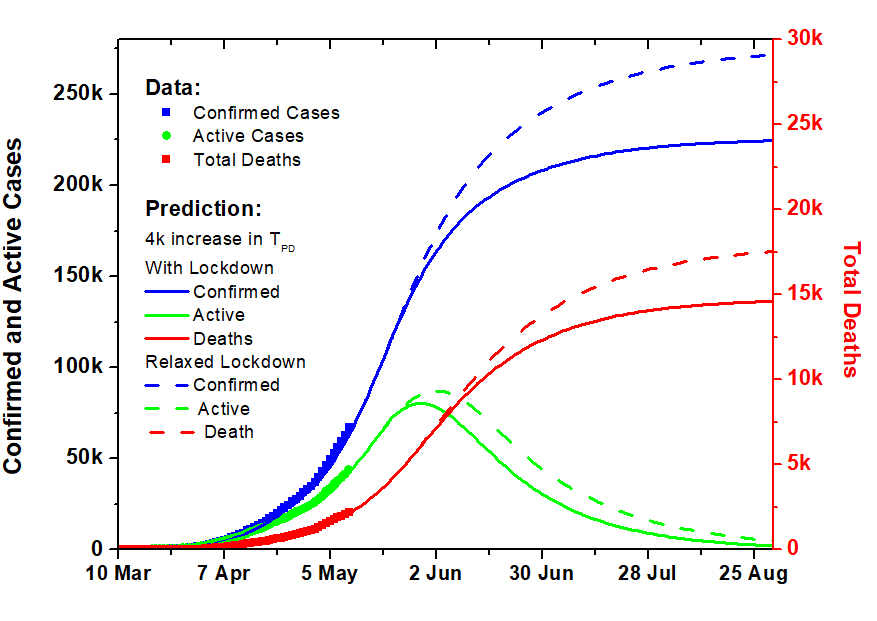
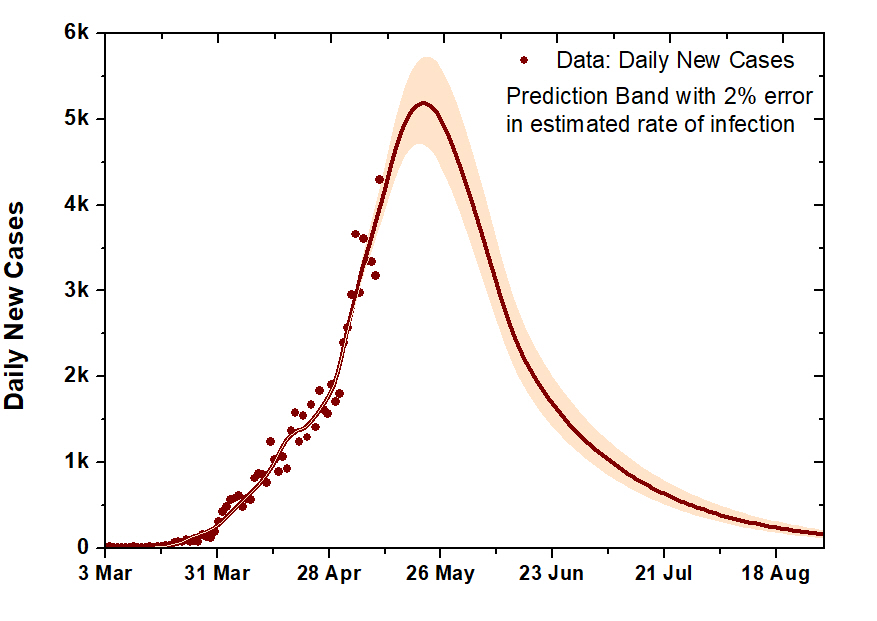
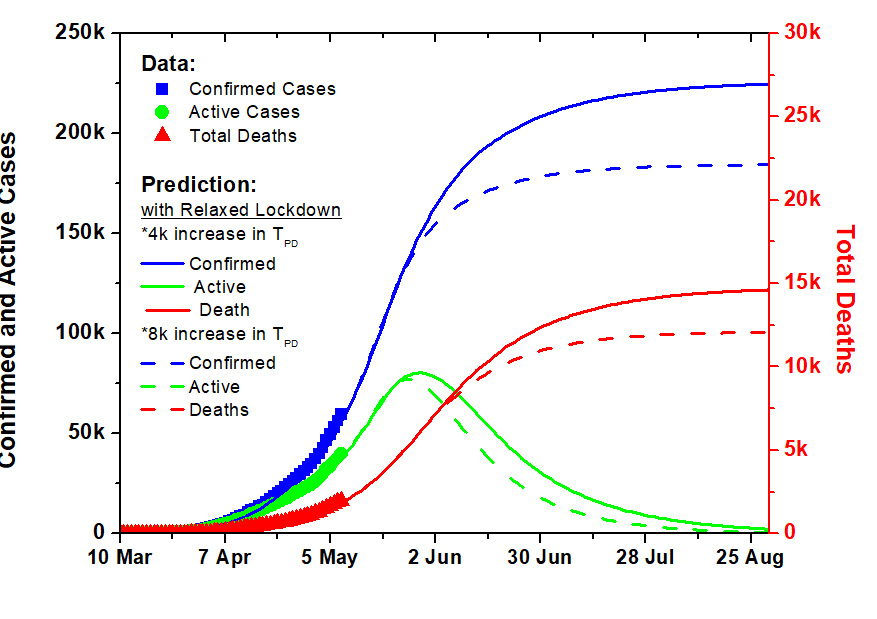
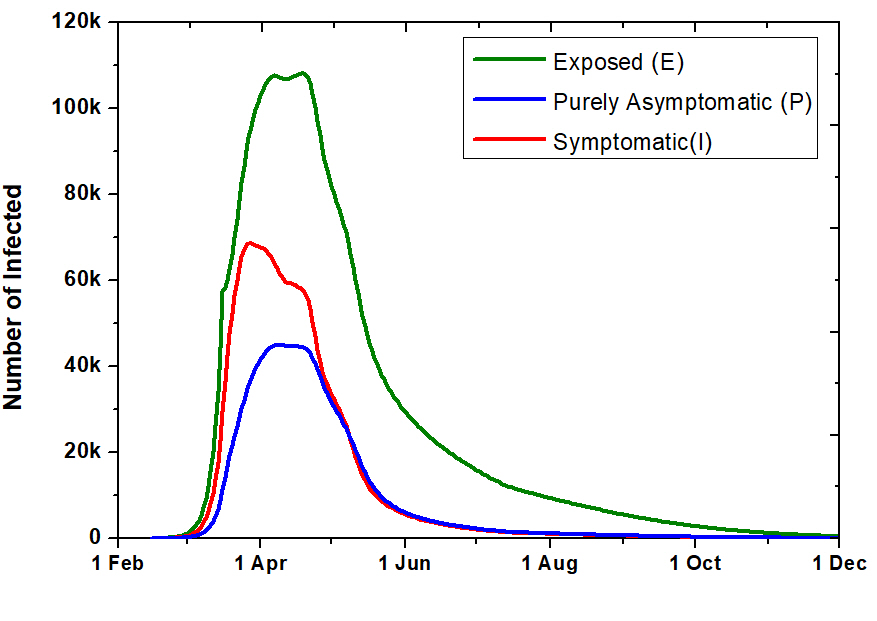
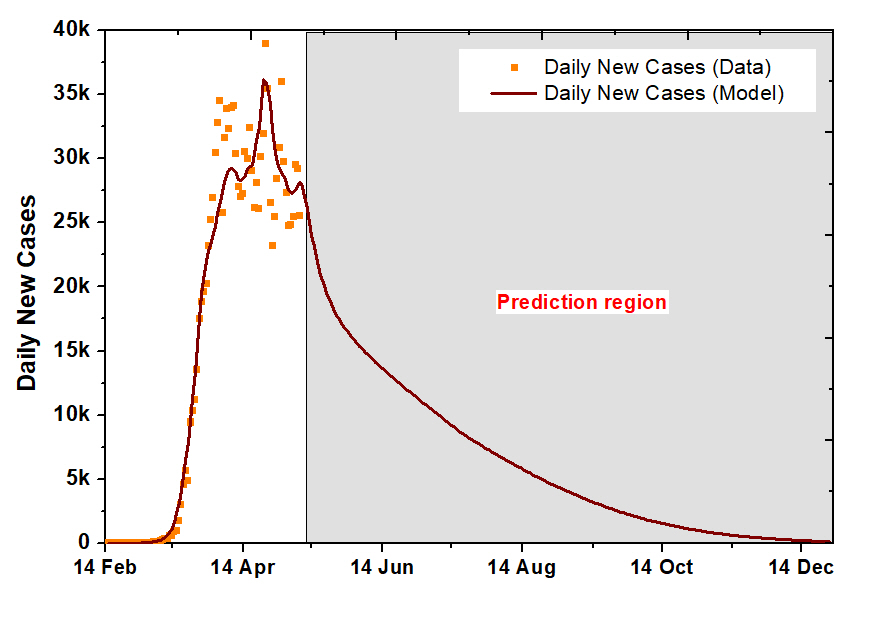
For the available data till date, we run the model to extract parameters, and then with the extracted parameters, the model is run for 180 days starting from March 2nd. If the lockdown conditions are relaxed on May 17th, the rate of transmission of infection is going to increase. In the relaxed lockdown, the and values are assumed to jump by 20. The prediction for both cases, with a 4k increase in tests per day and saturation at 200k tests, is compared in FIG. 5 and in FIG. 6, we plot the prediction band for the daily new cases considering two percent error in the estimation of rate of transmission of infection. We compare the effect of testing on the prediction in FIG. 7. Total, Active and extinct cases are plotted for the coming months if tests per day are increased by 4k and 8k per day after May 11th and saturated at 200k and 300k, respectively, taking into account the relaxation of lockdown after May 17th.
IV.3 Predictions for USA
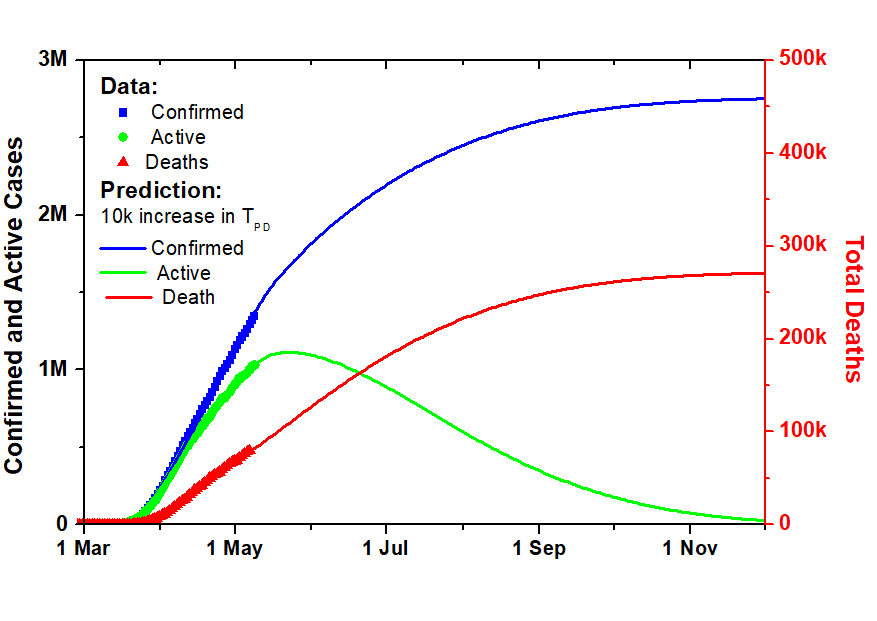
The recovery rate of the category is found to be slow compared to South Korea or Germany, which may be attributed to either incorrect reporting of the Active cases or the testing of serious cases only and longer recovery time in hospitals compared to quarantined with mild symptoms. The prediction for the next 240 days, that is till the end of the year 2020, is plotted in FIG. 8 for 10k test per day and saturated at 1 million tests per day. The recovery rate is taken improved by 25 after May 4th and mortality rate is taken improved in steps from initial 6E-3 to 4E-3 to 2.5E-3 after April 9th and April 19th. The time evolution of the totally unknown and undetected part of the infected for USA is plotted in FIG. 9. The daily new positive cases data and the prediction are plotted in FIG. 10.
| Para. | Germany | S. Korea | India | USA |
|---|---|---|---|---|
| Population N | 8.30E7 | 5.10E7 | 1.38E9 | 3.31E8 |
| 21Feb | 15Feb | 3Mar | 15Feb | |
| 22 | 21 | 21,5 | 45 | |
| (bf. LD) | 0.32 | 0.39 | 0.33 | 0.33 |
| (af. LD) | 0.30,0.2 | 0.085 | 0.18,0.23 | 0.13 |
| (bf. LD) | 0.29,0.11 | 0.22 | 0.1 | 0.26 |
| (af. LD) | 0.24 | 0.074 | 0.05,0.18 | 0.20 |
| (bf. LD) | 0.32 | 0.39 | 0.33 | 0.33 |
| (af. LD) | 0.29 | 0.085 | 0.18 | 0.13 |
| 9E-3 | 9E-3 | 9E-3 | 9E-3 | |
| 0.2 | 0.2 | 0.2 | 0.2 | |
| 0.072 | 0.072 | 0.072 | 0.072 | |
| 2.03E-6 | 2.74E-5 | 1.13E-6 | 5E-7 | |
| 0.05 | 0.05 | 0.05 | 0.05 | |
| / | 5.34 | 1.09 | 4.98 | 3.36 |
| 0.1 | 0.1 | 0.1 | 0.1 | |
| 0.07 | 0.07 | 0.07 | 0.07 | |
| 0.059 | 0.034 | 0.047 | 0.013 | |
| 3.5E-3 | 0.9E-3 | 5E-3,3E-3 | 5E-3 | |
| 5 | 7 | 7 | 10 | |
| 5 | 4 | 1 | 1 | |
| Ini. Infected | 50 | 150 | 100 | 40 |
V Conclusion
SIPHERD model is developed by considering purely Asymptomatic category of COVID-19 infected cases in addition to the Symptomatic, and the disease spread by the exposed. The effect of lockdown on the rates of transmission of infection and the influence of tests per day on detection rates has been incorporated in the model. The SIPHERD model is put for trial for the data of South Korea and Germany, and with a limited number of days data, the model is found to correctly predict the known evolution. The prediction for India suggests that even increasing the rate of infection transmission by 20 due to relaxation of lockdown leads to around 50k increase in the total number of cases and 3k increase in total deaths. The prediction for the USA shows that in the absence of vaccine the infection can last long till the end of this year and number of deaths could be around 250k if lockdown and social distancing conditions remain the same.
Acknowledgement
AM would like to thank Dr. Shrikant Ambalkar, M.D for helpful discussions.
References
- (1) https://www.worldometers.info/coronavirus.
- (2) K. Mizumoto, K. Kagaya, A. Zarebski, and G. Chowell, “Estimating the asymptomatic proportion of coronavirus disease 2019 (covid-19) cases on board the diamond princess cruise ship, yokohama, japan, 2020,” Eurosurveillance, vol. 25, no. 10, p. 2000180, 2020.
- (3) C. Rothe, M. Schunk, P. Sothmann, G. Bretzel, G. Froeschl, C. Wallrauch, T. Zimmer, V. Thiel, C. Janke, W. Guggemos et al., “Transmission of 2019-ncov infection from an asymptomatic contact in germany,” New England Journal of Medicine, vol. 382, no. 10, pp. 970–971, 2020.
- (4) W. O. Kermack and A. G. McKendrick, “A contribution to the mathematical theory of epidemics,” Proceedings of the royal society of london. Series A, Containing papers of a mathematical and physical character, vol. 115, no. 772, pp. 700–721, 1927.
- (5) B. Ivorra and A. M. Ramos, “Application of the be-codis mathematical model to forecast the international spread of the 2019–20 wuhan coronavirus outbreak,” ResearchGate http://dx. doi. org/10.13140/RG. 2.2, vol. 31460, 2020.
- (6) B. Ivorra, M. Ferrández, M. Vela-Pérez, and A. Ramos, “Mathematical modeling of the spread of the coronavirus disease 2019 (covid-19) considering its particular characteristics. the case of china,” Technical report, MOMAT, 03 2020, Tech. Rep., 2020.
- (7) G. Giordano, F. Blanchini, R. Bruno, P. Colaneri, A. Di Filippo, A. Di Matteo, M. Colaneri et al., “A sidarthe model of covid-19 epidemic in italy,” arXiv preprint arXiv:2003.09861, 2020.
- (8) D. Efimov and R. Ushirobira, “On an interval prediction of covid-19 development based on a seir epidemic model,” 2020.
- (9) Y.-C. Chen, P.-E. Lu, C.-S. Chang, and T. Liu, “A time-dependent sir model for covid-19 with undetectable infected persons,” arXiv preprint arXiv:2003.00122, 2020.
- (10) S. Zhao, Q. Lin, J. Ran, S. S. Musa, G. Yang, W. Wang, Y. Lou, D. Gao, L. Yang, D. He et al., “Preliminary estimation of the basic reproduction number of novel coronavirus (2019-ncov) in china, from 2019 to 2020: A data-driven analysis in the early phase of the outbreak,” International journal of infectious diseases, vol. 92, pp. 214–217, 2020.
- (11) T. Zeng, Y. Zhang, Z. Li, X. Liu, and B. Qiu, “Predictions of 2019-ncov transmission ending via comprehensive methods,” arXiv preprint arXiv:2002.04945, 2020.
- (12) Z. Hu, Q. Ge, L. Jin, and M. Xiong, “Artificial intelligence forecasting of covid-19 in china,” arXiv preprint arXiv:2002.07112, 2020.
- (13) https://www.covid19india.org.
- (14) https://ourworldindata.org/grapher/full-list-covid-19-tests-per-day.
- (15) J. Zhang, M. Litvinova, W. Wang, Y. Wang, X. Deng, X. Chen, M. Li, W. Zheng, L. Yi, X. Chen et al., “Evolving epidemiology and transmission dynamics of coronavirus disease 2019 outside hubei province, china: a descriptive and modelling study,” The Lancet Infectious Diseases, 2020.