All-electrical monitoring of bacterial antibiotic susceptibility in a microfluidic device
Abstract
The lack of rapid antibiotic susceptibility tests adversely affects the treatment of bacterial infections and contributes to increased prevalence of multidrug resistant bacteria. Here, we describe an all-electrical approach that allows for ultra-sensitive measurement of growth signals from only tens of bacteria in a microfluidic device. Our device is essentially a set of microfluidic channels, each with a nano-constriction at one end and cross-sectional dimensions close to that of a single bacterium. Flowing a liquid bacteria sample (e.g., urine) through the microchannels rapidly traps the bacteria in the device, allowing for subsequent incubation in drugs. We measure the electrical resistance of the microchannels, which increases (or decreases) in proportion to the number of bacteria in the microchannels. The method and device allow for rapid antibiotic susceptibility tests in about two hours. Further, the short-time fluctuations in the electrical resistance during an antibiotic susceptibility test are correlated with the morphological changes of bacteria caused by the antibiotic. In contrast to other electrical approaches, the underlying geometric blockage effect provides a robust and sensitive signal, which is straightforward to interpret without electrical models. The approach also obviates the need for a high-resolution microscope and other complex equipment, making it potentially usable in resource-limited settings.
KEYWORDS: Antibiotic Susceptibility Testing, Growth and Morphology, Antibiotic Resistance, Microfluidics.
I Introduction
Multidrug resistant bacteria pose an increasingly serious threat to global public health Brown and Wright (2016). While drug resistance in bacteria occurs naturally due to random genetic mutations and genetic exchanges between strains and species, it is accelerated partly because of inappropriate antibiotic use Blair et al. (2015). Strategies, such as rapid point-of-care antibiotic susceptibility testing, can facilitate targeted antibiotic treatments and impede the spread of antibiotic resistance Ataee et al. (2012); Jenkins and Schuetz (2012); van Belkum et al. (2018). However, standard antibiotic susceptibility tests (ASTs) suffer from a lengthy cell culture step and take 24-48 hours to complete Balouiri et al. (2016); Khan et al. (2019a). Given the risks associated with delayed therapy, physicians typically have little choice but to empirically prescribe broad-spectrum antibiotics while waiting for the microbiological analysis Gonzalez-Gonzalez et al. (2015); Copp et al. (2011). The development of rapid ASTs would improve morbidity and mortality and could help reduce the prevalence of multidrug resistant bacteria Li and Webster (2018).
The “gold standard” ASTs are phenotypic and measure the growth of bacteria in the presence of antibiotics on solid agar plates or in liquid solutions. After incubation for 24-48 hours, the susceptibility of the bacterial strain can be determined from the growth size and patterns on the plate or the optical density (OD) of the liquid solution Jenkins and Schuetz (2012). Polymerase chain reaction (PCR) provides the quintessential genotypic AST Rajivgandhi et al. (2018). PCR directly detects the resistance gene(s) from a very small bacteria sample and hence is quite rapid. However, it still has limited utility, because only a few resistance genes are firmly associated with phenotypic antibiotic resistance and newly-acquired resistance mechanisms may not be detectable Hughes and Andersson (2017).
Given the limitations of mainstay ASTs, there is a significant push for developing novel methods that can inform on bacterial resistance at early stages of cell growth. These novel and emerging ASTs typically employ microfluidics and microdevices because these devices allow for effective sample use and are sensitive to small signals Dai et al. (2016). State-of-the-art approaches isolating bacteria in nanodroplets Kang et al. (2019); Boedicker et al. (2008), on microbeads Wang et al. (2018), inside microfluidic channels Baltekin et al. (2017); Li et al. (2019); Mannoor et al. (2010); Chen et al. (2016); Besant et al. (2015), and on and inside micromechanical resonators Stupar et al. (2017) have all allowed testing on a few cells and even single cells. These approaches involve a variety of transduction mechanisms to access the response of bacteria to antibiotics, including high-resolution imaging Kang et al. (2019); Boedicker et al. (2008); Baltekin et al. (2017); Li et al. (2019), mechanical Wang et al. (2018); Stupar et al. (2017), impedance Mannoor et al. (2010), and electrochemical sensing Chen et al. (2016); Besant et al. (2015). More recently, high-resolution imaging of growth of bacteria trapped in microchannels Baltekin et al. (2017); Li et al. (2019) have allowed for ASTs in under an hour Baltekin et al. (2017). While ingenious, each method comes with some drawbacks Behera et al. (2019), and it remains to be seen whether or not any will achieve sufficient robustness needed for routine clinical practice.
Our method and device build on the positive attributes of recent approaches and address some of their shortcomings. As in earlier work Baltekin et al. (2017); Li et al. (2019), we trap and incubate cells in a microfluidic channel; our measurement, however, is entirely electrical. The effect underlying the bacterial growth signal in our device is simple geometric blockage: as bacteria grow (or die) in the microchannel, the channel resistance to electrical current increases (decreases). The change in the number of bacteria in the device, therefore, is directly proportional to the measured resistance change, and is available without fits to multi-parameter circuit models Yang and Bashir (2008). The device can directly be used with urine and probably other bodily fluids, provided that the fluids contain ions. Another interesting and useful attribute of the approach is that it provides electrical clues on how bacteria respond to antibiotics. We observe different short-time fluctuation patterns in electrical signals coming from bacteria incubated in bacteriostatic and bactericidal antibiotics, suggesting that morphological changes are also encoded into the electrical signals. In cases where both growth and morphological analysis are required, this unique feature may be useful Choi et al. (2014); Pitruzzello et al. (2019); Khan et al. (2019b). We re-emphasize that microscopy is not required in our approach; at the current stage of development, it is used only as a validation tool.
II Results
Device Design and Loading
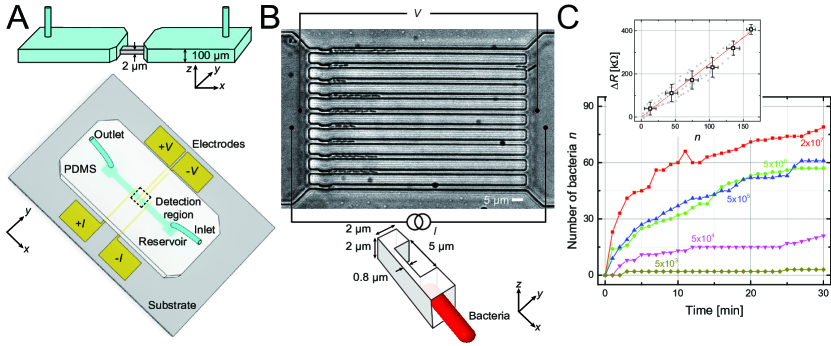
The design and basic principle of operation of the microfluidic device is shown in Fig. 1. The device is essentially a continuous polydimethylsiloxane (PDMS) channel on a glass substrate with thin metal film electrodes. At the center, the channel tapers down into ten smaller microchannels each with linear dimensions . On one end of each of these parallel microchannels, a physical constriction () is fabricated for trapping bacteria from a flowing sample (Fig. 1B). During operation, a pressure-driven flow of a bacteria solution is established through the microchannels from the inlet to the outlet (Fig. 1A and B). The bacteria in the solution cannot pass through the constriction and are trapped as shown in the optical microscope image in Fig. 1B. In the experiments, the electrical resistance of the microchannel region is monitored using a 4-wire measurement (Fig. 1B). When the microchannels are filled with just media with no bacteria, i.e., empty, their typical resistances are .
At the start of each experiment, the bacteria sample is loaded into the microfluidic device from the inlet by keeping the inlet at a pressure kPa above the outlet. Fig. 1C shows the number of trapped cells as a function of time for Klebsiella pneumoniae suspensions at different bacteria concentrations in the range from to CFU/mL. Approximately 60 bacteria are captured in min at 5 CFU/mL, which is close to the cell density in the urine of a UTI patient Duell et al. (2012). At the most dilute bacteria concentration (5), we only trapped a few bacteria over the 30 min period. The trapping efficiency at low concentration could be improved by increasing or the number of microchannels.
The inset of Fig. 1C shows the electrical signal, as bacteria number increases in the microchannels. Here, we show the resistance increase from the empty state, as a function of the number of bacteria in the microchannels from three separate experiments using different microchannels with identical nominal linear dimensions. The increase in with can be understood in simple terms. The microchannel filled with the media is essentially an electrical conductor due to the ions in the buffer. The bacteria in the microchannel “clog” the microchannel and reduce the effective cross-section, thereby increasing the resistance. The data follow a linear trend, with a resistance change of per bacterium (K. pneumoniae) added. Similar experiments (SI Appendix, Fig. S3) give and for Escherichia coli and Staphylococcus saprophyticus, respectively. An estimate using simple geometric arguments for K. pneumoniae provides , not far from the measured value (SI Appendix, Supplemental Materials and Methods). These values provide a good calibration for the experiments and allow us to the estimate that cells are needed to to perform a conclusive antibiotic susceptibility test due to the long-term electrical drifts.
Since we do not use very high pressures during loading, bacteria occasionally accumulate at other locations in the device, particularly at lithographical edges and at the entrances of microchannels. When this happens, the measured resistances to correspond to larger bacteria numbers than counted from microscope image. The electrical signal is quite robust against such non-ideal occurrences. First, the geometry ensures that the largest resistance signals come from the central detection region (SI Appendix, Supplemental Materials and Methods). Second, all bacteria inside the device, regardless of where they are, generate coherent electrical signals of cell growth or cell death. Third, any contaminants that partially block the device and do not change over time just result in time-independent background signals.
Electrical Monitoring of Bacterial Growth
We first perform an electrical measurement of bacteria growth. We record the device resistance as a function of time. We then determine the normalized time-dependent resistance change defined as , where and respectively are the device resistance right after loading () and without bacteria (empty). From Fig. 1C inset above, we expect that , where is the number of bacteria in the microchannels. Fig. 2A shows the normalized resistance for motile E. coli as a function of time obtained in Phosphate-buffered saline (PBS) at C and Luria-Bertani (LB) broth at C and C. After bacteria are loaded and during the measurement, kPa is applied to maintain a constant flow of nutrients. Shown in Fig. 2A inset are optical microscope images of the trapped E. coli taken at mins during the electrical measurement in LB broth at C (also see SI Appendix, Movie S1).
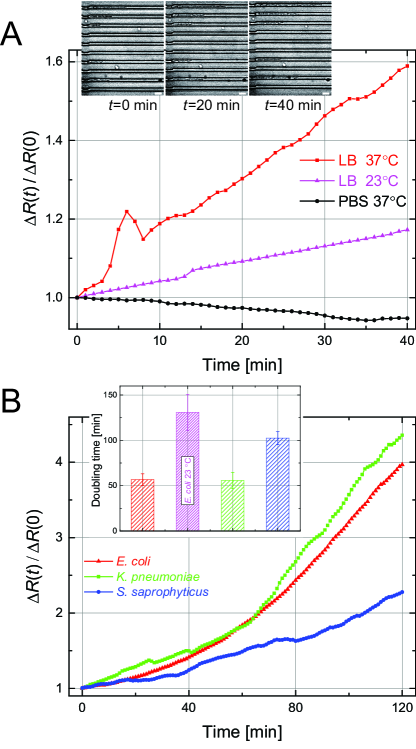
Fig. 2B shows similar growth curves for gram-positive and gram-negative bacteria. K. pneumoniae and S. saprophyticus are non-motile and are easily trapped in the microchannels by a pressure-driven flow; E. coli is motile but unlikely to reverse its direction and exit the tight microchannel once it enters. The electrical resistance changes are all close to exponentials: , with the growth rate providing the doubling time for each strain. The inset shows values obtained from linear fits to the natural logarithms of the growth curves. The we measure are longer than those reported in the literature Galli et al. (2017); Regué et al. (2004); Almeida and Jorgensen (1984), possibly due to the limited availability of nutrients in the microchannels Yang et al. (2018).
Antibiotic Susceptibility Testing
We show in Fig. 3 how our method and device can be used to determine the antibiotic susceptibility of bacteria rapidly and efficiently. We have tested bacterial response to two antibiotics with different action mechanisms: ampicillin, a -lactam bactericidal antibiotic, and nalidixic acid, a bacteriostatic antibiotic at low concentration. Prior to the microfluidic experiments, the susceptibility of the bacteria and the minimum inhibitory concentration (MIC) values were determined from resazurin-based microdilution ASTs (SI Appendix, Supplemental Materials and Methods and Table S1). Each data trace in Fig. 3 was collected on a separate device. All the results are presented in terms of the normalized resistance change, , i.e., the approximate number of bacteria in the microchannel as a function of time normalized by the initial number of bacteria. In each plot, the black curve shows the bacteria growth curve in LB broth with no antibiotics. The different curves show the results when bacteria are incubated in the presence of different concentrations of different antibiotics.
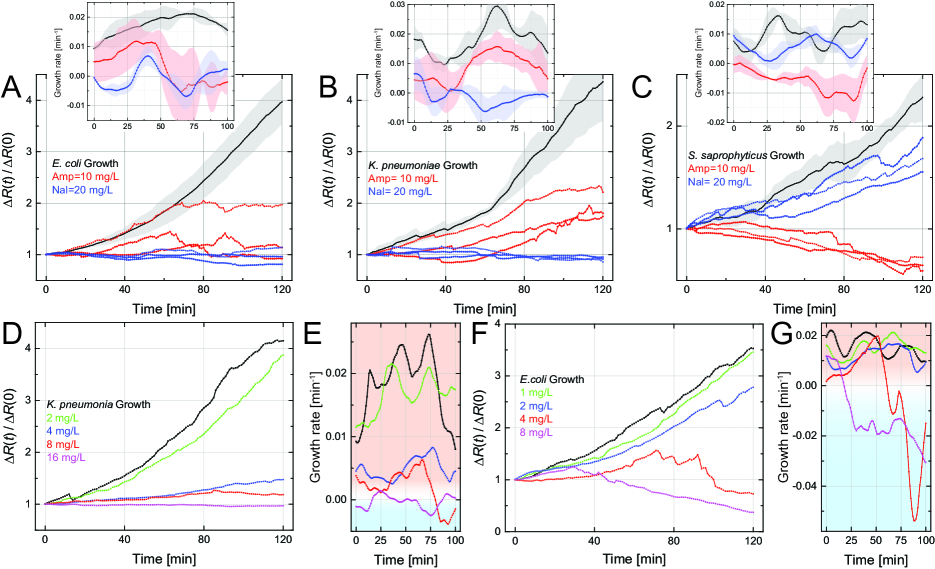
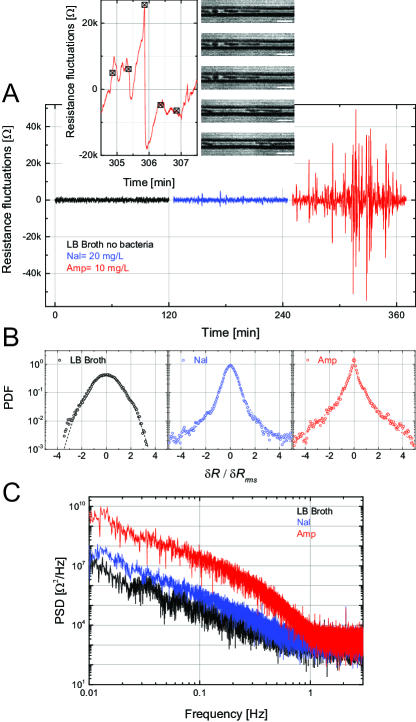
Fig. 3A shows the effect of two different antibiotics, ampicillin (red curves) and nalidixic acid (blue curves), on motile E. coli. (The black curve is the growth curve from Fig. 2B.) Our intial standardized ASTs confirm that E. coli is susceptible to both antibiotics at the indicated concentrations. In nalidixic acid, the measured resistance is approximately constant over time (Fig. 3A blue curves), suggesting that the bacteria does not grow or change in any other way. In contrast, the electrical resistance in ampicillin (Fig. 3A red curves) first increases but then takes a turn, staying constant or decreasing below the initial value. The behavior of the electrical resistance, without resorting to microscopy, is consistent with the fact that the cells elongate initially but cannot complete their division and eventually die. The inset of Fig. 3A shows the growth rates obtained from the normalized resistance curves. Here, we compute within a sliding window of 20 mins in order to reduce the numerical noise. The growth rates show that E. coli does not grow appreciably in either antibiotic at the noted concentrations, suggesting the strain is susceptible to both antibiotics. A straightforward metric for susceptibility can be obtained by averaging the growth rate in the second half of the test (i.e, last hr). For this data set, we obtain , and , all averaged over three measurements. Thus, can be taken as an objective — albeit somewhat restrictive — condition for susceptibility. (In Fig. 4 below, we look at different aspects of the same data for differentiating between the action mechanisms of these antibiotics.)
For K. pneumoniae (Fig. 3B), the normalized resistance change in ampicillin (red curves) keeps increasing with incubation time, while that in nalidixic acid (blue curves) does not change at all. The inset shows the growth rates as above. The data indicate that K. pneumoniae is resistant to ampicillin but susceptible to nalidixic acid at the indicated concentrations. We also observe that the growth rate of K. pneumoniae in ampicillin is lower than that with no drug. In the case of S. saprophyticus (Fig. 3C), the antibiotics cause different outcomes.
We next determine the MICs for nalidixic acid and ampicillin using our device and method. In an effort to show the clinical relevance, we perform the MIC experiments directly in bacteria-spiked human urine mixed with LB broth. MICs are determined within a 2-hour time window. Fig. 3D shows the normalized resistance change as a function of time for K. pneumoniae in nalidixic acid at concentrations of 0, 2, 4, 8, and 16 mg/L. Increasing the concentration of nalidixic acid slows the growth down, eventually making the time derivative negative at a concentration mg/L (Fig. 3D), suggesting that 16 mg/L can safely be taken as the MIC. The corresponding growth rates in Fig. 3E are negative at later times for the two highest antibiotic concentrations. From Fig. 3F and G, we determine the MIC of ampicillin for a non-motile strain of E. coli. The antibiotic becomes effective at a concentration mg/L but after minutes of exposure. These MIC values and our metric, , remain consistent with results obtained from standardized ASTs (SI Appendix, Table S1 and Table S2).
Electrical Signatures of Antibiotic Mechanisms
We now take a more detailed look at the data presented in Fig. 3A for motile E. coli in two antibiotics, focusing on the short-time fluctuations of the resistance. We high-pass filter the time-dependent resistance data, rejecting drifts on time scales seconds. Fig. 4A shows samples of these resistance fluctuations as a function of time for ampicillin (red trace) and nalidixic acid (blue trace) from single two-hour measurements; the black data trace is collected in LB broth without bacteria. There appear to be more frequent and higher-amplitude resistance fluctuations in ampicillin than nalidixic acid, with the root-mean square (rms) values being and during the two-hour measurement (). The inset on the left shows the fluctuating signal in ampicillin on the timescale of a single fluctuation. Simultaneous time-lapse microscope images (right inset) have allowed us to speculate about the source of this particular fluctuation in ampicillin. The images show that a bacterium in one of the 10 microchannels undergo a rapid burst at roughly the same time as the disappearance of the sharp electrical peak. We speculate that the swelling of the bacteria increases the resistance before the burst, and the rapid burst gives rise to the sudden resistance drop (SI Appendix, Movie S2). The microscope images show that bacteria to the right of the bursting bacterium are displaced even further and some residue remains in the microchannel after the burst. Bacteria in the other microchannels stay unchanged during this time interval. We have not noticed many similar cell bursting events in the 2-hour time-lapse images of bacteria in nalidixic acid, which only inhibits cell division.
To provide more quantitative insight into antibiotic mechanisms, we calculate the probability density function (PDF) and the power spectral density (PSD) of the resistance fluctuations. For this, we use all three data sets for the same experiment, such as the ones in Fig. 4A. Fig. 4B shows the normalized PDFs in units of the rms fluctuation amplitude. The black data are the PDF of the background fluctuations collected in a device filled with just LB broth. These background fluctuations are for the most part Gaussian, with . The blue data obtained from E. coli in nalidixic acid starts to deviate from a Gaussian and can be fitted by a stretched exponential function. The red data in ampicillin with the sharp peaks strongly deviates from a Gaussian. Fig. 4C shows the average power spectral densities (PSDs) of these noise-like signals. The PSD of the signal in the bacteriostatic antibiotic (blue) is close to the PSD of the noise without bacteria. The added noise power due to the bactericidal effect (red) is at low frequencies in the range 0.01 Hz to 0.5 Hz, which is the high-frequency cut-off frequency in the measurement circuit. The -like behavior of the PSD is probably due to the fact that the bursts take place on different time scales. We further compare the rms value of the fluctuations in ampicillin in the first half with that in the second half of the two-hour measurement, , indicating that ampicillin exhibits time-dependent bactericidal effect Levison and Levison (2009); Midolo et al. (1996).
Discussion
This work describes an electrical approach that determines bacterial susceptibility to antibiotics in a microfluidic device. In the simplest interpretation, the approach depends on the blockage of (quasi direct current) ionic current by intact bacteria Tsutsui et al. (2018). Upon further reflection, however, deeper questions emerge on how ionic current flows in pores and microchannels blocked by bacteria. Some of our microscope images suggest that, after cell lysis, the resistance tends to decrease even before the cell residue gets washed out by the liquid flow. We speculate that, once the cell wall and membrane lose their integrity, a bacterium may start to conduct ionic current at a higher rate through the cell body. In the case of rapid cell bursts, the residues are probably too small to significantly block the ionic current efficiently.
At the current stage of development, the entire setup consists of a basic Ohmmeter and a flow controller connected to the microfluidic device. Given that the approach does not require a high-resolution microscope, it could eventually be developed into a small and robust point-of-care platform, potentially usable in resource-limited settings. A few technical improvements are still needed: First, the sample loading process could be optimized. A higher applied pressure will allow the sample to flow faster and reduce the loading time Baltekin et al. (2017). Currently, the pressure is limited by the bonding strength between PDMS and the substrate. A silicon-based device, while harder to fabricate, may solve this problem. Second, the electrical measurement can be multiplexed to increase the throughput, reduce the test time, or provide the susceptibility of bacteria to multiple antibiotics in parallel.
The fluctuations in the electrical signal due to antibiotic action are worth serious attention. The fluctuations in the bacteriostatic antibiotic are close to those in LB broth, with the slight increase in the rms amplitude possibly being due to the movements of the E. coli Kara et al. (2018). The more interesting question is the strong deviation of the fluctuations in the bactericidal antibiotic experiment from Gaussian statistics, approaching an exponential distribution. Apparently, the short strong and discrete peaks generated by the cell bursts are responsible for the observed behavior. This is reminiscent of wall turbulence, where strong and rare turbulent wall bursts completely dominate the velocity fluctuations in a similar manner. A focused parametric experimental study and a first-principles theory is needed for a more complete biophysical picture.
In the short term, our method is poised to have clinical relevance to UTI diagnosis and optimal treatment. While this work lays the foundation for an antibiotic susceptibility test, further translational studies are needed for a clinical test. Patients with UTIs and possible co-morbidities (e.g., diabetes, chronic renal disease) likely have complex urine matrices that may not be directly usable in our device. However, uncomplicated UTI in otherwise healthy adult women is one of the most common UTI syndromes in outpatient medicine, and the need for rapid susceptibility testing to improve empirical therapy is increasing with more community-based gram negative resistance Talan et al. (2016). Polymicrobial UTIs, in which multi-pathogens with heterogeneous antibiotics response co-exist, may require additional considerations.
III Materials & methods
III.1 Microfluidic Device
The microfluidic device consists of a PDMS microstructure (embedded with a two-layer microfluidic channel) that is permanently bonded with a glass substrate, which has metallic electrodes on it. We use standard soft lithography to fabricate the device. Details of the device fabrication process are described in SI Appendix, Supplemental Materials and Methods.
III.2 Bacterial Strains, Growth Media and Antimicrobial Preparations
In this study, motile E. coli (ATCC 25922), K. pneumoniae (ATCC 13883), S. saprophyticus (ATCC 15305) were purchased from American Type Culture Collection (ATCC, Manassas, VA), and non-motile E. coli (JW 1908-1) was obtained from E. coli Genetic Stock Center (New Haven, CT). We used either Luria-Bertani (LB) broth (Sigma-Aldrich, St. Louis, MO) or human urine (Lee Biosolutions, Maryland Heights, MO) as growth media depending on the experiment. The stock solutions of ampicillin and nalidixic acid were prepared using the methods provided by the supplier (Alfa Aesar, Ward Hill, MA). Details are provided in SI Appendix, Supplemental Materials and Methods.
III.3 Electrical Measurements and Data Acquisition
A lock-in amplifier (SR 830 DSP, Stanford Research Systems, Sunnyvale, CA) is used to measure the resistances of the microchannels. The reference frequency and time constant are 10 Hz and 300 ms (bandwidth of Hz), respectively. The output signals from the lock-in amplifier were recorded using a data acquisition card (NI 6221, National Instruments, Austin, TX) through a LabVIEW (National Instruments, Austin, TX) Virtual Instrument (VI) interface. The sampling rate for data collection is 6 Hz. The experimental data are analyzed using Origin (MicroCal Software, Northampton, MA) and MATLAB (Mathworks, Natick, MA). Details of electrical measurements are given in SI Appendix, Supplemental Materials and Methods.
III.4 Image Collection
Images of the bacterial cells in the microchannels were obtained in an Axio observer inverted microscope (Carl Zeiss, Jena, Germany) using a 63 objective, an AxioCam 503 mono camera (Carl Zeiss, Oberkochen, Germany), and ZEN image acquisition software (Carl Zeiss, Jena, Germany).
III.5 Data Availability
All data and procedures are included in the manuscript, SI Appendix, and Movies S1 and S2.
IV Acknowledgements
This work was supported by the NIH (1R21AI133264-01A1 and 1R03AI126168-01). The authors thank Joan O’Connor for assistance with sample preparation and resazurin-based broth microdilution ASTs and Deborah J. Stearns-Kurosawa and Victor Yakhot for discussions.
References
- Brown and Wright (2016) E. D. Brown and G. D. Wright, Nature 529, 336 (2016).
- Blair et al. (2015) J. M. Blair, M. A. Webber, A. J. Baylay, D. O. Ogbolu, and L. J. Piddock, Nature reviews microbiology 13, 42 (2015).
- Ataee et al. (2012) R. A. Ataee, A. Mehrabi-Tavana, S. M. J. Hosseini, K. Moridi, and M. G. Zadegan, Jundishapur Journal of Microbiology 5, 341 (2012).
- Jenkins and Schuetz (2012) S. G. Jenkins and A. N. Schuetz, in Mayo Clinic Proceedings, Vol. 87 (Elsevier, 2012) pp. 290–308.
- van Belkum et al. (2018) A. van Belkum, T. T. Bachmann, G. Lüdke, J. G. Lisby, G. Kahlmeter, A. Mohess, K. Becker, J. P. Hays, N. Woodford, K. Mitsakakis, et al., Nature Reviews Microbiology , 1 (2018).
- Balouiri et al. (2016) M. Balouiri, M. Sadiki, and S. K. Ibnsouda, Journal of pharmaceutical analysis 6, 71 (2016).
- Khan et al. (2019a) Z. A. Khan, M. F. Siddiqui, and S. Park, Diagnostics 9, 49 (2019a).
- Gonzalez-Gonzalez et al. (2015) C. Gonzalez-Gonzalez, P. López-Vázquez, J. M. Vázquez-Lago, M. Piñeiro-Lamas, M. T. Herdeiro, P. C. Arzamendi, A. Figueiras, G. Group, et al., PLoS One 10, e0141820 (2015).
- Copp et al. (2011) H. L. Copp, D. J. Shapiro, and A. L. Hersh, Pediatrics 127, 1027 (2011).
- Li and Webster (2018) B. Li and T. J. Webster, Journal of Orthopaedic Research® 36, 22 (2018).
- Rajivgandhi et al. (2018) G. Rajivgandhi, M. Maruthupandy, G. Ramachandran, M. Priyanga, and N. Manoharan, Frontiers in Laboratory Medicine 2, 5 (2018).
- Hughes and Andersson (2017) D. Hughes and D. I. Andersson, FEMS microbiology reviews 41, 374 (2017).
- Dai et al. (2016) J. Dai, M. Hamon, and S. Jambovane, Bioengineering 3, 25 (2016).
- Kang et al. (2019) W. Kang, S. Sarkar, Z. S. Lin, S. McKenney, and T. Konry, Analytical chemistry 91, 6242 (2019).
- Boedicker et al. (2008) J. Q. Boedicker, L. Li, T. R. Kline, and R. F. Ismagilov, Lab on a Chip 8, 1265 (2008).
- Wang et al. (2018) J.-C. Wang, S.-W. Chi, T.-H. Yang, and H.-S. Chuang, ACS sensors 3, 2182 (2018).
- Baltekin et al. (2017) Ö. Baltekin, A. Boucharin, E. Tano, D. I. Andersson, and J. Elf, Proceedings of the National Academy of Sciences 114, 9170 (2017).
- Li et al. (2019) H. Li, P. Torab, K. E. Mach, C. Surrette, M. R. England, D. W. Craft, N. J. Thomas, J. C. Liao, C. Puleo, and P. K. Wong, Proceedings of the National Academy of Sciences 116, 10270 (2019).
- Mannoor et al. (2010) M. S. Mannoor, S. Zhang, A. J. Link, and M. C. McAlpine, Proceedings of the National Academy of Sciences 107, 19207 (2010).
- Chen et al. (2016) Q. Chen, D. Wang, G. Cai, Y. Xiong, Y. Li, M. Wang, H. Huo, and J. Lin, Biosensors and Bioelectronics 86, 770 (2016).
- Besant et al. (2015) J. D. Besant, E. H. Sargent, and S. O. Kelley, Lab on a Chip 15, 2799 (2015).
- Stupar et al. (2017) P. Stupar, O. Opota, G. Longo, G. Prod’Hom, G. Dietler, G. Greub, and S. Kasas, Clinical Microbiology and Infection 23, 400 (2017).
- Behera et al. (2019) B. Behera, G. A. Vishnu, S. Chatterjee, N. Sreekumar, A. Nagabhushan, N. Rajendran, B. Prathik, H. J. Pandya, et al., Biosensors and Bioelectronics , 111552 (2019).
- Yang and Bashir (2008) L. Yang and R. Bashir, Biotechnology advances 26, 135 (2008).
- Choi et al. (2014) J. Choi, J. Yoo, M. Lee, E.-G. Kim, J. S. Lee, S. Lee, S. Joo, S. H. Song, E.-C. Kim, J. C. Lee, et al., Science translational medicine 6, 267ra174 (2014).
- Pitruzzello et al. (2019) G. Pitruzzello, S. Thorpe, S. Johnson, A. Evans, H. Gadêlha, and T. F. Krauss, Lab on a Chip 19, 1417 (2019).
- Khan et al. (2019b) Z. A. Khan, M. F. Siddiqui, and S. Park, Biotechnology letters 41, 221 (2019b).
- Duell et al. (2012) B. L. Duell, A. J. Carey, C. K. Tan, X. Cui, R. I. Webb, M. Totsika, M. A. Schembri, P. Derrington, H. Irving-Rodgers, A. J. Brooks, et al., The Journal of Immunology 188, 781 (2012).
- Galli et al. (2017) E. Galli, C. Midonet, E. Paly, and F.-X. Barre, PLoS genetics 13, e1006702 (2017).
- Regué et al. (2004) M. Regué, B. Hita, N. Piqué, L. Izquierdo, S. Merino, S. Fresno, V. J. Benedí, and J. M. Tomás, Infection and immunity 72, 54 (2004).
- Almeida and Jorgensen (1984) R. Almeida and J. Jorgensen, European journal of clinical microbiology 3, 542 (1984).
- Yang et al. (2018) D. Yang, A. D. Jennings, E. Borrego, S. T. Retterer, and J. Männik, Frontiers in microbiology 9, 871 (2018).
- Levison and Levison (2009) M. E. Levison and J. H. Levison, Infectious Disease Clinics 23, 791 (2009).
- Midolo et al. (1996) P. Midolo, J. Turnidge, and W. Munckhof, Antimicrobial agents and chemotherapy 40, 1327 (1996).
- Tsutsui et al. (2018) M. Tsutsui, M. Tanaka, T. Marui, K. Yokota, T. Yoshida, A. Arima, W. Tonomura, M. Taniguchi, T. Washio, M. Okochi, et al., Analytical chemistry 90, 1511 (2018).
- Kara et al. (2018) V. Kara, C. Duan, K. Gupta, S. Kurosawa, D. J. Stearns-Kurosawa, and K. L. Ekinci, Lab on a Chip 18, 743 (2018).
- Talan et al. (2016) D. A. Talan, S. S. Takhar, A. Krishnadasan, F. M. Abrahamian, W. R. Mower, G. J. Moran, E. I. N. S. Group, et al., Emerging infectious diseases 22, 1594 (2016).