NuSTAR low energy effective area correction due to thermal blanket tear
Abstract
A rip in the MLI at the exit aperture of OMA, the NuSTAR optic aligned with detector focal plane module FPMA, has resulted in an increased photon flux through OMA that has manifested itself as a low energy excess. Overall, the MLI coverage has decreased by 10%, but there is an additional time varying component, which occasionally causes the opening to increase by up to 20%. We address the problem with a calibration update, and in this paper we describe the attributes of the problem, the implications it has on data analysis, and the solution.
Subject headings:
space vehicles: instruments1. Introduction
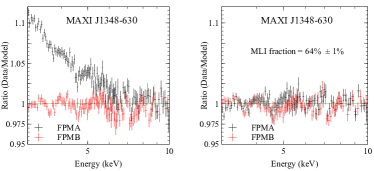
Throughout 2019, the NuSTAR science operations center (SOC) were with increasing regularity receiving reports of differences between modules FPMA and FPMB of several percent. These differences take the form as shown in Figure 1 (left panel), where an excess of photons is seen in FPMA at low energies with respect to FPMB. Investigations into the reported cases has confirm the excess, but when compared to other sources with a similar instrument configuration, or even with the source itself at a different epoch, the excess is not always present.
Of immediate concern, was a time dependent change of the detector and instrument response. A change in the effective area can be achieved by an unknown tilt of the optic, which would move the optical axis to a different location than presumed by the original calibration. We investigated this possibility and rejected it on the grounds that only the low energy spectrum shows deviations, while the high energy spectrum between FPMA and FPMB hasn’t changed, as would have been expected due to the mirror response being more sensitive with off-axis angle at increasing energies. We also considered the possibility that one of the detector responses had changed. Fortuitously, however, we observed the excess during a Crab calibration observation in which we also obtained a stray light observation (see Madsen et al. (2017) and Madsen et al. (2017) for details on the stray light), and were able to confirm that in the stray light observation, which excludes the optics, there were no differences in the FPMA and FPMB spectra.
This narrowed down the source of the excess to be associated with the static absorption elements encountered by the photon on its way from the optic to the detector. The apparent variations as a function of time could be a geometric effect, as in the way the source illuminates the detector array and entrance apertures. jmhbgWe investigated the known variations in the detector absorption dead layer (see details on dead layer in Madsen et al. (2015)), and while significant, it could be ruled out since sources illuminating the same patch on the detector were observed to have a different excess.
This left two possibilities: 1) the Multi Layer Insulation (MLI), which encloses the optics, or 2) the Be window located at the entrance of the focal module housing. A hole in the Be window would have caused noise in the detectors, and since this has not been seen, the MLI remains the only plausible source.
2. Behavior of the MLI rip
The conjecture that the MLI is responsible for the increased flux in FPMA is supported by the fact that Optics Module A (OMA matched to FPMA) has for years been suffering from a rip in the MLI. In August 2017, we began observing increased temperature swings in OMA, which indicated that part of the backside of the optic (facing the detector) was being exposed to space. We interpreted this as a rip in the MLI cover. In January 2019, we began to see the effect of the rip also in another temperature sensor on the backside of the optics which suggested the rip had enlarged. Combining this evidence with the low energy excess, we concluded that the most likely explanation for the excess is that the rip has become large enough to allow more photons through to the focal plane.
To test this hypothesis, we constructed an XSPEC mtable to fit the fraction, , of the MLI covering the optic. At the affected energies, it is fair to assume (confirmed by raytracing) that the number of photons exiting the optics is proportional to the area and not strongly affected by vignetting. A means the MLI fully covers the opening, and that only 90% of the opening is covered by the MLI. Figure 1 (right panel) shows MAXI J1348-630 (ObsID 80402315010) without and with the corrected MLI, yielding a 65% covered fraction of the aperture on the backside of the optic.
The next step was to investigate why only some observations showed the excess. To research the dependency on time, we constructed a simple method to quantify the excess. We multiplied the effective area () with the detector efficiency () and divided the source counts with this simplified response to remove the instrument effect, then divided the two modules with one another and scaled by the exposure time, which may differ between modules, to remove the effect of the source spectrum:
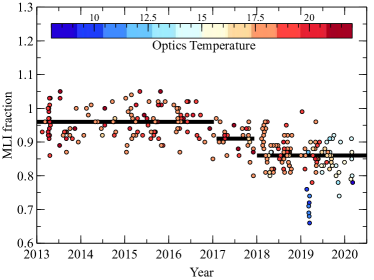
At energies below 10 keV the detector response is largely diagonal, and the ratio mostly removes the impact of source spectrum, which for the purpose of measuring the MLI covering fraction is accurate enough. We can therefore fit the ratio directly with the MLI fraction without having to deal with the source spectrum, and performed this operation on the entire NuSTAR data library for all sources above 3 count second-1 and within 2.5 arcminutes of the optical axis, with the additional restriction that all counts in the extraction region had to be located on Detector 0. We then correlated this data with the average temperature of OMA for each observation, and Figure 4 shows as a function of time and temperature the evolution of the rip. The plot illustrates several points:
-
1.
the accuracy of the MLI fraction is on the order of , due to other cross-calibration effects between FPMA and FPMB, such as the optical axis location,
-
2.
the FPMA/FPMB difference has since launch been at about 0.96, indicating that we did not have the pre-launch thickness of the FPMA (or FPMB) correct,
-
3.
although the temperature sensors only began to detect the rip in mid 2017, it was already likely present in early 2017,
-
4.
the propagation of the rip appears to have stopped in 2018,
-
5.
however, since 2019 we occasionally see very large differences in FPMA/FPMB correlated with a very cold temperature of the optic.
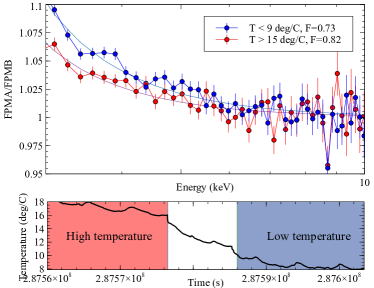
The data show that under certain circumstances the rip is apparently able to increase in size, and that when this happens the sensor measures a low temperature, presumably because more of the optic is exposed to space. We verified this with a data set of MAXI J1348-630 taken during a period when the temperature changed in the middle of the observation, and shown in Figure 3 is the temperature in the lower panel and associated FPMA/FPMB ratios for the two epochs in the upper. This confirms that the fraction of MLI in the photon path is correlated with temperature, and indicates that the rip in the MLI is able to enlarge, resulting in a decreased temperature and increased photon flux.
Mechanically, it is difficult to explain how the rip in the MLI can expand and contract, however, the change in the temperature is confirmed through multiple OMA temperature sensors, ruling out the possibility that the low temperature readings are due to a single faulty thermistor.
3. The Solution
We can correct the issue by decreasing the fraction of MLI covering the backside of the optics in the instrument response files. We can track the decrease of the MLI as a function of time by assuming the rip occurred in 2017 and that it stabilized in 2018. Taking the mean value of the data set described above for observations before 2017, we find an average MLI coverage of 0.96. Because this happened before the rip, we interpret this to mean that we overestimated the pre-launch thickness of the MLI by 4% on OMA, not to be confused with the covering fraction after the rip. For the observations after 2018 we find an average MLI fraction of 0.86, showing that the tear has reduced the MLI coverage by 10%. To correct for the difference, we have adjusted the on-axis ARF of FPMA by decreasing the thickness of the MLI to F=0.96 before 2017, and changing the covering fraction by F=0.91 in 2017 and F=0.86 after 2018. See Figure 2 and Table 1 for the valid ranges.
| Date range | MLI fraction |
|---|---|
| date 2017 | 0.96 |
| 2017 date 2018 | 0.91 |
| 2018 date 2019 | 0.86 |
We applied these new ARFs to the NuSTAR data and recalculated the MLI fractions as shown in Figure 4.
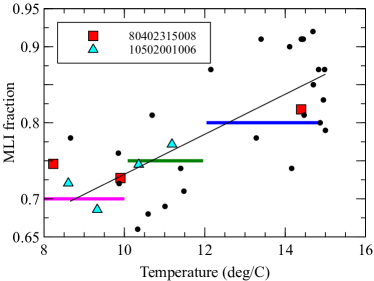
The additional time varying component, caused by the expansion of the rip, can be correlated with temperature as shown in Figure 5. The plot shows in black circles the average temperature of all observations (above 3 counts s-1, 2.5′ on-axis, and on Detector 0) together with a line fitted through the points. Additionally, we show in triangles MAXI J1348-630 (obsID 80402315008) divided into temperature bins and fitted with the MLI fraction, and in squares the Crab (obsID 10502001006) also divided into temperature bins and fitted with the MLI fraction. The data shows there is a spread when using the average temperature during an observations, but that when the measurement of the MLI fraction is used with more precise temperature data then the points fall close to the line fitted through the average temperature data. Based on this we picked three temperature bands and assigned the constant MLI fractions as shown in Table 2 to each band.
(for data taken after 2019-01-01)
| Temperature range | MLI fraction |
|---|---|
| 0.86 | |
| 0.8 | |
| 0.75 | |
| 0.7 |
These corrections only apply if the temperature is below 15 deg/C. Otherwise the global corrections discussed above apply.
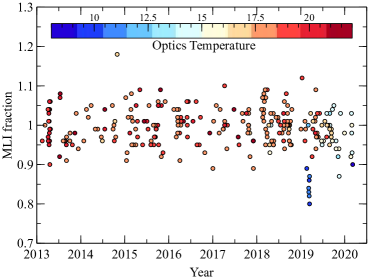
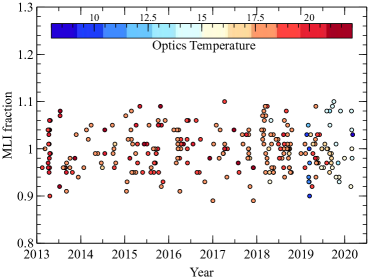
When applying the corrections from Table 1 and 2 to the NuSTAR library we see in Figure 6 that the cold outliers are now brought into family.
The corrections are not perfect and there may be individual cases for which one may still measure an FPMA/FPMB difference. For those cases we supply the XSPEC mtable, however, care must be taken when using it. The exponential shape of the MLI correction is unfortunately degenerate with many astrophysical models, and we strongly advise using the following steps to minimize cross-talk with other continuum models:
-
1.
First ignore FPMA between 3 – 7 keV, when doing your original fits. Make sure the model includes a constant between FPMA and FPMB. Find the value of the constant and freeze it.
-
2.
Notice FPMA 3 – 7 keV and add the mtable to the model. Set the fraction value of the MLI to 1.0 for FPMB and freeze it. Allow only the MLI fraction of FPMA to fit.
-
3.
Please note that the range of MLI fraction should now lie between 0.9 and 1.0, and if the range is outside that, something else may be wrong.
If these steps are not followed, and the mtable parameters and the constants between A and B are allowed to fit freely, incorrect estimates of the continuum and line shapes may occur.
4. mtable and numkarf/CALDB releases
The XSPEC mtable is available at the NuSTAR SOC webpages 111www.srl.caltech.edu/NuSTAR_Public/NuSTAROperationSite/mli.php. It should only be used with consideration to the caveats discussed above. It should not be used to force a model into agreement, but only if significant differences are observed between FPMA and FPMB.
An updated version of the numkarf module is included in NuSTARDAS v2.0.0 included in HEAsoft release 6.28. The module was modified to take into account the time and temperature dependency of the effective area of the module FPMA. This step has required the release of an associated new CALDB version (20200811). For data taken before 2019-01-01, numkarf applies a time dependent correction to the effective area using specific on-axis ARF files as detailed in Table 1. For data taken after 2019-01-01, numkarf applies a temperature dependent correction of the effective area (see Table 2).
numkarf first reads the temperature of the OMA from the ’OPT05TEMP’ column of the input OBEB Housekeeping FITS File, calculates its average value during the observation and then retrieves the appropriate ARF file from CALDB. The new 20200811 CALDB release contains a set of new on-axis ARF files which depend on the temperature of the OMA.
5. Conclusion
We have presented in this paper an important change and analysis update to NuSTAR that must be considered for all observations. The issue concerns an excess in low the energy photons in FPMA with respect to FPMB, and stems from a rip in the MLI cover of FPMA. We have released a new CALDB (version 20200811) and a new version of the software (NuSTARDAS v.2.0.0) to adjust the FPMA response to account for the reduced amount of MLI absorption. These updates include the time and temperature dependent corrections for the ARF files and will correct most data. However, where may be a subset of observations, particularly bright ones, which may not entirely be corrected by this, and we have in addition provided an mtable to be used for those observations. Care must be taken in applying this mtable as it may potentially skew the results if not used properly.
References
- Madsen et al. (2017) Madsen, K. K., Christensen, F. E., Craig, W. W., Forster, K. W., Grefenstette, B. W., Harrison, F. A., Miyasaka, H., & Rana, V., 2017, Journal of Astronomical Telescopes, Instruments, and Systems, 3, 3
- Madsen et al. (2017) Madsen, K. K., Forster, K., Grefenstette, B. W., Harrison, F. A., & Stern, D., 2017, ApJ, 841, 56
- Madsen et al. (2015) Madsen, K. K., et al., 2015, ApJS, 220, 8