Visual Orbits of Spectroscopic Binaries with the CHARA Array. III. HD 8374 and HD 24546
Abstract
We present the visual orbits of two long period spectroscopic binary stars, HD 8374 and HD 24546, using interferometric observations acquired with the CHARA Array and the Palomar Testbed Interferometer. We also obtained new radial velocities from echelle spectra using the APO 3.5 m and Fairborn 2.0 m telescopes. By combining the visual and spectroscopic observations, we solve for the full, three-dimensional orbits and determine the stellar masses and distances to within 3% uncertainty. We then estimate the effective temperature and radius of each component star through Doppler tomography and spectral energy distribution analyses, in order to compare the observed stellar parameters to the predictions of stellar evolution models. For HD 8374, we find masses of and , radii of and , temperatures of K and K, and an estimated age of 1.0 Gyr. For HD 24546, we find masses of and , radii of and , temperatures of K and K, and an estimated age of 1.4 Gyr. HD 24546 is therefore too old to be a member of the Hyades cluster, despite its physical proximity to the group.
1 Introduction
We are continuing our series of papers measuring the visual orbits of spectroscopic binary stars with interferometry (Lester et al., 2019a, b), in order to determine the fundamental stellar parameters of the components and test the predictions of stellar evolution models. In this paper, we present the results for two long period binaries, HD 8374 and HD 24546. HD 837411147 And, HR 395; mag; , (J2000) contains a pair of late A-type stars with an orbital period of 35 days. The first spectroscopic orbit was completed by Fletcher (1967), then recently updated using high resolution data by Fekel et al. (2011). HD 8374 is also classified as a metallic line (Am) star due to its weak Ca II H & K lines (Abt & Morrell, 1995).
HD 2454622243 Per A, BD +50 860, HR 1210; mag; , (J2000) contains a pair of F5 stars with an orbital period of 30 days. Spectroscopic orbits were determined by Wallerstein (1973) and Abt & Levy (1976). HD 24546 also has a possible third companion (43 Per B33343 Per B, BD +50 861; mag; (J2000)) at a separation of 75″ (Abt & Levy, 1976; Tokovinin, 1997) with a proper motion and parallax similar to HD 24546 (Lépine & Bongiorno, 2007; Montes et al., 2018). Even if 43 Per B is physically associated with HD 24546, it is outside the field-of-view of our telescopes and would not cause perturbations in the orbit of HD 24546 due to the estimated orbital period of 95,000 years (Tokovinin, 1997). Some investigators have reported that HD 24546 is a member of the Hyades cluster (Eggen, 1971; Montes et al., 2018), while others found that it is not (Perryman et al., 1998), so measuring accurate masses and age for this system will verify or refute cluster membership.
In Section 2, we describe our spectroscopic observations and radial velocities. In Section 3, we describe our interferometric observations, binary positions, and combined orbital solution. In Section 4, we determine the fundamental stellar parameters of each component and compare the results to stellar evolution models. We further discuss our results in Section 5.
2 Spectroscopy
2.1 APO Observations
We observed HD 8374 and HD 24546 with the ARC echelle spectrograph (ARCES; Wang et al., 2003) on the APO 3.5 m telescope from 2015–2020. Our observations are listed in Table 1 for HD 8374 and Table 2 for HD 24546. ARCES covers 3500-10500 Å over 107 orders at an average resolving power of . We reduced our data using standard echelle procedures in IRAF, then removed the blaze function using the procedure in Appendix A of Kolbas et al. (2015). Radial velocities () for the APO data were measured with the multi-order TODCOR method (Zucker & Mazeh, 1994; Zucker et al., 2003) as described in Lester et al. (2019a). Briefly, TODCOR calculates the cross correlation function (CCF) for a grid of primary and secondary radial velocities. BLUERED model spectra (Bertone et al., 2008) were created as template spectra based on atmospheric parameters from Fekel et al. (2011) for HD 8374 and from Wallerstein (1973) for HD 24546. The CCFs for each echelle order were then added together to find the maximum CCF and corresponding best-fit radial velocities. TODCOR also estimates the monochromatic flux ratio near H to be for HD 8374 and for HD 24546.
2.2 Fairborn Observations
We also acquired spectroscopic observations of HD 8374 and HD 24546 at Fairborn Observatory in southeast Arizona with the Tennessee State University 2.0 m Automatic Spectroscopic Telescope (AST) and a fiber-fed echelle spectrograph (Eaton & Williamson, 2004). The new AST observations of HD 8374 from 2011– 2019 are listed in Table 1 and are a continuation of those published by Fekel et al. (2011). The observations of HD 24546 acquired between 2003– 2019 are listed in Table 2. All observations through the spring of 2011 were acquired with a 2048 4096 SITe ST-002A CCD. Those spectra have 21 orders, cover a wavelength region of 4920–7100 Å, and have a resolving power of 35,000 at 6000 Å. During the summer of 2011 we replaced the SITe CCD with a Fairchild 486 CCD that has a 4096 4096 pixel array enabling coverage of a wavelength range of 3800–8600 Å over 48 orders (Fekel et al., 2013). We used a 200 m fiber that produced a resolving power of 25,000 at 6000 Å. Eaton & Williamson (2007) explained the reduction and wavelength calibration of the raw AST spectra.
Fekel et al. (2009) provided a general description of the typical velocity reduction. For the two stars in this work, we used a solar-type star line list consisting of 168 lines in the wavelength region 4920–7100 Å. Each line was fitted with a rotational broadening function (Sandberg Lacy & Fekel, 2011), and when the lines of the two components were blended we obtained a simultaneous fit. The stellar velocity was determined as the average of the line fits. A value of 0.3 km s-1 was added to the SITe CCD velocities and 0.6 km s-1 to the Fairchild CCD velocities to make the resulting velocities from the two CCDs consistent with the velocity zero point of Scarfe (2010).
2.3 Preliminary Spectroscopic Orbit
To account for differences in the zero-point offsets of the APO and Fairborn spectrographs, we first fit separate orbital solutions to each data set using the RVFIT program444http://www.cefca.es/people/riglesias/rvfit.html (Iglesias-Marzoa et al., 2015) to solve for the spectroscopic orbital parameters: the orbital period (), epoch of periastron (), eccentricity (), longitude of periastron of the primary star (), systemic velocity (), and the velocity semi-amplitudes (, ). We found offsets of km s-1 and km s-1 for the ARCES data of HD 8374 and HD 24546, respectively, in order to match the systemic velocities to those of the Fairborn data. We also fit an orbit to the previously published velocities of HD 8374 from Fekel et al. (2011) using preliminary uncertainties equal to . We then used the values from the individual APO, Fairborn, and Fekel et al. (2011) solutions to rescale the uncertainties such that the reduced of each data set equals one. The adjusted APO velocities and the rescaled uncertainties for the APO and new Fairborn data are listed in Tables 1 and 2, along with the residuals from the combined (VB+SB2) orbital solutions found in Section 3.5.
| UT Date | HJD-2,400,000 | Orbital | Source | ||||||
|---|---|---|---|---|---|---|---|---|---|
| Phase | (km s-1) | (km s-1) | (km s-1) | (km s-1) | (km s-1) | (km s-1) | |||
| 2011 Mar 03 | 55623.6328 | 0.61 | 0.32 | 0.29 | Fairborn | ||||
| 2011 May 20 | 55701.9727 | 0.83 | 0.32 | 0.29 | Fairborn | ||||
| 2011 Oct 11 | 55845.6211 | 0.89 | 0.32 | 0.29 | Fairborn | ||||
| 2011 Dec 27 | 55922.5820 | 0.06 | 0.32 | 0.29 | Fairborn | ||||
| 2012 Jun 21 | 56099.9141 | 0.08 | 0.32 | 0.29 | Fairborn | ||||
| 2012 Sep 01 | 56171.9648 | 0.12 | 0.32 | 0.29 | Fairborn | ||||
| 2012 Oct 02 | 56202.6953 | 0.98 | 0.32 | 0.29 | Fairborn | ||||
| 2012 Oct 30 | 56230.8945 | 0.78 | 0.32 | 0.29 | Fairborn | ||||
| 2013 Feb 10 | 56333.6953 | 0.69 | 0.32 | 0.29 | Fairborn | ||||
| 2013 May 22 | 56434.9688 | 0.55 | 0.32 | 0.29 | Fairborn | ||||
| 2013 Sep 06 | 56541.7578 | 0.57 | 0.32 | 0.29 | Fairborn | ||||
| 2013 Nov 26 | 56622.8203 | 0.86 | 0.32 | 0.29 | Fairborn | ||||
| 2013 Dec 26 | 56652.5859 | 0.70 | 0.32 | 0.29 | Fairborn | ||||
| 2014 May 28 | 56805.9492 | 0.04 | 0.32 | 0.29 | Fairborn | ||||
| 2014 Jun 26 | 56834.9609 | 0.86 | 0.32 | 0.29 | Fairborn | ||||
| 2014 Oct 01 | 56931.7422 | 0.60 | 0.32 | 0.29 | Fairborn | ||||
| 2014 Nov 16 | 56977.6133 | 0.89 | 0.32 | 0.29 | Fairborn | ||||
| 2015 Jun 07 | 57180.9258 | 0.64 | 0.32 | 0.29 | Fairborn | ||||
| 2015 Nov 10 | 57336.6836 | 0.05 | 0.23 | 0.27 | Fairborn | ||||
| 2015 Dec 01 | 57357.6445 | 0.64 | 1.10 | 1.18 | APO | ||||
| 2016 Feb 18 | 57436.6680 | 0.87 | 0.23 | 0.27 | Fairborn | ||||
| 2016 Aug 07 | 57607.9570 | 0.72 | 0.23 | 0.27 | Fairborn | ||||
| 2016 Sep 14 | 57645.7852 | 0.79 | 1.08 | 1.19 | APO | ||||
| 2016 Oct 14 | 57675.8672 | 0.64 | 0.23 | 0.27 | Fairborn | ||||
| 2016 Oct 15 | 57676.6016 | 0.66 | 1.12 | 1.25 | APO | ||||
| 2016 Oct 21 | 57682.7852 | 0.83 | 1.09 | 1.20 | APO | ||||
| 2016 Nov 18 | 57710.8008 | 0.62 | 0.23 | 0.27 | Fairborn | ||||
| 2016 Nov 19 | 57711.6445 | 0.65 | 1.08 | 1.22 | APO | ||||
| 2017 Jan 06 | 57759.7773 | 0.01 | 0.23 | 0.27 | Fairborn | ||||
| 2017 May 17 | 57890.9727 | 0.72 | 0.23 | 0.27 | Fairborn | ||||
| 2017 Jun 30 | 57934.9219 | 0.96 | 0.23 | 0.27 | Fairborn | ||||
| 2017 Aug 30 | 57995.9961 | 0.69 | 0.23 | 0.27 | Fairborn | ||||
| 2017 Sep 02 | 57998.7617 | 0.77 | 1.09 | 1.20 | APO | ||||
| 2017 Oct 04 | 58030.7109 | 0.67 | 0.23 | 0.27 | Fairborn | ||||
| 2017 Nov 09 | 58066.6758 | 0.69 | 0.23 | 0.27 | Fairborn | ||||
| 2017 Dec 27 | 58114.6133 | 0.04 | 0.53 | 0.58 | APO | ||||
| 2018 Sep 27 | 58388.7539 | 0.79 | 1.16 | 1.30 | APO | ||||
| 2019 Jan 14 | 58497.5898 | 0.87 | 1.05 | 1.19 | APO | ||||
| 2019 Jan 21 | 58504.7109 | 0.07 | 0.23 | 0.27 | Fairborn | ||||
| 2019 Jan 22 | 58505.5664 | 0.10 | 0.52 | 0.58 | APO | ||||
| 2019 Aug 18 | 58713.9609 | 0.99 | 0.54 | 0.60 | APO | ||||
| 2019 Sep 13 | 58739.9023 | 0.72 | 1.14 | 1.27 | APO | ||||
| 2019 Oct 21 | 58777.8125 | 0.79 | 1.06 | 1.18 | APO |
| UT Date | HJD-2,400,000 | Orbital | Source | ||||||
|---|---|---|---|---|---|---|---|---|---|
| Phase | (km s-1) | (km s-1) | (km s-1) | (km s-1) | (km s-1) | (km s-1) | |||
| 2003 Nov 26 | 52970.0430 | 0.41 | 0.26 | 5.49 | 0.25 | Fairborn | |||
| 2004 Oct 12 | 53291.0273 | 0.96 | 0.26 | 96.74 | 0.25 | Fairborn | |||
| 2004 Nov 13 | 53322.9648 | 0.01 | 0.26 | 88.71 | 0.25 | Fairborn | |||
| 2004 Dec 13 | 53352.9688 | 0.99 | 0.26 | 105.29 | 0.25 | Fairborn | |||
| 2004 Dec 14 | 53353.9219 | 0.02 | 0.26 | 63.33 | 0.25 | Fairborn | |||
| 2004 Dec 20 | 53359.9219 | 0.22 | 0.26 | 2.88 | 0.25 | Fairborn | |||
| 2005 Apr 14 | 53474.6875 | 0.99 | 0.26 | 106.05 | 0.25 | Fairborn | |||
| 2005 Nov 11 | 53686.0156 | 0.93 | 0.26 | 79.33 | 0.25 | Fairborn | |||
| 2006 Feb 13 | 53779.8125 | 0.02 | 0.26 | 75.90 | 0.25 | Fairborn | |||
| 2006 Mar 26 | 53820.6992 | 0.36 | 0.26 | 4.29 | 0.25 | Fairborn | |||
| 2006 Apr 21 | 53846.6680 | 0.21 | 0.26 | 3.22 | 0.25 | Fairborn | |||
| 2016 Jan 26 | 57413.6328 | 0.40 | 0.98 | 5.28 | 0.86 | APO | |||
| 2016 Oct 21 | 57682.7812 | 0.24 | 1.00 | 2.35 | 0.86 | APO | |||
| 2016 Nov 19 | 57711.6602 | 0.19 | 0.96 | 3.35 | 0.83 | APO | |||
| 2016 Dec 15 | 57737.6445 | 0.04 | 1.01 | 43.09 | 0.93 | APO | |||
| 2017 Jan 11 | 57764.8633 | 0.94 | 0.36 | 79.67 | 0.31 | APO | |||
| 2017 Dec 27 | 58114.6445 | 0.43 | 0.97 | 6.54 | 0.87 | APO | |||
| 2018 Jan 28 | 58146.8242 | 0.48 | 0.96 | 7.49 | 0.86 | APO | |||
| 2018 Sep 27 | 58388.7695 | 0.43 | 1.09 | 6.29 | 0.98 | APO | |||
| 2018 Dec 24 | 58476.6680 | 0.32 | 0.99 | 3.99 | 0.84 | APO | |||
| 2019 Jan 14 | 58497.5977 | 0.01 | 0.36 | 87.64 | 0.31 | APO | |||
| 2019 Jan 15 | 58498.6328 | 0.04 | 1.12 | 42.24 | 1.02 | APO | |||
| 2019 Jan 19 | 58502.8281 | 0.18 | 0.97 | 4.62 | 0.83 | APO | |||
| 2019 Jan 22 | 58505.5391 | 0.27 | 1.07 | 1.82 | 0.94 | APO | |||
| 2019 Mar 24 | 58566.5859 | 0.27 | 1.00 | 2.23 | 0.86 | APO | |||
| 2019 Sep 13 | 58739.9375 | 0.97 | 0.37 | 105.06 | 0.32 | APO | |||
| 2019 Sep 19 | 58745.7422 | 0.16 | 0.26 | 4.95 | 0.25 | Fairborn | |||
| 2019 Oct 09 | 58765.6914 | 0.82 | 0.26 | 36.93 | 0.25 | Fairborn | |||
| 2019 Oct 14 | 58770.8164 | 0.98 | 0.37 | 108.78 | 0.32 | APO | |||
| 2019 Oct 20 | 58776.7461 | 0.18 | 0.26 | 3.81 | 0.25 | Fairborn | |||
| 2019 Oct 21 | 58777.6445 | 0.21 | 0.26 | 2.72 | 0.25 | Fairborn | |||
| 2019 Oct 21 | 58777.8789 | 0.22 | 0.96 | 3.92 | 0.81 | APO | |||
| 2019 Oct 25 | 58781.6289 | 0.34 | 0.26 | 3.11 | 0.25 | Fairborn | |||
| 2019 Oct 29 | 58785.6875 | 0.47 | 0.26 | 7.40 | 0.25 | Fairborn | |||
| 2019 Oct 30 | 58786.6250 | 0.50 | 0.26 | 8.50 | 0.25 | Fairborn | |||
| 2019 Oct 31 | 58787.6250 | 0.54 | 0.26 | 10.57 | 0.25 | Fairborn | |||
| 2019 Nov 01 | 58788.6250 | 0.57 | 0.26 | 12.12 | 0.25 | Fairborn | |||
| 2019 Nov 09 | 58796.8359 | 0.84 | 0.26 | 41.97 | 0.25 | Fairborn | |||
| 2019 Nov 13 | 58800.8359 | 0.97 | 0.26 | 104.75 | 0.25 | Fairborn | |||
| 2019 Nov 14 | 58801.8359 | 0.00 | 0.26 | 94.60 | 0.25 | Fairborn | |||
| 2019 Nov 14 | 58801.8906 | 0.00 | 0.34 | 92.01 | 0.30 | APO | |||
| 2019 Nov 15 | 58802.8359 | 0.04 | 0.26 | 48.49 | 0.25 | Fairborn | |||
| 2019 Nov 17 | 58804.8359 | 0.10 | 0.26 | 12.91 | 0.25 | Fairborn | |||
| 2019 Nov 18 | 58805.8359 | 0.13 | 0.26 | 7.34 | 0.25 | Fairborn | |||
| 2019 Nov 23 | 58810.8086 | 0.30 | 0.26 | 2.73 | 0.25 | Fairborn | |||
| 2020 Jan 12 | 58860.6758 | 0.94 | 0.34 | 80.93 | 0.30 | APO |
3 Interferometry
3.1 ‘Alopeke Observations
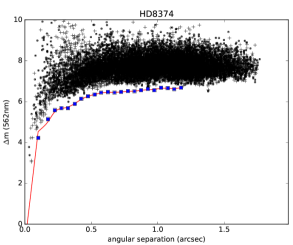
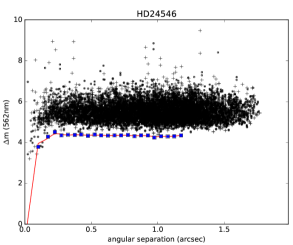
We observed these stars on 2018 Oct 23 with the ‘Alopeke speckle camera (Scott et al., 2018) on the 8.0 m Gemini-North telescope555https://www.gemini.edu/sciops/instruments/alopeke-zorro/ in order to search for any unresolved companions outside of CHARA’s limits that would bias our results. ‘Alopeke takes a series of 1000 60 ms exposures simultaneously in the 562 nm and 716 nm bands, and the data were reduced with the speckle team’s pipeline (Howell et al., 2011). We searched for companions within 1.5″ using the method given by Horch et al. (2017), but found no hidden companions down to the detection limits of mag for HD 8374 and mag for HD 24546. Plots of the detection limits for the 562 nm filter are shown in Figure 1.
3.2 CHARA Array Observations
We observed HD 8374 and HD 24546 with the CHARA Array from 2017–2019. CHARA has six 1.0 m telescopes arranged in a Y-shape with baselines ranging from 34–331 m. We used the CLIMB beam combiner to combine the -band light from three telescopes at a time. Our observations are listed in Tables 3 and 4, with the UT and heliocentric Julian dates, the telescope combination used, and the number of visibilities and closure phases measured. The CLIMB data were reduced with the pipeline developed by John D. Monnier, with the general method described in Monnier et al. (2011) and extended to three beams (e.g., Kluska et al., 2018), resulting in squared visibilities () for each baseline and closure phases (CP) for each closed triangle. We corrected for any instrumental and atmospheric effects on the observed visibilities using observations of stars with known angular diameters taken before and after the target to complete an observation “bracket”. The calibrator stars for HD 8374 were HD 8774 and HD 9616, which have -band uniform disk angular diameters of mas and mas from SearchCal (Chelli et al., 2016). The calibrators for HD 24546 were HD 25642 and HD 27084, which have -band angular diameters of mas and mas.
| UT Date | HJD-2,400,000 | Source | Telescope | Number | Number |
|---|---|---|---|---|---|
| Configuration | of | of CP | |||
| 1999 Aug 11 | 51401.975 | PTI | N-S | 7 | |
| 1999 Aug 23 | 51413.988 | PTI | N-S | 4 | |
| 1999 Sep 03 | 51424.932 | PTI | N-S | 5 | |
| 1999 Oct 13 | 51464.836 | PTI | N-S | 4 | |
| 1999 Oct 20 | 51471.808 | PTI | N-S | 5 | |
| 1999 Oct 26 | 51477.806 | PTI | N-S | 6 | |
| 2001 Aug 27 | 52148.972 | PTI | S-W | 6 | |
| 2001 Aug 30 | 52151.973 | PTI | S-W | 6 | |
| 2001 Sep 25 | 52177.884 | PTI | S-W | 6 | |
| 2005 Aug 12 | 53594.977 | PTI | S-W | 6 | |
| 2005 Aug 19 | 53601.963 | PTI | S-W | 8 | |
| 2005 Oct 23 | 53666.784 | PTI | S-W | 7 | |
| 2005 Nov 14 | 53688.717 | PTI | N-S | 12 | |
| 2005 Nov 15 | 53689.679 | PTI | N-W | 5 | |
| 2017 Sep 07 | 58003.862 | CHARA | E1-W1-W2 | 12 | 4 |
| 2017 Nov 30 | 58087.624 | CHARA | S1-W1-E1 | 9 | 3 |
| 2018 Aug 15 | 58345.929 | CHARA | S1-W1-E1 | 12 | 4 |
| 2018 Aug 16 | 58346.811 | CHARA | S1-W1-E1 | 21 | 7 |
| 2018 Aug 17 | 58347.889 | CHARA | S1-W1-E1 | 18 | 6 |
| 2018 Sep 03 | 58364.787 | CHARA | S1-W1-E1 | 12 | 4 |
| 2018 Sep 04 | 58365.783 | CHARA | S1-W1-E1 | 9 | 3 |
| 2019 Sep 16 | 58742.869 | CHARA | S1-W1-E1 | 12 | 4 |
| 2019 Sep 17 | 58743.836 | CHARA | S1-W1-E1 | 12 | 4 |
| 2019 Sep 18 | 58744.818 | CHARA | S1-W1-E1 | 12 | 4 |
3.3 PTI Observations
We also observed HD 8374 using the Palomar Testbed Interferometer (PTI, Colavita et al., 1999) from 1999–2005 as listed in Table 3. PTI had three 40 cm telescopes with separations of 87–110 m and combined the near-infrared light from two telescopes at a time. The single baseline measured only squared visibilities, because at least three baselines are needed to measure closure phases. All of the observations were taken in -band, except on 1999 Sep 03 which were taken in -band. These data were reduced using the standard PTI reduction pipeline (Colavita, 1999) and calibrated using the software provided by NExScI666http://nexsci.caltech.edu/software/. The observed calibrator stars were HD 6920, HD 7034, HD 7964, and HD 11007 with -band angular diameters of mas (van Belle et al., 2008), mas (Boden et al., 2006), mas (Boden et al., 2006), and mas (Konacki & Lane, 2004), respectively.
| UT Date | HJD-2,400,000 | Source | Telescope | Number | Number |
|---|---|---|---|---|---|
| Configuration | of | of CP | |||
| 2017 Sep 07 | 58003.984 | CHARA | E1-W1-W2 | 12 | 4 |
| 2017 Sep 08 | 58004.982 | CHARA | S1-W1-E1 | 24 | 8 |
| 2017 Oct 11 | 58037.975 | CHARA | S1-W1-E1 | 21 | 7 |
| 2017 Nov 30 | 58087.753 | CHARA | S1-W1-E1 | 15 | 5 |
| 2018 Aug 17 | 58348.009 | CHARA | S1-W1-E1 | 9 | 3 |
| 2019 Sep 17 | 58743.993 | CHARA | S1-W1-E1 | 18 | 6 |
| 2019 Sep 18 | 58744.912 | CHARA | S1-W1-E1 | 12 | 4 |
| 2019 Dec 20 | 58837.781 | CHARA | S1-W1-E1 | 18 | 6 |
| 2019 Dec 21 | 58838.653 | CHARA | S1-W1-E1 | 18 | 6 |
3.4 Binary Positions
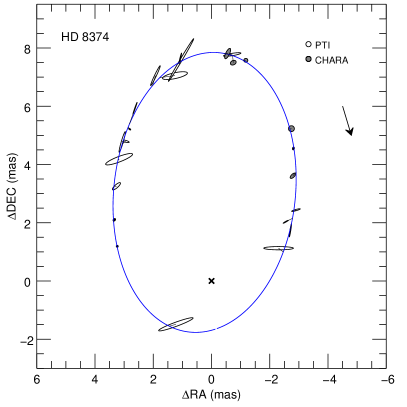
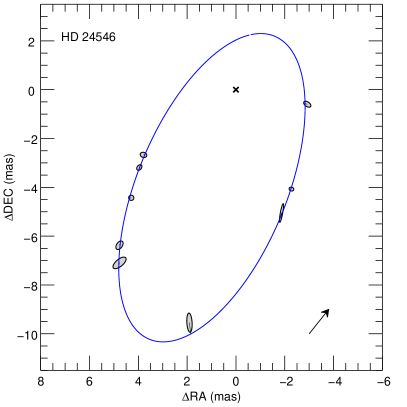
We measured the relative positions from the interferometric visibilities and closure phases using the method777http://www.chara.gsu.edu/analysis-software/binary-grid-search of Schaefer et al. (2016) as described in Lester et al. (2019a). Briefly, we searched across a grid of separations in right ascension and declination for the best-fit relative position. At each grid point, we compared the observed and CP to model values to fit for the flux ratio and calculate the value. We then searched a small area around the best-fit position to fit an ellipse to the contour marking , which determines the major axis, minor axis, and position angle of the error ellipse. Because the orbital periods of these systems are quite long, any orbital motion within a single night is typically within the error ellipses. The best-fit relative positions, error ellipse parameters, and flux ratio estimates for each night are listed in Tables 5 and 6. The average -band flux ratio from the CHARA observations is for HD 8374 and for HD 24546, where the uncertainty corresponds to the standard deviation from all nights.
The PTI observations of HD 8374 used only one baseline per night, so only one vector component of the separation could be measured. This resulted in multiple solutions within the limit, especially on nights with fewer than five points. Without closure phases to measure the flux asymmetry, each solution is also reflected across the origin. In order to break these ambiguities, one could either fit the visual orbit directly to the visibilities (e.g., Boden et al., 1999; Hełminiak et al., 2012), or use the 3-telescope observations as a reference. We opted for the latter method and chose the PTI solutions most consistent with a preliminary visual orbit from the CHARA observations.
| UT Date | HJD-2,400,000 | Orbital | ||||||
|---|---|---|---|---|---|---|---|---|
| Phase | (mas) | (deg) | (mas) | (mas) | (deg) | |||
| 1999 Aug 11 | 51401.9750 | 0.25 | 5.632 | 31.62 | 0.258 | 0.062 | 75.0 | 0.59 |
| 1999 Aug 23 | 51413.9880 | 0.59 | 7.807 | 354.79 | 0.604 | 0.080 | 99.1 | 0.45 |
| 1999 Sep 03 | 51424.9322 | 0.90 | 3.784 | 310.03 | 0.307 | 0.043 | 105.7 | 0.46 |
| 1999 Oct 13 | 51464.8361 | 0.03 | 1.927 | 140.55 | 1.258 | 0.141 | 110.2 | 0.43 |
| 1999 Oct 20 | 51471.8083 | 0.23 | 5.248 | 37.21 | 0.986 | 0.185 | 111.0 | 1.00 |
| 1999 Oct 26 | 51477.8062 | 0.40 | 7.160 | 10.10 | 0.873 | 0.200 | 102.2 | 1.00 |
| 2001 Aug 27 | 52148.9729 | 0.37 | 7.307 | 15.29 | 0.754 | 0.061 | 154.4 | 0.88 |
| 2001 Aug 30 | 52151.9740 | 0.46 | 7.656 | 7.86 | 1.702 | 0.070 | 149.3 | 0.64 |
| 2001 Sep 25 | 52177.8845 | 0.19 | 4.608 | 45.12 | 0.356 | 0.109 | 131.6 | 0.50 |
| 2005 Aug 12 | 53594.9778 | 0.26 | 5.673 | 32.72 | 0.738 | 0.068 | 163.6 | 0.44 |
| 2005 Aug 19 | 53601.9639 | 0.46 | 7.716 | 8.00 | 0.377 | 0.025 | 166.2 | 0.83 |
| 2005 Oct 23 | 53666.7841 | 0.29 | 6.488 | 23.88 | 0.420 | 0.021 | 160.5 | 0.56 |
| 2005 Nov 14 | 53688.7174 | 0.91 | 3.259 | 308.58 | 0.203 | 0.023 | 119.6 | 0.97 |
| 2005 Nov 15 | 53689.6795 | 0.94 | 2.562 | 296.05 | 1.016 | 0.111 | 89.9 | 0.95 |
| 2017 Sep 07 | 58003.8658 | 0.91 | 3.218 | 302.72 | 0.454 | 0.028 | 170.9 | 0.75 |
| 2017 Nov 30 | 58087.6281 | 0.28 | 5.921 | 28.32 | 0.087 | 0.037 | 53.8 | 0.68 |
| 2018 Aug 15 | 58345.9310 | 0.59 | 7.827 | 355.95 | 0.390 | 0.129 | 154.5 | 0.72 |
| 2018 Aug 16 | 58346.8129 | 0.61 | 7.531 | 354.32 | 0.209 | 0.148 | 116.8 | 0.65 |
| 2018 Aug 17 | 58347.8908 | 0.64 | 7.667 | 351.17 | 0.133 | 0.136 | 180.0 | 0.87 |
| 2018 Sep 03 | 58364.7905 | 0.12 | 3.450 | 69.81 | 0.022 | 0.019 | 4.0 | 0.79 |
| 2018 Sep 04 | 58365.7858 | 0.15 | 3.943 | 57.84 | 0.057 | 0.025 | 136.3 | 0.98 |
| 2019 Sep 16 | 58742.8731 | 0.81 | 5.905 | 332.33 | 0.201 | 0.201 | 131.9 | 0.65 |
| 2019 Sep 17 | 58743.8404 | 0.84 | 5.347 | 328.28 | 0.049 | 0.018 | 166.5 | 0.98 |
| 2019 Sep 18 | 58744.8179 | 0.86 | 4.566 | 322.29 | 0.238 | 0.110 | 134.6 | 1.01 |
| UT Date | HJD-2,400,000 | Orbital | ||||||
|---|---|---|---|---|---|---|---|---|
| Phase | (mas) | (deg) | (mas) | (mas) | (deg) | |||
| 2017 Sep 07 | 58003.9840 | 0.80 | 5.385 | 200.28 | 0.323 | 0.040 | 169.6 | 0.87 |
| 2017 Sep 08 | 58004.9818 | 0.83 | 4.663 | 209.18 | 0.083 | 0.064 | 69.7 | 0.90 |
| 2017 Oct 11 | 58037.9752 | 0.91 | 2.983 | 258.48 | 0.139 | 0.078 | 55.6 | 0.69 |
| 2017 Nov 30 | 58087.7533 | 0.55 | 9.733 | 168.72 | 0.328 | 0.089 | 3.5 | 0.79 |
| 2018 Aug 17 | 58348.0094 | 0.10 | 4.635 | 125.20 | 0.114 | 0.087 | 73.9 | 0.96 |
| 2019 Sep 17 | 58743.9935 | 0.11 | 5.082 | 128.84 | 0.108 | 0.073 | 140.6 | 0.65 |
| 2019 Sep 18 | 58744.9119 | 0.14 | 6.167 | 135.93 | 0.088 | 0.088 | 15.5 | 1.00 |
| 2019 Dec 20 | 58837.7811 | 0.19 | 7.961 | 143.18 | 0.098 | 0.059 | 145.65 | 0.50 |
| 2019 Dec 21 | 58838.6529 | 0.22 | 8.549 | 146.10 | 0.164 | 0.073 | 129.71 | 0.66 |
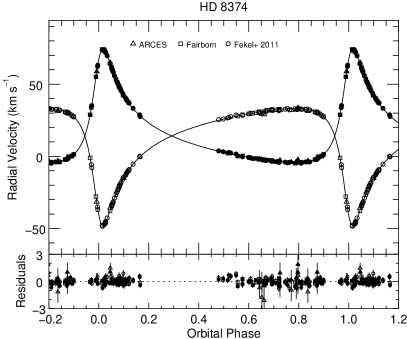
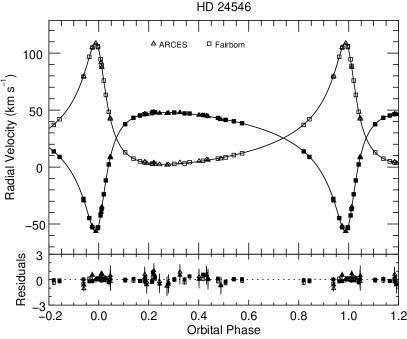
3.5 Combined Visual + Spectroscopic Solution
We determined the final orbital solution by simultaneously fitting the interferometric and spectroscopic data using the method of Schaefer et al. (2016). The full set of orbital parameters includes the orbital period (), epoch of periastron (), eccentricity (), longitude of periastron of the primary star (), the inclination (), the angular semi-major axis (), the longitude of the ascending node (), the systemic velocity (), and the velocity semi-amplitudes (, ). Table 7 lists the best-fit orbital solutions for HD 8374 and HD 24546. The visual orbits are shown in Figure 2, and the spectroscopic orbits are shown in Figure 3. To determine the uncertainty of each orbital parameter, we performed a Monte Carlo error analysis in which we varied each data point within its Gaussian uncertainty and refit for the orbital solution. We then made a histogram of the best-fit parameters from iterations and fit Gaussians to each distribution to determine the uncertainties in each parameter (listed in Table 7).
| Parameter | HD 8374 | HD 24546 |
|---|---|---|
| (d) | ||
| (HJD-2400000) | ||
| (deg) | ||
| (deg) | ||
| (mas) | ||
| (deg) | ||
| (km s-1) | ||
| (km s-1) | ||
| (km s-1) |
4 Stellar Parameters
4.1 Masses and Distance
From the visual and spectroscopic orbital solution, we calculated the masses and distances of HD 8374 and HD 24546 using the nominal solar values from Prša et al. (2016). All of the fundamental stellar parameters for HD 8374 and HD 24546 are listed in Table 8. We found HD 8374 to have masses of and , and a distance of pc. The distance from our orbital parallax is consistent with the Gaia DR2 (Gaia Collaboration et al., 2016) distance of pc (Bailer-Jones et al., 2018) from its trigonometric parallax. For HD 24546, we found masses of and , and a distance of pc. This is also consistent with the Gaia DR2 distance of pc for HD 24546 (Bailer-Jones et al., 2018).
| Parameter | HD 8374 | HD 24546 |
|---|---|---|
| () | ||
| () | ||
| () | ||
| () | ||
| (K) | ||
| (K) | ||
| (cgs) | ||
| (cgs) | ||
| (km s-1) | ||
| (km s-1) | ||
| Distance (pc) | ||
| (mag) |
4.2 Effective Temperatures and Rotational Velocities
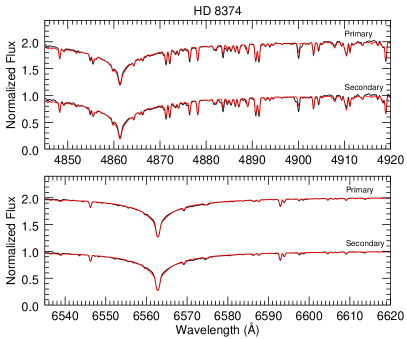
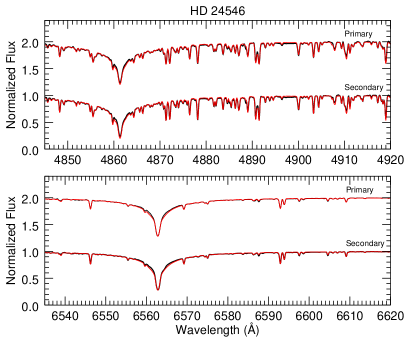
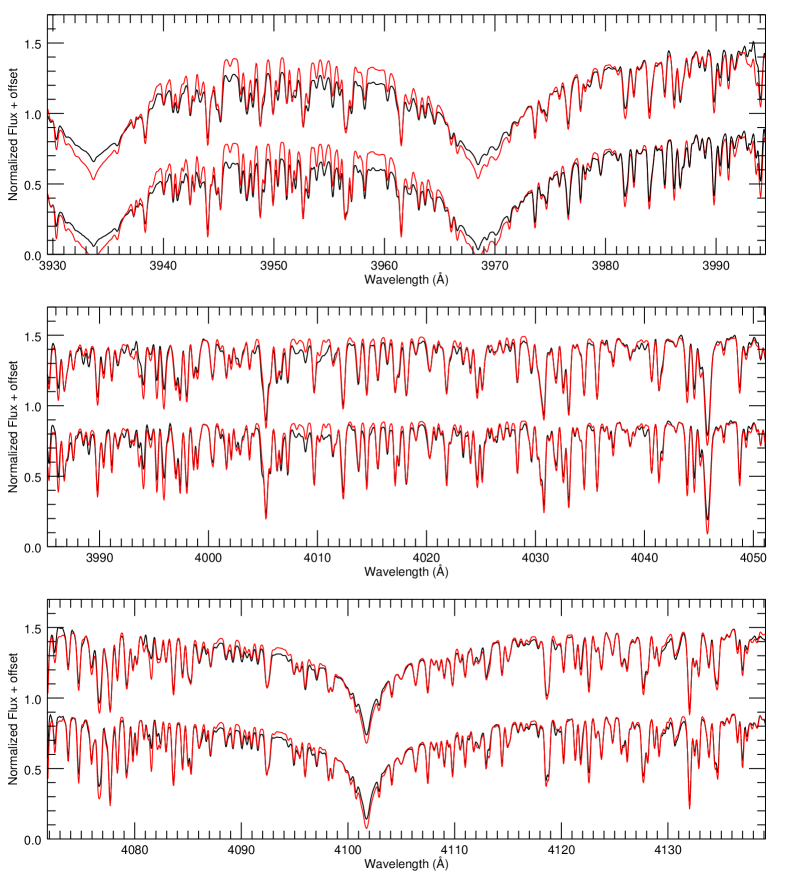
To determine the atmospheric parameters of these stars, we first reconstructed the individual spectrum of each component using a Doppler tomography algorithm (Bagnuolo et al., 1992) with BLUERED template spectra as inputs. We then compared the reconstructed spectra to model spectra of various effective temperatures () and projected rotational velocities (). For each combination of and , we calculated the CCF of the model and reconstructed spectra at several echelle orders featuring strong metal absorption lines. We added the CCFs from all orders together to form a grid of CCFs as a function of and , then interpolated within the grid to find the CCF maximum position and the corresponding best-fit and for each component. For HD 8374, we found K, K, km s-1, and km s-1. Both components are rotating faster than their pseudo-synchronous velocities of 9.6 km s-1 and 8.7 km s-1. For HD 24546, we found K, K, km s-1, and km s-1. Both components are rotating close to their pseudo-synchronous velocities (Hilditch, 2001) of 12.9 km s-1and 12.4 km s-1. Figure 4 shows the reconstructed spectra of each component and the model spectra created using these best-fit atmospheric parameters. Extended figure sets are included in the Appendix.
4.3 Radii and Surface Gravities
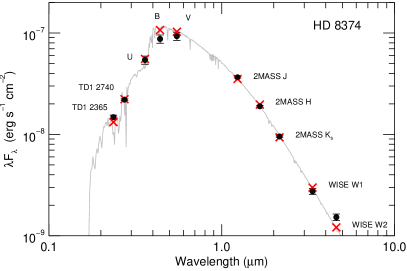
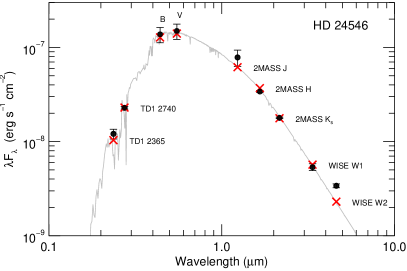
We gathered photometry from the literature to create spectral energy distributions (SEDs) of HD 8374 and HD 24546, including ultraviolet fluxes from TD-1 (Thompson et al., 1978), optical fluxes from Soubiran et al. (2016), and infrared fluxes from 2MASS (Skrutskie et al., 2006) and WISE (Wright et al., 2010). We then created a binary SED model using
where and are surface flux models of each component (Castelli & Kurucz, 2004), and are the stellar radii, is the distance, and is the extinction in magnitudes. We used the reddening curves () of Fitzpatrick (1999) to calculate the extinction at each wavelength for a given color excess, where We also calculated the radius ratio () of each system from the model surface flux ratio and the observed flux ratios near H (from the spectroscopic flux ratio) and in -band (from the interferometric flux ratio). The weighted-average radius ratio is then for HD 8374 and for HD 24546.
We substituted this ratio into the above equation, then fit the binary model SED to the observed fluxes in order to determine and (reported in terms of in Table 8). We calculated from the radius ratios and calculated the surface gravities () from the masses and radii. For HD 8374, we found , , and . For HD 24546, we found , , and . The observed fluxes and the best-fit binary SED model are shown in Figure 5.
4.4 Comparison with Evolutionary Models
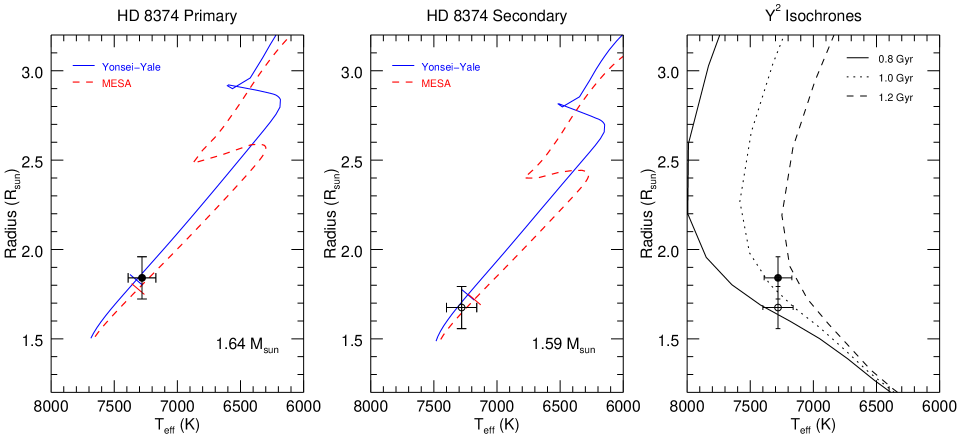
To estimate the ages of HD 8374 and HD 24546, we compared the observed stellar parameters to the predictions of the evolutionary models from Yonsei-Yale (Demarque et al., 2004) and MESA (Paxton et al., 2011, 2013, 2015, 2018, 2019). The Yonsei-Yale models were made for each component with their interpolation program888http://www.astro.yale.edu/demarque/yystar.html. These models adopt a mixing length parameter of =1.74, which corresponds to the mixing length divided by the local pressure scale height. The models also use a step function prescription for the convective core overshooting, where the overshooting parameter () increases from 0.0–0.2 based on the star’s mass. The MESA models999http://www.mesa.sourceforge.net/index.html were created at the observed masses with MESA release 10108. The default mixing length parameter is =2.0 for these models. We also chose overshooting parameters of for both components of HD 8374 and for both components of HD 24546 based on the empirical calibration of Claret & Torres (2018). Both sets of models are also non-rotating and use solar metallicity.
Finally, we estimated the age of each binary system by averaging the individual component ages (where the model most closely matches the observed parameters), and determined the uncertainty from the range of ages that match the parameters of both components. For HD 8374, we found the system age to be Gyr in the models and Gyr in the MESA models. The evolutionary tracks and isochrones for HD 8374 are shown in Figure 6. The models successfully intersect the observed properties of both components at a single age.
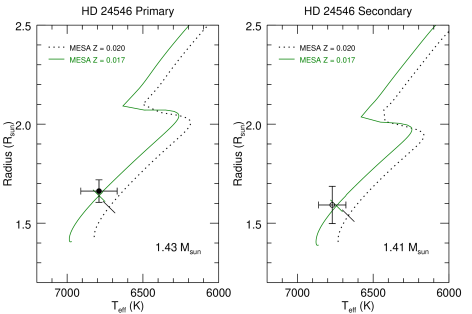
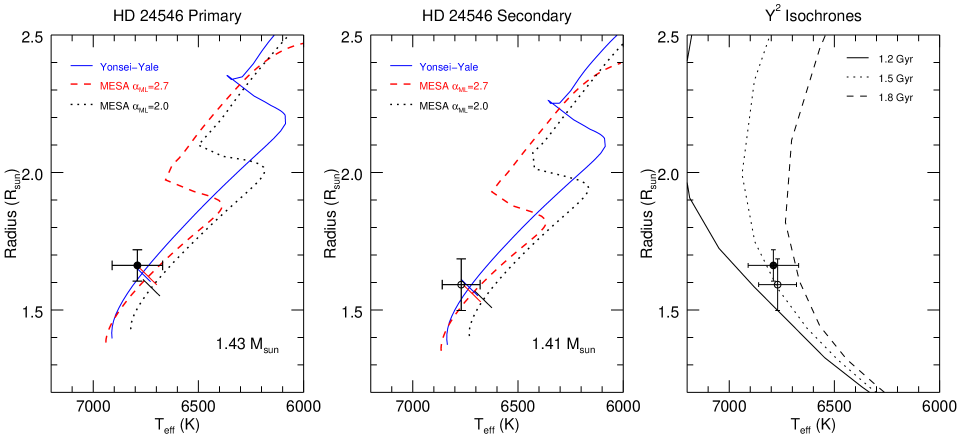
For HD 24546, the models successfully intersect the observations at an age of Gyr, as shown in Figure 7. However, the MESA models could not reproduce the observed values at the same age. To solve this problem, we first tested different mixing length parameters from , the range tested by Claret & Torres (2018), to find which tracks intersect the observations with the least difference in age between the components. We found the best value to be for both components and a corresponding system age of Gyr. MESA evolutionary tracks for the default value of and the best-fit value of are shown in Figure 7.
Next, we kept fixed to 2.0 and tested different metallicities from , where MESA adopts a solar metallicity of from Grevesse & Sauval (1998). For each metallicity, we refit for the component effective temperatures using the method described in Section 4.2 and model spectra interpolated to the given metallicity. Because the BLUERED spectra use from Anders & Grevesse (1989), we used the same for both models and found that decreasing the ratio by dex resulted in a decreased effective temperature by about 50 K, which is within the temperature uncertainties. We found that a slightly sub-solar metallicity of could successfully fit the parameters of both components at an age of Gyr as shown in Figure 8.
5 Discussion
By measuring the visual and spectroscopic orbits of HD 8374 and HD 24546, we determined the masses of each component to within 3% and the radii to within 7%. To better test the stellar evolution models, the next step would be to reduce the uncertainties in stellar radius. Typically, this is done with light curve modeling for short period, eclipsing systems. However, HD 8374 and HD 24546 have periods of 30 or more days, orbital inclinations far from 90 degrees, and radii less than twice that of the Sun, so neither HD 8374 nor HD 24546 is expected to show eclipses.
Therefore, better radius estimates can only be measured by resolving the component stars with long baseline interferometry at visible wavelengths. The PAVO (Ireland et al., 2008) and VEGA (Mourard et al., 2009) beam combiners at CHARA currently have angular resolutions of 0.25 mas and 0.20 mas, respectively, and NPOI (Armstrong et al., 1998) is expected to have an angular resolution of 0.15 mas when the 432 m baseline is installed. The components of HD 8374 have estimated angular diameters of 0.29 and 0.26 mas, while the components of HD 24546 have estimated angular diameters of 0.40 and 0.38 mas, so both arrays would be able to resolve the individual stars within these systems.
We also confirm that both components of HD 8374 show much weaker Ca II lines than found in the model spectra of an early F-type star, as seen in Figure 9. This is consistent with other Am stars, which are defined by an apparent surface under-abundance of calcium (Conti, 1970). The metal and hydrogen line depths of HD 8374 appear to match the models, so these abundances are likely close to solar.
Finally, we report on whether or not HD 24546 is a member of the Hyades cluster. The cluster distance is pc at the center with an estimated radius of 10 pc (Perryman et al., 1998). We found the distance of HD 24546 to be pc, consistent with the inner edge of the Hyades cluster. However, our age for HD 24546 from the evolutionary tracks is Gyr, compared to ages for the Hyades cluster of Myr using non-rotating models (Perryman et al., 1998) or Myr using rotating models (Brandt & Huang, 2015). The BANYAN code of Gagné et al. (2018) also reports 0% probability of cluster membership using positions, proper motions, radial velocities, and parallaxes. Thus, we conclude that HD 24546 is not a member of the Hyades cluster.
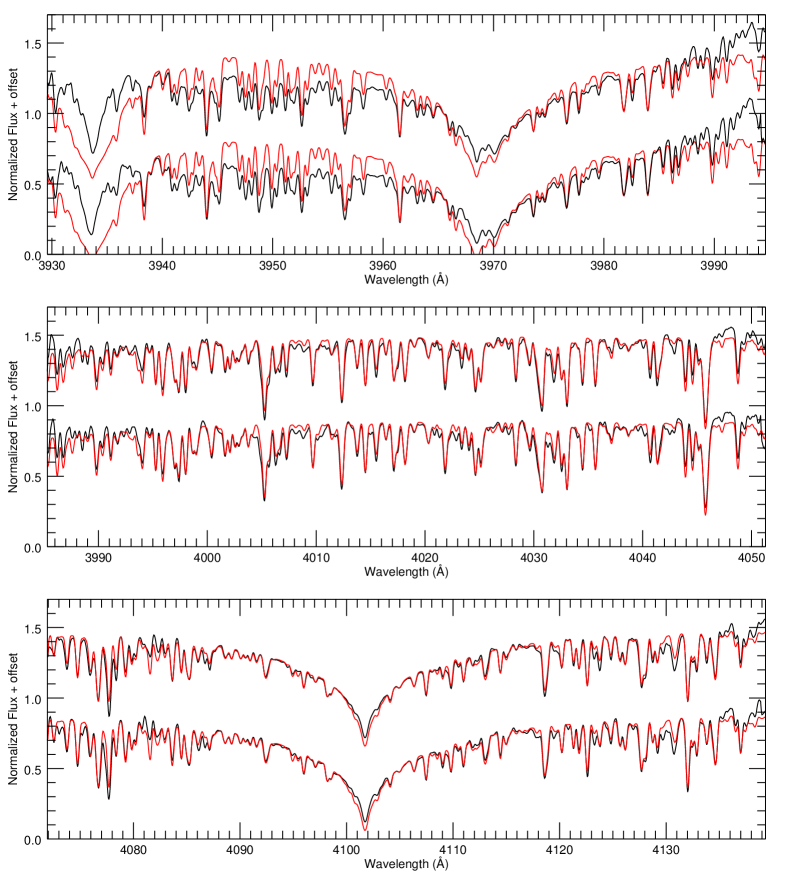
Fig. Set2. Reconstructed spectra of HD 24546
References
- Abt & Levy (1976) Abt, H. A., & Levy, S. G. 1976, ApJS, 30, 273
- Abt & Morrell (1995) Abt, H. A., & Morrell, N. I. 1995, ApJS, 99, 135
- Anders & Grevesse (1989) Anders, E., & Grevesse, N. 1989, Geochim. Cosmochim. Acta, 53, 197
- Armstrong et al. (1998) Armstrong, J. T., Mozurkewich, D., Rickard, L. J., et al. 1998, ApJ, 496, 550
- Bagnuolo et al. (1992) Bagnuolo, W. G., Jr., Gies, D. R., & Wiggs, M. S. 1992, ApJ, 385, 708
- Bailer-Jones et al. (2018) Bailer-Jones, C. A. L., Rybizki, J., Fouesneau, M., et al. 2018, AJ, 156, 58
- Bertone et al. (2008) Bertone, E., Buzzoni, A., Chávez, M., & Rodríguez-Merino, L. H. 2008, A&A, 485, 823
- Boden et al. (1999) Boden, A. F., Koresko, C. D., van Belle, G. T., et al. 1999, ApJ, 515, 356
- Boden et al. (2006) Boden, A. F., Torres, G., & Latham, D. W. 2006, ApJ, 644, 1193
- Brandt & Huang (2015) Brandt, T. D., & Huang, C. X. 2015, ApJ, 807, 58
- Castelli & Kurucz (2004) Castelli, F., & Kurucz, R. L. 2004, arXiv:astro-ph/0405087, ADS link
- Chelli et al. (2016) Chelli, A., Duvert, G., Bourgès, L., et al. 2016, A&A, 589, A112
- Claret & Torres (2018) Claret, A., & Torres, G. 2018, ApJ, 859, 100
- Colavita et al. (1999) Colavita, M. M., Wallace, J. K., Hines, B. E., et al. 1999, ApJ, 510, 505
- Colavita (1999) Colavita, M. M. 1999, PASP, 111, 111
- Conti (1970) Conti, P. S. 1970, PASP, 82, 781
- Demarque et al. (2004) Demarque, P., Woo, J.-H., Kim, Y.-C., & Yi, S. K. 2004, ApJS, 155, 667
- Eaton & Williamson (2004) Eaton, J. A., & Williamson, M. H. 2004, in Advanced Software, Control, and Communication Systems for Astronomy, Proc. SPIE, ed. H. Lewis & G. Raffi (Bellingham, WA: SPIE), 5496, 710
- Eaton & Williamson (2007) Eaton, J. A., & Williamson, M. H. 2007, PASP, 119, 886
- Eggen (1971) Eggen, O. J. 1971, PASP, 83, 741
- Fekel et al. (2009) Fekel, F. C., Tomkin, J., & Williamson, M. H. 2009, AJ, 137, 3900
- Fekel et al. (2011) Fekel, F. C., Tomkin, J., Williamson, M. H., et al. 2011, AJ, 142, 69
- Fekel et al. (2013) Fekel, F. C., Rajabi, S., Muterspaugh, M. W., et al. 2013, AJ, 145, 111
- Fitzpatrick (1999) Fitzpatrick, E. L. 1999, PASP, 111, 63
- Fletcher (1967) Fletcher, J. M. 1967, JRASC, 61, 56
- Gagné et al. (2018) Gagné, J., Mamajek, E. E., Malo, L., et al. 2018, ApJ, 856, 23
- Gaia Collaboration et al. (2016) Gaia Collaboration, Prusti, T., de Bruijne, J. H. J., et al. 2016, A&A, 595, A1
- Grevesse & Sauval (1998) Grevesse, N., & Sauval, A. J. 1998, Space Sci. Rev., 85, 161
- Halbwachs (1981) Halbwachs, J. L. 1981, A&AS, 44, 47
- Hełminiak et al. (2012) Hełminiak, K. G., Konacki, M., Muterspaugh, M. W., et al. 2012, MNRAS, 419, 1285
- Hilditch (2001) Hilditch, R. W. 2001, An Introduction to Close Binary Stars (Cambridge, UK: Cambridge University Press), ADS link
- Horch et al. (2017) Horch, E. P., Casetti-Dinescu, D. I., Camarata, M. A., et al. 2017, AJ, 153, 212
- Howell et al. (2011) Howell, S. B., Everett, M. E., Sherry, W., Horch, E., & Ciardi, D. R. 2011, AJ, 142, 19
- Ireland et al. (2008) Ireland, M. J., Mérand, A., ten Brummelaar, T. A., et al. 2008, in Optical and Infrared Interferometry, Proc. SPIE, ed. M. Sch ller, W. C. Danchi, & F. Delplancke (Bellingham, WA: SPIE), 7013
- Iglesias-Marzoa et al. (2015) Iglesias-Marzoa, R., López-Morales, M., & Jesús Arévalo Morales, M. 2015, PASP, 127, 567
- Kolbas et al. (2015) Kolbas, V., Pavlovski, K., Southworth, J., et al. 2015, MNRAS, 451, 4150
- Konacki & Lane (2004) Konacki, M., & Lane, B. F. 2004, ApJ, 610, 443
- Kluska et al. (2018) Kluska, J., Kraus, S., Davies, C. L., et al. 2018, ApJ, 855, 44
- Lépine & Bongiorno (2007) Lépine, S., & Bongiorno, B. 2007, AJ, 133, 889
- Lester et al. (2019a) Lester, K. V., Gies, D. R., Schaefer, G. H., et al. 2019a, AJ, 157, 140
- Lester et al. (2019b) Lester, K. V., Gies, D. R., Schaefer, G. H., et al. 2019b, AJ, 158, 218
- Monnier et al. (2011) Monnier, J. D., Zhao, M., Pedretti, E., et al. 2011, ApJ, 742, L1
- Montes et al. (2018) Montes, D., González-Peinado, R., Tabernero, H. M., et al. 2018, MNRAS, 479, 1332
- Mourard et al. (2009) Mourard, D., Clausse, J. M., Marcotto, A., et al. 2009, A&A, 508, 1073
- Paxton et al. (2011) Paxton, B., Bildsten, L., Dotter, A., et al. 2011, ApJS, 192, 3
- Paxton et al. (2013) Paxton, B., Cantiello, M., Arras, P., et al. 2013, ApJS, 208, 4
- Paxton et al. (2015) Paxton, B., Marchant, P., Schwab, J., et al. 2015, ApJS, 220, 15
- Paxton et al. (2018) Paxton, B., Schwab, J., Bauer, E. B., et al. 2018, ApJS, 234, 34
- Paxton et al. (2019) Paxton, B., Smolec, R., Schwab, J., et al. 2019, ApJS, 243, 10
- Perryman et al. (1998) Perryman, M. A. C., Brown, A. G. A., Lebreton, Y., et al. 1998, A&A, 331, 81
- Prša et al. (2016) Prša, A., Harmanec, P., Torres, G., et al. 2016, AJ, 152, 41
- Sandberg Lacy & Fekel (2011) Sandberg Lacy, C. H., & Fekel, F. C. 2011, AJ, 142, 185
- Scarfe (2010) Scarfe, C. D. 2010, The Observatory, 130, 214
- Schaefer et al. (2016) Schaefer, G. H., Hummel, C. A., Gies, D. R., et al. 2016, AJ, 152, 213
- Scott et al. (2018) Scott, N. J., Howell, S. B., Horch, E. P., et al. 2018, PASP, 130, 054502
- Skrutskie et al. (2006) Skrutskie, M. F., Cutri, R. M., Stiening, R., et al. 2006, AJ, 131, 1163
- Soubiran et al. (2016) Soubiran, C., Le Campion, J.-F., Brouillet, N., et al. 2016, A&A, 591, A118
- ten Brummelaar et al. (2005) ten Brummelaar, T. A., McAlister, H. A., Ridgway, S. T., et al. 2005, ApJ, 628, 453
- ten Brummelaar et al. (2013) ten Brummelaar, T. A., Sturmann, J., Ridgway, S. T., et al. 2013, Journal of Astronomical Instrumentation, 2, 1340004
- Thompson et al. (1978) Thompson, G. I., Nandy, K., Jamar, C., et al. 1978. “Catalogue of stellar ultraviolet fluxes: a compilation of absolute stellar fluxes measured by the Sky Survey Telescope (S2/68) aboard the ESRO satellite TD-1”, (London: The Science Research Council), ADS link
- Tokovinin (1997) Tokovinin, A. A. 1997, A&AS, 124, 75
- van Belle et al. (2008) van Belle, G. T., van Belle, G., Creech-Eakman, M. J., et al. 2008, ApJS, 176, 276
- Wallerstein (1973) Wallerstein, G. 1973, PASP, 85, 115
- Wang et al. (2003) Wang, S.-i., Hildebrand, R. H., Hobbs, L. M., et al. 2003, in Instrument Design and Performance for Optical/Infrared Ground-based Telescopes, Proc. SPIE 4841, ed. M. Iye & A. F. M. Moorwood (Bellingham, WA: SPIE), 1145
- Wright et al. (2010) Wright, E. L., Eisenhardt, P. R. M., Mainzer, A. K., et al. 2010, AJ, 140, 1868
- Zucker & Mazeh (1994) Zucker, S., & Mazeh, T. 1994, ApJ, 420, 806
- Zucker et al. (2003) Zucker, S., Mazeh, T., Santos, N. C., Udry, S., & Mayor, M. 2003, A&A, 404, 775