Removal of 210Pb by Etch of Crystalline Detector Sidewalls
Abstract
A potential source of dominant backgrounds for many rare-event searches or screening detectors is from radon daughters, specifically 210Pb, deposited on detector surfaces, often during detector fabrication. Performing a late-stage etch is challenging because it may damage the detector. This paper describes a late-stage etching technique that reduces surface 210Pb and 210Po by at 90% C.L.
keywords:
dark matter, low-background searches, crystal, etching, radon, contamination, surface, Pb-2101 Introduction
Radioactive contamination on detector surfaces can limit the sensitivity of rare-event searches or low-background measurements. A potentially dominant source of surface contamination is from radon progeny, such as 210Pb, which has a 22.3 year half-life, long compared to the lifetime of most experiments. These progeny produce several decays that can mimic a signal in these detectors [1, 2, 3, 4, 5, 6, 7].
SuperCDMS is a rare-event, dark-matter search experiment that uses high-purity Si or Ge crystals as the target material [8]. Sensors on the faces of these cylindrical detectors measure athermal phonons (heat) and ionization (charge) produced from particle scattering off Si or Ge nuclei. Primarily focused on detecting the elusive weakly interactive massive particle (WIMP), SuperCDMS has produced world-leading exclusion limits on the WIMP-nucleon scattering cross-section [9, 10], and its detector technology has evolved to be sensitive to even single electron-hole pairs [11, 12].
This paper describes a newly-developed etching technique for the sidewalls of solid-state crystal detectors. A Si crystal core was exposed to high-radon air, depositing 210Pb on the core’s surface. The core’s sidewall was assayed by an alpha counter sensitive to 210Po alpha decays before and after the etching technique was performed to infer the reduction in 210Pb due to the etch.
2 210Pb Deposition from High-Radon Air Exposure
A 76 mm 25.4 mm polished Si crystal was fabricated with SuperCDMS sensors. Following fabrication, the crystal was coated with Logitech OCON-200 bonding wax and sandwiched between two borosilicate glass disks to protect the circuit and reduce substrate chipping during coring. The coring process was performed on a standard Bridgeport Mill using hardware custom-designed to aid in substrate cooling. The diamond-coated coring bit (in diameter) was custom-fabricated by Keen-Kut Products, Hatward California.
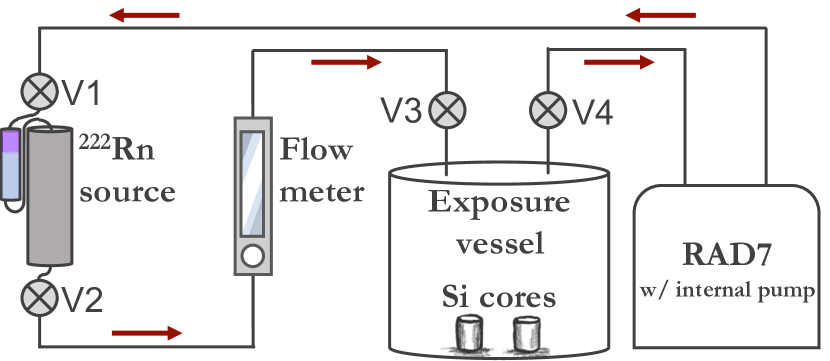
Two of the cores produced were used for this study. They were exposed to high-radon air (having a radon concentration of MBq/m3) for 18 days and then another 13 days (with a 1-day assay of the 210Po decay rate in between). Figure 1 illustrates the experimental setup during the last 13 days (the second exposure), which consisted of a 222Rn source supplied by Pylon [13], exposure vessel, inline flow meter, and Durridge RAD7 in a closed loop with the air inside circulated by the RAD7’s internal pump. The 18-day exposure (the first exposure) used a hand-syphon pump in place of the RAD7.
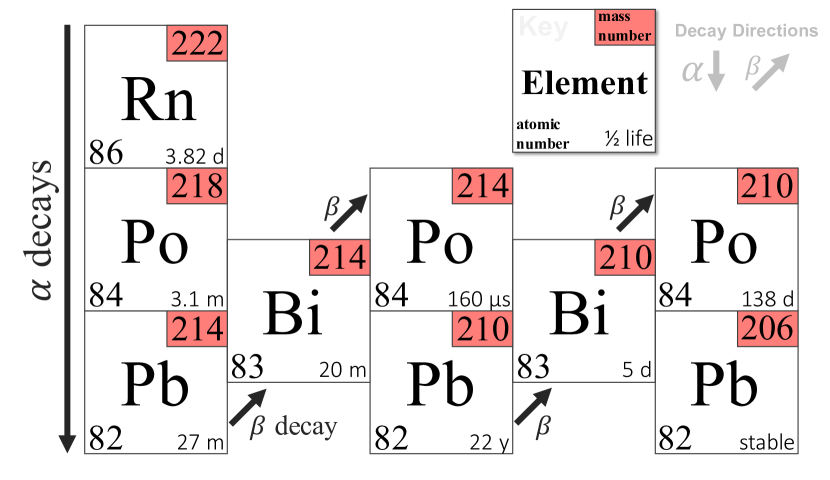
During exposure, 222Rn decays through its so-called fast daughters 218Po, 214Pb, 214Bi, and 214Po (see the radon chain in Fig. 2). These fast daughters, usually positively charged [14], may settle on nearby surfaces [15]. Subsequent alpha decays may then embed the daughters of order 10 nm into the surface. As a result, some 210Pb is embedded and concentrated just below the surface from the sustained radon exposure.
Prior to each exposure, the setup was flushed with low-radon lab air. If sufficient mixing is obtained, the radon concentration within the exposure vessel is
| (1) |
where the 222Rn source activity kBq and its inner volume liters. The volume of the exposure vessel liters and the radon mean lifetime days. The exponential factor reflects radon growing into equilibrium within the setup volume.
During the first exposure, a syphon pump was used to circulate the gas. For the second exposure, the syphon pump was replaced by a RAD7, making use of its internal pump. The RAD7 demonstrated that sufficient mixing was achieved, so the time dependence of the radon concentration during the second exposure should be described by Eq. 1.
The relative amounts of 210Pb, 210Bi, and 210Po on the Si core at the beginning of the pre-etch assay influence the time dependence of the 210Po decay rate. If the radon concentration during exposure is understood, then the radioactive decay equations may be solved to provide the relative abundance of each radon daughter. Thus, the 210Po rate due to the second exposure can be modeled with a single fitting parameter accounting for the unknown absolute deposition rate. The 210Po rate due to the first exposure is characterized by three free parameters, representing the 210Pb, 210Bi, and 210Po at the end of the exposure, ensuring a conservative limit is set.
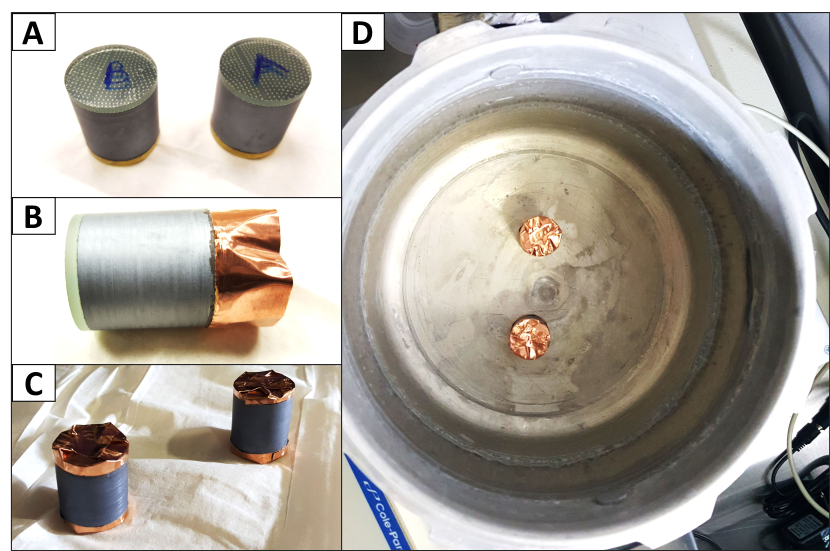
The exposure vessel was cylindrical with input and output feedthroughs penetrating its hemispherical lid. As seen in Fig. 3, copper foil was used to shield radon daughters from static charge on the wax that could reduce deposition on the core sidewalls. The cores were placed within the exposure vessel roughly equidistant between the vessel walls. The lack of radial symmetry in the core placement suggests non-uniform deposition with respect to the axial rotation of each core.
3 Pre-etch Assay
Though the pre-etch assay was performed on two Si cores that were both exposed to high-radon air, only the one that was eventually etched and re-assayed will be further discussed.
An Ortec Alpha Duo alpha spectrometer [16] counted the 210Po rate on the sidewall of the Si core. The consistent placement and rotation of the Si core within the Alpha Duo detector bay was important to ensure that the same region of the core’s sidewall was counted, as variation in the amount of 210Pb deposited as a function of rotation was likely, due to the placement geometry during exposure. Reproducibility of each angle of rotation minimized this possible systematic due to inadvertent rotation.
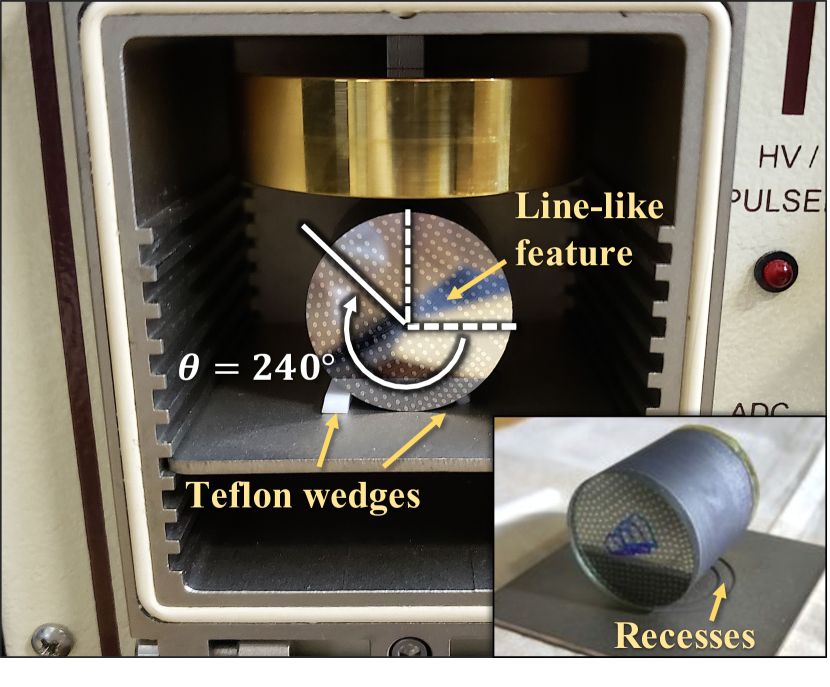
During the pre-etch assay, the Si core was periodically removed and replaced in the detector bay at an angle of rotation , , and as measured from the horizontal. The angle of the core was tracked by a line-like feature of the sensors on its face (see Fig. 4). Consistent core placement in the horizontal plane was guided by concentric recesses in the detector bay shelves. During handling, nitrile gloves were worn and only the detector faces were touched. This ensured that contaminants were neither added nor removed from the core’s sidewall.
3.1 Fitting the Pre-etch Data
The Bateman equation describes the number of atoms of the ’th daughter produced by a radioactive parent [17]:
| (2) |
where is the ’th daughter’s decay constant (for our case, and refers to 210Pb, 210Bi, and 210Po).
The two exposures are considered independently and, built upon Eq. 2, added together. The expected signal representing the detected 210Po decay rate has free parameters representing the initial 210Pb, 210Bi, and 210Po atoms at the end of the first exposure, abbreviated as , , and the initial 210Pb at the end of the second exposure, abbreviated :
| (3) |
where is denoted as just and is the time between the beginning of the first and second exposures. The detector efficiency is , the 210Po decay constant s-1, and the second term is multiplied by the Heaviside function.
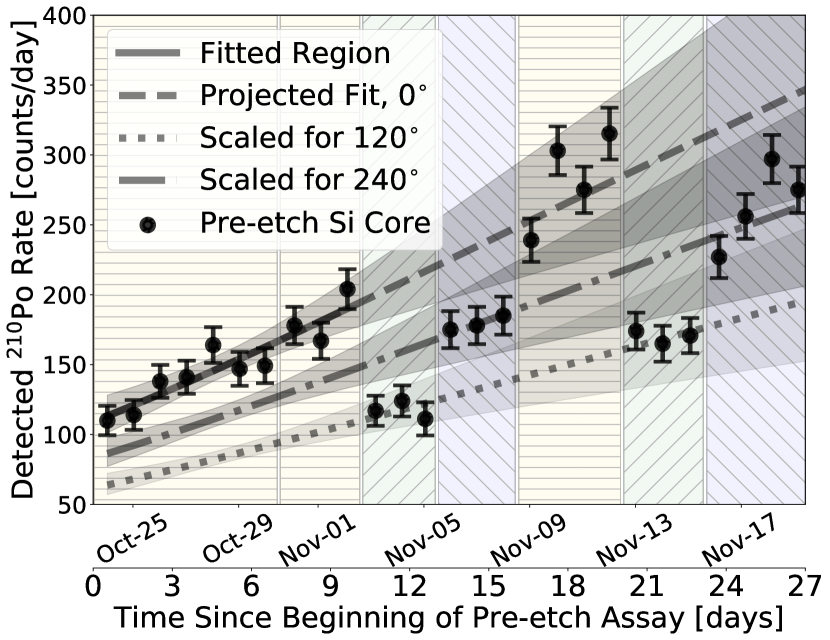
Equation 3 was fit to the () one-day assay after the first exposure and the first 10 days of the () assay after the second exposure. Figure 5 shows this fit, but focused on the pre-etch assay after the second exposure for clarity. The inferred surface contamination on the measured () side of the Si core at the beginning of the pre-etch assay (prior to etch) was
Uncertainties were determined by throwing unique fitting parameter combinations each drawn from a uniform distribution. A cut on the resulting was placed to obtain bands. The domain of each thrown parameter and the best-fit value is shown in Table 1.
| parameter | domain | best-fit value |
|---|---|---|
Of the parameter combinations thrown, 21,108 passed the cut. These values were checked to ensure good coverage of the parameter space.
Each run at each angle of core rotation was fit, with a single scaling parameter, against the signal function fit to the first run. That is, the fit of , was scaled to fit each run as
| (4) |
where is a best-fit scaling parameter. Table 2 lists values of and its uncertainty for both runs at each core rotation. The difference between the two scaling factors for each angle is consistent with statistical uncertainties.
| 1.00 | 0.56 | 0.76 | |
| 1.05 | 0.57 | 0.77 | |
| 0.02 | 0.03 | 0.06 | |
| 0.05 | 0.02 | 0.03 | |
| 0.05 | 0.01 | 0.01 |
4 Etching Technique
After high-radon exposure, the Si core received a heavy etch treatment with a mixture of 80% nitric acid, 16% hydrofluoric acid, and 4% acetic acid within a large Nalgene tub. The substrate diameter was measured to be 25.4460.001 mm prior to etching. The substrate was then placed into a PTFE basket and dunked into the acid solution for 30 seconds. Following the acid dunk, the substrate was dunked and rinsed with DI water. The substrate diameter was again measured and found to be 25.4300.001 mm, indicating that 161 was removed—much more than the 0.1 implantation depth of radon daughters.
The glass was removed from both sides of the Si core by heating it to 100 ∘C and sliding the glass away. Placing the Si core in a beaker with high-purity trichloroethylene removed the remaining wax. The Si core was then rinsed with DI water and cleaned using isopropanol, acetone, methanol, and then blown dry with nitrogen.
5 Post-etch Assay and Observed 210Pb Reduction
While the Si core sidewall was being etched, a background measurement was made with the detector unchanged except that the core was not present. After the etch was finished, the core sidewalls were again counted. Figure 6 shows the pre- and post-etch assays. Again, between post-etch runs, a background measurement was made and showed that the post-etch rate was consistent with the background rate. Though the angle was the primary focus, and rates were also measured and were also consistent with the background rate.
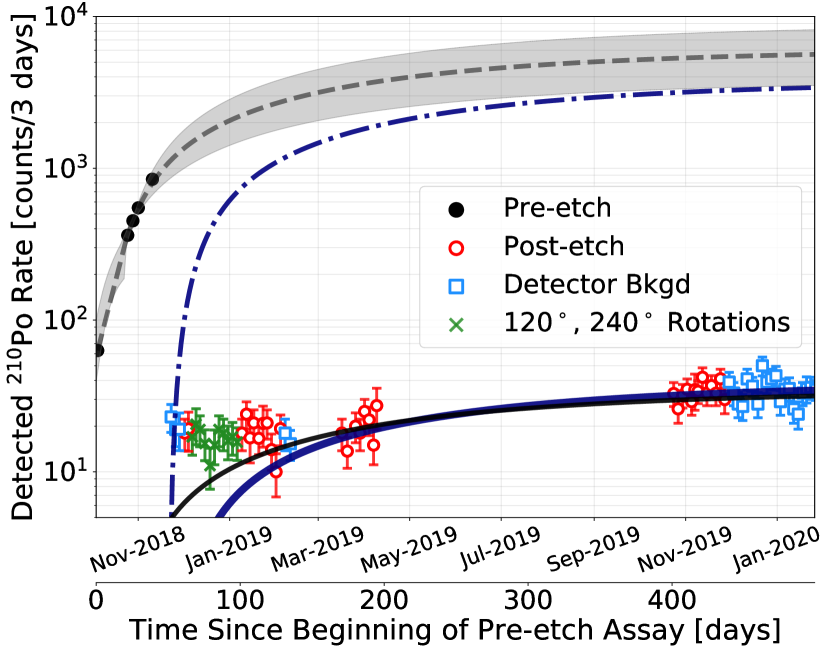
The Optimum Interval (OI) method allows a limit to be set, with or without knowledge of the background, providing the expected signal is understood [18, 19]. After etching, the expected signal is still , but scaled by a reduction factor that represents the effect of the sidewall etch. The OI method returns the reduction factor , as defined by Eq. 4, that can be stated at 90% confidence limit (C.L.). By this method, a reduction of at 90% C.L. on the 1-lower-limit 210Po rate was found, if all isotopes are removed equally.
The removal of 210Pb, 210Bi, and 210Po from the surface of Ge was similarly studied by M. Wójcik and G. Zuzel [20]. They found that 210Po (210Pb) was removed more efficiently from rougher (smoother) surfaces, by almost a factor of 10. Because the Si core sidewall assayed in this study would be considered a rough surface, 210Po was likely preferentially removed.
If 210Po was indeed preferentially removed by this etch, the expected signal would then represent 210Po growing in from the 210Pb not removed by the etch. By assuming all 210Bi and 210Po are removed, this analysis indicates, rather conservatively, a 210Pb reduction of at 90% C.L.
Though the OI method can account for knowledge of the background and would likely provide a stronger limit on reduction, the background rate has not been used. This is because it is not yet known how the background rate changes with the Si core inside the Alpha Duo detector bay. Some line-of-sight backgrounds are blocked and this would need to be better understood. In addition, the observed reduction is already sufficiently large that, for this study, additional work is unwarranted.
6 Conclusions
By comparing the 210Po rates before and after the sidewall-etching technique was performed, a reduction of at 90% C.L. was found for 210Pb. This limit assumes all 210Bi and 210Po were removed by the etch thus making the statement of 210Pb reduction conservative.
The application of this sidewall-etching technique applied to SuperCDMS SNOLAB, for example, would reduce the detector sidewall surface contamination, directly improving the experiment’s sensitivity. The technique also provides a method to salvage a detector unintentionally subjected to high rates of radon-daughter deposition.
Acknowledgements
We would like to thank Dr. Robert Calkins for his suggestions on this work.
Funding: This work was supported by the Department of Energy [grant numbers DE-SC0014036, DE-SC0017859, DE-AC02-76SF00515, and DE-SC0014223]; the National Science Foundation [grant number PHY-1506033].
References
References
- [1] H. Simgen, Radon assay and purification techniques, in: L. Miramonti, L. Pandola (Eds.), American Institute of Physics Conference Series, Vol. 1549 of American Institute of Physics Conference Series, 2013, pp. 102–107. doi:10.1063/1.4818086.
- [2] R. Bunker, Z. Ahmed, M. A. Bowles, et al., The BetaCage, an ultra-sensitive screener for surface contamination, in: L. Miramonti, L. Pandola (Eds.), Topical Workshop on Low Radioactivity Techniques: LRT 2013, Vol. 1549 of American Institute of Physics Conference Series, 2013, pp. 132–135. doi:10.1063/1.4818093.
- [3] M. Schumann, Direct detection of WIMP dark matter: concepts and status, Journal of Physics G Nuclear Physics 46 (10) (2019) 103003. arXiv:1903.03026, doi:10.1088/1361-6471/ab2ea5.
- [4] J. Cooley, P. Cushman, E. W. Hoppe, J. L. Orrell, R. W. Schnee, Low Background Materials and Assay - A Supplement to the Cosmic Frontier CF1 Summary, arXiv:1311.3311.
- [5] F. Alessandria, E. Andreotti, R. Ardito, et al., CUORE crystal validation runs: results on radioactive contamination and extrapolation to CUORE background, Astropart. Phys. 35 (2012) 839–849. doi:10.1016/j.astropartphys.2012.02.008.
- [6] M. Leung, Surface Contamination From Radon Progeny, in: B. Cleveland, R. Ford, M. Chen (Eds.), Topical Workshop on Low Radioactivity Techniques: LRT 2004., Vol. 785 of American Institute of Physics Conference Series, 2005, pp. 184–190. doi:10.1063/1.2060470.
- [7] A. Takeda for the XMASS Collaboration, Low background techniques in XMASS, in: Topical Workshop on Low Radioactivity Techniques (LRT-2010), Vol. 1338, American Institute of Physics Conference Proceedings, Sudbury, Canada, 2011, pp. 123–125.
- [8] R. Agnese, A. J. Anderson, T. Aramaki, et al., Projected sensitivity of the SuperCDMS SNOLAB experiment, Phys. Rev. D95 (8) (2017) 082002. arXiv:1610.00006, doi:10.1103/PhysRevD.95.082002.
- [9] R. Agnese, A. J. Anderson, T. Aralis, et al., Low-mass dark matter search with CDMSlite, Phys. Rev. D97 (2) (2018) 022002. doi:10.1103/PhysRevD.97.022002.
- [10] R. Agnese, A. J. Anderson, T. Aramaki, et al., New Results from the Search for Low-Mass Weakly Interacting Massive Particles with the CDMS Low Ionization Threshold Experiment, Phys. Rev. Lett.116 (7) (2016) 071301. doi:10.1103/PhysRevLett.116.071301.
- [11] R. Agnese, T. Aralis, T. Aramaki, et al., First Dark Matter Constraints from a SuperCDMS Single-Charge Sensitive Detector, Phys. Rev. Lett.121 (5) (2018) 051301. arXiv:1804.10697, doi:10.1103/PhysRevLett.121.051301.
- [12] R. K. Romani, P. L. Brink, B. Cabrera, et al., Thermal detection of single e-h pairs in a biased silicon crystal detector, Applied Physics Letters 112 (4) (2018) 043501. arXiv:1710.09335, doi:10.1063/1.5010699.
-
[13]
Pylon, Rn222 source (2020).
URL https://pylonelectronics-radon.com/ -
[14]
J. Porstendörfer,
Physical
Parameters and Dose Factors of the Radon and Thoron Decay Products,
Radiation Protection Dosimetry 94 (4) (2001) 365–373.
arXiv:http://oup.prod.sis.lan/rpd/article-pdf/94/4/365/9927483/365.pdf,
doi:10.1093/oxfordjournals.rpd.a006512.
URL https://doi.org/10.1093/oxfordjournals.rpd.a006512 - [15] E. S. Morrison, E. H. Miller, T. Frels, R. W. Schnee, J. Street, Radon Daughter Plate-out onto Teflon, in: D. L. Leonard (Ed.), Topical Workshop on Low Radioactivity Techniques: LRT 2017, American Institute of Physics Conference Series, 2017. arXiv:1708.08534.
-
[16]
Ortec,
Alpha
duo (2019).
URL https://www.ortec-online.com/products/radiochemistry-health-physics-research-industrial/alpha-spectroscopy/spectrometers/alpha-suite - [17] H. Bateman, Solution of a system of differential equations occurring in the theory of radiactive transformations, Proc. Cambridge Philos. 15 (1910) 423–427.
- [18] S. Yellin, Finding an upper limit in the presence of an unknown background, Phys. Rev. D66 (3) (2002) 032005. arXiv:physics/0203002, doi:10.1103/PhysRevD.66.032005.
- [19] S. Yellin, Extending the optimum interval method, arXiv:0709.2701.
-
[20]
M. Wójcik, G. Zuzel,
226ra, 210pb, 210bi and
210po deposition and removal from surfaces and liquids, Journal of
Radioanalytical and Nuclear Chemistry 296 (2) (2012) 639–645.
doi:10.1007/s10967-012-2180-5.
URL http://dx.doi.org/10.1007/s10967-012-2180-5