The Carnegie Supernova Project II. Observations of the intermediate-luminosity red transient SNhunt120††thanks: This paper includes data gathered with the 6.5 meter Magellan telescopes at Las Campanas Observatory, Chile.,††thanks: Photometry and spectra presented in this paper are available on WISeREP.
We present multiwavelength observations of two gap transients that were followed by the Carnegie Supernova Project-II. The observations are supplemented with data obtained by a number of different programs. Here in the first of two papers, we focus on the intermediate-luminosity red transient (ILRT) designated SNhunt120, while in a companion paper we examine the luminous red novae AT 2014ej. Our data set for SNhunt120 consists of an early optical discovery, estimated to be within three days after outburst, the subsequent optical and near-infrared broadband followup extending over a period of about two months, two visual and two near-infrared wavelength spectra, and Spitzer Space Telescope observations extending from early (28 d) to late (1155 d) phases. SNhunt120 resembles other ILRTs such as NGC 300-2008-OT and SN 2008S, and like these other ILRTs, SNhunt120 exhibits prevalent mid-infrared emission at both early and late phases. From the comparison of SNhunt120 and other ILRTs to electron-capture supernova simulations, we find that the current models underestimate the explosion kinetic energy and thereby produce synthetic light curves that overestimate the luminosity. Finally, examination of pre-outburst Hubble Space Telescope images yields no progenitor detection.
Key Words.:
star: mass loss, circumstellar matter - supernova: individual SNhunt120 (PSN J14535395+0334049, LSQ12brd)1 Introduction
The proliferation of sky surveys over the past decade has driven a dramatic increase in the discovery of transients in the “luminosity gap” between the brightest novae ( mag) and the faintest classical core-collapse supernovae (SN; peak mag). Because they resemble some type IIn supernova, but have a much fainter peak luminosity, these objects have been referred to in the past years as SN imposters (e.g., Schlegel 1990; Filippenko 1997; Van Dyk et al. 2000). However, with the discovery of a low-luminosity subclass of type IIP SNe (e.g., Pastorello et al. 2004) and an ever-increasing diversity of observed phenomena, the SN imposter nomenclature has now become obsolete, and today, SN imposters are typically associated with luminous blue variables (LBVs; Smith et al. 2011, e.g.). Gap transients have also been referred to as intermediate-luminosity optical transients (ILOTs), but we choose not to use this term to avoid confusion with intermediate-luminosity red transients (ILRTs; Bond et al. 2009, e.g.), as well as with luminous red novae (LRNe; Blagorodnova et al. 2017, e.g.). The early spectra of gap transients are often dominated by Balmer emission lines, typically with full width at half-maximum (FWHM) emission line velocities ranging from 200-300 km s-1 to 1000 km s-1. This can be taken as evidence for the presence of a preexisting circumstellar medium (CSM) around the progenitor of these transients.
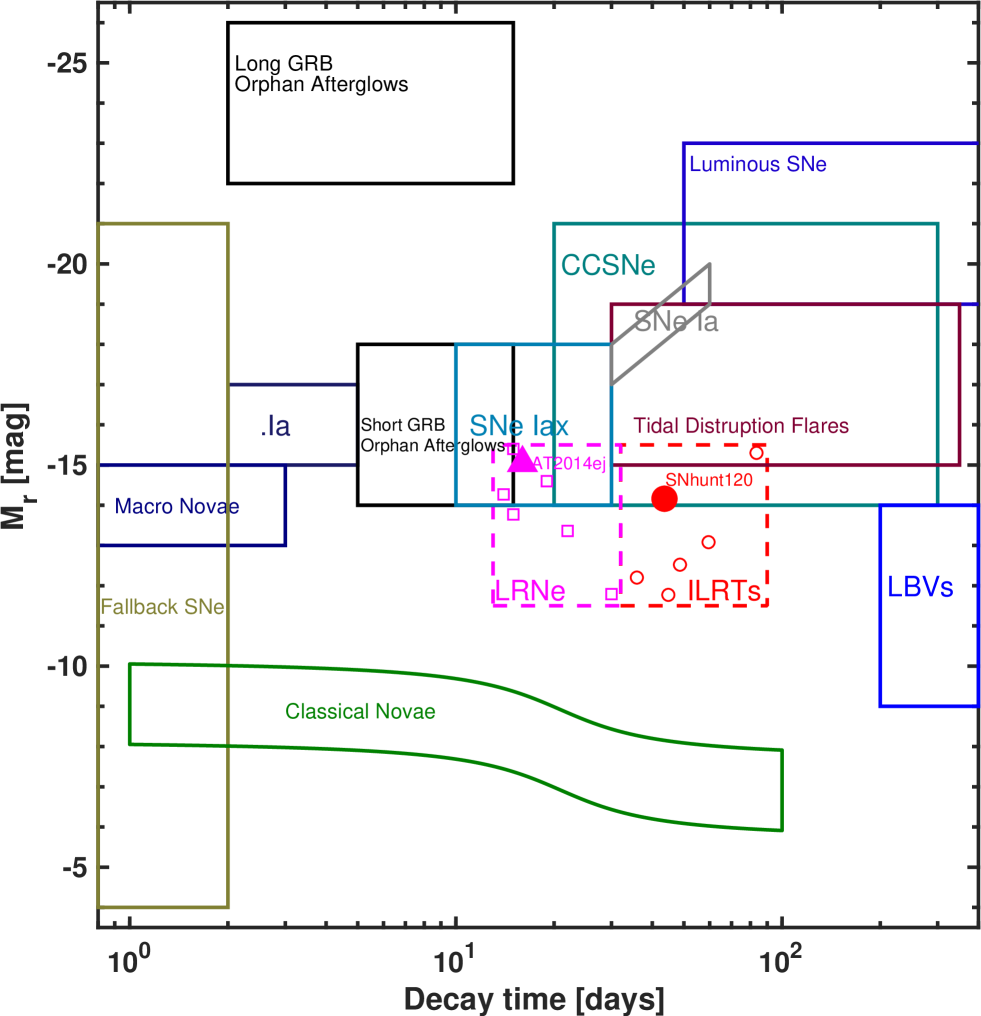
Evidence now indicates that different observational subtypes of gap transients are linked to different progenitors (see Kulkarni & Kasliwal 2009; Kochanek et al. 2012b; Kashi & Soker 2016; Pastorello & Fraser 2019, for concise reviews). In Fig. 1 the regions within the peak absolute magnitude versus decay-time parameter space that harbor the different flavors of gap transients are indicated, including LBVs, ILRTs, and LRNe. The figure also includes regions of other known transient populations. LBVs are stars that undergo giant eruptions and display erratic variability that in some cases may occur immediately prior to a star exploding as a core-collapse supernova. ILRTs are commonly linked to super asymptotic giant branch (S-AGB) stars (Prieto et al. 2008; Thompson et al. 2009; Botticella et al. 2009; Prieto et al. 2009; Kochanek 2011; Adams et al. 2016; Doherty et al. 2017) that undergo a weak terminal explosion induced by an electron-capture collapse (Miyaji et al. 1980; Nomoto 1984; Miyaji & Nomoto 1987; Hashimoto et al. 1993; Kitaura et al. 2006; Poelarends et al. 2008). Other models have also been presented to account for ILRTs. For example, it has been proposed that ILRTs are associated with moderately massive ( 20 ) stars embedded in a dusty environment that experience outbursts driven by super-Eddington winds (e.g., Smith et al. 2009; Humphreys et al. 2011). Alternatively, Kashi et al. (2010) presented a model for ILRTs being powered by the gravitational energy release following the accretion of matter from an AGB star onto a main-sequence or more compact companion.
Finally, LRNe may be linked to massive contact binary systems (e.g., Blagorodnova et al. 2017) that undergo a common-envelope ejection while the two stars merge (Smith et al. 2016; Lipunov et al. 2017; Mauerhan et al. 2018). This scenario is the massive star version of common-envelope ejections associated with less massive stars producing red novae with double-peak light curves. Today it remains a matter of open debate whether the merger process driving LRNe culminates in the coalesce of a single star, a weak SN explosion, or even both, depending on the masses and pre-SN mass-loss histories (see Pastorello et al. 2019, for a detailed discussion).
Only a relatively small number of gap transients have been studied in the literature, therefore we present in two papers a detailed study of two gap transients observed by the Carnegie Supernova Project (CSP-II; Phillips et al. 2019). These objects, designated SNhunt120 and AT 2014ej, are both plotted in Fig. 1 along with the handful of other well-observed LRNe and ILRTs from the literature. Inspection of the figure reveals that SNhunt120 is located within the ILRT gap transient region, and AT 2014ej is located within the LRNe gap transient region.
Because so many data have been obtained for the two objects and because our analysis is extended, we elected to present our study of SNhunt120 and AT 2014ej in separate papers. Here in Paper 1 we focus on SNhunt120, while in the companion paper (Stritzinger et al. 2020c; hereafter Paper 2) we focus on AT 2014ej. In addition to CSP-II data presented here in Paper 1, we also make use of early data obtained by the La Silla-Quest (LSQ) low-redshift supernova survey (Baltay et al. 2013) to estimate the outburst time of SNhunt120. The analysis we present below also makes use of optical photometry previously presented by Bond (2018), two-channel Spitzer Space Telescope images spread over 1000 days, and pre-explosion Hubble Space Telescope (HST) images of the host galaxy NGC 5775.
2 SNhunt120
2.1 Discovery, distance, and reddening
SNhunt120, also known as PSN J14535950334049 and LSQ12brd, was discovered by the Catalina Sky Survey (CSS) on 27.49 March 2012 UT (Howerton et al. 2012) in NGC 5775 with an apparent -band magnitude mag. The transient was not detected in CSS images taken on 17.39 March 2012 UT down to a limiting magnitude . We have also recovered the transient in an LSQ image obtained on 27.30 March 2012 UT with an apparent -band magnitude of 18.95.
A spectrum obtained on 28.16 March 2012 UT with the 2.5m du Pont (WFCCD) telescope at Las Campanas Observatory (LCO), reported by Howerton et al. (2012), exhibits Balmer emission lines and both allowed and forbidden Ca ii features. Furthermore, the H 4861 and H 6563 Balmer lines are characterized by FWHM velocities of km s-1. These characteristics, along with the fact that the transient reached an absolute -band magnitude mag, led Howerton et al. (2012) to identify it as a possible gap transient similar to SN 2008S (Botticella et al. 2009) and NGC 300-2008-OT (Bond et al. 2009; Humphreys et al. 2011).
Berger et al. (2012) reported on the possible detection of a source at the position of this gap transient in a pre-explosion archival HST (+ ACS/F625W) image of NGC 5775, measuring an apparent magnitude of 25.5-26, and provided corresponding absolute magnitudes of to , assuming a distance of 31 Mpc. This is larger than the value we adopt. For our distance value (see below), the absolute magnitude would be between 4.7 and 5.2 mag.
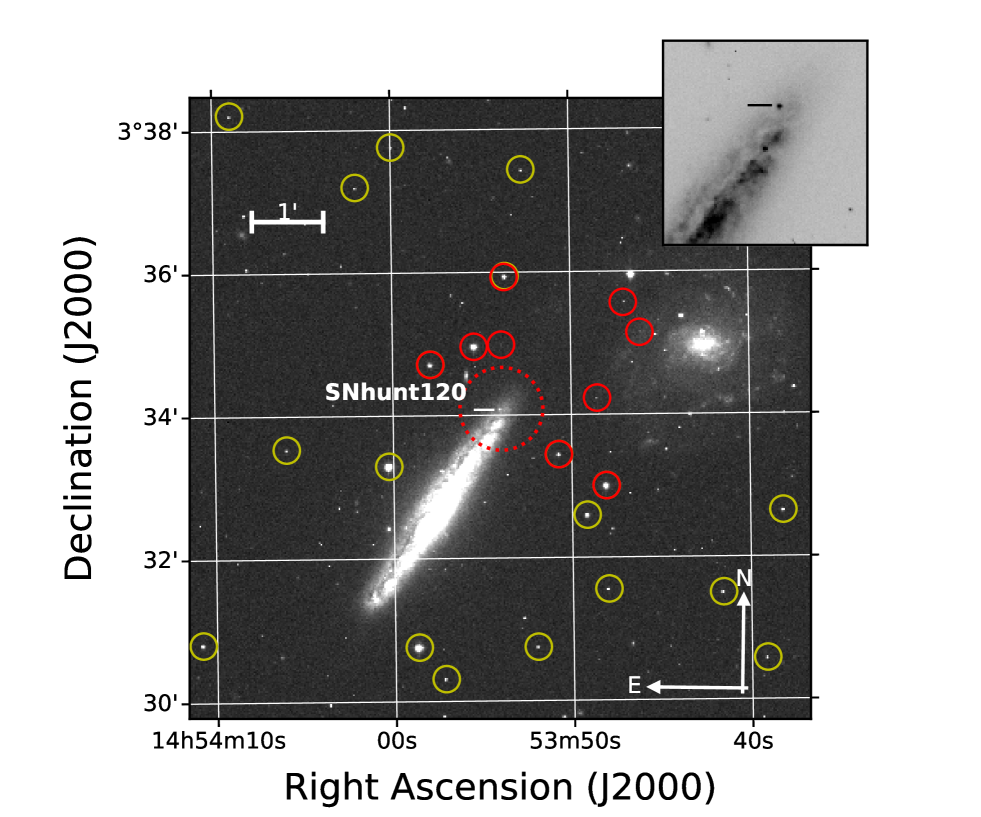
With J2000 coordinates of and , SNhunt120 was located 55 west and 85 north from the core of its host NGC 5775 (see Fig. 2 for a finding chart). NGC 5775 is an edge-on SBc spiral galaxy and is a member of the Virgo cluster. The NASA/IPAC Extragalactic Database (NED)111http://ned.ipac.caltech.edu lists its heliocentric redshift as and also lists over half a dozen different Tully-Fisher distances from the literature, ranging from 15.9 to 27.0 Mpc (distance moduli from 31.00.40 mag to 32.150.40 mag). However, as NGC 5775 is a member of the Virgo cluster, we opt to use the more precise distance modulus to Virgo of 31.030.14 mag, which is based on a Cepheid calibration of the Tully-Fisher relation as presented by Tully et al. (2016).
In Appendix A we compute the host redshift and metallicity using a spectrum of NGC 5775 obtained by the Sloan Digital Sky Survey, while Appendix B contains details on the Galactic reddening in the direction of SNhunt120 and our estimate of its host-galaxy reddening. In short, in the work presented below, we adopted a total visual extinction of mag.
2.2 Observations
The CSP-II obtained 22 epochs of -band images of SNhunt120 with the Swope (+ CCD camera) telescope located at LCO extending between 2 to 46 days (d) past first detection. Two epochs of -band NIR photometry were obtained with the du Pont (+ RetroCam; Hamuy et al. 2006) telescope on 16 d and 37 d, while two epochs of -band photometry were obtained nearly a day apart on 153 d and 154 d. A single -band observation was also obtained a day later. The raw data were reduced using standard CSP-I pipelines as described in detail by Krisciunas et al. (2017) and references therein. Prior to computing photometry, deep host-galaxy template images were subtracted from all of the optical science images, but not for the NIR science images because we lack template images.
Photometry of SNhunt120 was computed relative to a local sequence of stars calibrated with respect to optical and NIR standard star fields observed over a minimum of three photometric nights. The optical photometry of these stars in the “standard” system is presented in Table 1, while NIR photometry of a smaller set of stars in the standard system is given in Table 2. Finally, our optical and NIR photometry of SNhunt120 in the CSP-II ‘natural’ photometric systems are listed in Table LABEL:tab:SNhunt120_optphot and Table 4, respectively.
The La Silla Quest (LSQ) survey observed NGC 5775 multiple times over a period of several years, and we are able to identify SNhunt120 in 17 epochs of LSQ -band imaging. Prior to computing photometry of SNhunt120 from these images, a deep galaxy template image was constructed from a series of 15 LSQ images obtained prior to discovery. After subtracting the template image from the science images, point spread function (PSF) fitting photometry of SNhunt120 was computed relative to the -band magnitude of a single bright star in the field of NGC 5775, which is calibrated by the CSP-II data and designated with the ID of 3 (see below). Following Contreras et al. (2018, see their Fig. 23), PSF photometry was computed from the LSQ -band images and calibrated relative to the Swope natural -band photometric system. The LSQ photometry is listed in Table 5.
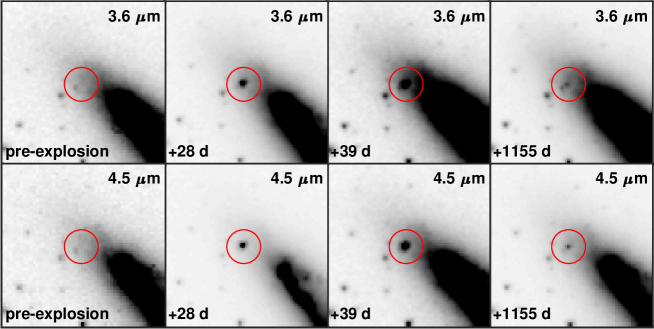
A search of the Spitzer data archive reveals images were obtained of SNhunt120 over several epochs with the 3.6 m and 4.5 m channels. Specifically, the transient was detected during two early epochs (28 d and 39 d), and also at late times on 1155 d. Fully reduced stacked images were downloaded from the Spitzer archive. PSF photometry was computed with a pipeline developed in Matlab, and the results are listed in Table 6. These fluxes are used below to construct spectral energy distributions (SEDs) for SNhunt120 extending from the atmospheric cutoff out to 4.5 m.
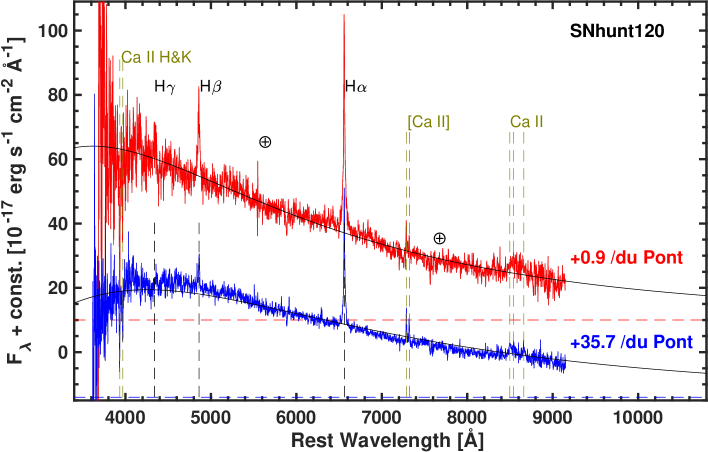
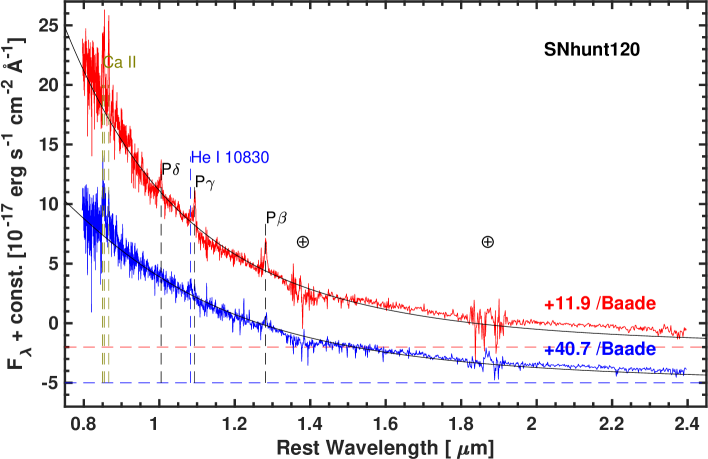
Turning to spectroscopy of SNhunt120, two epochs of visual wavelength observations are presented. This includes the classification spectrum and a followup spectrum taken by the CSP-II. These are complemented with two epochs of NIR spectroscopy also obtained by the CSP-II, which to our knowledge represent the first NIR spectra published of an ILRT. A summary of these observations is provided in the log of spectroscopic observations in Table 7. The visual wavelength spectra were obtained with the du Pont ( WFCCD) telescope on 0.9 d and 35.7 d post discovery, while the NIR spectra were taken with the Magellan Baade ( FIRE) telescope on 11.9 d and 40.7 d. The optical data were reduced following standard methods as described in Hamuy et al. (2006) and Krisciunas et al. (2017) and the NIR reductions following the prescription of Hsiao et al. (2019).
3 Results
3.1 Photometry, explosion epoch, intrinsic broadband colors, and spectral energy distributions
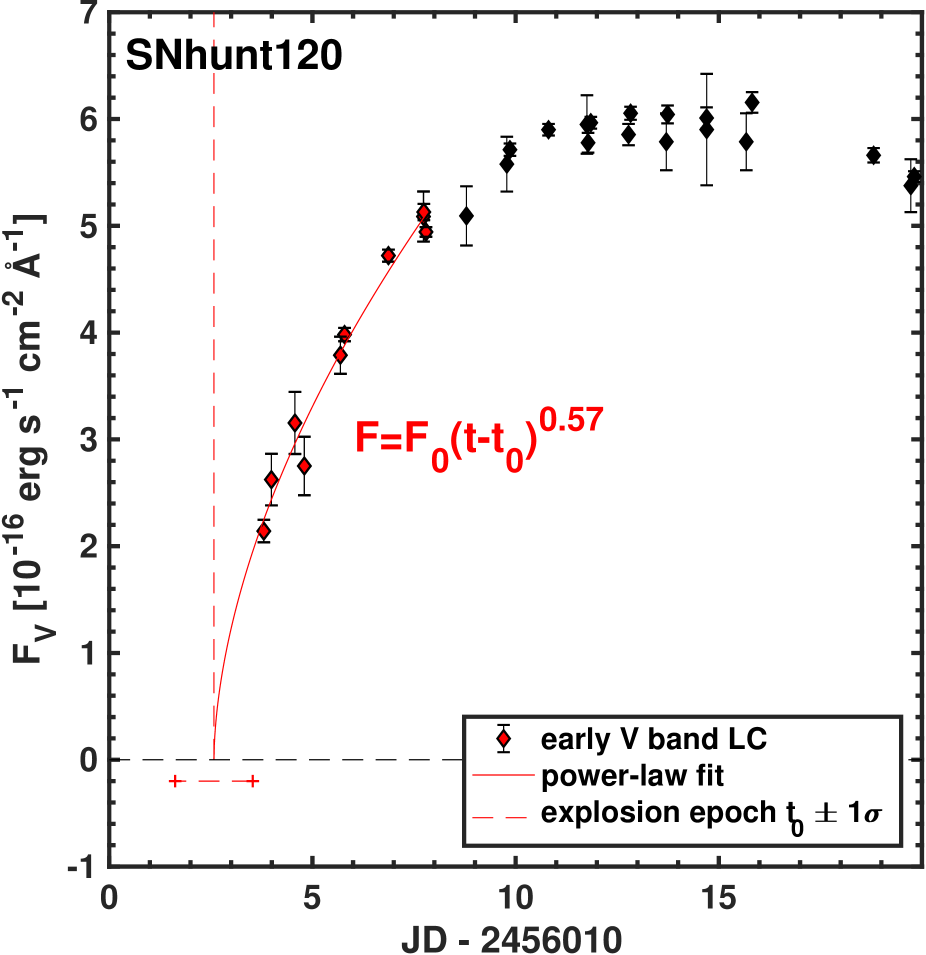
First we examine the discovery and early followup photometry of SNhunt120 obtained by CSP-II, LSQ, CSS, and Bond (2018) and plotted in Fig. 3. Overplotted on the photometry is the best-fit power-law function fit to the first six epochs of observations, characterized by a power-law index of . Extrapolating to zero flux provides an explosion epoch on JD–, which is days prior to the first LSQ detection.
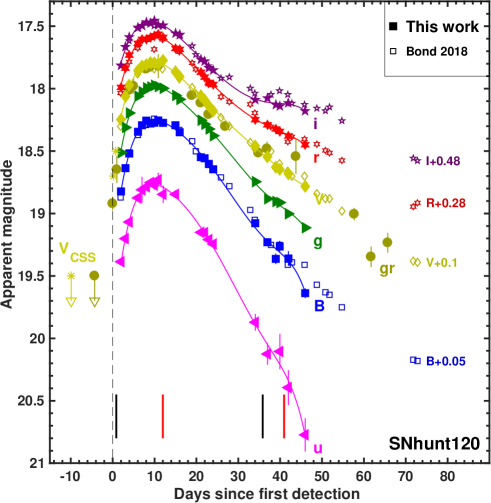
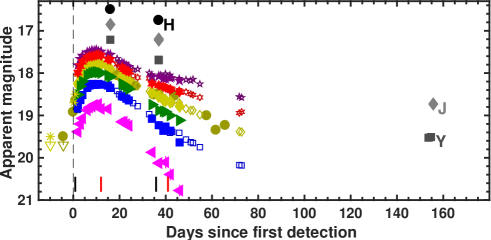
Now we proceed to examine the full set of broadband photometry obtained for SNhunt120. Optical () and NIR () light curves of SNhunt120 are plotted in Fig. 4. The optical light curves of SNhunt120 exhibit a 0.5 mag rise to maximum over the first week of evolution covered by our observations. Upon reaching maximum, the optical light curves declined by 1.0 mag over the period of a month.
At maximum, SNhunt120 reached an apparent magnitude of mag, which when corrected for the adopted extinction using a standard reddening law and distance corresponds to an absolute magnitude of 0.29 mag. Here the accompanying uncertainty is computed by adding in quadrature the uncertainties on and on the adopted distance. A summary of peak apparent and absolute peak magnitudes for each of the optical bands is listed in Table 8. The peaks were obtained by fitting low-order polynomials to the light curves, and these polynomials are plotted in Fig. 4. Because the reddening estimate is uncertain, peak magnitudes are listed with and without host-reddening corrections. Inspection of the values listed in Table 8 indicates that the optical light curves all peaked within a day of each other and that the various peak absolute magnitudes exhibit mag in scatter, with the band being the faintest (i.e., mag) and the band the brightest (i.e., mag).
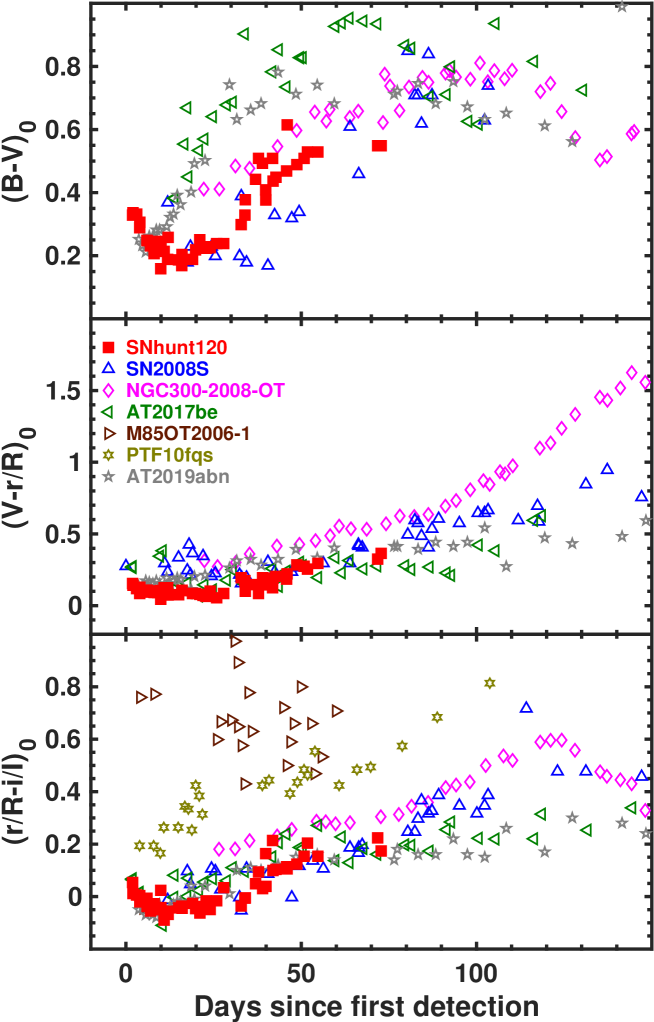
We plot in Fig. 5 the intrinsic , , and broadband colors of SNhunt120. Also shown are the intrinsic broadband colors of the well-observed ILRTs M85-2006-OT1 (Kulkarni et al. 2007; Pastorello et al. 2007), SN 2008S (Botticella et al. 2009), NGC 300-2008-OT1 (Bond et al. 2009), PTF10fqs (Kasliwal et al. 2011), AT 2017be (Cai et al. 2018), and AT 2019abn (Jencson et al. 2019; Williams et al. 2020). The photometry of SNhunt120, M85-OT2006-1, SN 2008S, NGC 300-2008-OT1, PTF10fqs, AT 2017be, and AT 2019abn were corrected for reddening by adopting the values listed in Table 9. The host extinction of SNhunt120, as discussed in Appendix B, was assumed to be mag in order to match the color curves of the bluest objects of the comparison sample. Over the first days of evolution, while SNhunt120 increased in brightness, its optical colors evolved toward the blue, and this behavior is most apparent in SNhunt120 (and AT 2017be, but with larger error) among the other ILRTs, whose multiband observations started later than those for SNhunt120 (for NGC 300-2008-OT1 about 20 days after first detection, see Bond et al. 2009). Upon reaching maximum, the colors of SNhunt120 transition and evolve to the red as the object continued to expand and cool. The overall evolution of the ILRTs are similar, but PTF10fqs and M85-2006-OT1 exhibit redder and/or colors than the other objects, and the of AT 2017be is redder than SNhunt120 and the other objects.
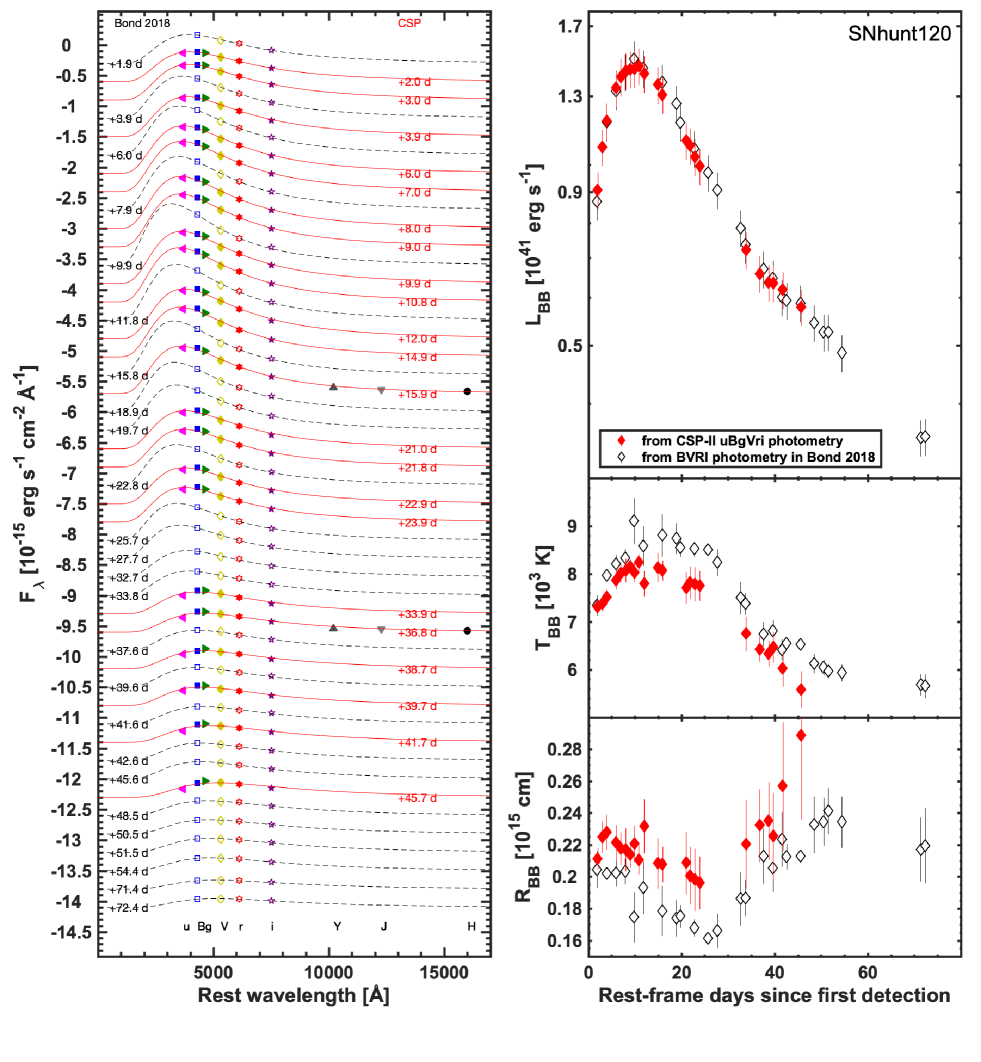
We now proceed to use the broadband photometry of SNhunt120 to construct SEDs and then fit them with blackbody (BB) functions, in order to estimate the BB luminosity (), a BB-radius () and BB-temperature () evolution over time. To do so, the broadband magnitudes in the Swope natural system were transformed to AB magnitudes (Krisciunas et al. 2017), corrected for extinction, and then converted into monochromatic fluxes at the effective wavelengths of each passband. The resulting SEDs and their corresponding best-fit BB functions are plotted in the left panel of Fig. 6, while the right panels display the temporal evolution (from top to bottom) of , , and . To complement our analysis, SEDs are also plotted (dashed lines) based on photometry published by Bond (2018). To facilitate comparison, the Bond data were shifted to match the CSP-II photometry through the use of a single additive constant for each bandpass.
Inspection of the BB parameter profiles reveals that the increases as the light curve rises to peak, with reaching a maximum value of 8700 K. Subsequently, as the luminosity declines, also declines, reaching K at 50 d, whereupon it follows a plateau. At early times, the BB radius is about 2.01014 cm and declines until 30 d, whereupon it increases over a three-week period before settling onto a plateau phase. The comparison between the bolometric quantities derived from the CSP-II data (red diamonds) and those from the Bond data (black empty diamonds), reveal the effect of including band in the SEDs, which is only available in the CSP-II data. The luminosity is effectively identical, but the temperature is slightly overestimated by 500–1000 K when the band is excluded.
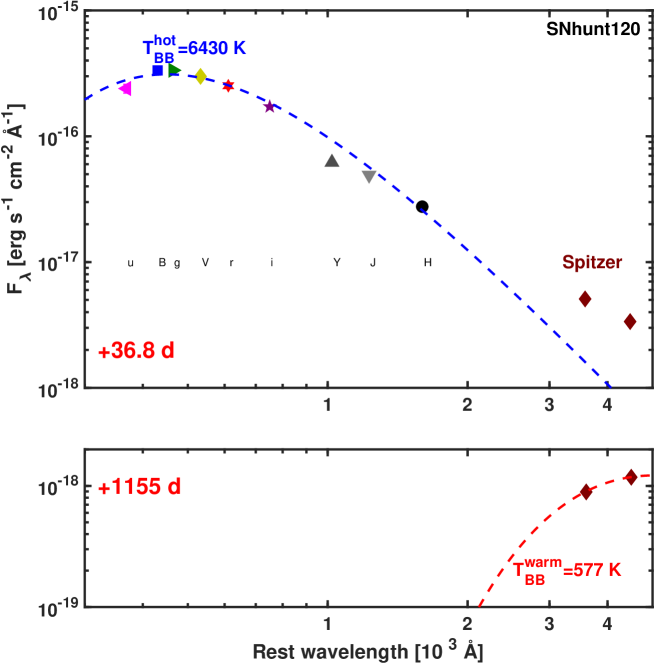
Farther redward, beyond the optical and NIR wavelengths, we also consider the two-channel Spitzer imaging shown in Fig .7 (top panel). Through linear interpolation of the corresponding photometry, we obtain a measure of the mid-infrared (MIR) brightness of SNhunt120 on 36.8 d, when photometry is available in all bands. Our early-time extended SED is shown in Fig. 7 (middle panel). Inspection of the SED indicates an MIR excess above the flux reproduced by a single BB fit (blue dashed line) characterized by the temperature shown in Fig. 6. This MIR excess can be reproduced by another warm BB component. However, its temperature is characterized by a large uncertainty because the flux of this warm component is far lower than that of the hot component. Finally, in the bottom panel of Fig. 7 we fit the late-phase 1155 d Spitzer photometry with a single BB component characterized by K. We note that there may be legitimate concerns in estimating and from BB fits if the underlying SED contained within the wavelength intervals sampled by the Spitzer flux points includes prominent emission or absorption features. However, these concerns are somewhat alleviated when we consider that MIR spectroscopic observations of the ILRT NGC 300-2008-OT published by Ohsawa et al. (2010) revealed an MIR SED consistent with a smooth continuum lacking prominent emission or absorption features.
3.2 Spectroscopy
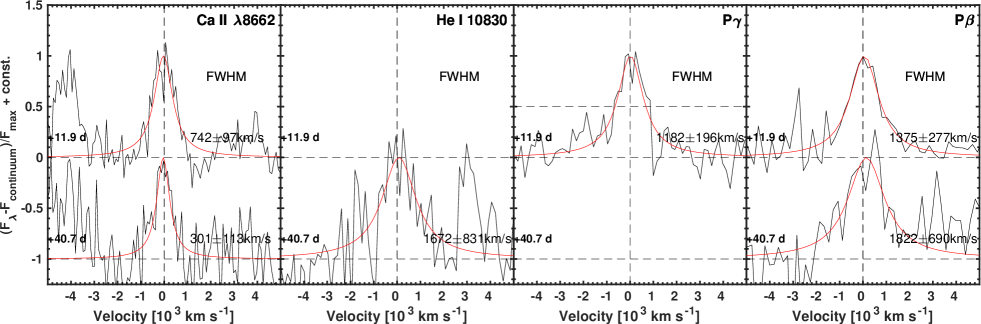
The two epochs of visual wavelength and NIR spectroscopy of SNhunt120 are plotted in Fig. 8, and their flux calibration was scaled to be consistent with the observed broadband photometry. The optical spectra consist of a continuum with superimposed Balmer emission lines (H, , and ) and the 7291, 7324 doublet. In addition, the spectra exhibit absorption features of , H&K, and the NIR triplet. The NIR spectra are to our knowledge the first of an ILRT published to date. These spectra exhibit a handful of prominent features, including emission lines arising from the Paschen series: P, P, and P. In the second NIR spectrum (+41 d), a narrow emission feature emerges just blueward of the P feature, which is likely He i 10830. None of the features exhibited in these spectra show convincing evidence of P-Cygni absorption profiles. The BB fit to the spectra in the NIR shows a possible excess above 2 m, compatible with the excess observed in Fig. 7, where we also make use of MIR photometry.
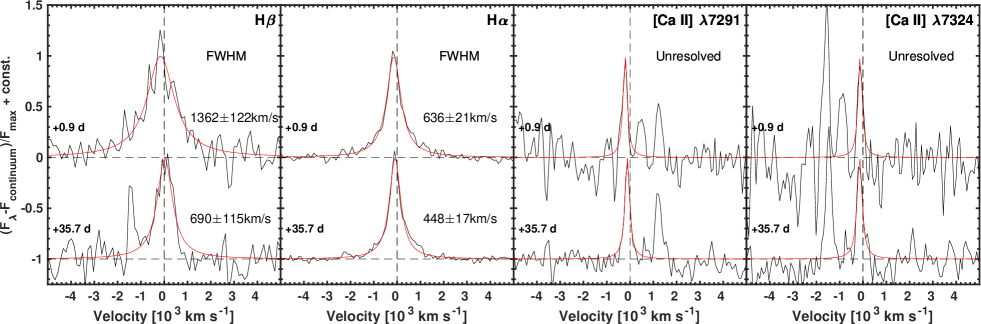
To determine the velocity associated with the gas producing the most prominent emission features, we fit the emission profiles with a Lorentzian function, yielding a measurement of the FWHM velocity (hereafter ). We corrected the measured width of the lines by the spectral resolution to infer the value of (see Sect. 4.3 in Cai et al. 2018). Some of these velocities are comparable to the instrumental resolution (400 km s-1 in the optical and 600–700 km s-1 in the NIR).
Figure 9 shows the emission features of H, H, the doublets, the NIR triplet, He i 10830, P and P. Each panel contains the data of one of these features (black lines) in velocity space, along with their best-fit Lorentzian profile (red lines). The (corrected for the spectral resolution) of each fit is listed in each panel and is also summarized in Table 10.
Comparison of the various line profile fits in the first spectrum reveals a non-negligible difference among the two prevalent Balmer lines. In particular, the feature exhibits a that is a factor of 2 higher than that measured for , while the Paschen lines exhibit velocities more consistent with . To explain this discrepancy with , we performed pseudo-equvialent-width (pEW) measurements in order to estimate the to pEW ratio. With pEW values of Å and Å for and , respectively, we obtain a to pEW ratio of 2.83. This value is fully consistent with the ratio 2.86 for case A recombination (Osterbrock 1989). The and ratios are high, indicating that the density is above the critical density for these high-excitation lines.
The observed velocity difference is likely due to the suppression of the red line wing by occultation effects commonly observed in stellar winds (see, e.g., Ignace 2016, and references therein). The line profiles are quite symmetric, which likely indicates optically thick lines in a homologous velocity field (Ignace 2016, see their Fig. 8). However, it is also possible that we see rotational broadening from material that was in Keplerian orbits with , likely related to an accretion disk. If this material were ejected by a shock, it is possible that the conservation of angular momentum would lead to conservation of angular velocity. We consider this idea plausible, but suspect that the former of optically thick lines in a homologous flow is more probable.
We conclude here with a few words on the presence of helium. The visual wavelength spectra of SNhunt120 shown in Fig. 8 lack any discernible features associated with He i lines. However, as pointed out above, we do link a feature in the 41 d NIR spectrum of SNhunt120 to He i 10830 (see Fig. 9). Evidence for He i lines was previously documented in a series of high-dispersion visual wavelength spectra of the ILRT NGC 300-2008-OT (Berger et al. 2009), therefore there is precedent for this, and He i 10830 was also documented in NIR spectra of NGC 300-2008-OT (Valerin 2019). The presence of helium might indicate that a helium-rich envelope is formed through a second dredge-up phase (see Sect. 4.2.3). However, at 40 d the is 6,000 K (see Fig. 6, right panel), which is too cool to excite He i lines, and therefore any signatures of helium are likely due to circumstellar interaction (CSI) and not necessarily due to a high helium abundance.
3.3 Progenitor constraints
Because of the distance of SNhunt120, we cannot reach the expected magnitude level of the various progenitor types, as was done, for example, with SN 2008S (e.g., Botticella et al. 2009). In particular, the low resolution of Spitzer (+ IRAC) precludes any attempt of detecting the progenitor in the MIR. We searched public archives for images obtained with ground-based telescopes, but were unable to locate any suitable NIR images; we note that UKIRT (+ WFCAM) images of NGC 5775 are too shallow to be useful.
In order to study the physics of the progenitor, we examined a set of HST (+ ACS) images taken on 21 August 2005. NGC 5775 was observed with the filter (approximately equivalent to Sloan band) for 4573 s and with the filter (6848 s total split across 12 exposures). To determine the location of SNhunt120 in these data, a series of 23 Swope -band images were used to identified 17 sources om common with the HST (+ ACS) filter image.
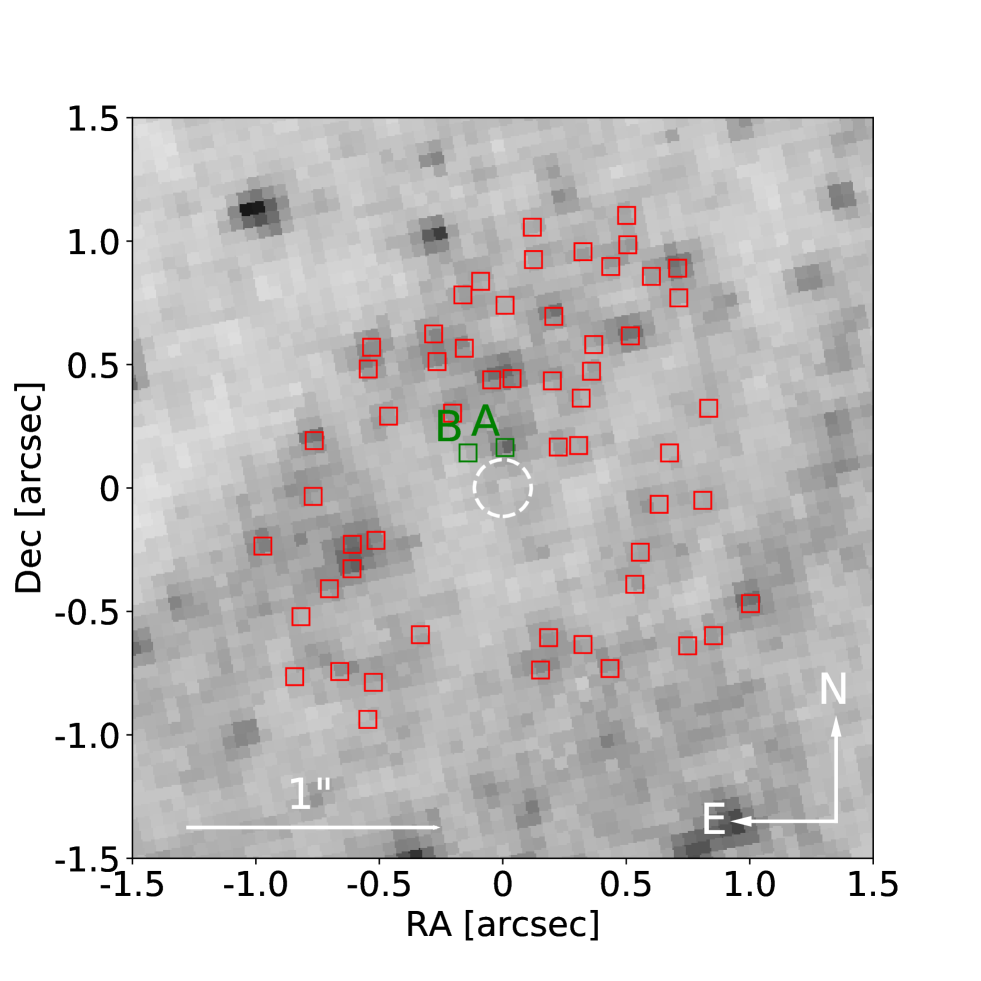
We take the average of the transformed positions of SNhunt120 as determined from each of the Swope images as our best estimate of the progenitor location in the prediscovery image, which is plotted in Fig. 10. This exercise provides an x,y pixel coordinate for SNhunt120 of and (indicated in Fig 10 with a dashed circle). Here the uncertainties reflect the standard deviation among the transformed positions.
Using DOLPHOT, a dedicated package for HST photometry222http://americano.dolphinsim.com/dolphot/, we performed PSF photometry on the F625W images. DOLPHOT detected over 50 sources above a 3-sigma significance and a single source that is somewhat consistent with the transformed location of SNhunt120. The position of sources detected with significance are indicated in Fig. 10, while the source (detected with a 17-sigma significance) nearest the expected location of SNhunt120 is also denoted with an A. Source A is offset by 3 pixels, or 015 from the center of the dashed circle and has an apparent F625W magnitude of in the HST flight system (VEGAMAGs). In addition, a lower significance (4.1-sigma) source is also detected 3.3 pixels from the center of the circle and is denoted source B, with a brightness of mag.
Finally, we considered the possibility that the progenitor of SNhunt120 was not detected in the ACS image. In order to determine the limiting magnitude, we selected a 4″ region surrounding the transient where the background and source density was comparable to that at the progenitor position. A comparison of the apparent F625W magnitudes of the extracted sources versus their signal-to-noise ratios reveals a clear peak in the density of sources at mag. This value was adopted as a conservative limiting magnitude. This limiting magnitude is shallower than the detection of source A, and it implicitly accounts for realistic possibilities such as two closely blended sources, or local areas of high background.
In the absence of a high-resolution image of the host NGC 5775, we cannot draw strong conclusions from this analysis. If the source denoted A is the progenitor, then it has an absolute magnitude of 4.130.04 mag for our adopted distance and extinction. Otherwise, we set an upper limit to the progenitor absolute magnitude of mag (where the uncertainty is due to distance and extinction). Additional circumstellar extinction would serve to mask the progenitor in the optical bands, and without NIR or MIR data, we are therefore unable to provide firm conclusions.
4 Discussion
4.1 Comparison of SNhunt120 to other intermediate-luminosity red transients
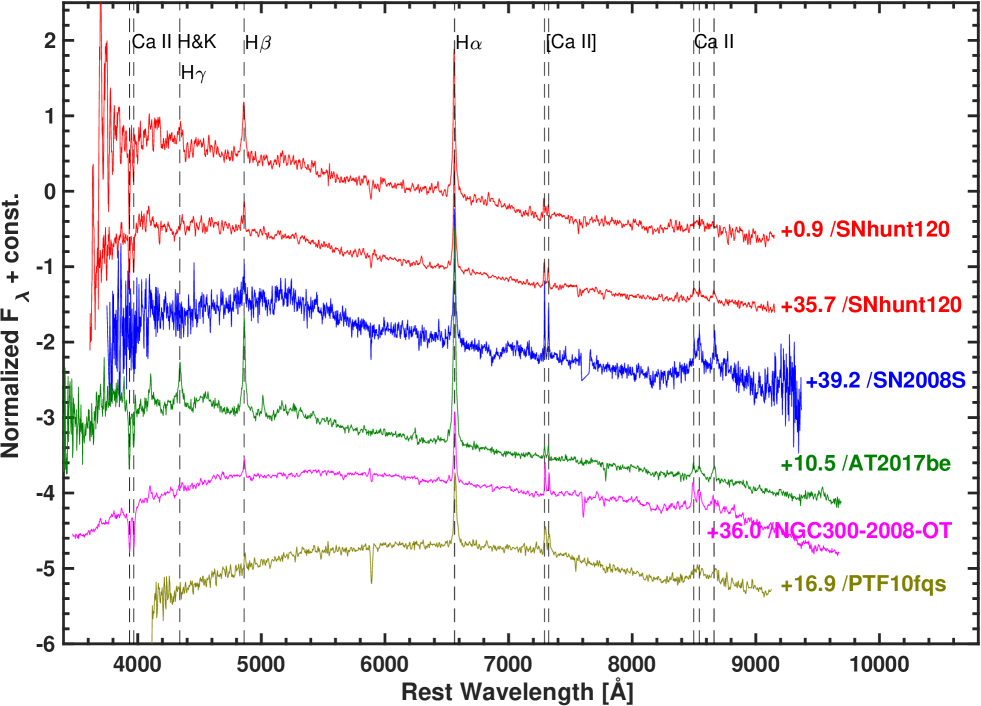
We plot in Fig. 11 the d and 35.7 d visual wavelength spectra of SNhunt120 compared to a 10.5 d spectrum of AT 2017be, a d spectrum of PTF10fqs, a previously unpublished d spectrum of NGC 300-2008-OT1, and a 39.2 d spectrum of SN 2008S. All of these spectra were corrected for the Milky Way (MW) and host reddening. The spectra of these objects are broadly similar and display the same spectral features (see Sect. 3.2) at similar velocities. Inspection of Fig. 11 reveals conspicuous H and H Balmer emission features, as well as features attributed to forbidden [Ca ii] 7291, 7324 doublet, the Ca ii NIR triplet, and Ca ii H&K. Some differences are apparent, however: PTF10fqs and NGC 300-OT-1 both exhibit redder continua than the other objects, and they also exhibit weaker features at the blue end of their spectra.
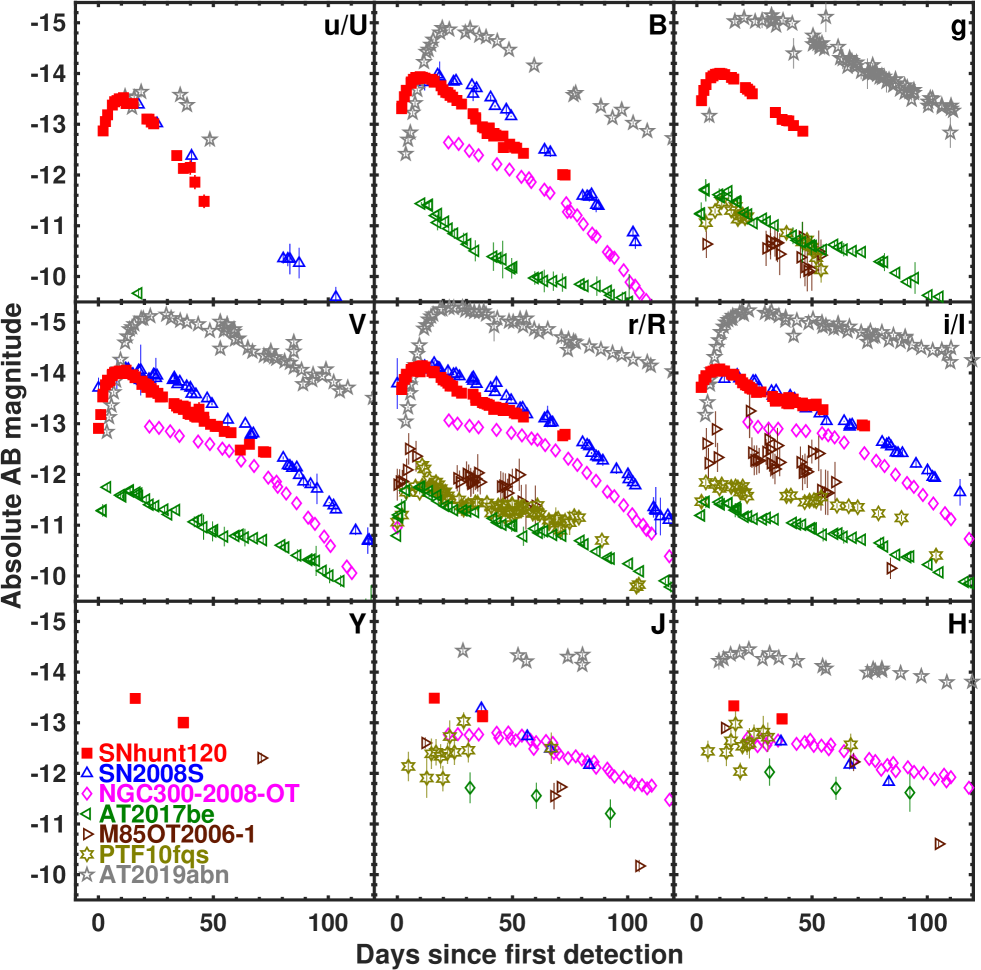
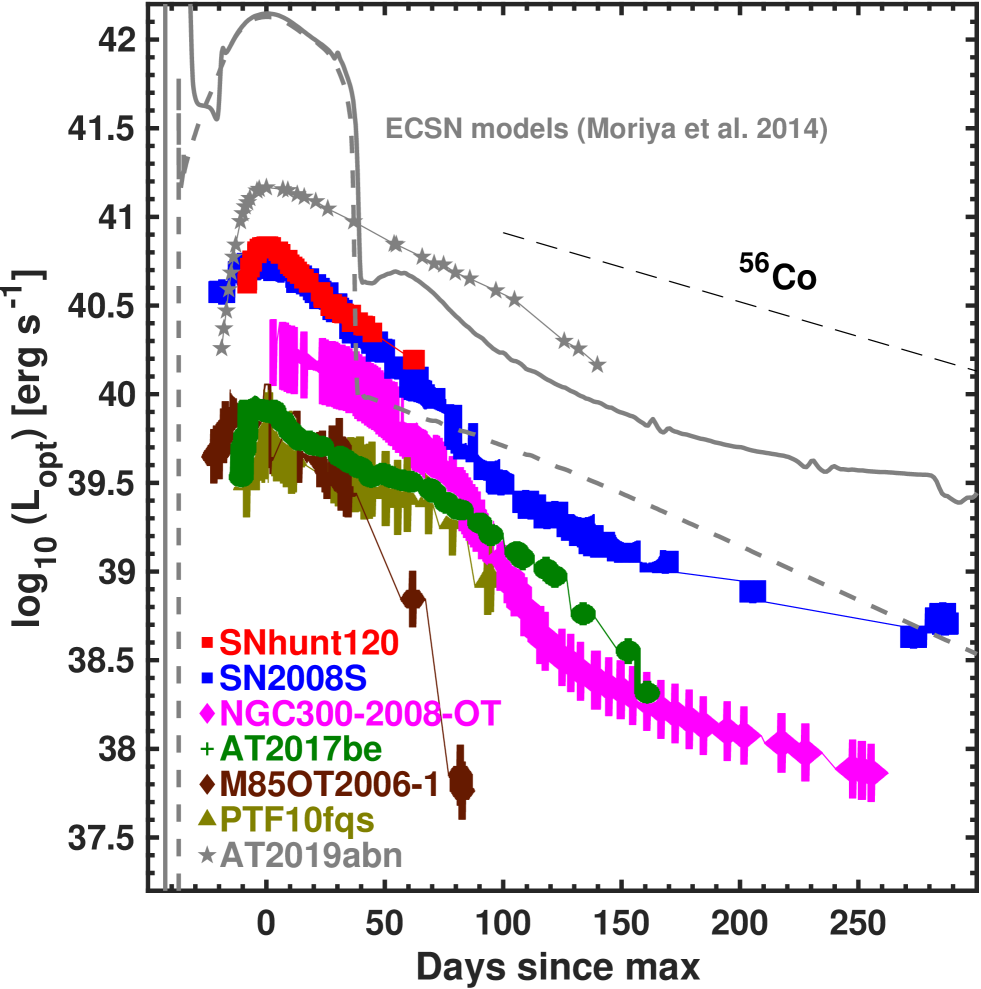
In Fig. 12 we compare the absolute magnitude light curves of SNhunt120 with those of M85 2006-OT1, SN 2008S, NGC 300-2008-OT1, PTF10fqs, AT 2017be, and AT 2019abn. The plotted photometry of these objects has been corrected for reddening and placed on the absolute flux scale adopting the values reported in Table. 9 for total color excess and distance modulus. The majority of these events exhibit a rise to a maximum value typically within their first two weeks of evolution, and overall, they also exhibit similar light-curve decline rates post maximum. Interestingly, SNhunt120 is as bright as SN 2008S in all the optical bands. Quantitatively, from comparison of SNhunt120 to other ILRTs, we find that it is 2 mag brighter than the faintest objects M85 2006-OT1, PTF10fqs and AT 2017be, and about a magnitude fainter than AT 2019abn (Jencson et al. 2019; Williams et al. 2020), the brightest ILRT observed to date.
A common characteristic of well-observed ILRTs, for example, SN 2008S (Botticella et al. 2009), NGC 300-2008-OT (Prieto et al. 2009; Kochanek 2011), and AT 2017be (Cai et al. 2018), and indeed the reason that they are so named, is their emission at red wavelengths. According to Kochanek (2011), the progenitor stars that explode and give rise to these objects might be cool red supergiants of about 9 , which means that they are some of the most massive AGB stars, and they are therefore referred to as super-AGB stars. Such stars are enshrouded in thick dusty stellar winds capable of absorbing even the X-rays produced from the SN shock breakout whose energy is then reemitted by the dust. These winds are so dense that dust can reform rapidly even when it is destroyed by the SN radiation field (Kochanek 2011). When they considered broadband observations of SN 2008S extending through MIR wavelengths, Botticella et al. (2009, see their Figs. 6 and 7) documented a double BB SED as early as 17.3 d after explosion. The first hot BB component reproduces emission over the optical wavelengths and is characterized by a BB temperature of K, while the second component reproduces the far-NIR through MIR emission and is characterized by K.
Similarly, the Spitzer MIR photometry of SNhunt120 plotted in Fig. 7 also suggests a second BB component at both early and late epochs, characterized by values of K and K, respectively. We converted the Spitzer 4.5 m flux-point values into luminosity using our adopted distance to the host galaxy NGC 5775 (see Sect. 2.1). Using the 4.5 m flux value at early times computed by interpolating from the first two Spitzer observations to 36.8 d, we obtain a value of , and on 1155 d. For comparison, at early times, SNhunt120 and SN 2008S exhibit similar MIR luminosity, while at late phases, SNhunt120 appears to be about three times brighter. (Adams et al. 2016).
Finally, we note that the BB radius evolution of SNhunt120 is rather constant, similar to that of other ILRTs (see Fig.4 in Cai et al. 2019), and is not consistent with the evolution that is typically exhibited by LRNe. In LRNe, the BB radius tends to increase significantly over time (see Paper 2).
4.2 Context with electron-capture supernovae
4.2.1 Comparison of UVOIR light curves of ILRTs to EC SN models
Massive stars with zero-age main-sequence (ZAMS) masses 10 produce degenerate Fe-rich cores that drive the collapse of their inner cores. Depending on the ZAMS mass, such stars follow one of two paths to their demise. On one path, a neutron star is formed during core collapse, and subsequently, a supernova is produced. Alternatively, certain ZAMS mass ranges may follow a second path where their gravitational potential is so great that it is able to overcome the nuclear forces within the proto-NS core and it directly collapses into a black hole. On this second path, the entirety of the star falls back onto the BH and no supernova is produced. On the other hand, less massive stars in the range between 8-10 are expected to form degenerate oxygen-neon-magnesium (ONeMg) cores as they evolve through the super asymptotic giant branch (super-AGB) phase (see Doherty et al. 2017, for a recent review). If such ONeMg-core stars approach the Chandrasekhar mass, they may experience electron-capture reactions that induce core collapse and the production of low-luminosity electron-capture (EC) SNe (Miyaji et al. 1980; Nomoto 1984; Hillebrandt et al. 1984; Miyaji & Nomoto 1987; Nomoto 1987) and neutron star remnants. An alternative hypothesis is that instead of undergoing electron-capture-induced collapse, such ONeMg-core stars could experience a partial thermonuclear explosion, leading to the formation of a ONeFe white dwarf (Jones et al. 2016, 2019; Kirsebom et al. 2019; Tauris & Janka 2019).
A number of studies have suggested a link between ILRTs and EC SNe (Botticella et al. 2009; Thompson et al. 2009; Prieto et al. 2009; Pumo et al. 2009; Kawabata et al. 2010). We examine the UVOIR light curve of SNhunt120 below in relation to the comparison sample of ILRTs and to two EC SN modeled light curves that exclude and include CSI. This is followed by Sect. 4.2.2 where we present an effort to measure the expected ZAMS mass range of stars that could be the progenitors of EC SNe, followed by Sect. 4.2.3 with a short discussion of the possibility that SNhunt120 had a binary origin.
In Fig. 13 the UVOIR light curve of SNhunt120 is compared with those of our ILRT comparison sample and to synthetic light curves calculated by Moriya et al. (2014a). These synthetic light curves combine the EC SN models presented by Tominaga et al. (2013) with radiative transfer calculations accounting for emission produced from CSI. It is reasonable to expect CSI to contribute to the overall energy emission budget in at least some super-AGB stars as they are commonly enshrouded in dense CSM (see Doherty et al. 2017). We note, however, that a number of factors influence the post-carbon burning evolution and hence the circumstellar environment, including the initial mass and the composition, the pre-explosion mass-loss history, and the core-growth efficiency (e.g., Pumo et al. 2009; Doherty et al. 2017). We therefore approach this particular comparison with caution.
Inspection of Fig. 13 reveals that consistent with the absolute-magnitude light-curve comparisons in Fig. 12, SNhunt120 lies at the bright end of the peak luminosity distribution. At peak, SNhunt120 is as bright as SN 2008S, which until the recent discovery of AT 2019abn (Jencson et al. 2019; Williams et al. 2020) was the record holder for being the brightest ILRT. Compared to the faintest ILRTs, SNhunt120 and SN 2008S are a factor of 10 more luminous, with the added caveat that there might be even fainter ILRTs that have remained undiscovered due to selection biases. These findings follow what is demonstrated in Fig. 1, which also provides a perspective on where ILRTs and LRNe classes lie within the parameter space of peak luminosity versus decay time.
The EC SN synthetic light curve models presented by Moriya et al. (2014a) that we plot in Fig. 13 (with and without CSI) reach peak luminosities of log erg s-1. This makes them approximately a factor of 15 brighter than SNhunt120 and SN 2008S. Although the explosion energy is predicted to be low (around ) in EC SNe (Kitaura et al. 2006), the early bright luminosity in the EC SN light-curve model is caused by the extended envelope and low envelope mass found in super-AGB SN progenitors (Tominaga et al. 2013). If ILRTs are actually EC SNe, the explosion energy of EC SNe needs to be or lower to have the lower observed peak luminosity (Tominaga et al. 2013). This in turn suggests that current EC SN explosion simulations overpredict the explosion energy. However, in principle, the envelope mass might be higher by as much as a factor of 2–3 than what was assumed in the Tominaga et al. (2013) and Moriya et al. (2014a) models. If this is indeed the case, we might expect the peak luminosity to be affected, and therefore this should also be considered in future modeling efforts.
4.2.2 Mass range of EC SN progenitors
The expected range of ZAMS masses of isolated stars producing EC SNe is expected to be rather confined, and depending on metallicity, to be about (Doherty et al. 2017, and references therein). However, within a ZAMS interval of roughly (Jones et al. 2013, 2014; Doherty et al. 2015; Woosley & Heger 2015), the exact location of this confined parameter space for EC SN progenitors could be shifted by , depending on the metallicity and core-convective overshooting (e.g., Siess & Pumo 2006; Siess 2007; Poelarends et al. 2008).
Assuming a Salpeter initial mass function (IMF) with isolated single stars as progenitors, we can compute the expected range of ZAMS masses for the progenitors of EC SNe given the known observed fraction of 2008S-like events relative to the rate of core-collapse SNe (10%–20%, from Thompson et al. 2009). This value is probably too high because that ILRTs and LRNe were not considered separate objects at the time of Thompson et al. (2009). If the lowest ZAMS mass to produce an EC SN is 8.5 , then the highest ZAMS mass will be between 9.1 and 9.7 , assuming a Salpeter IMF with isolated single stars as progenitors.
On the other hand, assuming that the lowest ZAMS mass of a progenitor star to produce an EC SN is 8.0 , then the highest ZAMS mass will range between . Finally, when we assume a lower ratio of EC SNe over CC SNe, for example, 5%, as discussed in Botticella et al. (2009), the range of progenitor masses would be 8.0–8.3 or 8.5–8.8 depending on the assumption on the lowest ZAMS mass.
In a similar vein, taking the mass range of the EC SN channel from Poelarends (2007) and weighting it with a Salpeter IMF, Doherty et al. (2017) estimated that the EC SN contribution to the overall core-collapse SN rate is 5%, 17%, and 38% of all type IIP SNe for metallicities and , respectively, when the maximum mass for a type IIP SN is assumed to be , based on the analysis of SN observations by Smartt (2015). In comparison with our estimate above, we find good agreement with their result for . These results are, however, in contrast to findings of Doherty et al. (2017). Specifically, when the results from Doherty et al. (2015) at these same metallicities were used, Doherty et al. (2017) calculated a far lower percentage of as low as 2–5% that all type IIP SNe progenitors will lead to an EC SNe. The main reason for the variation in frequency of EC SNe is due to the uncertainty in constraining the mass-loss rate of stars at low metallicity. Moreover, the EC SN candidates found in the local Universe (including SNhunt120) are all at approximately solar metallicity.
4.2.3 Binary origin for SNhunt120?
It has previously been demonstrated that the width of the initial mass range for producing EC SNe is smaller in single stars than in binary stars in nondegenerate systems (Podsiadlowski et al. 2004; Poelarends et al. 2008). The reason for this effect is that the presence in a binary can dramatically affect the structure of the core of a massive star at the time of core collapse. Stars above are generally expected to have smaller iron cores if they lose their envelopes in a close binary. Stars in the range of may explode as EC SNe if they are located in a close binary, while stars in wide binaries or single stars will experience a second dredge-up phase and are more likely to end their evolution as ONeMg white dwarfs. Podsiadlowski et al. (2004) argued that the minimum initial mass of a massive single star that becomes a neutron star may be as high as , while for close binaries, this mass may be as low as . These critical masses depend on the applied input physics. This includes the treatment of convection, the amount of convective overshooting, and the metallicity of the star, and will generally be lower for larger amounts of convective overshooting and lower metallicity (Podsiadlowski et al. 2004; Siess & Pumo 2006).
Although a large portion of main-sequence massive stars are found in close binaries (Sana et al. 2012), the hydrogen-rich spectra of SNhunt120 point to an isolated, or wide-orbit, progenitor star. In contrast, SN Ibn progenitors have lost their hydrogen (and also part of their helium) envelopes and are embedded in dense helium-rich CSM, giving rise to narrow helium spectral features that appear in visual wavelength spectra (e.g., Hosseinzadeh et al. 2017).
5 Conclusion
We have added to the growing populations of intermediate-luminosity red transients (ILRTs). Here in Paper I we considered SNhunt120, a gap transient discovered within days of its inferred explosion epoch that exhibits many observational properties consistent with those of other well-studied ILRTs, including an MIR excess extending from early to late phases. Reaching an -band peak magnitude of 15.05 mag and exhibiting a decay time of 44 days, SNhunt120 is one of the brightest and fastest evolving ILRTs observed to date (see Fig. 1). Furthermore, comparison of the UVOIR light curves of SNhunt120 and other ILRTs to current electron-capture SN simulations reveals that the models overpredict the explosion energy. This should be considered in future modeling efforts. In Paper 2 we present a detailed examination of the luminous red nova designated AT 2014ej.
Acknowledgements.
We thanks the referee for a very constructive report. A special thanks to David Rabinowitz and Peter Nugent for providing LSQ images of SNhunt120 (LSQ12brd). We also thank Nathan Smith for provided published spectra in electronic format of a handful of gap transients and Massimo Della Valle for a handful of interesting comments. The CSP-II has been funded by the USA’s NSF under grants AST-0306969, AST-0607438, AST-1008343, AST-1613426, AST-1613455, AST-1613472 and also in part by a Sapere Aude Level 2 grant funded by the Danish Agency for Science and Technology and Innovation (PI M.S.). M.S., F.T. and E.K. are supported by a project grant (8021-00170B) from the Independent Research Fund Denmark (IRFD). Furthermore, M.S. and S.H. are supported in part by a generous grant (13261) from VILLUM FONDEN. M.F. is supported by a Royal Society - Science Foundation Ireland University Research Fellowship. T.M.T. acknowledges an AIAS–COFUND Senior Fellowship funded by the European Union’s Horizon 2020 Research and Innovation Programme (grant agreement no 754513) and Aarhus University Research Foundation. N.B.S. acknowledges support from the NSF through grant AST-1613455, and through the Texas A&M University Mitchell/Heep/Munnerlyn Chair in Observational Astronomy. L.G. is funded by the European Union’s Horizon 2020 research and innovation programme under the Marie Skłodowska-Curie grant agreement No. 839090. This work has been partially supported by the Spanish grant PGC2018-095317-B-C21 within the European Funds for Regional Development (FEDER). Support for J.L.P. is provided in part by FONDECYT through the grant 1191038 and by the Ministry of Economy, Development, and Tourism’s Millennium Science Initiative through grant IC120009, awarded to The Millennium Institute of Astrophysics, MAS. M.L.P. is partially supported by a “Linea 2” project (ID 55722062134) of the Catania University. This research has made use of the NASA/IPAC Extragalactic Database (NED), which is operated by the Jet Propulsion Laboratory, California Institute of Technology, under contract with the National Aeronautics and Space Administration. We acknowledge the usage of the HyperLeda database.References
- Adams et al. (2016) Adams, S. M., Kochanek, C. S., Prieto, J. L., et al. 2016, MNRAS, 460, 1645
- Baltay et al. (2013) Baltay, C., Rabinowitz, D., Hadjiyska, E., et al. 2013, PASP, 125, 683
- Berger et al. (2012) Berger, E., Marion, G. H., Hsiao, E., Foley, R., & Chornock, R. 2012, The Astronomer’s Telegram, 4009
- Berger et al. (2009) Berger, E., Soderberg, A. M., Chevalier, R. A., et al. 2009, ApJ, 699, 1850
- Blagorodnova et al. (2017) Blagorodnova, N., Kotak, R., Polshaw, J., et al. 2017, ApJ, 834, 107
- Bond (2018) Bond, H. E. 2018, Research Notes of the American Astronomical Society, 2, 176
- Bond et al. (2009) Bond, H. E., Bedin, L. R., Bonanos, A. Z., et al. 2009, ApJ, 695, L154
- Botticella et al. (2009) Botticella, M. T., Pastorello, A., Smartt, S. J., et al. 2009, MNRAS, 398, 1041
- Cai et al. (2018) Cai, Y. Z., Pastorello, A., Fraser, M., et al. 2018, MNRAS, 480, 3424
- Cai et al. (2019) Cai, Y.-Z., Pastorello, A., Fraser, M., et al. 2019, arXiv e-prints, arXiv:1909.13147
- Cid Fernandes et al. (2005) Cid Fernandes, R., Mateus, A., Sodré, L., Stasińska, G., & Gomes, J. M. 2005, MNRAS, 358, 363
- Contreras et al. (2018) Contreras, C., Phillips, M. M., Burns, C. R., et al. 2018, ApJ, 859, 24
- Doherty et al. (2017) Doherty, C. L., Gil-Pons, P., Siess, L., & Lattanzio, J. C. 2017, PASA, 34, e056
- Doherty et al. (2015) Doherty, C. L., Gil-Pons, P., Siess, L., Lattanzio, J. C., & Lau, H. H. B. 2015, MNRAS, 446, 2599
- Filippenko (1997) Filippenko, A. V. 1997, ARA&A, 35, 309
- Fitzpatrick (1999) Fitzpatrick, E. L. 1999, PASP, 111, 63
- Hamuy et al. (2006) Hamuy, M., Folatelli, G., Morrell, N. I., et al. 2006, PASP, 118, 2
- Hashimoto et al. (1993) Hashimoto, M., Iwamoto, K., & Nomoto, K. 1993, ApJ, 414, L105
- Hillebrandt et al. (1984) Hillebrandt, W., Nomoto, K., & Wolff, R. G. 1984, A&A, 133, 175
- Hosseinzadeh et al. (2017) Hosseinzadeh, G., Arcavi, I., Valenti, S., et al. 2017, ApJ, 836, 158
- Howerton et al. (2012) Howerton, S., Prieto, J., Drake, A. J., et al. 2012, The Astronomer’s Telegram, 4004
- Hsiao et al. (2019) Hsiao, E. Y., Phillips, M. M., Marion, G. H., et al. 2019, PASP, 131, 014002
- Humphreys et al. (2011) Humphreys, R. M., Bond, H. E., Bedin, L. R., et al. 2011, ApJ, 743, 118
- Ignace (2016) Ignace, R. 2016, Advances in Space Research, 58, 694
- Jencson et al. (2019) Jencson, J. E., Adams, S. M., Bond, H. E., et al. 2019, ApJ, 880, L20
- Jones et al. (2014) Jones, S., Hirschi, R., & Nomoto, K. 2014, ApJ, 797, 83
- Jones et al. (2013) Jones, S., Hirschi, R., Nomoto, K., et al. 2013, ApJ, 772, 150
- Jones et al. (2019) Jones, S., Röpke, F. K., Fryer, C., et al. 2019, A&A, 622, A74
- Jones et al. (2016) Jones, S., Röpke, F. K., Pakmor, R., et al. 2016, A&A, 593, A72
- Kashi et al. (2010) Kashi, A., Frankowski, A., & Soker, N. 2010, ApJ, 709, L11
- Kashi & Soker (2016) Kashi, A. & Soker, N. 2016, Research in Astronomy and Astrophysics, 16, 99
- Kasliwal (2011) Kasliwal, M. M. 2011, PhD thesis, California Institute of Technology
- Kasliwal et al. (2011) Kasliwal, M. M., Kulkarni, S. R., Arcavi, I., et al. 2011, ApJ, 730, 134
- Kawabata et al. (2010) Kawabata, K. S., Maeda, K., Nomoto, K., et al. 2010, Nature, 465, 326
- Kirsebom et al. (2019) Kirsebom, O. S., Jones, S., Strömberg, D. F., et al. 2019, arXiv e-prints, arXiv:1905.09407
- Kitaura et al. (2006) Kitaura, F. S., Janka, H.-T., & Hillebrandt, W. 2006, A&A, 450, 345
- Kochanek (2011) Kochanek, C. S. 2011, ApJ, 741, 37
- Kochanek et al. (2012a) Kochanek, C. S., Khan, R., & Dai, X. 2012a, ApJ, 759, 20
- Kochanek et al. (2012b) Kochanek, C. S., Szczygieł, D. M., & Stanek, K. Z. 2012b, ApJ, 758, 142
- Krisciunas et al. (2017) Krisciunas, K., Contreras, C., Burns, C. R., et al. 2017, AJ, 154, 211
- Kulkarni & Kasliwal (2009) Kulkarni, S. & Kasliwal, M. M. 2009, in Astrophysics with All-Sky X-Ray Observations, ed. N. Kawai, T. Mihara, M. Kohama, & M. Suzuki, 312
- Kulkarni et al. (2007) Kulkarni, S. R., Ofek, E. O., Rau, A., et al. 2007, Nature, 447, 458
- Lipunov et al. (2017) Lipunov, V. M., Blinnikov, S., Gorbovskoy, E., et al. 2017, MNRAS, 470, 2339
- López Fernández et al. (2016) López Fernández, R., Cid Fernandes, R., González Delgado, R. M., et al. 2016, MNRAS, 458, 184
- Makarov et al. (2014) Makarov, D., Prugniel, P., Terekhova, N., Courtois, H., & Vauglin, I. 2014, A&A, 570, A13
- Mauerhan et al. (2018) Mauerhan, J. C., Van Dyk, S. D., Johansson, J., et al. 2018, MNRAS, 473, 3765
- Miyaji & Nomoto (1987) Miyaji, S. & Nomoto, K. 1987, ApJ, 318, 307
- Miyaji et al. (1980) Miyaji, S., Nomoto, K., Yokoi, K., & Sugimoto, D. 1980, PASJ, 32, 303
- Moriya et al. (2014a) Moriya, T. J., Tominaga, N., Langer, N., et al. 2014a, A&A, 569, A57
- Moriya et al. (2014b) Moriya, T. J., Tominaga, N., Langer, N., et al. 2014b, A&A, 569, A57
- Nomoto (1984) Nomoto, K. 1984, ApJ, 277, 791
- Nomoto (1987) Nomoto, K. 1987, ApJ, 322, 206
- Ohsawa et al. (2010) Ohsawa, R., Sakon, I., Onaka, T., et al. 2010, ApJ, 718, 1456
- Osterbrock (1989) Osterbrock, D. 1989, Astrophysics of Gaseous Nebulae and Active Galactic Nuclei (Mill Valley, CA: University Science Books)
- Pastorello et al. (2007) Pastorello, A., Della Valle, M., Smartt, S., et al. 2007, Nature, 449, E1
- Pastorello & Fraser (2019) Pastorello, A. & Fraser, M. 2019, Nature Astronomy, 3, 676
- Pastorello et al. (2019) Pastorello, A., Mason, E., Taubenberger, S., et al. 2019, A&A, 630, A75
- Pastorello et al. (2004) Pastorello, A., Zampieri, L., Turatto, M., et al. 2004, MNRAS, 347, 74
- Pettini & Pagel (2004) Pettini, M. & Pagel, B. E. J. 2004, MNRAS, 348, L59
- Phillips et al. (2019) Phillips, M. M., Contreras, C., Hsiao, E. Y., et al. 2019, PASP, 131, 014001
- Phillips et al. (2013) Phillips, M. M., Simon, J. D., Morrell, N., et al. 2013, ApJ, 779, 38
- Pilyugin et al. (2004) Pilyugin, L. S., Vílchez, J. M., & Contini, T. 2004, A&A, 425, 849
- Podsiadlowski et al. (2004) Podsiadlowski, P., Langer, N., Poelarends, A. J. T., et al. 2004, ApJ, 612, 1044
- Poelarends (2007) Poelarends, A. J. T. 2007, PhD thesis, Utrecht University
- Poelarends et al. (2008) Poelarends, A. J. T., Herwig, F., Langer, N., & Heger, A. 2008, ApJ, 675, 614
- Prieto et al. (2008) Prieto, J. L., Kistler, M. D., Thompson, T. A., et al. 2008, ApJ, 681, L9
- Prieto et al. (2009) Prieto, J. L., Sellgren, K., Thompson, T. A., & Kochanek, C. S. 2009, ApJ, 705, 1425
- Pumo et al. (2009) Pumo, M. L., Turatto, M., Botticella, M. T., et al. 2009, ApJ, 705, L138
- Rau et al. (2009) Rau, A., Kulkarni, S. R., Law, N. M., et al. 2009, PASP, 121, 1334
- Sana et al. (2012) Sana, H., de Mink, S. E., de Koter, A., et al. 2012, Science, 337, 444
- Schlafly & Finkbeiner (2011) Schlafly, E. F. & Finkbeiner, D. P. 2011, ApJ, 737, 103
- Schlegel et al. (1998) Schlegel, D. J., Finkbeiner, D. P., & Davis, M. 1998, ApJ, 500, 525
- Schlegel (1990) Schlegel, E. M. 1990, MNRAS, 244, 269
- Siess (2007) Siess, L. 2007, A&A, 476, 893
- Siess & Pumo (2006) Siess, L. & Pumo, M. L. 2006, Mem. Soc. Astron. Italiana, 77, 822
- Smartt (2015) Smartt, S. J. 2015, PASA, 32, e016
- Smith et al. (2016) Smith, N., Andrews, J. E., Van Dyk, S. D., et al. 2016, MNRAS, 458, 950
- Smith et al. (2009) Smith, N., Ganeshalingam, M., Chornock, R., et al. 2009, ApJ, 697, L49
- Smith et al. (2011) Smith, N., Li, W., Silverman, J. M., Ganeshalingam, M., & Filippenko, A. V. 2011, MNRAS, 415, 773
- Tauris & Janka (2019) Tauris, T. M. & Janka, H.-T. 2019, ApJ, 886, L20
- Thompson et al. (2009) Thompson, T. A., Prieto, J. L., Stanek, K. Z., et al. 2009, ApJ, 705, 1364
- Tominaga et al. (2013) Tominaga, N., Blinnikov, S. I., & Nomoto, K. 2013, ApJ, 771, L12
- Tully et al. (2016) Tully, R. B., Courtois, H. M., & Sorce, J. G. 2016, AJ, 152, 50
- Valerin (2019) Valerin, G. 2019, Master’s thesis, University of Padua
- Van Dyk et al. (2000) Van Dyk, S. D., Peng, C. Y., King, J. Y., et al. 2000, PASP, 112, 1532
- Williams et al. (2020) Williams, S. C., Jones, D., Pessev, P., et al. 2020, arXiv e-prints, arXiv:2001.08782
- Woosley & Heger (2015) Woosley, S. E. & Heger, A. 2015, ApJ, 810, 34
.
| ID | (2000) | (2000) | ||||||
|---|---|---|---|---|---|---|---|---|
| 1 | 223.501175 | 3.554772 | … | … | … | … | … | … |
| 2 | 223.494568 | 3.512511 | … | … | … | … | … | … |
| 3 | 223.450409 | 3.549971 | … | … | … | … | … | … |
| 4 | 223.491287 | 3.578468 | 16.572(028) | 16.018(011) | 17.253(048) | 16.239(009) | 15.847(019) | 15.692(010) |
| 5 | 223.454926 | 3.543110 | 16.771(020) | 16.082(012) | 17.797(071) | 16.387(010) | 15.892(007) | 15.716(010) |
| 6 | 223.473694 | 3.598971 | 17.385(050) | 16.734(025) | 18.245(055) | 17.016(035) | 16.567(029) | 16.392(021) |
| 7 | 223.545074 | 3.513310 | 17.712(029) | 17.034(024) | 18.675(033) | 17.374(035) | 16.854(013) | 16.661(024) |
| 8 | 223.423279 | 3.524919 | 18.486(023) | 17.988(049) | 19.094(043) | 18.198(036) | 17.827(034) | 17.709(060) |
| 9 | 223.409164 | 3.544031 | 18.709(027) | 18.131(044) | 19.455(207) | 18.315(119) | 17.930(072) | 17.795(068) |
| 10 | 223.525085 | 3.558814 | 19.137(166) | 18.274(018) | 20.034(082) | 18.703(032) | 17.994(079) | 17.723(096) |
| 11 | 223.461456 | 3.557315 | 19.394(061) | 17.967(060) | 19.917(172) | 18.701(003) | 17.397(041) | 16.743(016) |
| 12 | 223.466751 | 3.512445 | 19.219(068) | 18.595(080) | 19.980(066) | 18.800(085) | 18.276(096) | 18.154(070) |
| 13 | 223.450058 | 3.525849 | 19.625(047) | 18.460(053) | … | 18.985(028) | 17.875(043) | 17.522(032) |
| 14 | 223.413147 | 3.509561 | 19.529(075) | 18.903(025) | 19.950(072) | 19.241(025) | 18.724(024) | 18.467(052) |
| 15 | 223.500031 | 3.629244 | 19.735(062) | 18.549(084) | … | 19.149(033) | 17.913(043) | 17.394(027) |
| 16 | 223.488373 | 3.505094 | 19.659(061) | 18.660(035) | … | 19.168(068) | 18.195(060) | 17.927(074) |
| 17 | 223.537628 | 3.636855 | 19.683(100) | 19.045(044) | 20.249(094) | 19.355(005) | 18.847(103) | 18.771(035) |
| 18 | 223.432632 | 3.621403 | 19.990(188) | 19.316(039) | 20.400(132) | 19.637(111) | 19.189(035) | 18.764(062) |
| 19 | 223.469666 | 3.623828 | 19.806(138) | 19.236(086) | … | 19.574(057) | 18.878(003) | 18.537(061) |
| 20 | 223.407272 | 3.620129 | 19.984(091) | 19.721(097) | 19.100(063) | 20.079(100) | 19.521(052) | 19.187(014) |
| 21 | 223.508453 | 3.619909 | 20.646(152) | 19.390(189) | … | 20.051(112) | 18.770(084) | 18.039(116) |
| ID | N | N | N | |||||
|---|---|---|---|---|---|---|---|---|
| 101 | 223.4504 | 3.549965 | 13.60(01) | 4 | 13.40(34) | 5 | 12.73(03) | 5 |
| 102 | 223.4811 | 3.582550 | 13.65(02) | 5 | 13.41(03) | 6 | 13.07(02) | 6 |
| 103 | 223.4913 | 3.578437 | 15.10(02) | 5 | 14.84(03) | 6 | 14.47(03) | 6 |
| 104 | 223.4615 | 3.557310 | 15.73(04) | 5 | 15.25(04) | 6 | 14.57(04) | 6 |
| 105 | 223.4739 | 3.598759 | 15.66(04) | 1 | 15.52(03) | 2 | 15.23(06) | 1 |
| 106 | 223.4524 | 3.570402 | 16.97(10) | 4 | 16.37(15) | 5 | 15.76(10) | 5 |
| 107 | 223.4747 | 3.582985 | 17.47(21) | 3 | 17.13(20) | 3 | 16.53(19) | 3 |
| JD | Photometry [mag] | error [mag] | filter [mag] |
|---|---|---|---|
| 2456029.82 | 17.21 | 0.02 | |
| 2456050.74 | 17.68 | 0.01 | |
| 2456050.75 | 17.70 | 0.01 | |
| 2456029.87 | 16.85 | 0.02 | |
| 2456050.78 | 17.22 | 0.02 | |
| 2456050.79 | 17.20 | 0.02 | |
| 2456029.85 | 16.50 | 0.02 | |
| 2456050.77 | 16.75 | 0.03 | |
| 2456050.77 | 16.76 | 0.03 |
| JD | err | |
|---|---|---|
| 2456013.80 | 18.951 | 0.054 |
| 2456014.80 | 18.678 | 0.108 |
| 2456017.79 | 18.042 | 0.010 |
| 2456018.79 | 18.001 | 0.060 |
| 2456021.78 | 17.873 | 0.017 |
| 2456022.78 | 17.858 | 0.019 |
| 2456024.70 | 17.850 | 0.100 |
| 2456032.73 | 18.085 | 0.012 |
| 2456034.85 | 18.144 | 0.013 |
| 2456036.71 | 18.237 | 0.036 |
| 2456040.70 | 18.332 | 0.019 |
| 2456048.62 | 18.545 | 0.022 |
| 2456050.66 | 18.511 | 0.057 |
| 2456057.57 | 18.573 | 0.140 |
| 2456071.50 | 19.035 | 0.049 |
| 2456075.53 | 19.377 | 0.082 |
| 2456079.51 | 19.264 | 0.079 |
| MJD | 3.6 m | 4.5 m |
|---|---|---|
| 56041.24 | 5.60 | 3.61 |
| 56052.83 | 4.95 | 3.30 |
| 57168.52 | 8.90 | 1.18 |
| Object | Date | Date | Days since | Telescope | Instrument | Resolution |
|---|---|---|---|---|---|---|
| (JD) | (UT) | discoveryaaNote. – Photometry is computed relative to the -band magnitude of star with identification (ID) number 3 in Table 1. To facilities good agreement between the LSQ -band and CSP-II -band light curves, a 0.03 mag offset was added to the CSP-II magnitude of star 3 as explained in the text.Note. – fluxes in erg s-1 Å-1 cm-2. | (Å) | |||
| SNhunt120 | 2456014.66 | March 28.16 | 0.7 | du Pont | WFCCD | 7.5 |
| SNhunt120 | 2456025.79 | April 08.29 | 11.8 | Baade | FIRE | 22 |
| SNhunt120 | 2456049.65 | May 02.15 | 35.7 | du Pont | WFCCD | 7.5 |
| SNhunt120 | 2456054.75 | May 07.25 | 40.8 | Baade | FIRE | 22 |
| Band | Phase∗ | Reddening corrected | ||
|---|---|---|---|---|
| 9.720.4 | 18.770.01 | 13.580.14 | 13.430.29 | |
| 10.000.2 | 18.250.01 | 14.090.14 | 13.800.29 | |
| 9.620.2 | 17.980.01 | 14.370.14 | 13.980.29 | |
| 9.590.2 | 17.780.01 | 14.560.14 | 14.030.29 | |
| 9.410.2 | 17.570.01 | 14.770.14 | 14.120.29 | |
| 9.110.2 | 17.460.01 | 14.880.14 | 14.070.29 |
| ILRT | ||
|---|---|---|
| (mag) | (mag) | |
| M85-OT2006-1 | 31.03 | 0.14 |
| SN 2008S | 31.34 | 0.69 |
| NGC 300-2008-OT1 | 28.78 | 0.40 |
| PTF10fqs | 26.37 | 0.04 |
| AT 2017be | 31.15 | 0.09 |
| AT 2019abn | 31.64 | 0.85 |
| Phasea | H | H | Ca ii 8662 | He i 10830 | P | P |
|---|---|---|---|---|---|---|
| (days) | (km s-1) | (km s-1) | (km s-1) | (km s-1) | (km s-1) | (km s-1) |
| +1 | 1362122 | 63621 | ||||
| +12 | 74297 | 1375277 | ||||
| +36 | 690115 | 44817 | ||||
| +41 | 301113 |
Appendix A Host metallicity
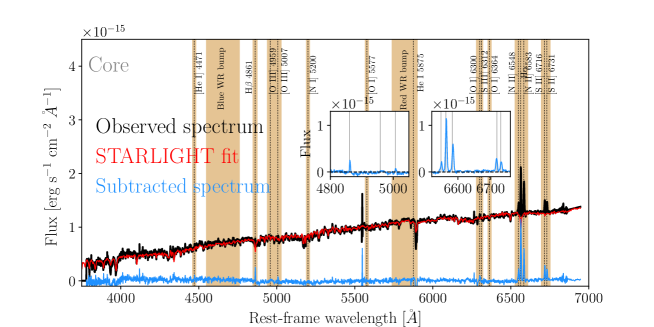
We plot in Fig. 14 the SDSS spectrum of NGC 5775 and also indicate and label nebular emission lines. In particular, emission features associated with H, [N ii] 6584, and [S ii] 6717,6731 are labeled and fit with a single-Gaussian function in order to obtain a measure of the observed wavelength and line flux. From these features we compute an average redshift of .
The spectrum provides a means for estimating an oxygen metallicity abundance, but with respect to its central region. To do so, the SDSS spectrum was first fit with a modified version of STARLIGHT (Cid Fernandes et al. 2005; López Fernández et al. 2016, priv. comm.), a program that models the stellar component of the spectral continuum by estimating the fractional contribution of simple stellar populations (SSP) of different ages and metallicities, adding a dust attenuation foreground screen. The best-fit SSP model is then removed from the spectrum, and then Gaussian functions are fit to [N ii] and [O iii] nebular lines. From these fits we obtain a metallicity higher than solar of dex on the O3N2 scale (Pettini & Pagel 2004).
As this is an indication for the center region of the host and not for the position of SNhunt120, we extrapolated the galaxy nucleus value to the approximate location of SNhunt120 using the metallicity gradient from Pilyugin et al. (2004) of 0.47 dex R. Adopting values for the diameter and position angle for NGC 5775 from NED and Hyperleda (Makarov et al. 2014),333Hyperleda is a database of various physical properties of galaxies and can be found at http://leda.univ-lyon1.fr we compute a radius-normalized distance from the host nucleus of 0.82. Altogether, we find a local oxygen abundance for SNhunt120 of 12 + log(O/H) dex, where we adopt a 0.1 dex R uncertainty on the gradient.
Appendix B Galactic and host reddening
NED lists the Galactic reddening along the line of sight to NGC 5775 as inferred by the Schlafly & Finkbeiner (2011) (SF11) recalibration of the Schlegel et al. (1998) infrared-based dust map to be mag. When a standard value is adopted, this gives a foreground visual extinction of mag.
When estimating the host reddening of SNhunt120, we note that there are no reliable methods to do so, and regardless of the adopted method, it is accompanied by significant uncertainty. With this caveat in mind, inspection of the two low-resolution visual wavelength spectra presented below reveals a Na i D absorption feature located at the expected location given the redshift of the host galaxy. In principle, a reliable measure of column density can provide a measure of the host extinction (e.g., Phillips et al. 2013, see their Fig. 9). Unfortunately, we are only able to estimate rough column densities from these low-dispersion spectra as they do not resolve the individual components that contribute to the absorption. Measuring the EW of the Na i feature from the low-resolution spectra indicates a value of EW Å. This value lies outside the range of validity for the Phillips et al. (2013) relation. We next searched for evidence of a diffuse interstellar band (DIB) located at 5780 Å that is known to be correlated with (Phillips et al. 2013). Unfortunately, the signal-to-noise ratio of our spectra is too low to provide any meaningful measurement of this DIB feature.
To approximately estimate the reddening of SNhunt120, we compared its observed broadband colors to the intrinsic broadband colors of other ILRTs. Fig. 5 shows that the and color evolution of the comparison sample is rather similar to that of SNhunt120. Here the broadband colors of the comparison objects were corrected for reddening using values found in the literature. When we assume that the intrinsic colors of SNhunt120 are similar to those of the bluest objects in the comparison sample, the host-galaxy color excess affecting SNhunt120 can be estimated by shifting its observed broadband colors to match the intrinsic color curves of the bluest objects in the comparison sample. In doing so, we find that the observed colors agree with the intrinsic colors of the bluest objects with mag. When a Fitzpatrick (1999) reddening law is adopted, this translates into a host visual extinction of mag. Values exceeding those contained within the quoted uncertainty lead to poor agreement between SNhunt120 and the bluest objects in Fig 5. When is combined with , we obtain a total visual extinction of mag for SNhunt120.
Objects such as SNhunt120 are typically enshrouded by circumstellar dust, and as a result, the dust may follow a peculiar reddening law. When we consider the relations for reddening assuming graphitic (with grains of size 0.2 m) circumstellar dust as presented by Kochanek et al. (2012a), would be 17% lower at most than that from the Fitzpatrick (1999) law in the optical ( band). If, on the other hand, the dust is formed by silicates (with grains of size 0.2 m), would be 45% lower at most than the Fitzpatrick (1999) law in the optical ( band), and up to 30% higher in the band.