Controlled 2D Ferromagnetism in 1T-CrTe2. The role of charge density wave and strain
Abstract
Transition metal dichalcogenides are promising candidates to show long-range ferromagnetic order in the single-layer limit. Based on ab initio calculations, we report the emergence of a charge density wave (CDW) phase in monolayer 1T-CrTe2. We demonstrate that this phase is the ground state in the single-layer limit at any strain value. We obtain an optical phonon mode of THz that connects CDW phase with the undistorted 1T phase. Localization of the orbital of CrTe2 produces an out-of-plane orientation of the magnetic moments, circumventing the restrictions of the Mermin-Wagner theorem and producing ferromagnetic long-range order in the two-dimensional limit. This orbital-localization is enhanced by the CDW phase. Tensile strain also increases the localization of this orbital driving the system to become ordered. CrTe2 becomes an example of a material where the CDW phase produces the stabilization of the long-range ferromagnetic order. Our results show that both strain and phase switching are mechanisms to control the 2D ferromagnetic order of CrTe2.
I Introduction
The discovery of graphene in 2004 Novoselov et al. (2004) prompted new research areas focused on developing purely two-dimensional (2D) materials that could show emergent physical phenomena and lead to new applicationsGeng and Yang ; Khan et al. (2019); Cao et al. (2018). In the last decade, ordered phases such as ferroelectricity or ferromagnetism, that typically occur in bulk, were also reported in 2D materials Chang et al. (2016); Gong et al. (2017). In particular, the study of 2D ferromagnets results nowadays attractive due to the influence that it could have in other active research areas: spintronics, experiments on quantum anomalous Hall effect, tunneling magneto resistance or spin valves are some examplesHuang et al. (2020).
In order to achieve a 2D ferromagnet, it is necessary to overcome the constraints imposed by the Mermin-Wagner theorem Mermin and Wagner (1966). It postulates the appearance of gapless spin excitations at finite temperature in isotropic short-range-interaction models, like the isotropic Heisenberg model in 1 or 2D, thus, forbidding long-range ferromagnetic order. In two dimensions the system must lower its symmetry (break spin-rotation invariance) to become a ferromagnet. This can be done by applying an external field or force such as a magnetic field or strain. But, more interestingly, it can also be achieved intrinsically by a strong magnetic anisotropy in the crystal, driven by spin-orbit coupling (SOC). In this study we will see that the emergence of a charge density wave (CDW) phase can also produce the same effect.
There are already a few examples of systems where ferromagnetism has been observed in the few layer or monolayer limit. These are, e.g. Cr2Ge2Te6 Gong et al. (2017), Fe3GeTe2 Fei et al. (2018), CrI3 Zhang et al. (2015) and FePS3Lee et al. (2016). Among them, the family of transition metal dichalcogenides (TMD) has been proposed to be an ideal platform to study 2D ferromagnetism Du et al. (2017); Guo et al. . These have layered structures with layers bonded via van der Waals interactions (hence, they can be exfoliated down to the monolayer limit), Xu et al. (2013) and the transition metal in the structure provides the d-electrons that in some cases leads to a non-zero magnetic moment. Apart from that, several TMD develop a CDW phase Bussmann-Holder and Büttner (2002); Wilson et al. (1975); Eaglesham et al. (1986); Bianco et al. (2019); Wang et al. (2019); Chen et al. (2017) at low temperatures. This phase can deeply influence the magneticFumega et al. (2019) and superconductiveManzeli et al. (2017) properties of these compounds. This interplay is yet to be fully understood. In this work, we provide an example of a situation where the CDW phase leads to an enhancement of magnetism (at least in the 2D limit), contrary to, e.g. VSe2 where the opposite occursFumega et al. (2019); Feng et al. (2018); Coelho et al. (2019).
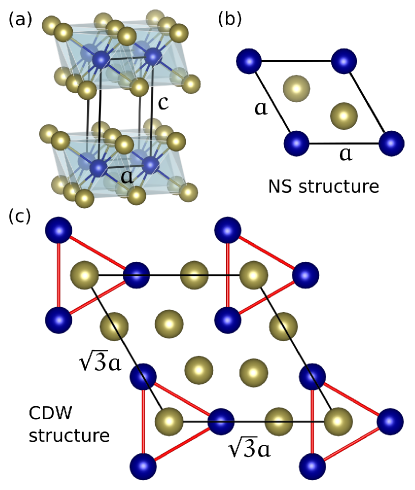
This study will be focused on CrTe2, a TMD that crystallizes in a 1T-phase, in which the Cr-rich hexagonal planes are sandwiched by Te-rich layers. CrTe2 layers of this form are stacked via van der Waals interactions (as shown in Fig. 1a). This compound shows a room temperature ferromagnetic phase with a Curie temperature of 310 K and the magnetic moments aligned parallel to the layers Freitas et al. (2015). The transition above room temperature makes CrTe2 a highly interesting material from the technological point of view. Based on Density Functional Theory (DFT) calculations, we will analyze below engineering strategies for the bulk structure, such as strain, to align the magnetic moments perpendicular to van der Waals planes. Additionally, we will study in detail the monolayer limit. Our calculations predict the formation of a CDW in the 2D limit. We will analyze the influence that such a phase has to induce long-range ferromagnetic order in 2D. We will also discuss the role of strain at the monolayer level. Our study will show that strain is a possible way to control the ferromagnetic order of CrTe2 in the 2D limit.
II Computational methods
We have performed ab initio electronic structure calculations based on DFTHohenberg and Kohn (1964); Kohn and Sham (1965) using an all-electron full potential code (wien2kSchwarz and Blaha (2003)) on CrTe2. The exchange-correlation term used for the bulk and monolayer structures was the generalized gradient approximation (GGA) in the Perdew-Burke-ErnzerhofPerdew et al. (1996) scheme. Note that in the case of TMD’s van der Waals schemes are required to analyse structural propertiesDiego et al. (2020). However, our structural analysis focuses on the monolayer limit, where these schemes do not have an effect. These calculations were performed with a converged k-mesh and a value of RmtKmax=7.0. The Rmt values used were 2.39 and 2.50 in a.u. for Cr and Te respectively.
The harmonic phonon spectrum of monolayer CrTe2 was computed using the real-space supercell approachTogo and Tanaka (2015). Scanning tunneling microscope (STM) images were computed using a density of Å3 associated to the constant current. They were represented using the XCrySDen codeKokalj (1999).
In order to compute the magnetic anisotropy energy (MAE), spin-orbit coupling (SOC) was introduced in a second variational manner using the scalar relativistic approximation MacDonald et al. (1980). MAE is defined as:
| (1) |
where is the energy per metal atom when the magnetization is set along an in-plane direction (parallel to the Cr layers), while is calculated considering the magnetization points along the out-of-plane direction (perpendicular to the Cr-rich layers).
III The bulk structure
In this section we see how the effect of strain affects the alignment of the magnetic moments. The starting point for the bulk analysis is the experimental structureFreitas et al. (2015). We modified the off-plane lattice parameter and fully relaxed the atomic positions. After this, we introduced SOC for an in-plane magnetization direction and an out-of-plane direction. This allowed us to obtain the needed energies to compute the MAE given by eq. (1). We then repeated this process for different values of the in-plane lattice parameter , resulting in Fig. 2. Positive values of the MAE in our convention mean that magnetic moments point perpendicular to the Cr layers. These are of special interest when approaching the 2D limit, where the Mermin-Wagner theorem applies.

The off-plane direction is a trigonal axis for the Te6 octahedron surrounding the Cr cations. Stretching (compressing) the octahedra along this axis leads to a splitting of the otherwise degenerate t2g triplet into a lower(higher-)-lying doublet (so-called ) and a higher(lower-)-lying singlet (a1g).Khomskii (2014) Our calculations show that for the experimental values of the lattice parameters, the magnetization points in the plane, which is in agreement with experiment Freitas et al. (2015). When trigonal strain is applied, Fig. 2 shows that: i) when the Cr layers come closer to each other (smaller lattice parameter values), the turns positive. This means that with a high enough uni-axial pressure that approximates Cr layers together, bulk CrTe2 will present an out-of-plane magnetization direction. ii) In a similar way, when approaching the monolayer limit, as Cr layers separate, the magnetic moments also tend to point perpendicular to these, but only for larger lattice parameter values. In fact, without it, the magnetic moments will stay pointing in-plane (negative values of the ).
As discussed before, a magnetization pointing out of the plane is a requirement for ferromagnetic long-range order to exist at a finite temperature in the two-dimensional limit. Thus, it is desirable to understand how to force the magnetization to point out of the plane in the single-layer limit. We will compare below these results in the bulk with similar ones obtained in the 2D limit.
IV Structural characterization of the monolayer
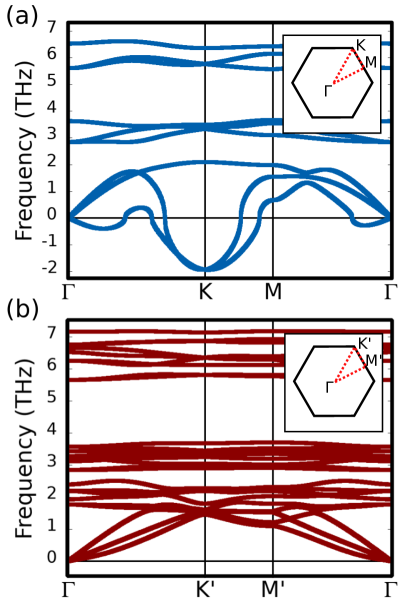
Based on previous studies that report the emergence or enhancement of a CDW phase in some TMD’s when the 2D limit is reached Bussmann-Holder and Büttner (2002); Wilson et al. (1975); Eaglesham et al. (1986); Bianco et al. (2019); Wang et al. (2019); Chen et al. (2017), we have analyzed if a CDW state emerges in monolayer CrTe2. To do so, we have performed phonon band structure calculations in what we have defined as the normal state (NS) structure of the monolayer. Figure 1b shows the NS structure and its unit cell. This NS structure has a perfect hexagonal arrangement of the Cr atoms as in bulk (space group no. 164), but with the Te atoms fully relaxed in the monolayer limit. In this state, each Cr atom has 6 Cr neighbours at the same distance and the unit cell can be reduced to the one depicted in Fig. 1b as a black rhombus. If a CDW phase is the ground state of the system, the phonon band structure must show unstable modes at certain -points related to the supercell structure in which the CDW is described Johannes and Mazin (2008). Figure 3a shows the phonon band structure for NS monolayer CrTe2. A clear instability is observed at the K point (,) in reciprocal space, which suggests a supercell to describe the CDW state. Note that an instability in the harmonic spectrum is just an indication (not a proof) of the existence of a CDW phase. The introduction of anharmonicities could lead the NS to stabilize, i.e. quenching the appearance of the CDW phaseBianco et al. (2019). Therefore, without including anharmonic effects, the route that we have to follow to demonstrate the existence of the CDW in monolayer is to find a modulated structure lower in energy than the NS structure that presents stable phonon modes.
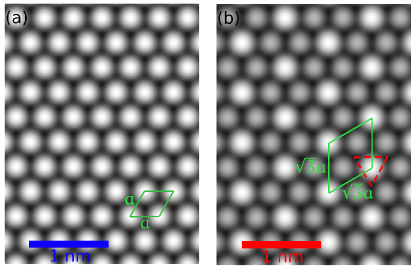
Motivated by the harmonic instability at the K point, we have generated a supercell as the one shown in Fig. 1c. We have optimized all the atomic positions in it. The result is a reconstruction of the atomic distances. Compared to the NS structure, in which each Cr atom has 6 equidistant Cr neighbours, in the CDW structure each Cr has two short and 4 long Cr-Cr bonds, i.e. a triangular modulation like the one shown in red in Fig. 1c appears in the structure. Modulations like this due to the CDW are known to produce new peaks in the X-Ray diffraction patternWilliams et al. (1976). Nevertheless, in 2D materials this experimental technique does not allow to measure the structural reconstruction that happens. Therefore, we have computed the constant current STM images for the NS (Fig. 4a) and the CDW (Fig. 4b) structures. In these images, the white dots are associated to the top-layer Te atoms that form the Te-Cr-Te sandwich of the 2D material. For the NS case, all of the Te atoms present the same intensity. However, in the CDW case, some of the white dots are brighter and bigger. These dots are the ones associated to the Te atoms that lie inside the red triangle in Fig. 1c. The stretching of the Cr atoms forming the triangle make these Te atoms come out of the plane. Thus, producing an increase in the intensity and size observed in the STM image. A symmetry analysis of the CDW structure allows us to identify that the structure corresponds to the space group no. 157, which is a subgroup of the NS structure symmetry (space group no. 164). Note that this subgroup has no inversion symmetry along the z-direction. Thus, this CDW breaks inversion symmetry, just like the Janus monolayers, but without imposing substitutional doping to one of the Te sub-layersLu et al. (2017); Maghirang et al. (2019).
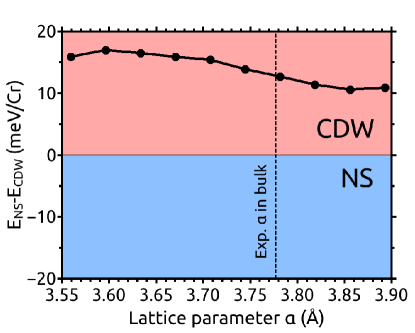
By now, we have reported the appearance of a CDW in a supercell for monolayer CrTe2. However, we have not demonstrated yet that it corresponds to a ground state at low temperatures. To do so, we have computed the total energies of both the NS and the CDW structures using DFT calculations. Note that now that we have already identified the subgroup associated to the CDW phase, we have reoptimized all the atomic positions and lattice parameters while fixing that space subgroup of the unit cell. This allows to determine which structure is energetically preferred at 0 K. Figure 5 shows the energy difference between the NS and the CDW structure as a function of the lattice parameter . The experimental value of in bulkFreitas et al. (2015) is plotted for comparison. Ab initio calculations show that in the monolayer limit the optimized lattice parameter is 2% smaller than the experimental value in bulk, within the uncertainty range for a DFT calculation. Consequently, the overall conclusions obtained for the experimental value are the same as the ones for the optimized value. We observe that the CDW phase is more stable than the NS at any lattice parameter studied. In particular, for the experimental case, the energy difference is meV/Cr atom. We have also computed the phonon band structure (Fig. 3b) for the CDW structure. We can see that this structure does not show dynamic instabilities in the form of imaginary phonon modes in the phonon band structure, and hence it provides the ground state for monolayer CrTe2. Note that the labels of the reciprocal space in Fig. 3b have been primed to emphasize that the first Brillouin zone is reduced in the CDW phase. Moreover, we have identified an optical mode in the CDW structure that drives this phase to the NS one. This mode has a frequency of 1.96 THz and could be activated to switch between both phases.
V Ferromagnetism in the 2D limit
Now that we have already seen that at low temperature a CDW phase emerges on monolayer CrTe2, we can analyze its effect on the ferromagnetic order of the compound. But before doing that, we are going to see the effect that it produces on the electronic structure.
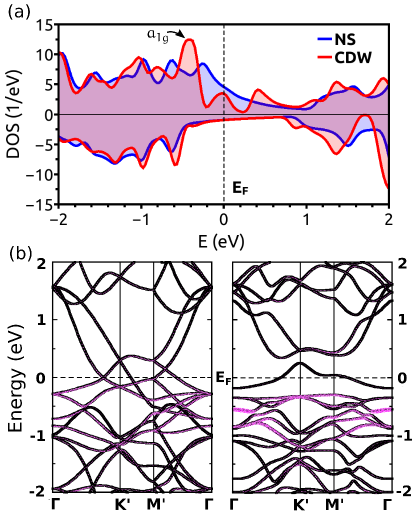
Typically, the occurrence of a CDW phase leads to the opening of electronic gaps or pseudogaps in the vicinity of the Fermi level Terashima et al. (2003); Borisenko et al. (2008); Chen et al. (2017). In order to see the rearrangement that the electronic structure of CrTe2 undergoes within the CDW phase, we have computed the electronic density of states (DOS) and the band structures for both phases. Figure 6a shows the DOS for the NS (CDW) phase in blue (red) near the Fermi level. As discussed above for the bulk case, the octahedral environment around the Cr atoms is trigonally distorted and hence the -orbitals split into 3 sets of energy levels, one singlet and two ( and ) doublets, the latter being split from the cubic t2g triplet. The occupation of the and two electrons in the wider bands in the majority spin channel leads to a total magnetic moment of 3 Cr, corresponding to an approximate Cr3+ valence, but with a high degree of hybridization with Te- orbitals, which produces the observed metallic state. The minority spin channel presents roughly no occupied Cr d states (apart from some bonding character in the Te p bands). In Fig. 6a, in the majority channel, we can see that gaps are opened around the Fermi level as a consequence of the CDW (shown in red). This can be analyzed in more detail in the band structure (Fig. 6b) in which the majority spin channels are represented. On the left (right) panel, the NS (CDW) band structure is shown, both computed in the supercell. Due to the atomic rearrangement produced by the CDW, bands hybridize opening a gap below and above the Fermi level that leaves a flat single band crossing the Fermi level. This depletion of states around the Fermi level reduces the total energy of the system, making the CDW structure the ground state solution. We can also see that the orbital, whose character is represented in pink in Fig. 6b, gets more localized. This can also be identified as a peak in the DOS just below the Fermi level for the CDW case (Fig. 6a).
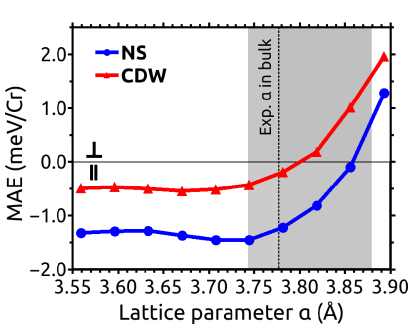
Regarding the magnetic properties of the system, we have already stated that monolayer CrTe2 presents a magnetization of 3 per Cr atom. In the bulk case, the system is a room-temperature ferromagnet in which the in-plane magnetic exchange couplings (the ones relevant in the 2D limit) are ferromagnetic. Considering previous works in which the dimensionality effect is studied for similar Cr van der Waals compounds Wang et al. (2011); O. Fumega et al. (2020), and given the small changes in the Cr-Cr distance between monolayer and bulk limits, the in-plane magnetic exchange couplings will remain ferromagnetic in monolayer CrTe2. The question that arises now is if the moments are long-range ordered in the 2D limit, thus providing a ferromagnetic state. In orther to check this, we have computed the as given by eq. (1). Fig. 7 shows the as a function of strain for the NS and the CDW phases. An out-of-plane (positive values in our convention) circumvents the restrictions of the Mermin-Wagner theorem leading to long-range ferromagnetic order to be stable at finite temperatures.
In Fig 7 we observe that for the experimental value of the in-plane lattice constant, a long-range FM order is on the verge of being feasible. A very small tensile strain produces a spin reorientation for the CDW phase with the solution with an out-of-plane magnetization being stable. A substantially larger tensile strain is required to produce the same effect in the NS structure. It can be seen that the CDW phase has a higher tendency to have the magnetic moments aligned perpendicular to the layer, i.e. every value for the CDW is more positive (or less negative) than the corresponding one in the NS. This tendency for the moments to orient out of plane is accompanied of a stronger moment localization in the CDW phase, as we can see in the band structure analyzed above. When tensile strain is applied, the states also become more localized. Bandwidths are reduced by an increase of the inter-atomic bond length which causes a reduction of the in-plane hopping. In this respect, tensile strain operates in the same direction as the CDW does.
We saw above that for CrTe2 in the bulk, strain is also a mechanism responsible for producing an out-of-plane orientation of the magnetization in this compound. In particular, enlarging the in-plane lattice parameter (reducing the Cr d bandwidth, and producing larger moment localization) increases the tendency for the magnetic moments to point out of the plane.
This kind of out-of-plane to in-plane magnetic moment reorientation has been observed in similar (bulk) van der Waals ferromagnets like Cr2Ge2Te6 when pressure is applied Lin et al. (2018). The effect of pressure goes in the opposite direction than tensile strain. It reduces the lattice parameter, thus increasing the bandwidth (or delocalization) of the orbitals and hence driving the moments parallel to the layers. Thus, this relationship between magnetocrystalline anisotropy and moment orientation in trigonally distorted Cr3+-based 2D magnets is somewhat general.
We observe that for the experimental value of the lattice parameter , ferromagnetic order is on the verge of stability in the CDW phase. Small values of strain could lead the system to become ordered, and vice versa. Thus, strain provides an effective way to control 2D ferromagnetism in monolayer CrTe2. Apart from this mechanism, it can also be controlled by activating the 1.96 THz phonon mode that we have identified in the previous section. This would drive the CDW phase to the NS one, thus quenching the magnetic order. The shaded area in grey in Fig. 7 provides the range of lattice parameter values in which we could control the ferromagnetic order of 2D CrTe2.
VI Summary and conclusions
In this article we have analyzed the magnetic and structural properties of CrTe2.
In the first part we focused on the bulk structure. We saw how different distortions applied to the lattice parameters could drive the moments to point perpendicular to the van der Waals layers. By decreasing the lattice parameter an increase in the hopping between layers is produced. This leads the moments to point out-of-plane. By increasing the lattice parameter , i.e. increasing the distance between layers and approaching the 2D limit, magnetic moments point perpendicular if the lattice parameter is also increased.
A detailed description of the monolayer limit was presented in the following sections. First, a structural analysis was performed. We found that a CDW associated to the symmetry space group no. 157 emerges at low temperatures. This CDW phase corresponds to the ground state at any strain value, and it helps eliminating the dynamic instabilities that appear in the phonon spectrum for the NS structure. We showed computed STM images of NS and CDW phases to guide experimentalists to identify each phase. We have also determined that an optical phonon mode of THz is responsible for the transition between phases. Thus, prompting a route to switch between them in a controlled way Nova et al. (2019). The analysis of the electronic structure showed that the CDW phase opens pseudogaps around the Fermi level and localizes the orbitals. This is found to drive the magnetic moments to point perpendicular to the monolayer, thus, overcoming the constrains imposed by the Mermin-Wagner theorem and producing long-range ferrromagnetic order in the 2D limit. Tensile strain is also found to increase the localization of the orbitals and hence produce ferromagnetism in both phases. This mechanism of moment localization associated to the magnetization pointing out of plane operates in other Cr3+-based low-dimensional magnets.
In this article, we have highlighted the importance that the structure has in providing a good description of the magnetic properties in CrTe2. Opposite to what has been reported for other similar systems, such as VSe2, Fumega et al. (2019) where a CDW is incompatible with a long-range FM order, we have found that the emergence of a CDW drives CrTe2 to become a ferromagnet in the single-layer limit. Our work provides additional understanding for the interplay between different competing phases in low-dimensional materials and gives fundamental insight in order to find 2D ferromagnetism in TMD’s and related systems.
VII Supporting information
A video showing the phonon mode of 1.96 THz that connects the CDW phase and the NS one has been included as supplemental material. Monolayer CDW and NS cif files have also been included.
Acknowledgements
This work is supported by the MINECO of Spain through the project PGC2018-101334-B-C21. A.O.F. thanks MECD for the financial support received through the FPU grant FPU16/02572. We made use of the facilities provided by the Galician Supercomputing Center (CESGA). We also thank S. Blanco-Canosa for fruitful discussions.
References
- Novoselov et al. (2004) K. S. Novoselov, A. K. Geim, S. V. Morozov, D. Jiang, Y. Zhang, S. V. Dubonos, I. V. Grigorieva, and A. A. Firsov, Science 306, 666 (2004).
- (2) D. Geng and H. Y. Yang, Advanced Materials 30, 1800865.
- Khan et al. (2019) K. Khan, A. K. Tareen, M. Aslam, Y. Zhang, R. Wang, Z. Ouyang, Z. Gou, and H. Zhang, Nanoscale 11, 21622 (2019).
- Cao et al. (2018) Y. Cao, V. Fatemi, A. Demir, S. Fang, S. L. Tomarken, J. Y. Luo, J. D. Sanchez-Yamagishi, K. Watanabe, T. Taniguchi, E. Kaxiras, and et al., Nature 556, 80 (2018).
- Chang et al. (2016) K. Chang, J. Liu, H. Lin, N. Wang, K. Zhao, A. Zhang, F. Jin, Y. Zhong, X. Hu, W. Duan, and et al., Science 353, 274 (2016), https://science.sciencemag.org/content/353/6296/274.full.pdf .
- Gong et al. (2017) C. Gong, L. Li, Z. Li, H. Ji, A. Stern, Y. Xia, T. Cao, W. Bao, C. Wang, Y. Wang, and et al., Nature 546, 265 (2017).
- Huang et al. (2020) P. Huang, P. Zhang, S. Xu, H. Wang, X. Zhang, and H. Zhang, Nanoscale 12, 2309 (2020).
- Mermin and Wagner (1966) N. D. Mermin and H. Wagner, Phys. Rev. Lett. 17, 1133 (1966).
- Fei et al. (2018) Z. Fei, B. Huang, P. Malinowski, W. Wang, T. Song, J. Sanchez, W. Yao, D. Xiao, X. Zhu, A. F. May, and et al., Nature Materials 17, 778 (2018).
- Zhang et al. (2015) W.-B. Zhang, Q. Qu, P. Zhu, and C.-H. Lam, J. Mater. Chem. C 3, 12457 (2015).
- Lee et al. (2016) J.-U. Lee, S. Lee, J. H. Ryoo, S. Kang, T. Y. Kim, P. Kim, C.-H. Park, J.-G. Park, and H. Cheong, Nano Letters 16, 7433 (2016), https://doi.org/10.1021/acs.nanolett.6b03052 .
- Du et al. (2017) J. Du, C. Xia, W. Xiong, T. Wang, Y. Jia, and J. Li, Nanoscale 9, 17585 (2017).
- (13) Y. Guo, H. Deng, X. Sun, X. Li, J. Zhao, J. Wu, W. Chu, S. Zhang, H. Pan, X. Zheng, and et al., Advanced Materials 29, 1700715.
- Xu et al. (2013) K. Xu, P. Chen, X. Li, C. Wu, Y. Guo, J. Zhao, X. Wu, and Y. Xie, Angewandte Chemie International Edition 52, 10477 (2013).
- Bussmann-Holder and Büttner (2002) A. Bussmann-Holder and H. Büttner, Journal of Physics: Condensed Matter 14, 7973 (2002).
- Wilson et al. (1975) J. Wilson, F. D. Salvo, and S. Mahajan, Advances in Physics 24, 117 (1975), https://doi.org/10.1080/00018737500101391 .
- Eaglesham et al. (1986) D. J. Eaglesham, R. L. Withers, and D. M. Bird, Journal of Physics C: Solid State Physics 19, 359 (1986).
- Bianco et al. (2019) R. Bianco, I. Errea, L. Monacelli, M. Calandra, and F. Mauri, Nano Letters 19, 3098 (2019).
- Wang et al. (2019) Y. Wang, J. Ren, J. Li, Y. Wang, H. Peng, P. Yu, W. Duan, and S. Zhou, Phys. Rev. B 100, 241404 (2019).
- Chen et al. (2017) P. Chen, W. W. Pai, Y.-H. Chan, A. Takayama, C.-Z. Xu, A. Karn, S. Hasegawa, M. Y. Chou, S.-K. Mo, A.-V. Fedorov, and et al., Nature Communications 8, 516 (2017).
- Fumega et al. (2019) A. O. Fumega, M. Gobbi, P. Dreher, W. Wan, C. González-Orellana, M. Peña-Díaz, C. Rogero, J. Herrero-Martín, P. Gargiani, M. Ilyn, and et al., The Journal of Physical Chemistry C 123, 27802 (2019).
- Manzeli et al. (2017) S. Manzeli, D. Ovchinnikov, D. Pasquier, O. V. Yazyev, and A. Kis, Nature Reviews Materials 2, 17033 (2017).
- Feng et al. (2018) J. Feng, D. Biswas, A. Rajan, M. D. Watson, F. Mazzola, O. J. Clark, K. Underwood, I. Markovic, M. McLaren, A. Hunter, and et al., Nano letters 18, 4493 (2018).
- Coelho et al. (2019) P. M. Coelho, K. Nguyen Cong, M. Bonilla, S. Kolekar, M.-H. Phan, J. Avila, M. C. Asensio, I. I. Oleynik, and M. Batzill, The Journal of Physical Chemistry C 123, 14089 (2019).
- Freitas et al. (2015) D. C. Freitas, R. Weht, A. Sulpice, G. Remenyi, P. Strobel, F. Gay, J. Marcus, and M. Núñez-Regueiro, Journal of Physics: Condensed Matter 27, 176002 (2015).
- Hohenberg and Kohn (1964) P. Hohenberg and W. Kohn, Phys. Rev. 136, B864 (1964).
- Kohn and Sham (1965) W. Kohn and L. J. Sham, Phys. Rev. 140, A1133 (1965).
- Schwarz and Blaha (2003) K. Schwarz and P. Blaha, Comp. Mater. Sci. 28, 259 (2003).
- Perdew et al. (1996) J. P. Perdew, K. Burke, and M. Ernzerhof, Phys. Rev. Lett. 77, 3865 (1996).
- Diego et al. (2020) J. Diego, A. H. Said, S. K. Mahatha, R. Bianco, L. Monacelli, M. Calandra, F. Mauri, K. Rossnagel, I. Errea, and S. Blanco-Canosa, “Phonon collapse and van der waals melting of the 3d charge density wave of vse2, arxiv:2007.08413,” (2020), arXiv:2007.08413 [cond-mat.mtrl-sci] .
- Togo and Tanaka (2015) A. Togo and I. Tanaka, Scr. Mater. 108, 1 (2015).
- Kokalj (1999) A. Kokalj, Journal of Molecular Graphics and Modelling 17, 176 (1999).
- MacDonald et al. (1980) A. H. MacDonald, W. E. Picket, and D. D. Koelling, Journal of Physics C: Solid State Physics 13, 2675 (1980).
- Khomskii (2014) D. Khomskii, Transition metal compounds (Cambridge University Press, 2014).
- Johannes and Mazin (2008) M. D. Johannes and I. I. Mazin, Phys. Rev. B 77, 165135 (2008).
- Williams et al. (1976) P. M. Williams, C. B. Scruby, W. B. Clark, and G. S. Parry, Le Journal de Physique Colloques 37, C4 (1976).
- Lu et al. (2017) A.-Y. Lu, H. Zhu, J. Xiao, C.-P. Chuu, Y. Han, M.-H. Chiu, C.-C. Cheng, C.-W. Yang, K.-H. Wei, Y. Yang, and et al., Nature Nanotechnology 12, 744 (2017).
- Maghirang et al. (2019) A. B. Maghirang, Z.-Q. Huang, R. A. B. Villaos, C.-H. Hsu, L.-Y. Feng, E. Florido, H. Lin, A. Bansil, and F.-C. Chuang, npj 2D Materials and Applications 3, 35 (2019).
- Terashima et al. (2003) K. Terashima, T. Sato, H. Komatsu, T. Takahashi, N. Maeda, and K. Hayashi, Physical Review B 68 (2003), 10.1103/PhysRevB.68.155108.
- Borisenko et al. (2008) S. V. Borisenko, A. A. Kordyuk, A. N. Yaresko, V. B. Zabolotnyy, D. S. Inosov, R. Schuster, B. Büchner, R. Weber, R. Follath, L. Patthey, and et al., Phys. Rev. Lett. 100, 196402 (2008).
- Wang et al. (2011) H. Wang, V. Eyert, and U. Schwingenschlögl, Journal of Physics: Condensed Matter 23, 116003 (2011).
- O. Fumega et al. (2020) A. O. Fumega, S. Blanco-Canosa, H. Babu-Vasili, P. Gargiani, H. Li, J.-S. Zhou, F. Rivadulla, and V. Pardo, Journal of Materials Chemistry C in press (2020), 10.1039/D0TC02003F.
- Lin et al. (2018) Z. Lin, M. Lohmann, Z. A. Ali, C. Tang, J. Li, W. Xing, J. Zhong, S. Jia, W. Han, S. Coh, and et al., Phys. Rev. Materials 2, 051004 (2018).
- Nova et al. (2019) T. F. Nova, A. S. Disa, M. Fechner, and A. Cavalleri, Science 364, 1075 (2019).