The Carnegie Supernova Project II. Observations of the luminous red nova AT 2014ej††thanks: This paper includes data gathered with the 6.5 meter Magellan telescopes at Las Campanas Observatory, Chile.,††thanks: Photometry and spectra presented in this paper are available on WISeREP.
We present optical and near-infrared broadband photometry and optical spectra of AT 2014ej from the Carnegie Supernova Project-II. These observations are complemented with data from the CHilean Automatic Supernova sEarch, the Public ESO Spectroscopic Survey of Transient Objects, and from the Backyard Observatory Supernova Search. Observational signatures of AT 2014ej reveal that it is similar to other members of the gap-transient subclass known as luminous red novae (LRNe), including the ubiquitous double-hump light curve and spectral properties similar to that of LRN SN 2017jfs. A medium-dispersion visual-wavelength spectrum of AT 2014ej taken with the Magellan Clay telescope exhibits a P Cygni H feature characterized by a blue velocity at zero intensity of km s-1 and a P Cygni minimum velocity of km s-1. We attribute this to emission from a circumstellar wind. Inspection of pre-outbust Hubble Space Telescope images yields no conclusive progenitor detection. In comparison with a sample of LRNe from the literature, AT 2014ej lies at the brighter end of the luminosity distribution. Comparison of the ultra-iolet, optical, infrared (UVOIR) light curves of well-observed LRNe to common-envelope evolution models from the literature indicates that the models underpredict the luminosity of the comparison sample at all phases and also produce inconsistent timescales of the secondary peak. Future efforts to model LRNe should expand upon the current parameter space we explore here and therefore may consider more massive systems and a wider range of dynamical timescales.
Key Words.:
star: mass loss, circumstellar matter - supernova: individual AT 2014ej (PSN J231609794234575)1 Introduction
This is the second of two papers by the Carnegie Supernova Project-II (CSP-II) that each present a case study of a gap transient. Gap transients are located within the so-called “luminosity gap” parameter space that is devoid of bright novae ( mag) and the least luminous core-collapse supernovae (SN; peak mag). Because the visual wavelength spectra of gap transients (in the past also often referred to as intermediate luminosity optical transients) typically resemble the spectra of interacting type IIn SNe, they were historically commonly called SN imposters (e.g., Schlegel 1990; Filippenko 1997; Van Dyk et al. 2000). As the population of gap transients with decent observational data has increased, it has become apparent that the diversity displayed among the literature sample suggests distinctly different populations (see Kulkarni & Kasliwal 2009; Kochanek et al. 2012b; Kashi & Soker 2016; Pastorello & Fraser 2019, for more detailed discussion).
Today, at least three known populations of gap transients are recognized in the luminoisty gap. These include classical luminous blue variable (LBV) outbursts, intermediate-luminosity red transients (ILRTs), and luminous red novae (LRNe). LBVs are thought to be related to eruptions of massive luminous stars (see Smith et al. 2011). As shown in greater detail in Stritzinger et al. (2020, hereafter Paper 1), the ILRT subtype is well represented by NGC 300-2008-OT and SN 2008S, and has been linked to asymptotic giant branch (S-AGB) stars (Prieto et al. 2008; Thompson et al. 2009; Botticella et al. 2009; Prieto et al. 2009; Kochanek 2011; Adams et al. 2016; Doherty et al. 2017) that die as electron-capture supernovae (Miyaji et al. 1980; Nomoto 1984; Miyaji & Nomoto 1987; Hashimoto et al. 1993; Kitaura et al. 2006; Poelarends et al. 2008). Other models appearing in the literature for ILRTs consist of moderately massive stars experiencing super-Eddington winds and/or giant outbursts (e.g., Smith et al. 2009; Humphreys et al. 2011), or massive stars donating material to a main-sequence star, leading to the release of gravitational energy (e.g., Kashi et al. 2010). Finally, a leading model for the origins of LRNe, which all display a ubiquitous double-humped light curve (Pastorello et al. 2019b), consists of the ejection of a common envelope by a massive binary system (e.g., Blagorodnova et al. 2017) upon coalescence (Smith et al. 2016; Metzger & Pejcha 2017; Lipunov et al. 2017; Mauerhan et al. 2018). However, other models have also been proposed in the past to account for LRNe, particularly within articles that have studied the Galactic LRN archetype V838 Mon. These include, among others, outbursts from massive stars (Tylenda 2005), accretion of low-mass stars onto solar-mass main-sequence companions (Soker & Tylenda 2003; Tylenda & Soker 2006; Kashi et al. 2010; Kashi & Soker 2016; Soker 2020), or even giant stars that accrete relatively massive planets (Retter & Marom 2003).
The locations of the three gap-transient subtypes in the luminosity versus decay time (defined as the time interval in which the -band light curve drops one magnitude from peak) parameter space are shown in Fig. 1 of Paper 1. In general, the various gap-transient subtypes exhibit similar peak luminosities, while differences among their light curve decay times are apparent. LBVs tend to exhibit a more slowly declining light-curve evolution. For example, as indicated in Fig. 1 of Paper 1, LBVs typically exhibit decay timescales of 102 days. On the other hand, both ILRTs and LRNe typically decay on shorter timescales of 10 days. Because very few gap transients have been studied in depth, the full extent of the peak luminosity versus decay time parameter space populated by both ILRTs and LRNe is currently unknown.
Similar to the ILRT SNhunt120 presented in Paper 1, here in Paper 2, we add to the small but growing sample of LRNe with our observational data set of AT 2014ej. The data set is based largely on observations performed by the CSP-II (Phillips et al. 2019). This includes optical light curves and some near-IR (NIR) photometry, as well as one low- and one medium-dispersion visual wavelength spectrum. The CSP-II data are clearly complemented with unfiltered images from the Backyard Observatory Supernova Search111https://www.bosssupernova.com/ (BOSS) and the CHilean Automatic Supernova sEarch (CHASE; Reichart et al. 2005), as well as a handful of visual wavelength spectra and optical/NIR broadband photometric measurements obtained by the Public ESO Spectroscopic Survey of Transient Objects (PESSTO; Smartt et al. 2015). In addition, archival images of the host galaxy NGC 7552 obtained with the Hubble Space Telescope (HST) are examined in order to compute progenitor limits.
2 AT 2014ej
2.1 Discovery, distance, and reddening
PSN J23160979-4234575 (hereafter we refer to this transient by its Transient Name Server designation AT 2014ej) was discovered in NGC 7552 on 2014 September 24.46 UT by Peter Marples during the course of the BOSS (Bock et al. 2014) and was confirmed to be 17.80.4 magnitude in unfiltered image taken by G. Bock on 2014 September 24.5 UT. Bock et al. also reported nondetections from images with a limiting magnitude of taken on 2.46 and 2014 September 10.50 2014 UT. We reexamined the discovery image, and after removing the host at the position of the transient, we computed photometry relative to -band photometry of a local sequence of stars in the field of NGC 7552 (see Sect. 2.2). This provides an apparent magnitude of mag on 2014 September 24 (MJD 56923.66), which is slightly fainter than the value reported (Bock et al. 2014). Furthermore, we compute a 3-sigma nondetection limit of 17.8 mag for an image obtained by BOSS on the previous night.
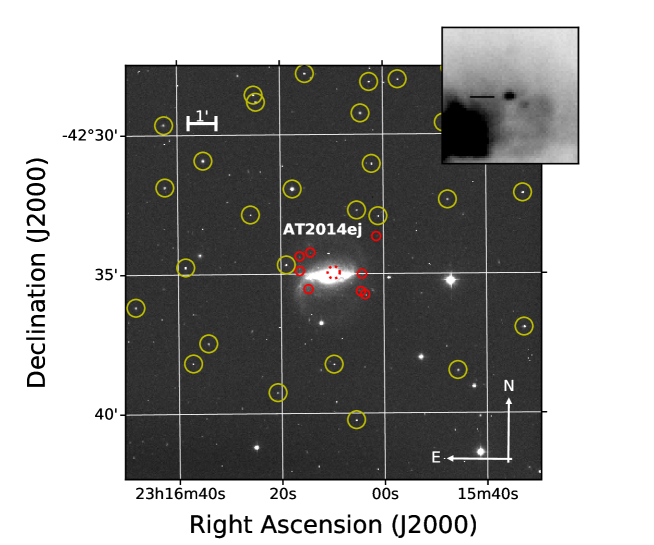
As shown below, AT 2014ej was recovered in unfiltered search images taken by CHASE about four days prior to the BOSS detection on 2014 September 20.06 with an apparent magnitude of . The J2000 coordinates of AT 2014ej are and , which is west and north from the core of its SBab host galaxy NGC 7552. A finding chart of NGC 7552 is shown in Fig. 1.
Morrell et al. (2014) obtained a visual wavelength spectrum with the du Pont telescope located at the Las Campanas Observatory (LCO) on 2014 September 27.2 UT and classified AT 2014ej as a SN imposter. This early spectrum exhibits Balmer line velocities of 800 km s-1. As the transient appeared to be caught on the rise, the CSP-II decided to include it within its followup program.
According to NED, NGC 7552 is located at a heliocentric redshift of (1608 km s-1). To convert this redshift into distance, we adopted the following cosmological parameters: km s-1 Mpc-1 (Burns et al. 2018), , and , as well as a correction from NED based on Virgo, Great Attractor, and Shapley in-flow models. According to this, the redshift distance corresponds to a distance modulus of mag and hence the distance Mpc.
As NGC 7552 is a member of the Grus Quartet, we turn to distance estimates of the group itself as well as to the individual members NGC 7582, NGC 7590, and NGC 7599. NED lists five different Tully-Fisher distances for NGC 7582, with the most recent being mag. NED also lists a handful of Tully-Fisher distances to NGC 5790, with the most recent being from the Cosmicflows-2 catalog (Tully et al. 2013) , corresponding to mag. Finally, NED also lists a variety of Tully-Fisher distances for NGC 7599, with the two most recent values coming in as mag from the Cosmicflows-2 catalog (Tully et al. 2013) and mag from the Cosmicflows-3 catalog (Tully et al. 2016).
NGC 7582 and NGC 7552 are interacting, as is shown by tidal extension of HI between the galaxies (Dahlem 2005). The distance modulus of NGC 7582 is mag, in agreement with the distance modulus of NGC 7552 as computed from its redshift. In the following, we adopt mag as the distance modulus to NGC 7552.
Finally, in Appendix A we compute the host metallicity using a spectrum of NGC 5775 obtained by the Sloan Digital Sky Survey (SDSS), while Appendix B contains details on the total reddening value used in this work. In short, we find the metallicity at the location of AT 2014ej to be super-solar, and our best estimate for the total visual extinction of AT 2014ej is mag.
2.2 Observations
The CSP-II obtained 20 epochs of optical -band imaging with the Swope (+ CCD camera) telescope, extending between 5 d to 37 d relative to first detection.222First detection of AT 2014j was made by CHASE and occurred on JD-2456920.56. In addition, three epochs of NIR -band imaging were obtained with the du Pont (+ RetroCam) telescope between 9 d to 12 d, as well as a single epoch of -band photometry taken with the Magellan Baade telescope equipped with the FourStar imager (Persson et al. 2013) on 17 d.
CSP-II photometry of the transient was computed relative to an optical/NIR local sequence consisting of 27/7 stars, themselves calibrated relative to standard star fields observed over multiple photometric nights. Optical () and NIR () photometry of the local sequence stars in the ‘standard’ system are listed in Table 1 and Table 2, respectively. Optical photometry of AT 2014ej in the ‘natural’ photometric system is listed in Table 3, while Table 4 lists the NIR photometry also in the CSP-II natural system. Finally, a single -band epoch of photometry was calibrated relative to 2MASS stars in the field of NGC 7552 and is also listed in Table 4.
AT 2014ej was observed by CHASE (Pignata et al. 2009) with the PROMPT telescopes (Reichart et al. 2005) located at CTIO. We detect AT 2014ej in 14 epochs of unfiltered images. This includes the earliest detection and the subsequent detection in survey search images extending over 95 d. The images were reduced following standard procedures, and photometry of AT 2014ej was computed relative to the -band photometry of the CSP-II local sequence of stars in the field of the host galaxy. Prior to computing photometry, a deep host-galaxy template image was constructed and used to subtract the host light at the position of the transient. The stacked images were obtained prior to the discovery of AT 2014ej. Unfiltered photometry obtained with the PROMPT telescopes is listed in Table 5.
PESSTO obtained a handful of -band images with the NIR imager SOFI (Son OF ISAAC; Moorwood et al. 1998) attached to the ESO New Technology Telescope (NTT)333See details in the PESSTO third data release documentation located at the url http://www.eso.org/rm/api/v1/public/releaseDescriptions/88.. Point-spread function (PSF) photometry of the transient was calibrated relative to 2MASS stars in the field of NGC 7552, and the results are listed in Table 6. This includes a single epoch of -band photometry and three epochs of -band photometry.
Five epochs of low-resolution visual wavelength spectroscopy of AT 2014ej were obtained between 7 d to 72 d, and these observations are summarized in Table 7. These spectra include data taken by the CSP-II with the du Pont ( WFCCD) telescope and by PESSTO with the NTT (+ EFOSC2) and a previously published spectrum obtained with the ANU telescope ( WiFes; Childress et al. 2016). The spectroscopic data were reduced following standard procedures. In addition to these low-resolution spectra, a single medium-dispersion spectrum was obtained on 11 d with the 6.5m Magellan Clay telescope equipped with MIKE (Magellan Inamori Kyocera Echelle; Bernstein et al. 2003). The MIKE spectrum followed standard procedures and made use of IRAF444IRAF is distributed by the National Optical Astronomy Observatory, which is operated by the Association of Universities for Research in Astronomy (AURA) under cooperative agreement with the National Science Foundation. echelle routines and the mtools standard package developed by Jack Baldwin.
Finally, we note that the -band acquisition images taken in the process of obtaining spectroscopic followup of AT 2014ej with the NTT were used to measure -band photometry in four different epochs, three of which occurred after the end of the CSP-II NIR followup. PSF photometry of AT 2014ej was computed from these images and calibrated relative to the CSP-II -band local sequence. The resulting photometry is listed in Table 8. With the band from CSP-II and PESSTO acquisition images, we performed an absolute flux calibration of the spectra, and from these, we obtained spectrophotometry in the bands. Because the host galaxy flux might be contaminated, we assumed a conservative 0.1 mag error on spectrophotometry, which is listed in Table 9. Spectrophotometry was useful to cover bands at epochs after 24 d.
3 Results
3.1 Photometry, broadband colors, and SEDs
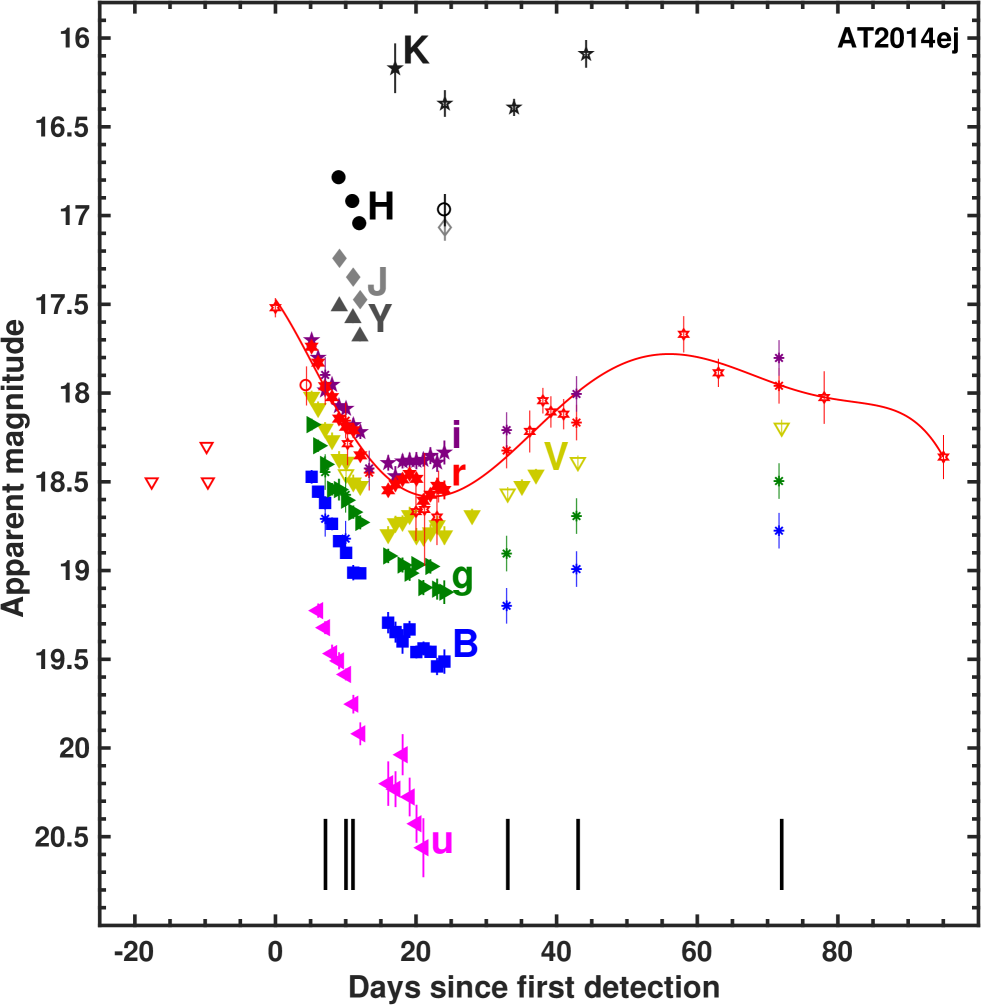
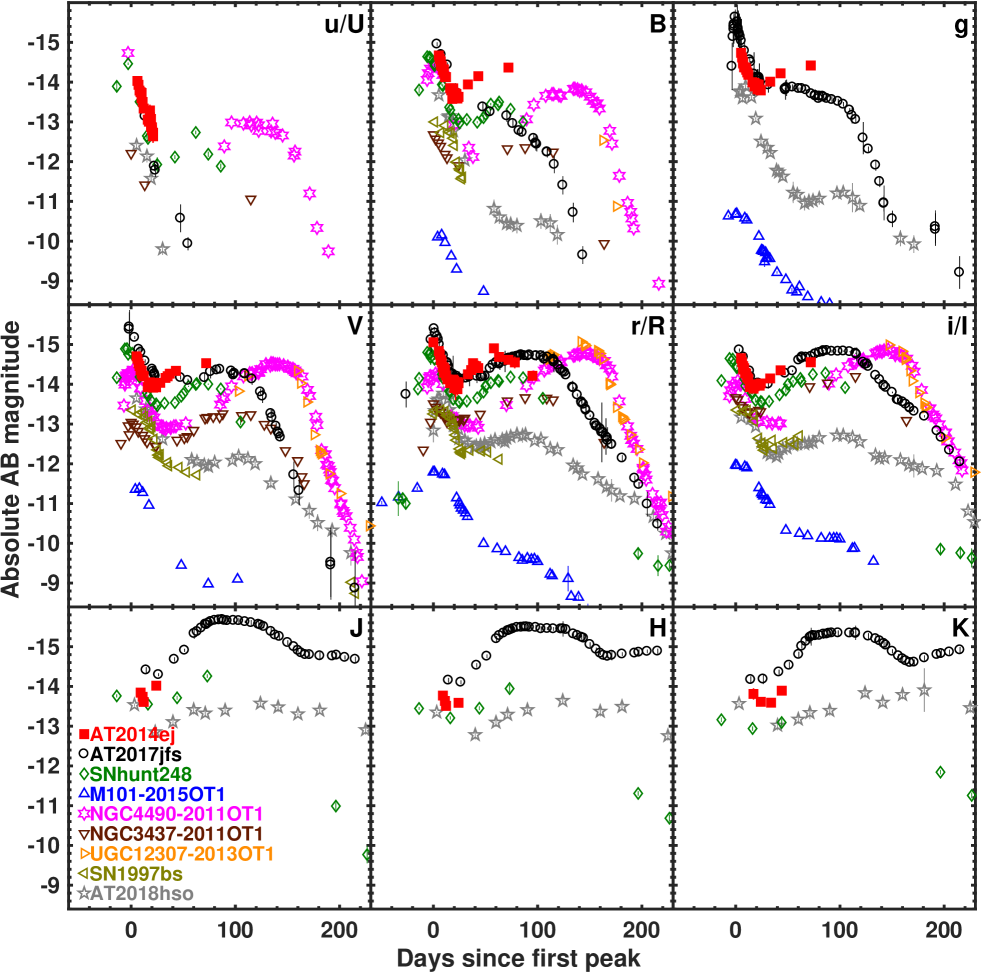
Photometry of AT 2014ej is plotted in Fig. 2. Post detection, the optical light curves decline in brightness, exhibiting a drop between 0.5 to 1.0 mag over the first ten days. This decline continues in all bands out to 15 d. Subsequently, as the band continues to exhibit a rapid drop in brightness, the - and -band light curves significantly slow down in their rate of decline, while the -, -, and -band light curves exhibit a plateau phase that last about ten days. In the CHASE -band data, the PESSTO -band images, and spectrophotometry in bands, we observe a rise in the light curves from each of these optical bands after +24d. The rise in the band goes from 18.5 mag up to 17.7 mag between 24 d and 60 d, followed by a shallow decline reaching 18.4 mag at 95 d.
The first CHASE detection of AT 2014ej reveals a peak apparent magnitude of 17.5, corresponding to a peak absolute magnitude of , given the assumed extinction and distance modulus. The accompanying uncertainty is computed by adding in quadrature the errors in adopted reddening and distance. Taking an average between the dates of last nondetection and first detection, we estimate an outburst date of JD=2456915.754.80.
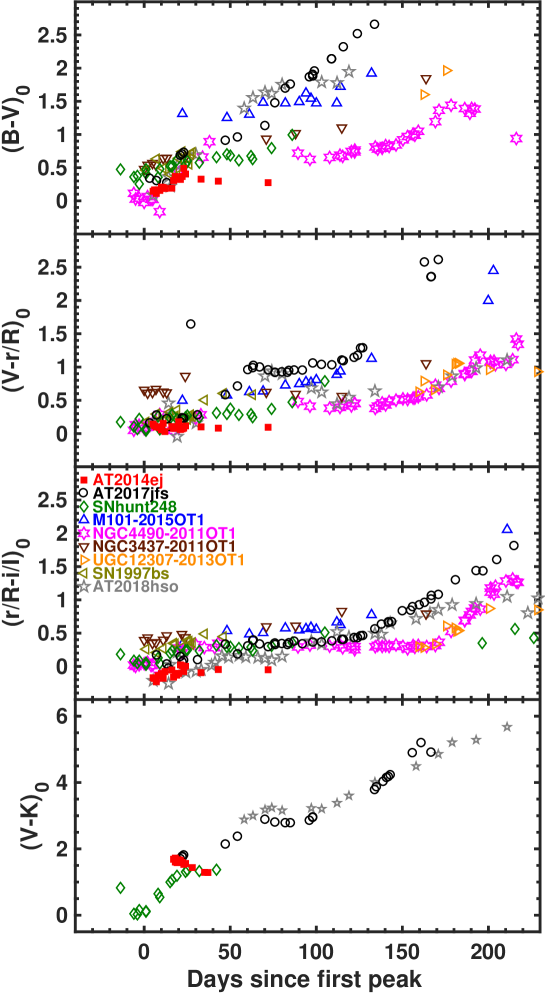
In the three top panels of Fig. 3 we plot the intrinsic optical colors of AT 2014ej compared to those of known LRNe candidates: SN 1997bs (Van Dyk et al. 2000; Pastorello et al. 2019b), NGC 3437-2011-OT1 (Pastorello et al. 2019b), NGC 4490-2011-OT1 (Pastorello et al. 2019b), UGC 12307-2013-OT1 (Pastorello et al. 2019b), M101-2015-OT1 (Blagorodnova et al. 2017), SNhunt248 (Kankare et al. 2015), AT 2017jfs (Pastorello et al. 2019a), and AT 2018hso (Cai et al. 2019). The comparison objects have been corrected for reddening, adopting color excess values listed in Table 10.
Our observations of AT 2014ej cover the first d of color evolution corresponding to the object’s first and second peak. At the earliest epochs, the intrinsic color is 0. This places it among the bluest objects in the comparison sample, similar to NGC 4490-2011-OT1. Over the period following the first light-curve peak, up to 24 d, the colors of AT 2014ej also evolve very similarly to those of the comparison sample. Close inspection reveals that the colors of AT 2014ej evolve rapidly to red, similar to the comparison sample. However, during the rise and after the second peak, the and colors of AT 2014ej are clearly bluer than those of the other objects.
To conclude our investigation into the color curves of AT 2014ej, we plot in the bottom panel of Fig. 3 is its intrinsic color curve along with those of AT 2017jfs, SNhunt128, and AT 2018hso. Although the temporal coverage of AT 2014ej is relatively limited, its colors match those of the comparison objects well during the overlapping phases. This provides additional confidence that AT 2014ej is indeed an LRN.
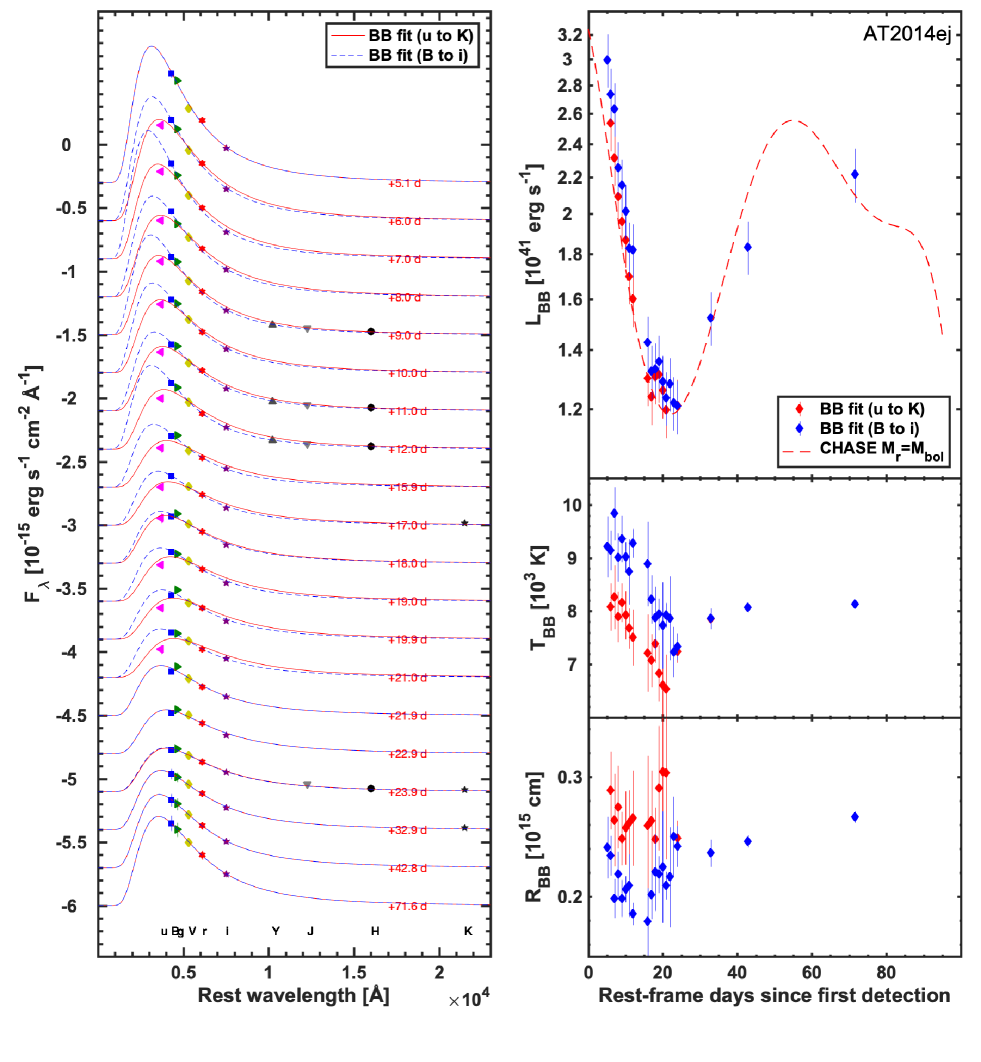
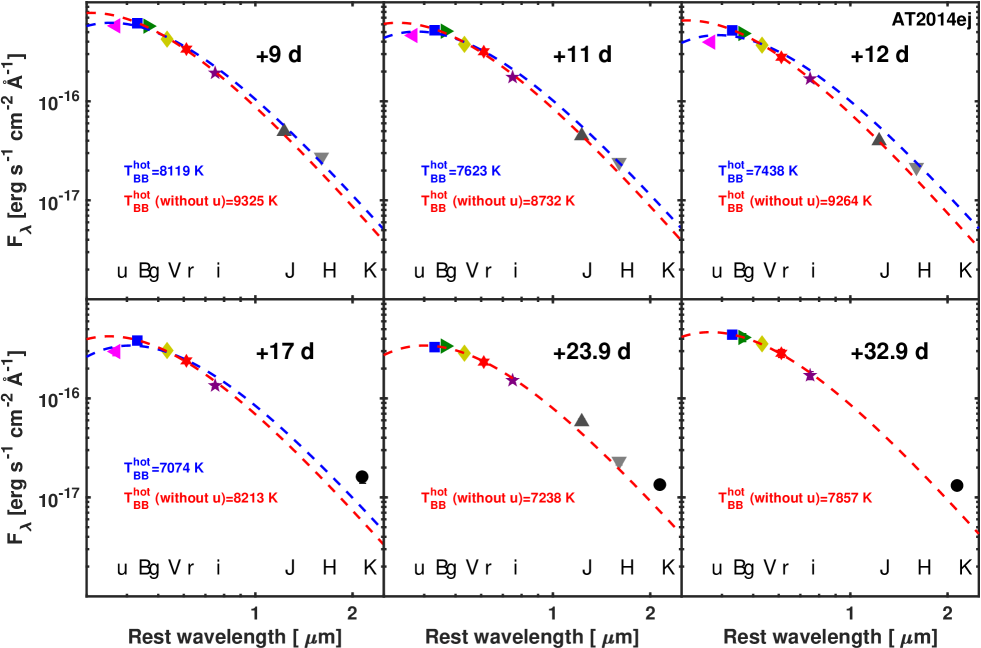
We constructed the spectral energy distributions (SEDs) of AT 2014ej following the same procedure as for SNhunt120 (see Paper 1, Sect. 3.1). We plot in Fig. 4 the reddening-corrected SEDs of AT 2014ej. These SEDs are relatively well reproduced by a single blackbody (BB) at all epochs (red solid line in the left panel), including the epochs when some NIR () photometry is also available. Because of line blanketing, the -band flux points lie below the fitted BB function. To facilitate a more consistent comparison of the bolometric properties at epochs with different wavelength coverage, we also present a single BB fit limited to the bands in common at all epochs, that is, from to , and this is plotted as dashed blue lines in the left panel. Because the band was excluded, we obtain BB curves that tend to peak at bluer wavelengths than when we include all the bands in our BB fitting.
On 9 d, 11 d, 12 d, 17 d, 23.9 d, and 32.9 d, we have NIR broad-band measurements. When plotted along with the other flux points in log-log space, they reveal a non-negligible excess of flux in the band, as compared to the single BB fit (including and excluding band), which might be an indication of dust emission at redder wavelengths. These six SEDs are plotted in Fig. 5 along with single BB fits that include and exclude the -band flux point. A conclusively determination whether the excess is due to dust emission would require mid-IR (MIR) observations, which unfortunately were not taken.
The BB-radius and BB-temperature profiles associated with the photosphere and the bolometric light curve of AT 2014ej are also plotted in Fig. 4. Profiles for both of these parameters are shown for fits including all the bands and fits only including between the and bands. Excluding the band produces a radius that is smaller by about 0.051015 cm than including it, and a higher temperature by about 1000 K. The BB luminosity does not change significantly between the two BB fit approaches. The bolometric properties obtained by fitting a BB over the wavelength range including the and bands show that the BB radius initially declines from cm to below cm, and then, beginning at about 20 d, rises to cm. The BB temperature declines from K to K, followed by an increase to 8000 K during the rise to and following the second peak.
After the initial (until +15 d) decline (from 3.0 to 1.3 erg s-1), the luminosity remains almost constant, reaching 1.21041 erg s-1 at 24 days. The complete multiband CSP-II light-curve data of AT 2014ej only extend to +24 d. However, when we consider the CHASE -band light curve, the PESSTO - and -band data, and spectrophotometry, we can add a few points that show a rebrightening at +33 d, +43 d and +72 d, forming a second peak. When we convert the CHASE absolute band to a bolometric luminosity assuming , the luminosity evolution of AT 2014ej is extended up to 95 d. This is overplotted in the top right panel of Fig. 4 as the dashed line. The band reproduces the bolometric light curve rather well after the initial epochs when the flux comes predominantly from bluer wavelengths. If our assumption is valid, the luminosity has a second peak that reaches a luminosity of erg s-1.
3.2 Spectroscopy
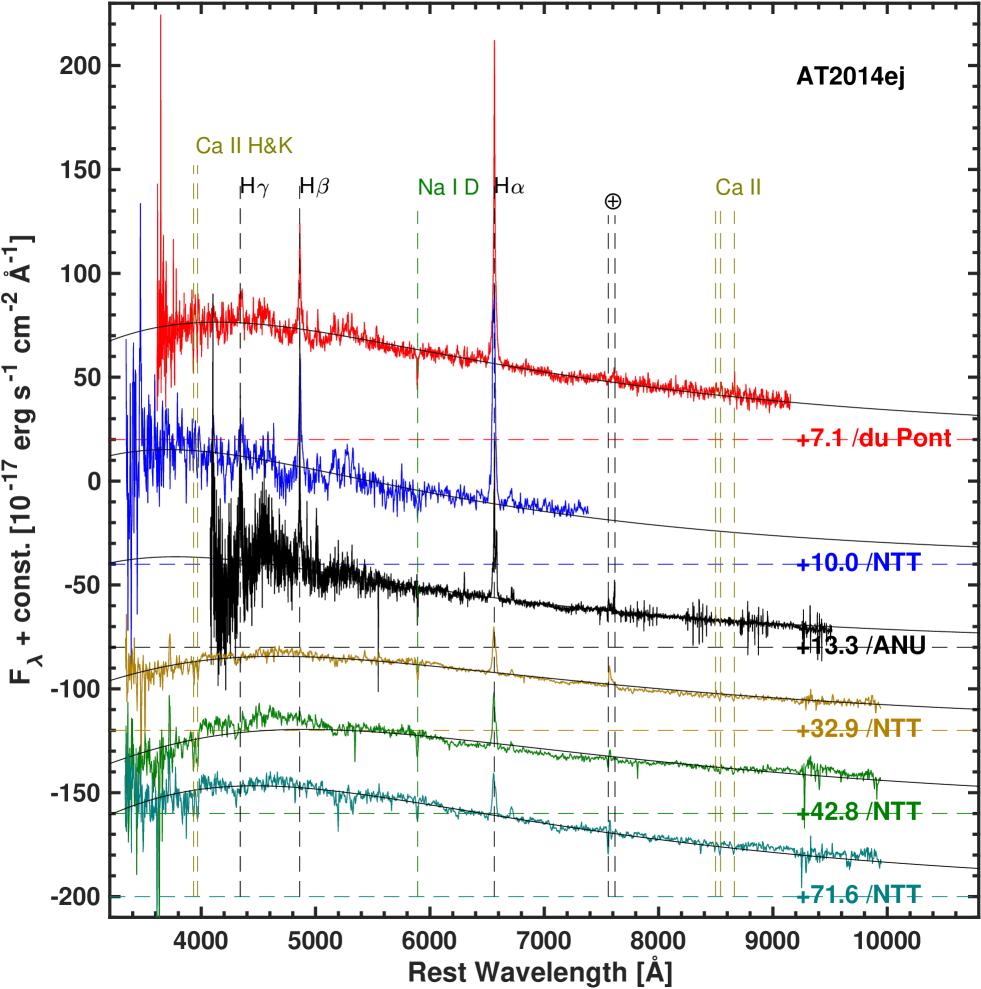
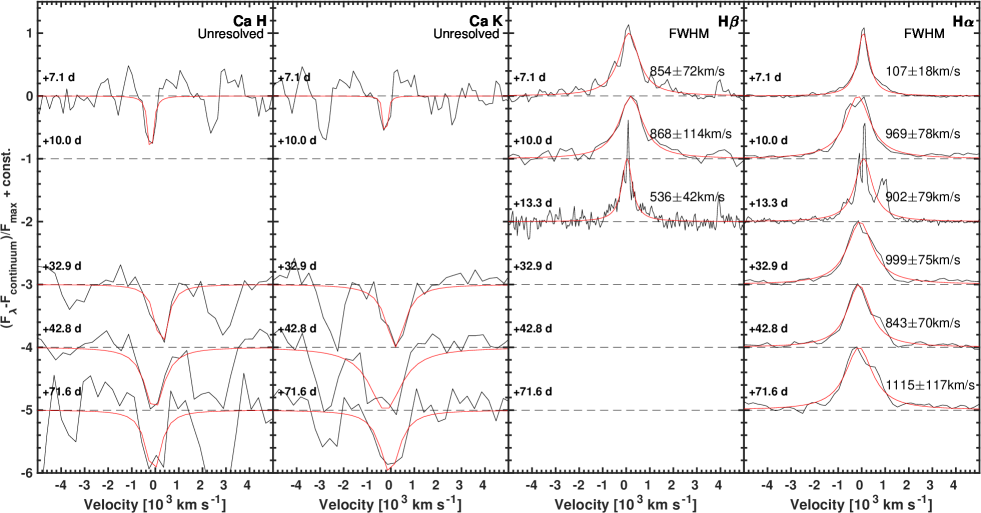
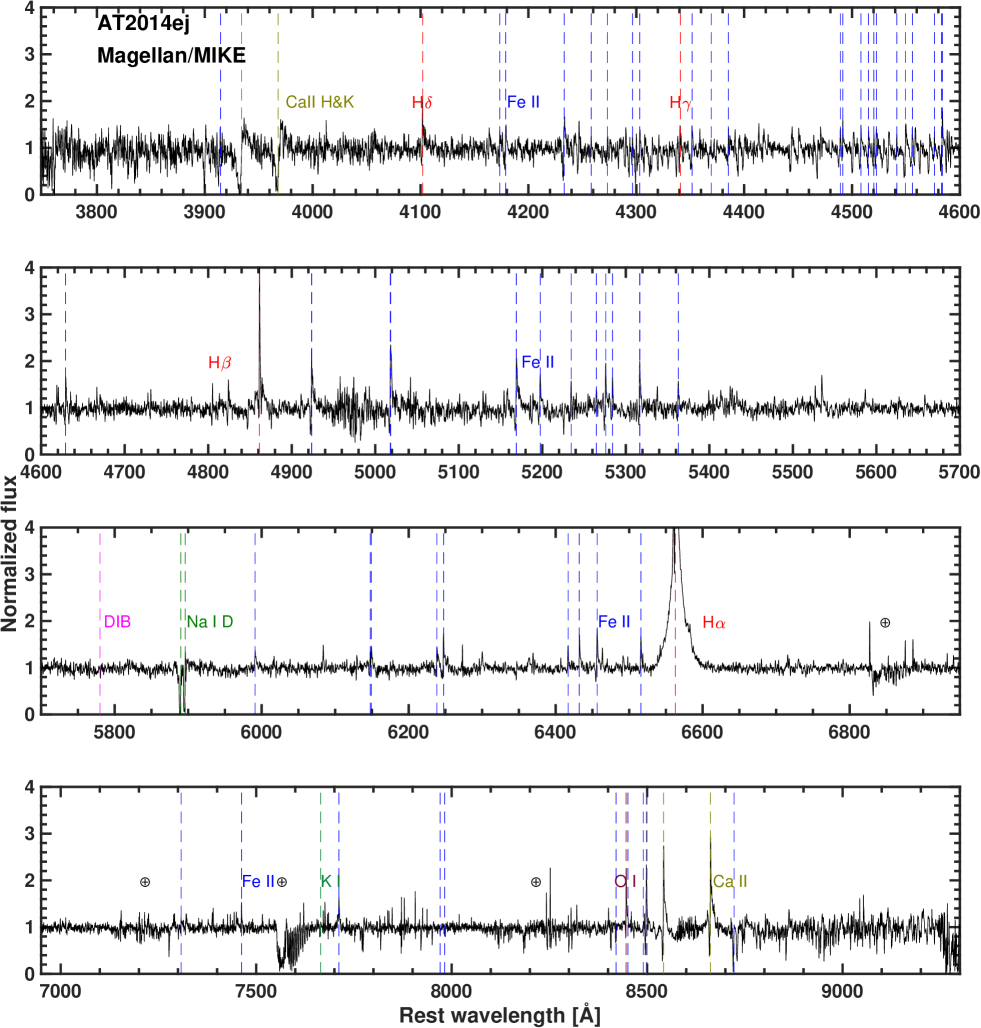
Six epochs of low-resolution visual wavelength spectra of AT 2014ej are plotted in Fig. 6; they extend between +7 d and +72 d relative to first detection. The main features characterizing the spectra are the narrow Balmer lines in emission and Ca ii H&K in absorption. The spectral continuum becomes redder with time. The velocities of the lines, corrected for the spectral resolution, are shown in the top panel of Fig. 7, where the Balmer lines are shown to have a full width at half-maximum (FWHM) of about 900 km s-1, while the Ca ii absorption exhibits lower velocities and is unresolved. In the ANU (+ WiFes) spectrum at +13.3 d, which has a higher resolution than the NTT (+ EFOSC2) spectra, it is possible to see that the presence of [N ii] from the host galaxy modifies the H profile. The spectrum also indicates a narrow P Cygni profile for H and H.
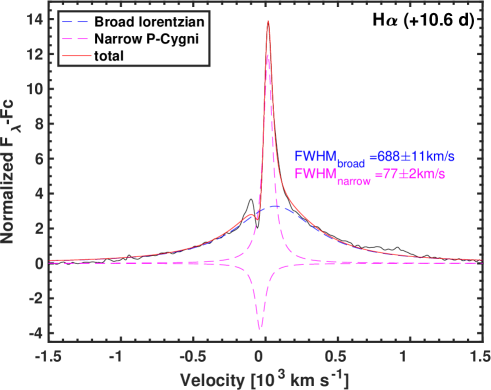
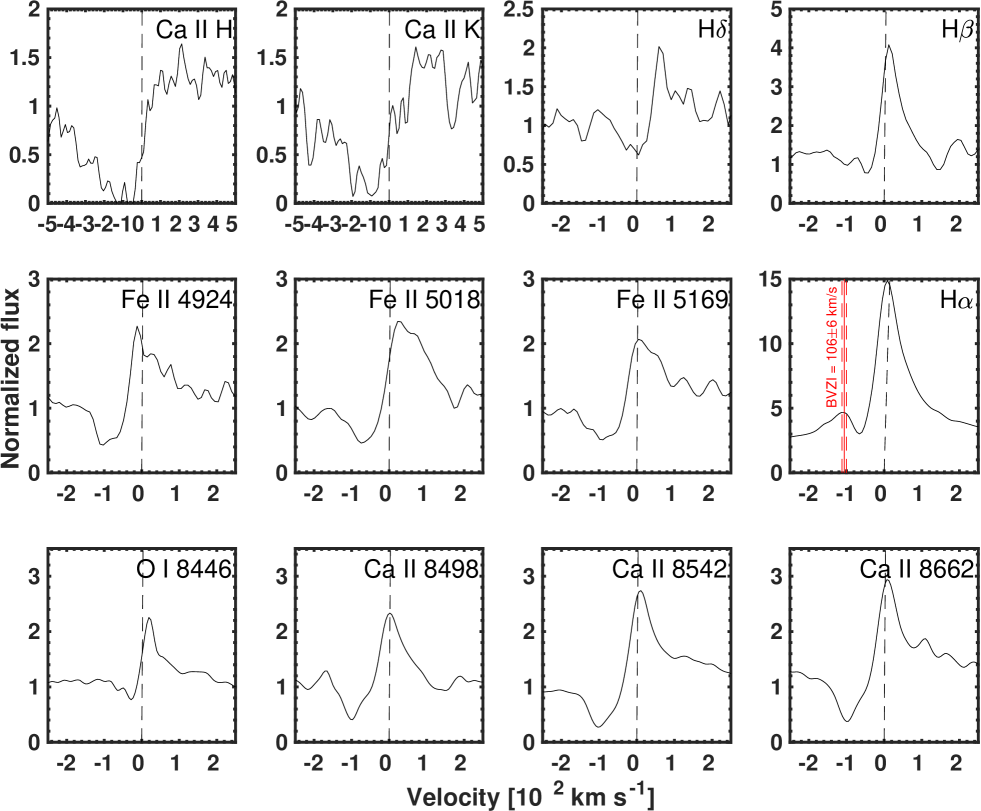
The higher dispersion MIKE spectrum obtained on d is shown in Fig. 8 and reveals a clear narrow P Cygni component associated with each of the spectral features that are plotted (in velocity space) in Fig. 9. The narrow H P Cygni feature is measured to have a blue velocity at zero intensity (BVZI) of km s-1 and a P Cygni minimum velocity of km s-1. This line component is observed in many SNe IIn and is thought to be formed from outer unshocked circumstellar material (CSM) that is excited by the emission originating from the shock region (see, e.g., Kiewe et al. 2012; Taddia et al. 2013; Nyholm et al. 2019). As a result, the BVZI value of this component provides a measure of the CSM velocity.
In the bottom panel of Fig. 7 we show the entire profile of the H line in the MIKE spectrum. This is well reproduced by two components, a narrow P Cygni (given by two Lorentzians, one in emission and one in absorption) and a broader Lorenzian emission. The broad component has a velocity of about 690 km s-1 , whereas the narrow one has an FWHM of about 80 km s-1. These two components are not visible in the spectra with lower resolution (with the possible exception of the ANU spectrum) that are shown in the top panel of Fig. 7. The broader Lorentzian component in the H lines shown here could form from electron scattering, which would alter the narrow emission profile to a broader profile in a region in close proximity to the location of the CSM interaction.
The BVZI and absorption minimum velocities are approximately 100 km s-1 for all the lines except for Ca ii H&K, where the BVZI is about 500 km s-1. The higher velocity inferred from the Ca ii H&K feature might arise because it originates from material that is ejected during a massive binary merger.
3.3 Progenitor constraints
NGC 7552 was observed on a number of occasions with the HST (+ WFPC2) prior to the discovery of AT 2014ej. Unfortunately, the location of AT 2014ej lies a few pixels outside the field of view of WFPC2 in the earliest images taken in 2015 April. However, 2600s F218W images were obtained with HST (+ WFC3) on 1999 March 31 that do cover the position of AT 2014ej. Here only the center of the galaxy was clearly visible in the F218W data, and the lack of reference sources in the field prevents us from obtaining any precise astrometry. We therefore performed photometry with hstphot on a region contained within a 4040 pixel box centered on the coordinates of the transient, and extracted all sources detected with a -sigma significance. Within this region lies no source. With no candidate source in the region of the transient, we set an upper mag limit determined from the average magnitude of all point sources in the field with a -sigma detection.
A further set of pre-outburst images covering the site of AT 2014ej was taken between 2009 May 5-6 with HST (+ WFPC2). This includes deep images with the broadband filters (4400s), (1800s), (520s), and (520s), and as well with a narrow-band H (1800s) filter. The field of view (FOV) afforded by HST (+ WFPC2) is smaller than that of our post-outburst ground-based CSP-II data, and it is challenging to align the two images to precisely localize the position of AT 2014ej in the HST images. Using five sources common to both images, we find that the position of AT 2014ej lies at x,y pixel coordinate (75, 172) on the image.
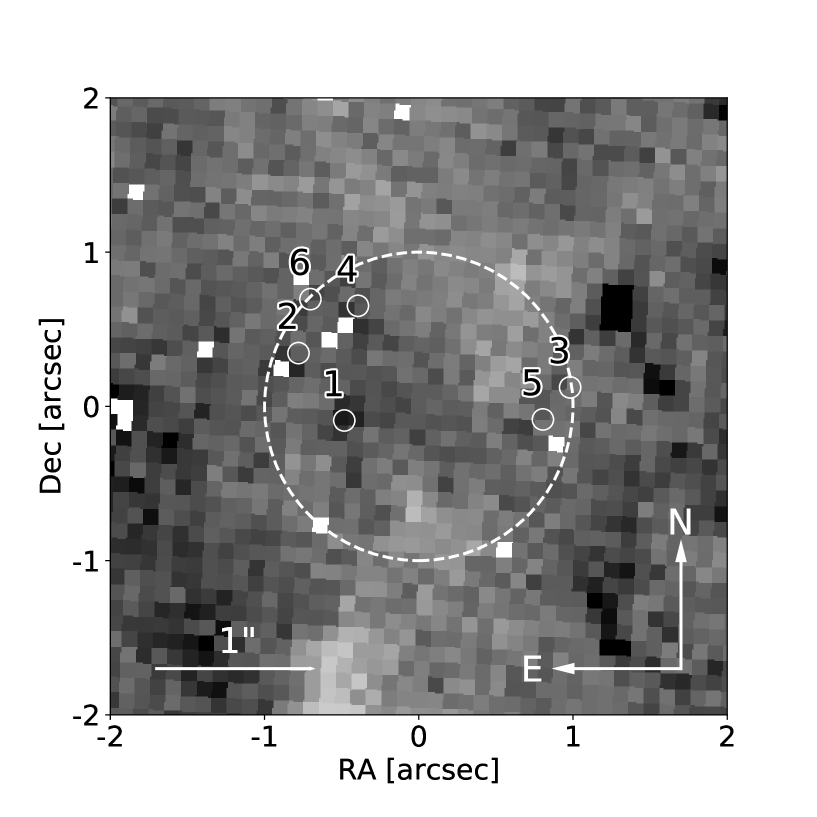
While the formal uncertainty in the geometric transformation between pre- and post-outburst images is WFPC2 pixel (), this probably is an underestimate due to the small number of sources used for the alignment. Adopting a conservative approach, we computed photometry for all sources detected at a -sigma significance within 1″of the position of AT 2014ej, which might possibly be progenitor candidates. None of the sources are measured to be brighter than the apparent magnitude . These sources are indicated in Fig. 10, along with the location of AT 2014ej. Here the area enclosed within the circle accounts for the uncertainty in the estimated position of AT 2014ej.
4 Discussion
4.1 AT 2014ej compared with luminous red nova candidates
Here the similarities between the observational properties of AT 2014ej to those of other LRNe are assessed. First we present a spectral comparison between AT 2014ej and the well-observed LRN AT 2017jfs, and then we compare the light curves of AT 2014ej to AT 2017jfs and an expanded sample of LRNe from the literature.
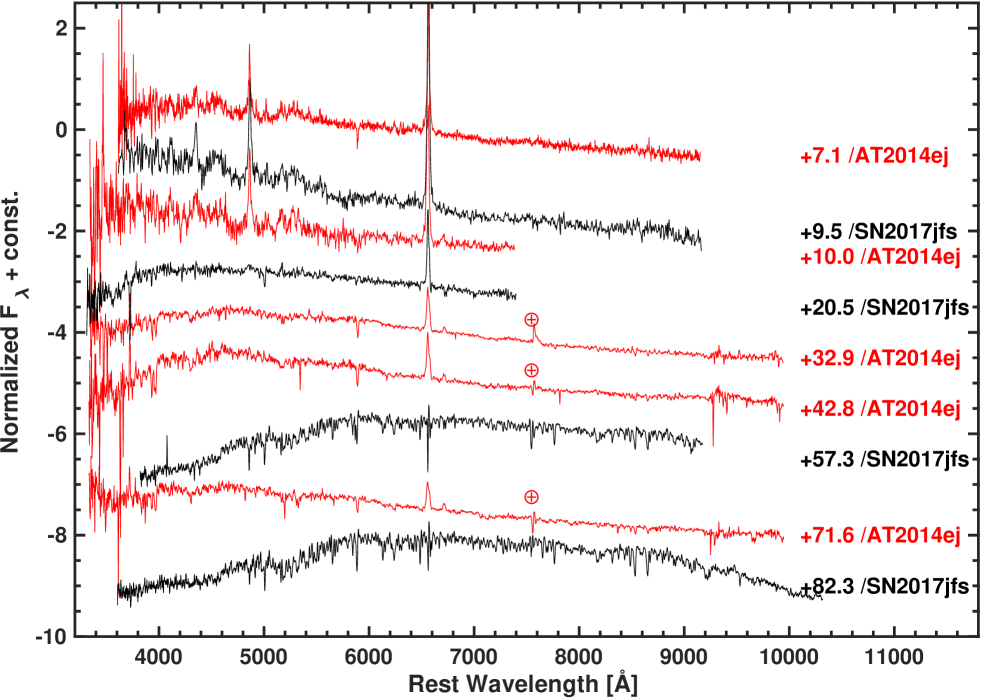
Visual wavelength spectra of AT 2014ej and AT 2017jfs are plotted in Fig. 11. At early times, which coincide with their first peak (see below), the two objects are strikingly similar, exhibiting nearly identical narrow spectral features, most notably, narrow Balmer emission lines and some metal lines blueward of H. As the two objects evolve toward their second peak (see below), the strength of H decreases while the H feature disappears. Furthermore, beyond 60 d, the H continues to decrease in AT 2014ej and becomes absent in AT 2017jfs. During the same period, the spectra of AT 2017jfs evolve further to the red, while those of AT 2014ej on 71.6 d show little evolution. This behavior may be linked to AT 2014ej being brighter than AT 2017jfs at these phases (see below). Unfortunately, we lack spectral observations of AT 2014ej at even later phases, and are therefore unable to document the expected emergence of molecular overtones consistent with the spectrum of a late-type star and the restrengthening of H, as seen in LRNe such as AT 2017jfs (Pastorello et al. 2019a).
In Fig. 12 the absolute magnitude light curves of AT 2014ej are compared to those of eight other LRN candidates, including: SN 1997bs, NGC 3437-2011-OT1, NGC 4490-2011-OT1, UGC 12307-2013-OT1, M101-2015-OT1, SNhunt248, AT 2017jfs, and AT 2018hso. The comparison light curves have been adjusted for reddening and placed on the absolute magnitude scale, for which we adopted the color excess values and the distance moduli listed in Table 10. Although the light curve of AT 2014ej is limited in phase coverage, its shape and absolute magnitudes resemble the double peak of the other well-observed LRNe. In particular, the and bands evolve very much like that of AT 2017jfs. The CHASE unfiltered light curve of AT 2014ej reveals a second peak that is 0.23 mag fainter than at discovery. The strength and phase of the secondary peak of AT 2014ej is similar to that of SNhunt248; it occurs about 100 d earlier than the peaks of M101-2015-OT1 and NGC 4490-2011-OT1, both of which exhibit a second peak that occurs well after 100 d.
We conclude this part of the analysis with a return to Fig. 1 of Paper 1, which compares the peak absolute -band magnitude with the -band light curve decay (defined as the time in days for the light curve to drop one magnitude). Our lower limit value of AT 2014ej places it well within the parameter space that is populated by other well-observed LRNe. When we consider that AT 2014ej was discovered somewhat past its first peak, it is clearly one of the brightest LRN studied so far (see below).
4.2 Direct observational evidence for linking (luminous) red novae to common-envelope events
Because a common-envelope (CE) phase is short (about yr, Meyer & Meyer-Hofmeister 1979; Podsiadlowski 2001), it is extremely rare to detect this ephemeral phase of stellar evolution. Nevertheless, a number of candidates for direct observations of CE events have been proposed, with a prime candidate being red novae. In particular, V1309 Sco (a V838 Mon-class event) serves as one of the most promising examples of an active CE event (or merger) that is caught in action (Tylenda et al. 2011; Ivanova et al. 2013). V1309 Sco was the first stellar event to provide conclusive evidence that contact binary systems end their evolution in a stellar merger. The rate of red novae events has been estimated to be as high as 20% of the core collapse SN rate (Thompson et al. 2009). However, this 20% was computed without considering the difference between LRNe and ILRTs, which means that they were all considered to be the same type of objects. This value was therefore overestimated. A value of 5% was discussed in Botticella et al. (2009) when they presented SN 2008S.
Another promising example with a convincing link to a CE event is that of the LRN M31-2015-OT1 , whose final progenitor binary system has been investigated (Williams et al. 2015; Lipunov et al. 2017; Blagorodnova et al. 2020) and simulated in detail (MacLeod et al. 2017). It has been suggested that this event, along with a number of other LRNe, might simply be more scaled-up versions of normal red novae (typically fainter than ), thus resulting from merger events involving more massive stars than the less luminous red novae (Blagorodnova et al. 2017; Smith et al. 2016; Lipunov et al. 2017; Mauerhan et al. 2018; MacLeod et al. 2018; Pastorello et al. 2019b). There seems to be consensus in the literature for a direct link between the luminosities of various red novae phenomena and the masses of the stellar components undergoing coalescence (CE evolution). More specifically, the fainter red novae involve stellar masses of , such as V838 Mon and most likely have components; whereas the LRNe stellar masses are thought to be a few (Metzger & Pejcha 2017). In a recent population synthesis study, Howitt et al. (2019) reported a Galactic LRNe rate of , in agreement with the observed rate. They also argued that the Large Synoptic Survey Telescope will observe 20–750 LRNe per year. Such a rate will enable us to estimate the luminosity function of LRNe and reveal the diversity among CE events.
Pastorello et al. (2019b) provided a comprehensive review and discussion of the properties and progenitors of red novae and LRNe. The double-peaked light curves are still debated, but could be explained with a CE event by an initial ejected envelope, producing the low-luminosity light curve peak, followed by the merger of the secondary star onto the core component of the primary star. Metzger & Pejcha (2017) proposed that these double-peaked light curves arise from a collision between a dynamically ejected fast shell of material associated with the terminal stage of the CE merger with preexisting slow equatorial circumbinary material shed from the plunge-in of the secondary star during the early phase of in-spiral. In this scenario, the first optical peak arises through cooling envelope emission, and the second light-curve peak is powered by subsequent radiative shocks in the equatorial plane. Moreover, differences between various red gap transients might be explained by different viewing angles of observers with respect to the orbital plane of the progenitor binary (see Fig. 2 of Metzger & Pejcha 2017), along with several other key parameters characterizing the progenitor system.
Glebbeek et al. (2013) have studied the evolution of stellar mergers formed by a collision involving massive stars. They concluded that mass loss from the merger event is generally small (% of the total mass for equal-mass star mergers at the end of the main sequence) and that little hydrogen is mixed into the core of the merger product. This amount of mass loss may be sufficient to explain the double-peaked light curves in LRNe events, making this a viable model.
4.3 UVOIR light curves of luminous red novae
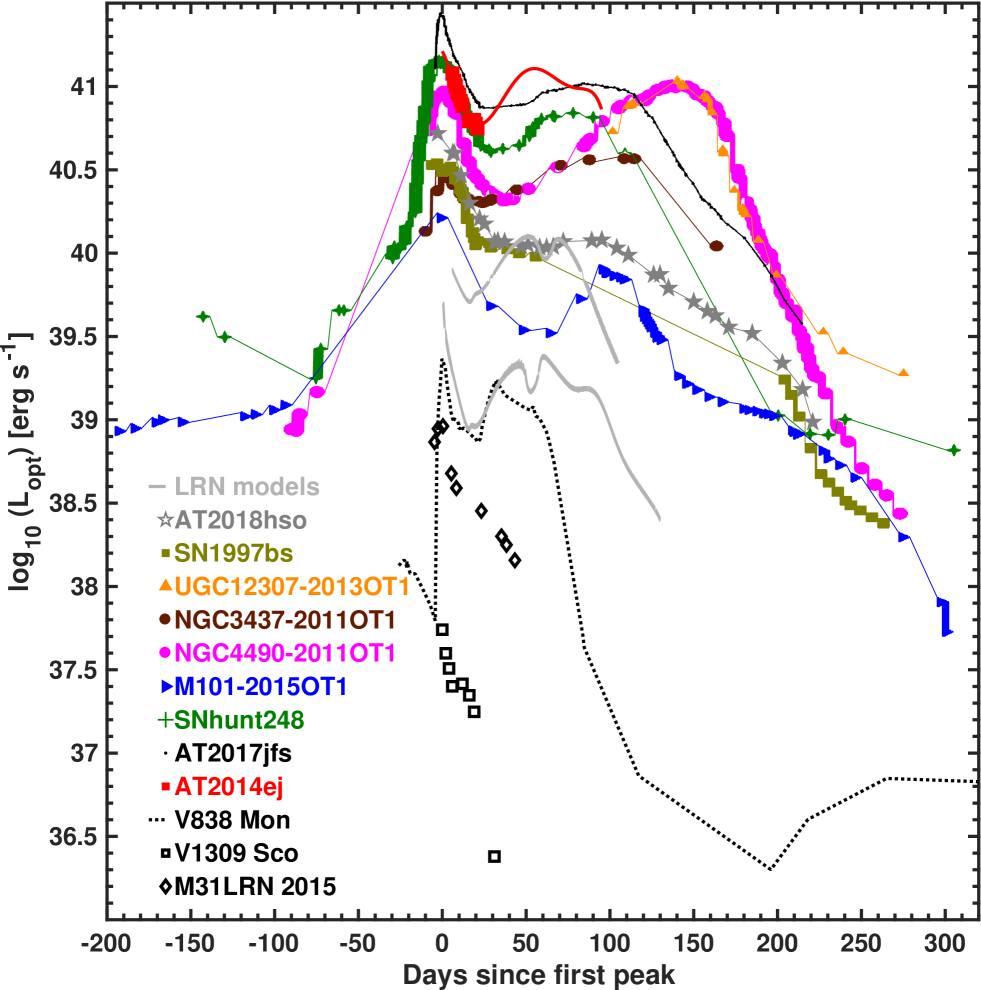
We plot in Fig. 13 the UVOIR light curve of AT 2014ej, compared to those of our LRNe comparison sample. The overall morphology of the entire sample is similar, with all of the objects displaying a double-hump light curve typically of most LRNe. However, as previously noted by Pastorello et al. (2019b) and as shown in Fig. 13, there is diversity. This includes the luminosity of both peaks and the phase of the second peak relative to the first peak. Nevertheless, in general, there appears to be a correlation between the luminosity of the two peaks. In other words, objects whose first peak is located at the bright end of the luminosity distribution (i.e., AT 2017jfs, SNhunt248, NGC 4490-2011-OT, and AT 2014ej) also have secondary maxima at the bright end of the luminosity distribution. If this trend holds for a more populated sample, we might speculate that the luminosity of the second peak may scale with the masses of the involved ejecta and CSM undergoing circumstellar interaction.
We also plot in Fig. 13 the two closest matching light-curve models published by Metzger & Pejcha (2017) and discussed above. These include their fiducial model computed for a 10 system characterized with the semimajor axis and with a predynamical mass runaway time of , where corresponds to the in-spiral dynamical timescale. The second synthetic light-curve model corresponds to the fiducial model with the mass increased to 30 . This results in a brighter light curve relative to the fiducial model, but in general, the model fails to reach the luminosities exhibited at both peaks (by a factor of 10-15) for all but the faintest LRN M101-2015-OT1. In light of the differences in luminosity and the timescales describing the rise and decline of the second peak, it would be interesting to see the model calculations extended to even more massive systems, higher values of , and even modifications to the assumed growth rate of predynamical mass loss.
5 Conclusion
In this study we have added observations to the growing populations of luminous red novae (LRNe). Our observational data set of AT 2014ej demonstrates characteristics of other LRNe, including the double-humped light-curve evolution that is ubiquitous to this class of red transients. These double-humped light curves are reminiscent of the long-lasting type IIn SN 2006jd, which Stritzinger et al. (2012) argued to be produced by SN ejecta interacting with CSM located in a torus around the progenitor, and ejected during its pre-SN phase (Chugai & Danziger 1994). Similarly, Metzger & Pejcha (2017) attributed the second peaks observed in most LRN to material ejected following the CE merger of two massive stars that interacts with slow equatorial circumbinary material, previously ejected during the early phase of in-spiral. The Metzger & Pejcha models plotted in Fig. 13 exhibit a similar trend in their overall evolution to the trend in the LRN comparison sample. However, the models underpredict the luminosities of both peaks, and the timescales describing the evolution of the second peak differ. Perhaps future efforts of modeling such systems should extend beyond the parameter space thus far considered.
To conclude, we wish to consider that less than a decade ago, our understanding of gap transients was significantly limited. In just a short time period, however, the landscape of gap transients has grown to be populated by various subtypes ranging from LBV eruptions to ILRTs possibly associated with electron capture supernovae, LRNe produced during the CE phase of massive binaries, and even to the faintest 2008ha-like SNe whose origins remain unknown. Efforts to further unravel the intricacies of gap transients will require detailed followup over long periods, while significant advancement in identifying the underlying progenitor populations of these objects can be expected with IR observations made with the James Webb Space Telescope.
Acknowledgements.
We thank the referee for a constructive report that improved the presentation of our manuscript. A special thanks to Ian Thompson for obtaining the medium-dispersion spectrum of AT 2014ej and to Massimo Della Valle for endearing comments. The CSP-II has been funded by the USA’s NSF under grants AST-0306969, AST-0607438, AST-1008343, AST-1613426, AST-1613455, AST-1613472 and also in part by a Sapere Aude Level 2 grant funded by the Danish Agency for Science and Technology and Innovation (PI M.S.). M.S., F.T. and E.K. are supported by a project grant (8021-00170B) from the Independent Research Fund Denmark (IRFD). Furthermore, M.S. and S.H. are supported in part by a generous grant (13261) from VILLUM FONDEN. M.F. is supported by a Royal Society - Science Foundation Ireland University Research Fellowship. T.M.T. acknowledges an AIAS–COFUND Senior Fellowship funded by the European Union’s Horizon 2020 Research and Innovation Programme (grant agreement no 754513) and Aarhus University Research Foundation. L.G. is funded by the European Union’s Horizon 2020 research and innovation programme under the Marie Skłodowska-Curie grant agreement No. 839090. This work has been partially supported by the Spanish grant PGC2018-095317-B-C21 within the European Funds for Regional Development (FEDER). Support for J.L.P and G.P. is provided by the Ministry of Economy, Development, and Tourism’s Millennium Science Initiative through grant IC120009, awarded to The Millennium Institute of Astrophysics, MAS. N.B.S. acknowledges support from the NSF through grant AST-1613455, and through the Texas A&M University Mitchell/Heep/Munnerlyn Chair in Observational Astronomy. Support for J.L.P. is provided in part by FONDECYT through the grant 1191038 and by the Ministry of Economy, Development, and Tourism’s Millennium Science Initiative through grant IC120009, awarded to The Millennium Institute of Astrophysics, MAS. This research has made use of the NASA/IPAC Extragalactic Database (NED), which is operated by the Jet Propulsion Laboratory, California Institute of Technology, under contract with the National Aeronautics and Space Administration. We acknowledge the usage of the HyperLeda database. Based on observations made with ESO Telescopes at the La Silla Paranal Observatory under programmes 191.D-0935 and 096.B-0230.References
- Adams et al. (2016) Adams, S. M., Kochanek, C. S., Prieto, J. L., et al. 2016, MNRAS, 460, 1645
- Bacon et al. (2014) Bacon, R., Vernet, J., Borisova, E., et al. 2014, The Messenger, 157, 13
- Bernstein et al. (2003) Bernstein, R., Shectman, S. A., Gunnels, S. M., Mochnacki, S., & Athey, A. E. 2003, in Proc. SPIE, Vol. 4841, Instrument Design and Performance for Optical/Infrared Ground-based Telescopes, ed. M. Iye & A. F. M. Moorwood, 1694–1704
- Blagorodnova et al. (2020) Blagorodnova, N., Karambelkar, V., Adams, S. M., et al. 2020, arXiv e-prints, arXiv:2004.04757
- Blagorodnova et al. (2017) Blagorodnova, N., Kotak, R., Polshaw, J., et al. 2017, ApJ, 834, 107
- Bock et al. (2014) Bock, G., Marples, P., Parker, S., et al. 2014, Central Bureau Electronic Telegrams, 3998, 1
- Botticella et al. (2009) Botticella, M. T., Pastorello, A., Smartt, S. J., et al. 2009, MNRAS, 398, 1041
- Burns et al. (2018) Burns, C. R., Parent, E., Phillips, M. M., et al. 2018, ApJ, 869, 56
- Cai et al. (2019) Cai, Y.-Z., Pastorello, A., Fraser, M., et al. 2019, arXiv e-prints, arXiv:1909.13147
- Childress et al. (2016) Childress, M. J., Tucker, B. E., Yuan, F., et al. 2016, PASA, 33, e055
- Chugai & Danziger (1994) Chugai, N. N. & Danziger, I. J. 1994, MNRAS, 268, 173
- Dahlem (2005) Dahlem, M. 2005, A&A, 429, L5
- Doherty et al. (2017) Doherty, C. L., Gil-Pons, P., Siess, L., & Lattanzio, J. C. 2017, PASA, 34, e056
- Filippenko (1997) Filippenko, A. V. 1997, ARA&A, 35, 309
- Fitzpatrick (1999) Fitzpatrick, E. L. 1999, PASP, 111, 63
- Fitzpatrick (1999) Fitzpatrick, E. L. 1999, PASP, 111, 63
- Galbany et al. (2016) Galbany, L., Anderson, J. P., Rosales-Ortega, F. F., et al. 2016, MNRAS, 455, 4087
- Galbany et al. (2018) Galbany, L., Anderson, J. P., Sánchez, S. F., et al. 2018, ApJ, 855, 107
- Glebbeek et al. (2013) Glebbeek, E., Gaburov, E., Portegies Zwart, S., & Pols, O. R. 2013, MNRAS, 434, 3497
- Hashimoto et al. (1993) Hashimoto, M., Iwamoto, K., & Nomoto, K. 1993, ApJ, 414, L105
- Howitt et al. (2019) Howitt, G., Stevenson, S., Vigna-Gómez, A. r., et al. 2019, arXiv e-prints, arXiv:1912.07771
- Humphreys et al. (2011) Humphreys, R. M., Bond, H. E., Bedin, L. R., et al. 2011, ApJ, 743, 118
- Ivanova et al. (2013) Ivanova, N., Justham, S., Chen, X., et al. 2013, A&A Rev., 21, 59
- Kankare et al. (2015) Kankare, E., Kotak, R., Pastorello, A., et al. 2015, A&A, 581, L4
- Kashi et al. (2010) Kashi, A., Frankowski, A., & Soker, N. 2010, ApJ, 709, L11
- Kashi & Soker (2016) Kashi, A. & Soker, N. 2016, Research in Astronomy and Astrophysics, 16, 99
- Kiewe et al. (2012) Kiewe, M., Gal-Yam, A., Arcavi, I., et al. 2012, ApJ, 744, 10
- Kitaura et al. (2006) Kitaura, F. S., Janka, H.-T., & Hillebrandt, W. 2006, A&A, 450, 345
- Kochanek (2011) Kochanek, C. S. 2011, ApJ, 741, 37
- Kochanek et al. (2012a) Kochanek, C. S., Khan, R., & Dai, X. 2012a, ApJ, 759, 20
- Kochanek et al. (2012b) Kochanek, C. S., Szczygieł, D. M., & Stanek, K. Z. 2012b, ApJ, 758, 142
- Kulkarni & Kasliwal (2009) Kulkarni, S. & Kasliwal, M. M. 2009, in Astrophysics with All-Sky X-Ray Observations, ed. N. Kawai, T. Mihara, M. Kohama, & M. Suzuki, 312
- Lipunov et al. (2017) Lipunov, V. M., Blinnikov, S., Gorbovskoy, E., et al. 2017, MNRAS, 470, 2339
- MacLeod et al. (2017) MacLeod, M., Macias, P., Ramirez-Ruiz, E., et al. 2017, ApJ, 835, 282
- MacLeod et al. (2018) MacLeod, M., Ostriker, E. C., & Stone, J. M. 2018, ApJ, 863, 5
- Mauerhan et al. (2018) Mauerhan, J. C., Van Dyk, S. D., Johansson, J., et al. 2018, MNRAS, 473, 3765
- Metzger & Pejcha (2017) Metzger, B. D. & Pejcha, O. 2017, MNRAS, 471, 3200
- Meyer & Meyer-Hofmeister (1979) Meyer, F. & Meyer-Hofmeister, E. 1979, A&A, 78, 167
- Miyaji & Nomoto (1987) Miyaji, S. & Nomoto, K. 1987, ApJ, 318, 307
- Miyaji et al. (1980) Miyaji, S., Nomoto, K., Yokoi, K., & Sugimoto, D. 1980, PASJ, 32, 303
- Moorwood et al. (1998) Moorwood, A., Cuby, J. G., & Lidman, C. 1998, The Messenger, 91, 9
- Morrell et al. (2014) Morrell, N., Contreras, C., Gonzalez, C., et al. 2014, The Astronomer’s Telegram, 6508
- Nomoto (1984) Nomoto, K. 1984, ApJ, 277, 791
- Nyholm et al. (2019) Nyholm, A., Sollerman, J., Tartaglia, L., et al. 2019, arXiv e-prints, arXiv:1906.05812
- Osterbrock & Ferland (2006) Osterbrock, D. E. & Ferland, G. J. 2006, Astrophysics of gaseous nebulae and active galactic nuclei (University Science Books)
- Pastorello et al. (2019a) Pastorello, A., Chen, T. W., Cai, Y. Z., et al. 2019a, A&A, 625, L8
- Pastorello & Fraser (2019) Pastorello, A. & Fraser, M. 2019, Nature Astronomy, 3, 676
- Pastorello et al. (2019b) Pastorello, A., Mason, E., Taubenberger, S., et al. 2019b, A&A, 630, A75
- Persson et al. (2013) Persson, S. E., Murphy, D. C., Smee, S., et al. 2013, PASP, 125, 654
- Pettini & Pagel (2004) Pettini, M. & Pagel, B. E. J. 2004, MNRAS, 348, L59
- Phillips et al. (2019) Phillips, M. M., Contreras, C., Hsiao, E. Y., et al. 2019, PASP, 131, 014001
- Phillips et al. (2013) Phillips, M. M., Simon, J. D., Morrell, N., et al. 2013, ApJ, 779, 38
- Pignata et al. (2009) Pignata, G., Maza, J., Hamuy, M., Antezana, R., & Gonzales, L. 2009, in Revista Mexicana de Astronomia y Astrofisica Conference Series, Vol. 35, Revista Mexicana de Astronomia y Astrofisica Conference Series, 317
- Podsiadlowski (2001) Podsiadlowski, P. 2001, in Astronomical Society of the Pacific Conference Series, Vol. 229, Evolution of Binary and Multiple Star Systems, ed. P. Podsiadlowski, S. Rappaport, A. R. King, F. D’Antona, & L. Burderi , 239–+
- Poelarends et al. (2008) Poelarends, A. J. T., Herwig, F., Langer, N., & Heger, A. 2008, ApJ, 675, 614
- Prieto et al. (2008) Prieto, J. L., Kistler, M. D., Thompson, T. A., et al. 2008, ApJ, 681, L9
- Prieto et al. (2009) Prieto, J. L., Sellgren, K., Thompson, T. A., & Kochanek, C. S. 2009, ApJ, 705, 1425
- Reichart et al. (2005) Reichart, D., Nysewander, M., Moran, J., et al. 2005, Nuovo Cimento C Geophysics Space Physics C, 28, 767
- Retter & Marom (2003) Retter, A. & Marom, A. 2003, MNRAS, 345, L25
- Schlafly & Finkbeiner (2011) Schlafly, E. F. & Finkbeiner, D. P. 2011, ApJ, 737, 103
- Schlegel (1990) Schlegel, E. M. 1990, MNRAS, 244, 269
- Smartt et al. (2015) Smartt, S. J., Valenti, S., Fraser, M., et al. 2015, A&A, 579, A40
- Smith et al. (2016) Smith, N., Andrews, J. E., Van Dyk, S. D., et al. 2016, MNRAS, 458, 950
- Smith et al. (2009) Smith, N., Ganeshalingam, M., Chornock, R., et al. 2009, ApJ, 697, L49
- Smith et al. (2011) Smith, N., Li, W., Silverman, J. M., Ganeshalingam, M., & Filippenko, A. V. 2011, MNRAS, 415, 773
- Soker & Tylenda (2003) Soker, N. & Tylenda, R. 2003, ApJ, 582, L105
- Soker (2020) Soker, N. 2020, ApJ, 893, 20
- Stritzinger et al. (2012) Stritzinger, M., Taddia, F., Fransson, C., et al. 2012, ApJ, 756, 173
- Stritzinger et al. (2020) Stritzinger, M., Taddia, F., Fraser, M., et al. 2020, A&A, in press (Paper I)
- Taddia et al. (2013) Taddia, F., Stritzinger, M. D., Sollerman, J., et al. 2013, A&A, 555, A10
- Thompson et al. (2009) Thompson, T. A., Prieto, J. L., Stanek, K. Z., et al. 2009, ApJ, 705, 1364
- Tully et al. (2013) Tully, R. B., Courtois, H. M., Dolphin, A. E., et al. 2013, AJ, 146, 86
- Tully et al. (2016) Tully, R. B., Courtois, H. M., & Sorce, J. G. 2016, AJ, 152, 50
- Tylenda (2005) Tylenda, R. 2005, A&A, 436, 1009
- Tylenda et al. (2011) Tylenda, R., Hajduk, M., Kamiński, T., et al. 2011, A&A, 528, A114
- Tylenda & Soker (2006) Tylenda, R. & Soker, N. 2006, A&A, 451, 223
- Van Dyk et al. (2000) Van Dyk, S. D., Peng, C. Y., King, J. Y., et al. 2000, PASP, 112, 1532
- Williams et al. (2015) Williams, S. C., Darnley, M. J., Bode, M. F., & Steele, I. A. 2015, ApJ, 805, L18
| ID | ||||||||
|---|---|---|---|---|---|---|---|---|
| 1 | 349.073883 | -42.532539 | ||||||
| 2 | 349.146027 | -42.515438 | ||||||
| 3 | 348.886597 | -42.615513 | 14.807(010) | 14.145(007) | 15.940(034) | 14.434(007) | 13.949(005) | 13.805(007) |
| 4 | 349.104828 | -42.476219 | 15.332(013) | 14.847(011) | 16.056(036) | 15.053(009) | 14.713(007) | 14.605(011) |
| 5 | 348.940552 | -42.641197 | 15.983(037) | 15.050(030) | 17.578(091) | 15.504(031) | 14.689(029) | 14.316(014) |
| 6 | 349.160797 | -42.579163 | 15.729(022) | 15.144(010) | 16.608(051) | 15.402(011) | 14.974(008) | 14.828(007) |
| 7 | 349.018341 | -42.487396 | 15.825(007) | 15.114(011) | 16.957(050) | 15.434(012) | 14.883(008) | 14.683(010) |
| 8 | 349.177582 | -42.494061 | 16.206(039) | 15.209(009) | 18.097(048) | 15.689(015) | 14.782(010) | 14.447(009) |
| 9 | 349.201538 | -42.602962 | 15.843(024) | 15.269(010) | 16.636(050) | 15.515(009) | 15.114(009) | 14.967(011) |
| 10 | 348.887085 | -42.535305 | 16.070(021) | 15.241(010) | 17.454(089) | 15.626(013) | 14.936(008) | 14.675(008) |
| 11 | 349.011200 | -42.468658 | 15.985(017) | 15.422(008) | 16.833(051) | 15.671(012) | 15.273(011) | 15.141(012) |
| 12 | 348.950928 | -42.493233 | 16.349(015) | 15.528(011) | 17.800(063) | 15.903(011) | 15.248(013) | 15.027(011) |
| 13 | 349.079193 | -42.577908 | 16.528(029) | 15.614(012) | 17.847(229) | 16.049(013) | 15.289(008) | 14.948(010) |
| 14 | 348.948059 | -42.539196 | 16.196(030) | 15.621(013) | 17.028(082) | 15.875(015) | 15.465(016) | 15.316(011) |
| 15 | 349.177124 | -42.531296 | 16.463(027) | 15.645(015) | 17.914(059) | 16.018(015) | 15.356(012) | 15.141(009) |
| 16 | 349.107941 | -42.547867 | 16.849(022) | 16.196(028) | 17.786(073) | 16.488(034) | 15.999(016) | 15.842(022) |
| 17 | 349.041046 | -42.637428 | 18.129(070) | 17.004(051) | 19.990(061) | 17.570(043) | 16.477(030) | 16.051(021) |
| 18 | 349.142731 | -42.624664 | 17.243(031) | 16.379(035) | 18.671(075) | 16.785(021) | 16.065(016) | 15.824(018) |
| 19 | 349.086792 | -42.654221 | 17.109(047) | 16.521(032) | 17.911(083) | 16.773(014) | 16.358(019) | 16.216(036) |
| 20 | 349.004547 | -42.548927 | 17.406(080) | 16.513(033) | 18.663(085) | 16.931(037) | 16.227(014) | 15.914(024) |
| 21 | 349.021851 | -42.545380 | 17.152(040) | 16.558(030) | 17.871(092) | 16.843(046) | 16.377(019) | 16.174(017) |
| 22 | 349.063202 | -42.463596 | 17.234(067) | 16.593(036) | 18.179(051) | 16.868(033) | 16.405(032) | 16.243(030) |
| 23 | 349.155212 | -42.636612 | 17.182(050) | 16.607(023) | 17.946(056) | 16.847(031) | 16.477(013) | 16.358(019) |
| 24 | 348.945343 | -42.460548 | 17.043(035) | 16.618(040) | 17.523(170) | 16.811(024) | 16.502(037) | 16.415(061) |
| 25 | 349.102997 | -42.480492 | 17.794(058) | 16.606(041) | 19.879(052) | 17.199(042) | 16.088(015) | 15.623(015) |
| 26 | 349.023193 | -42.670746 | 17.517(080) | 16.726(046) | 18.875(074) | 17.077(049) | 16.433(016) | 16.205(022) |
| 27 | 349.009583 | -42.517628 | 17.768(078) | 16.937(036) | 19.021(070) | 17.327(021) | 16.621(039) | 16.345(027) |
| 28 | 348.988068 | -42.467167 | 17.582(100) | 16.962(035) | 18.510(044) | 17.236(044) | 16.762(023) | 16.626(037) |
| ID | N | N | N | |||||
|---|---|---|---|---|---|---|---|---|
| 101 | 349.044870 | -42.571004 | 15.64(02) | 3 | 15.38(04) | 3 | 15.07(07) | 3 |
| 102 | 349.018801 | -42.593902 | 16.57(06) | 3 | 16.11(06) | 3 | 15.61(16) | 3 |
| 103 | 349.015365 | -42.595754 | 17.60(07) | 2 | ||||
| 104 | 349.061355 | -42.592496 | 17.52(41) | 2 | 17.08(21) | 3 | 17.01(15) | 1 |
| 106 | 349.068255 | -42.572860 | 18.37(11) | 1 | ||||
| 107 | 349.059690 | -42.570588 | 18.29(10) | 1 | ||||
| 109 | 349.006081 | -42.561110 | 18.54(12) | 1 |
| TimeaaNote. – JD+2456900. | TimeaaNote. – JD+2456900. | TimeaaNote. – JD+2456900. | TimeaaNote. – JD+2456900. | TimeaaNote. – JD+2456900. | TimeaaNote. – JD+2456900. | ||||||
|---|---|---|---|---|---|---|---|---|---|---|---|
| 25.71 | 18.472(0.038) | 25.70 | 18.178(0.033) | 25.71 | 18.022(0.035) | 25.70 | 17.739(0.035) | 25.71 | 17.702(0.037) | ||
| 26.64 | 19.226(0.040) | 26.62 | 18.556(0.035) | 26.63 | 18.297(0.034) | 26.63 | 18.085(0.037) | 26.63 | 17.829(0.031) | 26.63 | 17.801(0.029) |
| 27.62 | 19.322(0.036) | 27.63 | 18.619(0.037) | 27.61 | 18.402(0.045) | 27.63 | 18.201(0.037) | 27.61 | 17.962(0.037) | 27.62 | 17.985(0.034) |
| 28.62 | 19.468(0.050) | 28.61 | 18.737(0.036) | 28.61 | 18.542(0.035) | 28.61 | 18.266(0.043) | 28.61 | 18.023(0.029) | 28.61 | 17.953(0.032) |
| 29.61 | 19.509(0.048) | 29.62 | 18.835(0.032) | 29.59 | 18.544(0.061) | 29.62 | 18.372(0.044) | 29.60 | 18.144(0.037) | 29.60 | 18.073(0.024) |
| 30.59 | 19.586(0.034) | 30.61 | 18.900(0.033) | 30.60 | 18.604(0.032) | 30.61 | 18.387(0.033) | 30.59 | 18.190(0.034) | 30.60 | 18.088(0.035) |
| 31.64 | 19.753(0.052) | 31.63 | 19.012(0.043) | 31.64 | 18.671(0.037) | 31.63 | 18.504(0.044) | 31.64 | 18.210(0.041) | 31.64 | 18.180(0.039) |
| 32.63 | 19.920(0.064) | 32.62 | 19.016(0.034) | 32.63 | 18.729(0.039) | 32.62 | 18.524(0.033) | 32.63 | 18.351(0.033) | 32.64 | 18.219(0.040) |
| 36.60 | 20.201(0.125) | 36.59 | 19.294(0.060) | 36.60 | 18.918(0.040) | 36.59 | 18.796(0.046) | 36.60 | 18.548(0.037) | 36.60 | 18.394(0.043) |
| 37.63 | 20.232(0.101) | 37.64 | 19.347(0.059) | 37.63 | 18.734(0.042) | 37.62 | 18.515(0.038) | 37.62 | 18.468(0.056) | ||
| 38.65 | 20.038(0.115) | 38.63 | 19.399(0.069) | 38.64 | 18.969(0.042) | 38.63 | 18.726(0.037) | 38.64 | 18.487(0.033) | 38.64 | 18.385(0.040) |
| 39.65 | 20.276(0.109) | 39.63 | 19.332(0.048) | 39.64 | 19.015(0.043) | 39.64 | 18.688(0.047) | 39.64 | 18.456(0.034) | 39.64 | 18.380(0.044) |
| 40.62 | 20.427(0.107) | 40.60 | 19.459(0.036) | 40.61 | 18.967(0.029) | 40.61 | 18.803(0.042) | 40.61 | 18.484(0.035) | 40.61 | 18.381(0.048) |
| 41.61 | 20.562(0.166) | 41.62 | 19.439(0.039) | 41.60 | 19.096(0.042) | 41.62 | 18.810(0.042) | 41.60 | 18.607(0.036) | 41.60 | 18.376(0.038) |
| JD | photometry | error | filter |
|---|---|---|---|
| 2456929.64 | 17.51 | 0.02 | |
| 2456931.58 | 17.58 | 0.03 | |
| 2456932.58 | 17.68 | 0.03 | |
| 2456929.67 | 17.24 | 0.02 | |
| 2456931.62 | 17.35 | 0.03 | |
| 2456932.61 | 17.47 | 0.03 | |
| 2456929.66 | 16.79 | 0.03 | |
| 2456931.61 | 16.92 | 0.03 | |
| 2456932.60 | 17.05 | 0.03 | |
| 2456937.59 | 16.17 | 0.14 | bbNote. – Observations were obtained with the BAADE (+ FourStar) telescope, and the photometric zero-point was computed relative to two 2MASS stars. Also note that no template subtraction was performed on this single science image. |
| MJD | aaNote. – Unfiltered photometry calibrated relative to the CSP-II -band local sequence. | Telescope |
|---|---|---|
| 56910.27 | 18.3 | PROMPT4 |
| 56920.06 | 17.519(054) | PROMPT1 |
| 56930.32 | 18.286(121) | PROMPT4 |
| 56940.05 | 18.668(165) | PROMPT1 |
| 56941.27 | 18.656(318) | PROMPT3 |
| 56943.04 | 18.699(158) | PROMPT4 |
| 56943.27 | 18.527(090) | PROMPT1 |
| 56956.24 | 18.217(118) | PROMPT4 |
| 56958.10 | 18.043(072) | PROMPT1 |
| 56959.23 | 18.106(088) | PROMPT4 |
| 56961.05 | 18.119(085) | PROMPT4 |
| 56978.13 | 17.669(102) | PROMPT4 |
| 56983.07 | 17.886(079) | PROMPT4 |
| 56998.12 | 18.025(148) | PROMPT4 |
| 57015.08 | 18.361(124) | PROMPT3 |
| MJD | photometry | error | filter |
|---|---|---|---|
| 56944.163 | 17.07 | 0.08 | |
| 56944.163 | 16.97 | 0.09 | |
| 56944.163 | 16.37 | 0.08 | |
| 56954.000 | 16.39 | 0.05 | |
| 56964.250 | 16.09 | 0.08 |
| Object | Date | Date | Days since | Telescope | Instrument | Resolution |
|---|---|---|---|---|---|---|
| (JD) | (UT) | discoveryaaDays since outburst assuming outburst date for AT 2014ej of 24.06 September 2014 UT (JD2456924.56). | (Å) | |||
| AT 2014ej | 2456927.67 | September 27.16 | 7.1 | du Pont | WFCCD | 7.5 |
| AT 2014ej | 2456930.60 | September 30.10 | 10.0 | NTT | EFOSC2 | 15.8/16.0bbNote. – NTT (+ EFOSC) observations were obtained with two grisms, i.e., Gr#11 and Gr#16, providing slightly different spectral resolutions. |
| AT 2014ej | 2456931.59 | October 01.09 | 10.6 | Clay | MIKE | 0.21 |
| AT 2014ej | 2456933.96 | October 03.46 | 13.3 | ANU | WiFeS | 0.98 |
| AT 2014ej | 2456953.62 | October 23.12 | 32.9 | NTT | EFOSC2 | 15.8/16.0 |
| AT 2014ej | 2456963.61 | November 02.11 | 42.8 | NTT | EFOSC2 | 15.8/16.0 |
| AT 2014ej | 2456992.57 | December 01.07 | 71.6 | NTT | EFOSC2 | 15.8/16.0 |
| MJD | aaNote. – -band photometry calibrated relative to the CSP-II -band local sequence listed in Table 1. | Telescope |
|---|---|---|
| 56930.095 | 18.458(0.031) | NTT |
| 56953.095 | 18.566(0.036) | NTT |
| 56963.080 | 18.389(0.037) | NTT |
| 56992.070 | 18.195(0.045) | NTT |
| JD | ||||
|---|---|---|---|---|
| 2456927.67 | 18.709 | 18.446 | 17.967 | 17.898 |
| 2456930.60 | 18.821 | 18.574 | 18.156 | … |
| 2456933.96 | … | … | 18.449 | 18.425 |
| 2456953.62 | 19.199 | 18.904 | 18.324 | 18.209 |
| 2456963.61 | 18.992 | 18.693 | 18.166 | 18.005 |
| 2456992.57 | 18.776 | 18.496 | 17.959 | 17.802 |
Note. — We assume a conservative error of 0.1 mag on the spectrophotometry due to the fact that there might be host galaxy flux contaminating the spectra.
| LRN | ||
|---|---|---|
| (mag) | (mag) | |
| SN 1997bs | 29.82 | 0.21 |
| NGC 3437-2011-OT1 | 31.60 | 0.02 |
| NGC 4490-2011-OT1 | 29.91 | 0.32 |
| UGC 12307-2013-OT1 | 32.99 | 0.22 |
| M101-2015-OT1 | 29.04 | 0.008 |
| SNhunt248 | 31.76 | 0.045 |
| AT 2017jfs | 32.73 | 0.022 |
| AT 2018hso | 31.64 | 0.30 |
| PhaseaaNote. – Phase with respect to date of discovery. | H | H |
|---|---|---|
| (d) | (km s-1) | (km s-1) |
| +7 | 85472 | 10718 |
| +10 | 868114 | 96978 |
| +33 | 99975 | |
| +43 | 84370 | |
| +72 | 1115117 |
Appendix A Metallicity and local environment
To study the properties of the environment of AT 2014ej, we used integral field spectroscopic observations of NGC 7552 taken with the European Southern Observatory’s (ESO) Very Large Telescope (VLT) equipped with the instrument MUSE (Multi Unit Spectroscopic Explorer; Bacon et al. 2014) on 2015 October 11 that are available from the ESO Science Archive. The MUSE data set consist of a combination of three single pointings covering the same one squared arcmin field, with a total exposure of 3513 s. A one-dimensional extracted spectrum is plotted in Fig. 14.
First, using a circular aperture of 2 arcsec diameter, we extracted a spectrum of the galaxy core and measured the six strongest gas-phase emission line features in the spectra to obtain an average redshift of , where the error is the mean error, which does not include the uncertainty related to the placement of the H ii region in the galaxy. This is fully consistent with the value listed in the NED.
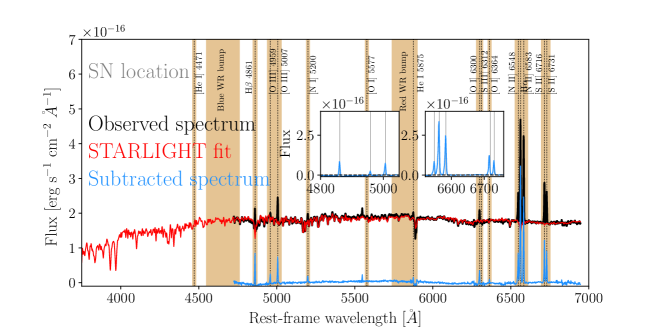
To estimate the local metallicity, we first extracted a circular spectrum with 2 arcsec diameter centered at the position of AT 2014ej and performed a similar analysis as described by Galbany et al. (2016, 2018). In summary, the spectrum was first fit with a modified version of STARLIGHT. The best-fit simple stellar populations (SSP) model was removed from the observed spectrum, which enabled us to obtain a pure gas-emission spectrum, Next the flux of the most prominent emission lines was estimated with Gaussian fits after correcting for dust attenuation. The adopted reddening value was derived from the Balmer decrement assuming case B recombination (Osterbrock & Ferland 2006) and a Fitzpatrick (1999) extinction law characterized by an .
From the extinction-corrected fluxes measured from H 6563, H 4861, [O iii] 5007 , and the [N ii] 6583 emission lines, we obtain a measure of the oxygen metallicity abundance on the O3N2 index following the relation from Pettini & Pagel (2004). In doing so, a metallicity higher than solar of 12 log(O/H) 0.2 dex is inferred from the MUSE observations of NGC 7552 extracted at the position of AT 2014ej.
Appendix B Galactic and host-galaxy reddening
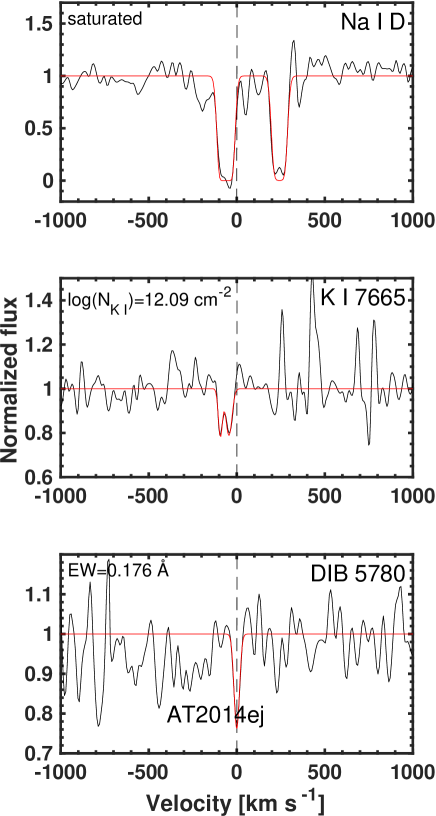
The Milky Way reddening in the direction of AT 2014ej is very weak, with NED listing a Schlafly & Finkbeiner (2011) color excess mag, which, when a standard Galactic reddening law is adopted, corresponds to a visual extinction of mag. Inspection of low- and medium-resolution spectra presented in Appendix A reveals conspicuous Na i D and also the K I 7665, 7699 interstellar lines located at the redshift of the host. Unfortunately, as demonstrated in Fig. 15 (top panel), the Na i D lines are saturated in our higher dispersion spectrum and therefore do not provide a reliable estimate of the host reddening.
The K I lines in the MIKE spectrum that we show in Fig. 15 (middle panel) can be used to estimate the host extinction. To estimate the host extinction from these features, we made use of Eq. (5) from Phillips et al. (2013), which connects the K i column density to the host visual-extinction . Column density estimates were obtained with the Voigt profile-fitting program VPFIT.555http://www.ast.cam.ac.uk/rfc/vpfit.html The VPFIT fits to the data are shown Fig. 15 and provide column density values of log) cm-2. Following Eq. (5) of Phillips et al. (2013), these values correspond to mag, where the accompanying uncertainties correspond to 72% of the inferred value of (Phillips et al. 2013). This is a high extinction value with a high uncertainty. Therefore we resorted to estimating the reddening based on a relation between the strength of the diffuse interstellar band (DIB) at 5780 Å and , again from Phillips et al. (2013).
Inspection of our medium-dispersion spectrum reveals the 5780 Å absorption feature (see Fig. 15, bottom panel). We computed the equivalent width (EW) of the DIB feature by fitting a Gaussian function using the IRAF task fitprofs. In computing the fit, an FWHM value was set to 2.1 Å and the fitting range was set to be between 5778 – 5782 Å. The Gaussian fit provides an EW of 0.1760.020 Å, which, when Eq. (6) from Phillips et al. (2013) is used, implies mag. We verified that this value is fully consistent with the visual extinction of mag implied by the Balmer decrement estimate from the MUSE spectrum presented in Appendix A that we plot in Fig. 14. When we combine the DIB visual extinction estimate with the Milky Way contribution, we obtain a total visual extinction for AT 2014ej of mag, which is adopted in this work. Moreover, to convert into extinction values appropriate for the different passbands we used to obtain photometry of AT 2014ej, we adopted a Fitzpatrick (1999) reddening law. We finally note that AT 2014ej might be associated with circumstellar dust, and therefore the assumed host-reddening value comes with the same caveats as discussed in Appendix B of Paper 1 (see also Kochanek et al. 2012a).