pulsars: individual: PSR B1259-63 — binaries: general — radio continuum: stars
\LETTERLABELALMA Observations of PSR B1259-63/LS 2883 in an Inactive Period: Variable Circumstellar Disk?
Abstract
We report Atacama Large Millimeter/submillimeter Array (ALMA) observations of the gamma-ray binary system containing the pulsar PSR B1259–63 orbiting around a massive star LS 2883 in an inactive period between the 2017 and 2021 periastron passages. We detected radio continuum emission from the binary system at 97 GHz (Band 3) and 343 GHz (Band 7). Compared with our previous ALMA observations performed soon after the 2017 periastron passage, the fluxes have decreased by an factor of six at 97 GHz and two at 343 GHz. The flux at 343 GHz is large relative to that at 97 GHz and appears to be thermal emission from the circumstellar disk around LS 2883. The decrease of the 343 GHz flux may indicate that the disk has expanded and become partially optically-thin since the disk is no longer affected by pulsar winds. The flux at 97 GHz is consistent with that expected from the pulsed emission from the pulsar, which indicates that the unpulsed emission that had been produced through pulsar-disk or pulsar-stellar wind interaction has disappeared. The image of the system is consistent with a point source and shows no sign of ejecta.
1 Introduction
High-mass gamma-ray binaries consist of a massive B- or O-type star and a compact object (a neutron star or a black hole). So far, only seven gamma-ray binary systems have been confirmed. PSR B1259-63/LS 2883 (B1259 hereafter) is the first of these binaries whose compact object has been identified as a radio pulsar or a neutron star. In this system, the pulsar PSR B1259-63 is orbiting around the rapidly-rotating, late Oe-type or early Be-type massive () companion star LS 2883 with a period of 1236.7 d and an orbital eccentricity of 0.87 (Negueruela et al., 2011; Shannon et al., 2014). The spin period and the characteristic age of the pulsar are ms and kyr, respectively (Johnston et al., 1992, 1994). The distance to the system is kpc (Miller-Jones et al., 2018). Around periastron, the pulsed emission becomes undetectable for days, which indicates that the pulsar is eclipsed by the circumstellar disk of LS 2883 (Johnston et al., 1996). On the other hand, B1259 emits unpulsed radio and high-energy emissions, which are probably produced by interaction between the pulsar and the circumstellar disk and/or stellar winds (Johnston et al., 1996; Abdo et al., 2011). In fact, double peaked light curves have been observed in radio and X-rays around periastron, each of which reflects disk-crossing of the pulsar (Connors et al., 2002; Johnston et al., 2005). While the radio emission appears to be synchrotron emission from electrons, the X-ray emission may be synchrotron emission or inverse Compton (IC) scattering (Chernyakova et al., 2006, 2009; Uchiyama et al., 2009; Pétri & Dubus, 2011; Chernyakova et al., 2015).
Close to periastron passages, TeV gamma-ray emission has been detected with the High Energy Stereoscopic System (HESS) (Aharonian et al., 2005, 2009). In an IC scenario, high-energy electrons upscatter soft UV photons stemming from the stellar and/or disk radiation field into the gamma-ray regime (Tavani et al., 1996; Kirk et al., 1999; Kong et al., 2011). The generation of TeV gamma-rays within a hadronic scenario is another explanation. In this model, the dense circumstellar disk is an ideal source of target material of ultrarelativistic particles that could produce pions and hence TeV gamma-rays (Kawachi et al., 2004; Neronov & Chernyakova, 2007). GeV gamma-ray flares have been observed with the Fermi Gamma-ray Space Telescope after the passage of the pulsar through the circumstellar disk (Abdo et al., 2011; Caliandro et al., 2015; Tam et al., 2018; Johnson et al., 2018). The flares seem to be triggered by the disruption of the disk (Chernyakova et al., 2015).
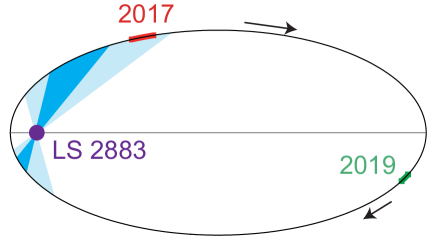
Until recently, there had been no observations at – GHz. However, we observed B1259 with Atacama Large Millimeter/submillimeter Array (ALMA) after the 2017 periastron passage and detected it in the millimeter and submillimeter wavelengths for the first time (Fujita et al. (2019); hereafter Paper I). Our observations were made soon after the disk-crossing of the pulsar (figure 1). At Band 3 (97 GHz), the flux 84 days after the periastron was almost identical to that 71 days after the periastron. Compared with a GeV gamma-ray light curve, we concluded that the emission at 97 GHz is not related to the gamma-ray flares. The 97 GHz fluxes were consistent with an extrapolation of the radio spectrum at lower frequencies ( GHz). Thus, we speculated that it is the unpulsed synchrotron emission from electrons accelerated when the pulsar passed through the circumstellar disk. The flux at Band 7 (343 GHz) 69 days after the periastron was significantly larger that the extrapolation of the radio spectrum at lower frequencies. We argued that this emission is thermal one coming from the circumstellar disk around LS 2883.
In this letter, we report the results of our new observations of B1259 with ALMA around apastron (figure 1). Previous observations at low-frequencies ( GHz) have indicated that unpulsed synchrotron emission disappears in this period (Johnston et al., 1999, 2005). If the 97 GHz flux is associated with that emission, it should significantly decrease or disappear accordingly. On the other hand, if the 343 GHz emission actually comes from the disk, changes of the flux implies a long-term variability of the disk.
2 Observations and Results
The observations were carried out in ALMA Band 3 and Band 7 in 2019 November. The data were taken in Time Division Mode (TDM) centered at the frequency of 97 GHz and 343 GHz at Band 3 and Band 7, respectively. The data were processed using CASA 5.6.1-8 and ALMA Pipeline-CASA56-P1-B in a standard manner. Number of antennas used for the observation, total on-source time, bandpass calibrator, and gain calibrator are summarized in table 2. Flux scaling was derived on the bandpass calibrator using the flux information provided by the Joint ALMA Observatory (JAO). The observation condition in terms of the weather condition and precipitable water vapor (PWV) was normal in both Band 3 and 7, but the phase RMS per baseline visibility for the second observation in Band 7 (Nov. 27) was at most 1.5 times larger than that for the first observation (Nov. 7) according to the Quality Assurance (QA) 0 report. The image deconvolution was done using the CASA task tclean with the multifrequency synthesis. Since the second observation of Band 7 was carried out with a longer baseline configuration, we applied uv-taper option to have a beam size similar to the first observation. Table 2 summarizes angular resolution and image rms.
Figure 2 shows the total intensity image of B1259. Significant emission is detected both in Band 3 and 7. The source structure is point-like (figures 2a and b) but somewhat slightly extended in the second observation of Band 7 (figure 2c). We consider that the extended structure is not real but caused by a phase calibration error since the emission is shifted from the phase center owing to the phase calibration error and a similar level of shift and image distortion is seen in a calibrator J1337-6509, which was observed as the check source (section 10 in ALMA Technical Handbook: Remijan et al. 2020111https://almascience.nrao.edu/documents-and-tools/cycle7/alma-technical-handbook/view). Because of the poor phase calibration, the second observation data is likely affected by coherence loss. In fact, the peak intensity appears to be only about 70% of that for the first observation.
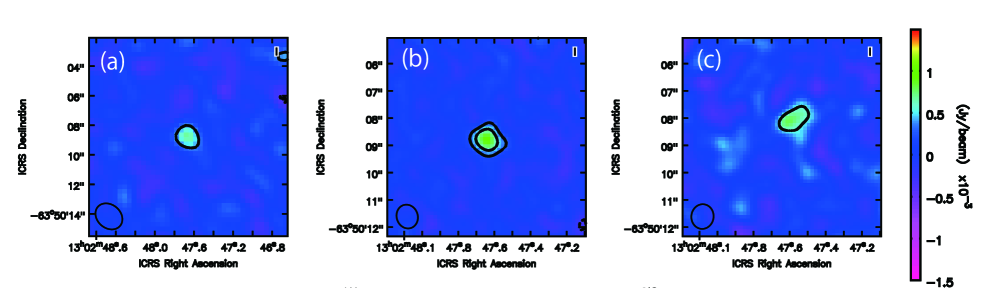
The obtained fluxes are shown in table 2. We also show those for our 2017 observations for comparison. The most recent periastron passage of the pulsar occurred on MJD 58018.143 (UTC 2017 September 22 03:25:55.2). We refer to the time of the passage as . For the flux estimation, we made Gaussian model fitting to the images using the CASA task imfit and measured the integrated flux density. For the second observation of Band 7 ( d), the structure is distorted (figure 2c) and thus the Gaussian is not a good representation of the source structure. Besides, the flux is likely underestimated by coherence loss due to the poor phase calibration. Thus, we show a peak intensity for the second observation of Band 7 as a lower limit of flux density. In the following sections, we do not discuss the second observation of Band 7 ( d).
Summary of 2019 observations Band Center frq. Date a On-source timeb Bandpass/Fluxc Gaind 3 97 GHz November 2, 2019 43 5.5 min J1617-5848 J1322-6532 7 343 GHz November 7, 2019 44 5 min J1107-4449 J1254-6111 7 343 GHz November 27, 2019 41 5 min J1337-1257 J1254-6111 {tabnote} a𝑎aa𝑎afootnotemark: Number of antennas used for observation. b𝑏bb𝑏bfootnotemark: Total integration time of the target source. c𝑐cc𝑐cfootnotemark: Bandpass and flux calibrator name. d𝑑dd𝑑dfootnotemark: Gain calibrator name.
Angular resolution, image rms, and observed fluxes for the ALMA observations in 2017 and 2019 Band Date Day Beam Shape Image RMS Observed Flux (from ) (Jy beam-1) (mJy) 3 (97 GHz) Dec. 2, 2017 +71 at 41 3 (97 GHz) Dec. 15, 2017 +84 at 36 7 (343 GHz) Nov. 30, 2017 +69 at 87 3 (97 GHz) Nov. 2, 2019 +771 at 40 7 (343 GHz) Nov. 7, 2019 +776 at 90 7 (343 GHz) Nov. 27, 2019 +796 at 179
3 Discussion
3.1 Comparison with 2017 observations
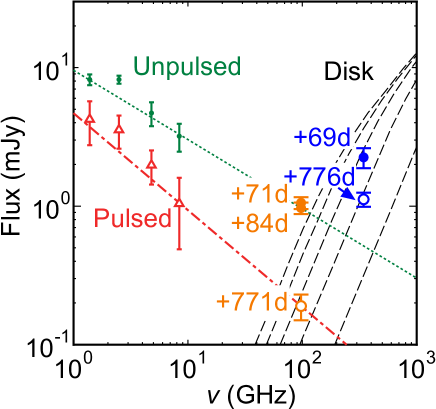
In figure 3, the radio fluxes obtained through our new ALMA observations in 2019 are shown by open circles. For comparison, we also present the results of our previous ALMA observations in 2017 by filled circles. The figure indicates that the fluxes in 2019 have decreased since our previous observations in 2017 especially at 97 GHz. In Paper I, we compared our 2017 observations with ATCA observations at low-frequencies at the 2004 periastron passage222Unfortunately, the fluxes at the low-frequencies for the 2017 periastron passage have not been reported. (green dots in figure 3). While fluxes at 97 GHz ( d and d) are in line with an extrapolation of the unpulsed ATCA fluxes at a similar orbital phase (green dotted line), that at 343 GHz ( d) is clearly above the extrapolation. We interpreted that synchrotron emission generated through the interaction between the pulsar wind and the circumstellar disk is responsible for the 97 GHz flux. On the other hand, we speculated that the flux at 343 GHz is associated with the radiation from the circumstellar disk. By comparing the results with a theoretical model by van Soelen, & Meintjes (2011), we estimated that the disk size is in 2017 ( d in figure 3), where is the radius of LS 2883. Following van Soelen, & Meintjes (2011), we here assume that (Johnston et al., 1994), although some recent observations suggest that (Negueruela et al., 2011).
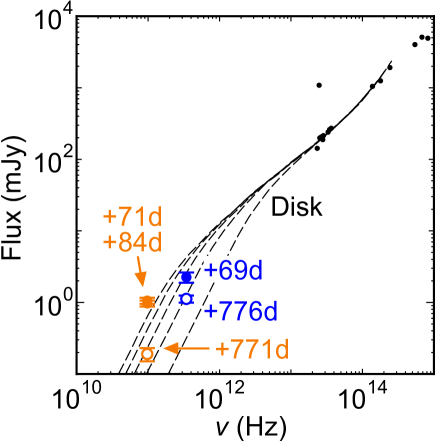
In figure 4, we show the disk spectra predicted by van Soelen, & Meintjes (2011) up to the optical band. They are insensitive to the disk radius at Hz, because the disk is only partially optically-thick and most emissions come from the inner disk (Waters, 1986). On the other hand, the spectra are sensitive to the disk size in the ALMA band (–300 GHz), because the whole disk is optically-thick (Waters, 1986). In fact, at GHz, the dashed lines follow , or black-body radiation. We plot the results of our ALMA observations in figure 4. The spectral index of the observed fluxes between 97 GHz and 343 GHz is for the 2017 observations and for the 2019 observations, where the index is defined as . Since the indices are smaller than , the whole emission in the ALMA bands cannot be explained by pure black-body disk radiation.
3.2 Origin of the radio emissions
According to our interpretation in Paper I, the decrease of the flux at 343 GHz in 2019 could be interpreted that the disk radius has decreased down to in 2019 ( d in figure 3). If this is the case, the expected disk flux at 97 GHz is mJy, which is smaller than the flux of 0.19 mJy measured in 2019 ( d in figure 3). One possible explanation is that it is the pulsed emission from the pulsar. In figure 3, red open triangles are the averaged pulsed fluxes obtained with ATCA during the period between d and d at the 2004 periastron passage (Johnston et al., 2005). The flux at 97 GHz in 2019 is on the extrapolation of the pulsed fluxes (dashed-dotted red line in figure 3). This suggests that the unpulsed component (green dotted line) had fallen below the pulsed component. Unfortunately, we cannot uncover the pulse (47.76 ms) from the ALMA data, because they are integrated at every two seconds.
If the decrease of the 343 GHz flux actually reflects that of the disk size, it may mean that the disk evolves on a time-scale of a year. Numerical simulations have shown that the disk is disrupted when the pulsar approaches the disk around periastron (Okazaki et al., 2011; Takata et al., 2012). Non-thermal X-ray emissions are produced through the interaction between the pulsar wind and the disk around this period (Takata et al., 2012). However, these simulations suggest that the disk should recover after the pulsar moves away from the disk. Thus, if the disk destruction by the pulsar is only the cause of the disk variation, the flux from the disk in 2019 is expected to increase from that in 2017, which is opposite to our observational results.
Assuming that the the 343 GHz flux is the black-body radiation from the disk, another possibility is that the disk has expanded but the optically-thick region has shrunk. This is because when the pulsar moves away from the Be star towards apastron, the outer part of the disk, which was strongly compressed and radio optically thick near periastron, is likely to expand and become optically thin due to the decrease of the density. If this is the case, the luminosity of the disk should decrease, because it reflects the area of the optically-thick region. Since the geometry of this binary system is complicated, numerical simulations would be required to confirm this speculation.
3.3 X-ray ejecta
Chandra X-ray observations have revealed the existence of high-speed ejecta that appeared as an extended X-ray structure (clump) moving away from B1259 (Pavlov et al., 2011; Kargaltsev et al., 2014; Pavlov et al., 2015). The clump is ejected at every binary cycle near periastron passage (Hare et al., 2019). Although we have checked the ALMA images for both 2017 and 2019 observations, they are consistent with a point source (see section 2 and figure 2 for 2019 observations). The upper-limit of the image size is given by the beam shapes (table 2).
4 Conclusions
We have reported the results of ALMA observations of the pulsar-massive star binary PSR B1259-63/LS 2883 at 97 and 343 GHz. The observations were made in 2019 around the apastron after the 2017 periastron passage. We detected emissions from the system both at 97 GHz and 343 GHz. However, the fluxes have decreased by a factor of six at 97 GHz and two at 343 GHz since our observations that were made soon after the 2017 periastron passage. We argued that while the emission at 343 GHz is a thermal emission from the circumstellar disk around LS 2883, that at 97 GHz is non-thermal pulsed emission from the pulsar. In this scenario, the decrease of the 343 GHz flux may indicate that the radio optical depths of the Be disk has significantly decreased since the 2017 periastron. This could happen if the disk density, particularly in the outer region, has decreased due to the expansion of the disk, because it is no longer affected by the pulsar wind ram-pressure near apastron. This speculation could be studied by numerical simulations in the future. The fall of flux at 97 GHz indicates that the synchrotron radiation observed soon after the 2017 periastron had disappeared. We also checked the image of the system and found that it is consistent with a point source. This means that in the radio band there is no sign of ejecta that had been observed in X-rays.
This work was supported by MEXT KAKENHI No. 18K03647 (Y.F.). This paper makes use of the following ALMA data: ADS/JAO.ALMA#2019.1.00320.S. and 2017.1.01188.S. ALMA is a partnership of ESO (representing its member states), NSF (USA) and NINS (Japan), together with NRC (Canada), MOST and ASIAA (Taiwan), and KASI (Republic of Korea), in cooperation with the Republic of Chile. The Joint ALMA Observatory is operated by ESO, AUI/NRAO and NAOJ.
References
- Abdo et al. (2011) Abdo, A. A., Ackermann, M., Ajello, M., et al. 2011, ApJ, 736, L11
- Aharonian et al. (2005) Aharonian, F., Akhperjanian, A. G., Aye, K.-M., et al. 2005, A&A, 442, 1
- Aharonian et al. (2009) Aharonian, F., Akhperjanian, A. G., Anton, G., et al. 2009, A&A, 507, 389
- Caliandro et al. (2015) Caliandro, G. A., Cheung, C. C., Li, J., et al. 2015, ApJ, 811, 68
- Chernyakova et al. (2009) Chernyakova, M., Neronov, A., Aharonian, F., Uchiyama, Y., & Takahashi, T. 2009, MNRAS, 397, 2123
- Chernyakova et al. (2006) Chernyakova, M., Neronov, A., Lutovinov, A., et al. 2006, MNRAS, 367, 1201
- Chernyakova et al. (2015) Chernyakova, M., Neronov, A., van Soelen, B., et al. 2015, MNRAS, 454, 1358.
- Connors et al. (2002) Connors, T. W., Johnston, S., Manchester, R. N., et al. 2002, MNRAS, 336, 1201
- Fujita et al. (2019) Fujita, Y., Kawachi, A., Akahori, T., et al. 2019, PASJ, 71, L3 (Paper I)
- Hare et al. (2019) Hare, J., Kargaltsev, O., Pavlov, G., et al. 2019, ApJ, 882, 74
- Johnston et al. (2005) Johnston, S., Ball, L., Wang, N., et al. 2005, MNRAS, 358, 1069
- Johnston et al. (1992) Johnston, S., Manchester, R. N., Lyne, A. G., et al. 1992, ApJ, 387, L37
- Johnston et al. (1994) Johnston, S., Manchester, R. N., Lyne, A. G., et al. 1994, MNRAS, 268, 430
- Johnston et al. (1996) Johnston, S., Manchester, R. N., Lyne, A. G., et al. 1996, MNRAS, 279, 1026
- Johnston et al. (1999) Johnston, S., Manchester, R. N., McConnell, D., et al. 1999, MNRAS, 302, 277
- Johnson et al. (2018) Johnson, T. J., Wood, K. S., Kerr, M., et al. 2018, ApJ, 863, 27
- Kargaltsev et al. (2014) Kargaltsev, O., Pavlov, G. G., Durant, M., et al. 2014, ApJ, 784, 124
- Kawachi et al. (2004) Kawachi, A., Naito, T., Patterson, J. R., et al. 2004, ApJ, 607, 949
- Kirk et al. (1999) Kirk, J. G., Ball, L., & Skjæraasen, O. 1999, Astroparticle Physics, 10, 31
- Kong et al. (2011) Kong, S. W., Yu, Y. W., Huang, Y. F., & Cheng, K. S. 2011, MNRAS, 416, 1067
- Miller-Jones et al. (2018) Miller-Jones, J. C. A., Deller, A. T., Shannon, R. M., et al. 2018, MNRAS, 479, 4849
- Negueruela et al. (2011) Negueruela, I., Ribó, M., Herrero, A., et al. 2011, ApJ, 732, L11
- Neronov & Chernyakova (2007) Neronov, A., & Chernyakova, M. 2007, Ap&SS, 309, 253
- Okazaki et al. (2011) Okazaki, A. T., Nagataki, S., Naito, T., et al. 2011, PASJ, 63, 893
- Pavlov et al. (2011) Pavlov, G. G., Chang, C., & Kargaltsev, O. 2011, ApJ, 730, 2
- Pavlov et al. (2015) Pavlov, G. G., Hare, J., Kargaltsev, O., et al. 2015, ApJ, 806, 192
- Pétri & Dubus (2011) Pétri, J., & Dubus, G. 2011, MNRAS, 417, 532
- Price et al. (2001) Price, S. D., Egan, M. P., Carey, S. J., et al. 2001, AJ, 121, 2819
- Shannon et al. (2014) Shannon, R. M., Johnston, S., & Manchester, R. N. 2014, MNRAS, 437, 3255
- Skrutskie et al. (2006) Skrutskie, M. F., Cutri, R. M., Stiening, R., et al. 2006, AJ, 131, 1163
- Tam et al. (2018) Tam, P. H. T., He, X.-B., Pal, P. S., et al. 2018, ApJ, 862, 165
- Takata et al. (2012) Takata, J., Okazaki, A. T., Nagataki, S., et al. 2012, ApJ, 750, 70
- Tavani et al. (1996) Tavani, M., Grove, J. E., Purcell, W., et al. 1996, A&AS, 120, 221
- Uchiyama et al. (2009) Uchiyama, Y., Tanaka, T., Takahashi, T., et al. 2009, ApJ, 698, 911
- van Soelen, & Meintjes (2011) van Soelen, B., & Meintjes, P. J. 2011, MNRAS, 412, 1721
- van Soelen et al. (2012) van Soelen, B., Meintjes, P. J., Odendaal, A., et al. 2012, MNRAS, 426, 3135
- Waters (1986) Waters, L. B. F. M. 1986, A&A, 162, 121
- Westerlund & Garnier (1989) Westerlund, B. E., & Garnier, R. 1989, A&AS, 78, 203