Hartree theory calculations of quasiparticle properties in twisted bilayer graphene
Abstract
A detailed understanding of interacting electrons in twisted bilayer graphene (tBLG) near the magic angle is required to gain insights into the physical origin of the observed broken symmetry phases. Here, we present extensive atomistic Hartree theory calculations of the electronic properties of tBLG in the (semi-)metallic phase as function of doping and twist angle. Specifically, we calculate quasiparticle properties, such as the band structure, density of states (DOS) and local density of states (LDOS), which are directly accessible in photoemission and tunnelling spectroscopy experiments. We find that quasiparticle properties change significantly upon doping - an effect which is not captured by tight-binding theory. In particular, we observe that the partially occupied bands flatten significantly which enhances the density of states at the Fermi level. We predict a clear signature of this band flattening in the LDOS in the AB/BA regions of tBLG which can be tested in scanning tunneling experiments. We also study the dependence of quasiparticle properties on the dielectric environment of tBLG and discover that these properties are surprisingly robust as a consequence of the strong internal screening. Finally, we present a simple analytical expression for the Hartree potential which enables the determination of quasiparticle properties without the need for self-consistent calculations.
I Introduction
The discovery of correlated insulator states and superconductivity in magic-angle twisted bilayer graphene (tBLG) Cao et al. (2018a, b); Yankowitz et al. (2019); Lu et al. (2019); Saito et al. (2019); Stepanov et al. (2019); Choi et al. (2019); Xie et al. (2019); Kerelsky et al. (2019); Jiang et al. (2019) has generated tremendous excitement and established the rapidly growing field of twistronics Carr et al. (2017); Jin et al. (2019); Wang et al. (2019); Cao et al. (2019); Kennes et al. (2020); Liu et al. (2016); Balents et al. (2020). Transport experiments have reported energy gaps in the electronic spectrum of tBLG at charge neutrality and when integer numbers of electrons are added to or removed from the moiré unit cell Lu et al. (2019); Stepanov et al. (2019); Balents et al. (2020), while band structure calculations based on the tight-binding or continuum model approach predict the system to be (semi-)metallic dos Santos et al. (2007); Bistritzer and MacDonald (2010); Morell et al. (2010); de Laissardière et al. (2010, 2012); Carr et al. (2018, 2019a). This indicates that electron-electron interactions play an important role in tBLG Guinea and Walet (2018).
To understand the properties of interacting electrons in tBLG, many different theoretical approaches have been used. In strong correlation techniques, such as dynamical mean-field theory Georges et al. (1996), Quantum Monte Carlo Yan et al. (2018); Liao et al. (2019) or exact diagonalization methods Ochi et al. (2018), an effective Hamiltonian for the flat-band electrons is often constructed by adding Hubbard-like interaction terms to a kinetic energy that describes the hopping between flat band Wannier functions Koshino et al. (2018); Kang and Vafek (2018); Goodwin et al. (2019a, b). However, the resulting Hamiltonian is relatively complicated and contains long-ranged hoppings Koshino et al. (2018). Moreover, the accurate determination of the Hubbard parameters is difficult and the construction of flat-band Wannier functions can be hindered by obstructions Po et al. (2019); Carr et al. (2019b).
In contrast, mean-field treatments of electron-electron interactions are conceptually more straightforward and do not require the construction of flat band Wannier functions. Cea, Walet and Guinea Cea et al. (2019) used Hartree theory within a continuum model of tBLG to calculate band structures and densities of states (DOS) as function of doping and twist angle. They found that the band structure of doped tBLG changes significantly when electron-electron interactions are included, with results that are in qualitative agreement with recent scanning tunnelling spectroscopy (STS) studies Choi et al. (2019); Xie et al. (2019); Kerelsky et al. (2019); Jiang et al. (2019) which showed that the Fermi level of the doped system can be pinned at the van Hove singularity (VHS). Several groups have also carried out Hartree-Fock calculations of tBLG and studied broken-symmetry phases Xie and MacDonald (2020); Cea and Guinea (2020); Zhang et al. (2020a); Bultinck et al. (2019); Liu et al. (2019); Liu and Dai (2020). These calculations are also all based on a continuum theory for the electronic structure of tBLG. While continuum model calculations are numerically very efficient, they typically employ a short-wavelength cutoff for the plane-wave expansion Cea et al. (2019) of the charge density and do not capture the effect of atomic scale Hubbard interactions.
Klebl and Honerkamp Klebl and Honerkamp (2019) carried out atomistic calculations of the spin susceptibility of tBLG with short-ranged atomic Hubbard interactions using the random-phase approximation and found that tBLG inherits magnetic properties from the untwisted bilayer Gonzalez-Arraga et al. (2017); Ramires and Lado (2019). Rademaker, Abanin and Mellado Rademaker et al. (2019) used Hartree theory within an atomistic tight-binding model to calculate the charge density, band structure and local density of states (LDOS) in the AA-stacked region of both undoped and hole-doped tBLG at a single twist angle (). They found that electron-electron interactions smoothen the charge density and observed significant changes in the band structure upon doping in qualitative agreement with the continuum Hartree theory calculations of Cea and coworkers Cea et al. (2019). More recently, González and Stauber González and Stauber (2020) investigated broken symmetry phases using atomistic Hartree-Fock theory at a single twist angle (), with particular focus on the influence of the dielectric environment on their relative stability.
In this article, we present a systematic study of the effect of long-ranged Coulomb interactions on the band structure, DOS and LDOS as a function of twist angle and doping in tBLG near the magic angle. Specifically, we carry out self-consistent atomistic Hartree calculations. For tBLG suspended in air, we find that electron-electron interactions induce significant changes to the band structure of doped tBLG. In particular, for twist angles near (but not directly at) the magic angle, the partially occupied bands flatten while the unoccupied or fully occupied bands become more dispersive. This explains both the Fermi level pinning and the different shapes of the VHS observed in recent STS experiments. While most STS experiments have focused on the enhancement of LDOS in AA regions of tBLG, we also predict a significant enhancement of the peak in the AB regions, and hypothesize that these peaks are responsible for instabilities to broken-symmetry states even when the system is not at the magic angle. We also study the dependence of the band structure on the dielectric environment and find that the environment-induced changes are relatively small. This is a consequence of the large internal dielectric screening of tBLG. We do not explicitly investigate broken-symmetry states in this work.
II Methods
We study commensurate moiré unit cells of tBLG, defined using the convention of Ref. de Laissardière et al. (2010). We start from an AA stacked bilayer and rotate the top layer anticlockwise about an axis that passes through a carbon atom in both layers. The moiré lattice vectors are given by and , where and are integers and and denote the lattice vectors of graphene with being the lattice constant of graphene.
At small twist angles, tBLG undergoes significant in-plane and out-of-plane atomic relaxations Uchida et al. (2014); Nam and Koshino (2017); Lucignano et al. (2019); Jain et al. (2017); Gargiulo and Yazyev (2018); Walet and Guinea (2019). We calculate these relaxations using classical force fields: interactions between atoms in the same graphene layer are modelled using the AIREBO-Morse potential O’Connor et al. (2015), whilst the Kolmogorov-Crespi potential Kolmogorov and Crespi (2005) is used for interactions between atoms in different layers. All relaxations are carried out with the LAMMPS software package Plimpton (1995).
To calculate electronic properties of tBLG, we use atomistic Hartree theory and diagonalize the following Hamiltonian
| (1) |
where and () denote the on-site energy of a carbon atom and the electron creation (annihilation) operator associated with the pz-orbital on atom , respectively. The hopping parameters between atoms and are obtained using the standard Slater-Koster rules Slater and Koster (1954)
| (2) |
with and with eV and eV Corsetti et al. (2017); Slater and Koster (1954); Neto et al. (2009). Note that is the carbon-carbon bond length and and de Laissardière et al. (2010, 2012). Hoppings between carbon atoms whose distance is larger than the cutoff are neglected Angeli et al. (2018).
The on-site energy is determined by the Hartree potential energy according to
| (3) |
where denotes the carbon pz-orbital at position in the first unit cell [note that is periodic in the moiré unit cell]. The Hartree potential is obtained from the electron density and the screened electron-electron interaction via
| (4) |
where is a reference electron density that ensures overall charge neutrality.
We consider two cases for the screened interaction. One is for tBLG encapsulated by a dielectric substrate with background dielectric constant and, hence, a screened interaction given by . The other is for the case when there is the additional presence of metallic gates on both sides of the dielectric substrate. Assuming that the tBLG lies in the - plane, the screened interaction in this case is given by
| (5) |
where is the thickness of the dielectric substrate separating tBLG from the metallic gate on each side Throckmorton and Vafek (2012); Goodwin et al. (2019c).
The charge density can be expressed in terms of the Bloch eigenstates (with subscripts and denoting a band index and the crystal momentum, respectively) of the Hamiltonian in Eq. (1) according to
| (6) |
where is the occupancy of state with eigenvalue (where is the Fermi energy), (with denoting the moiré lattice vectors) and is the total number of electrons in the -th orbital. Note that we neglect contributions to the density that result from the overlap of pz-orbitals on different atoms.
To construct the reference electron density , we note that the hopping parameters of Eq. (1) were obtained from fits to band structures of graphene and untwisted graphene bilayers calculated using density-functional theory (DFT) and, therefore, include the Hartree potential energy of the uniform system (when the occupancy of all carbon atoms is equal) de Laissardière et al. (2012, 2010); Corsetti et al. (2017). To exclude this contribution to in our tBLG calculations, we use the reference density
| (7) |
where is the average of . The average filling can be expressed as , where denotes the number of electrons that have been added to or removed from the moiré unit cell and is the total number of states (also atoms in the moiré unit cell).
To obtain a self-consistent solution of the atomistic Hartree equations, we proceed as follows. We first set and diagonalize the Hamiltonian, Eq. (1), using an k-point grid to sample the first Brillouin zone. From the eigenstates without a potential we first calculate . Next, we calculate the on-site energies via
| (8) |
where . If and , we set with eV Wehling et al. (2011). This is equivalent to treating as a delta-function when considering interactions between different atoms. We carry out calculations for both (tBLG suspended in air) and (tBLG sandwiched between hexagonal boron nitride). To converge the sum over moiré lattice vectors, we use a supercell.
In each subsequent iteration of the self-consistent cycle, we mix a fraction of the new Hartree potential with the Hartree potential from the previous iteration. A mixing fraction of 0.1, i.e., the addition of 10 percent of the new potential to 90 percent of the potential from the previous iteration, was found to give satisfactory results in most cases. In a few cases, however, smaller values for the mixing fraction were used to improve convergence. Typically, the Hartree potential converges within 60 iterations to an accuracy of better than 0.1 meV for all doping levels and twist angles considered.
In order to calculate the density of states (DOS) per moiré cell, we sample the first Brillouin zone using approximately 6,000 k-points and represent the contribution from each energy level as a gaussian. A similar procedure is used for the local density of states (LDOS). Note that we average the LDOS over atoms within a radius of [we found that the results do not depend qualitatively on the radius chosen, provided it is larger than the length scale of the carbon-carbon bond length and smaller than the moiré length scale ].
III Results and Discussion
III.1 Band structure
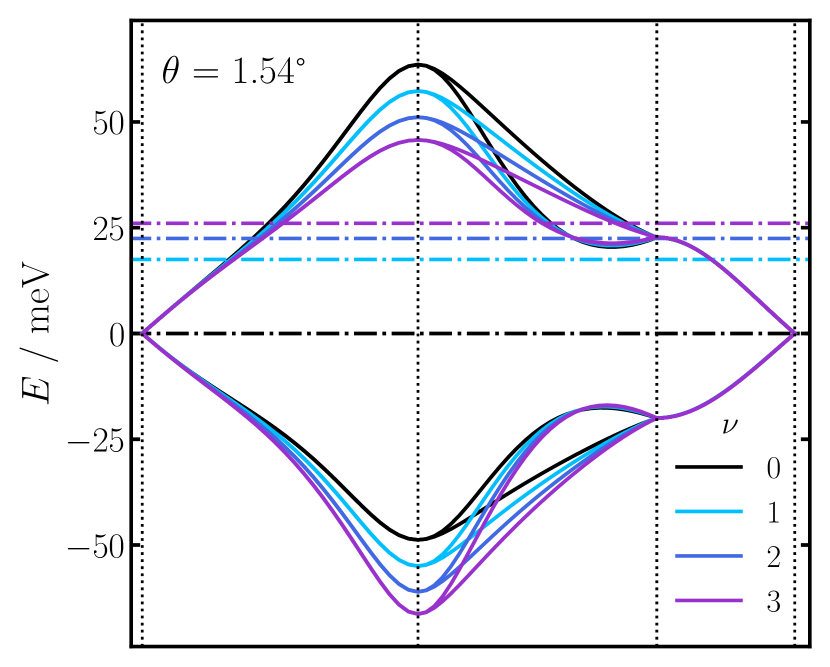
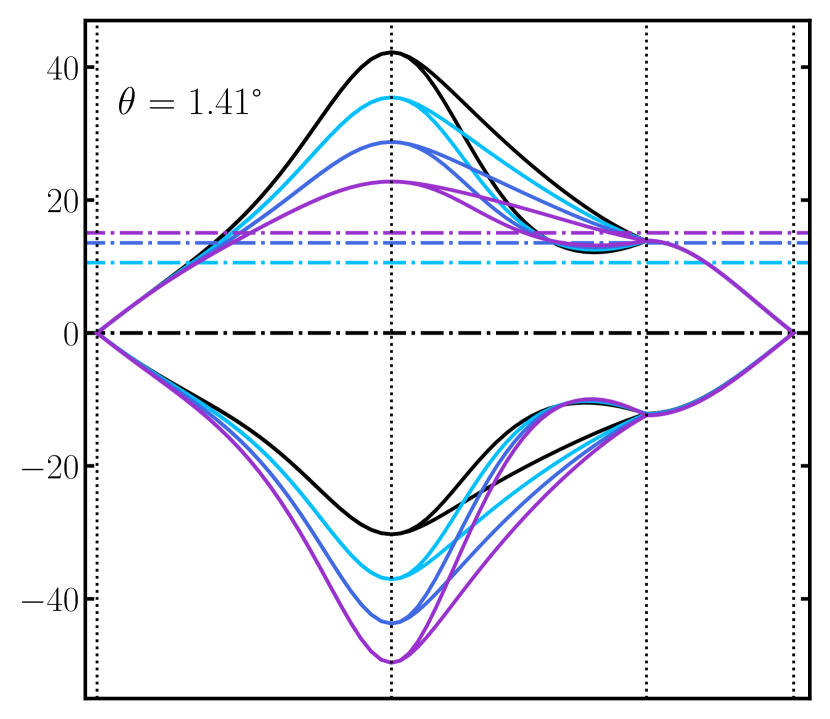
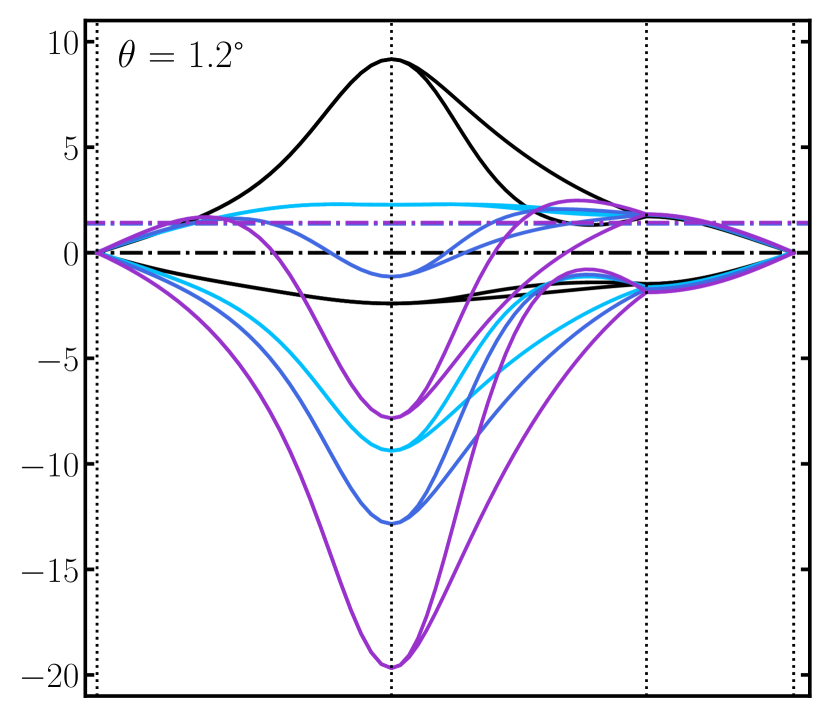
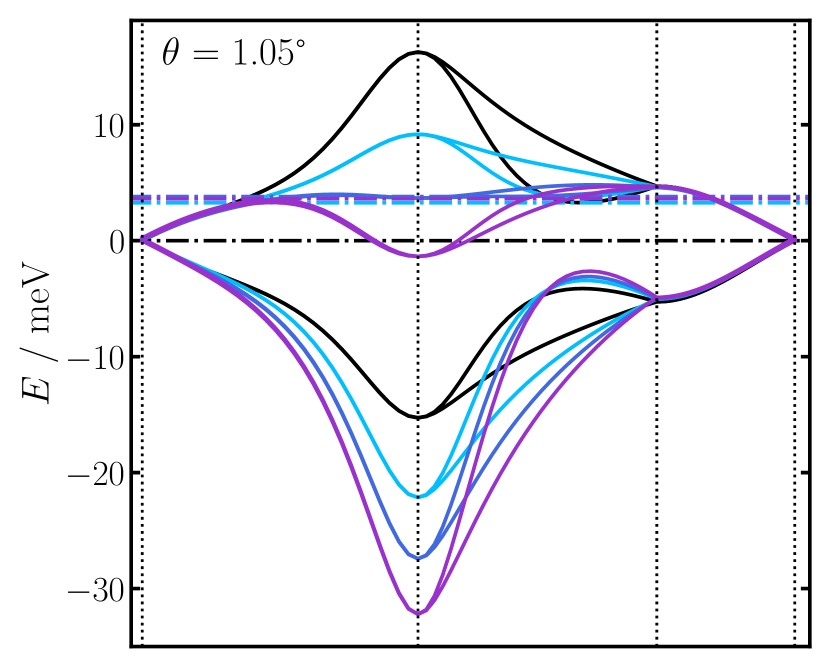
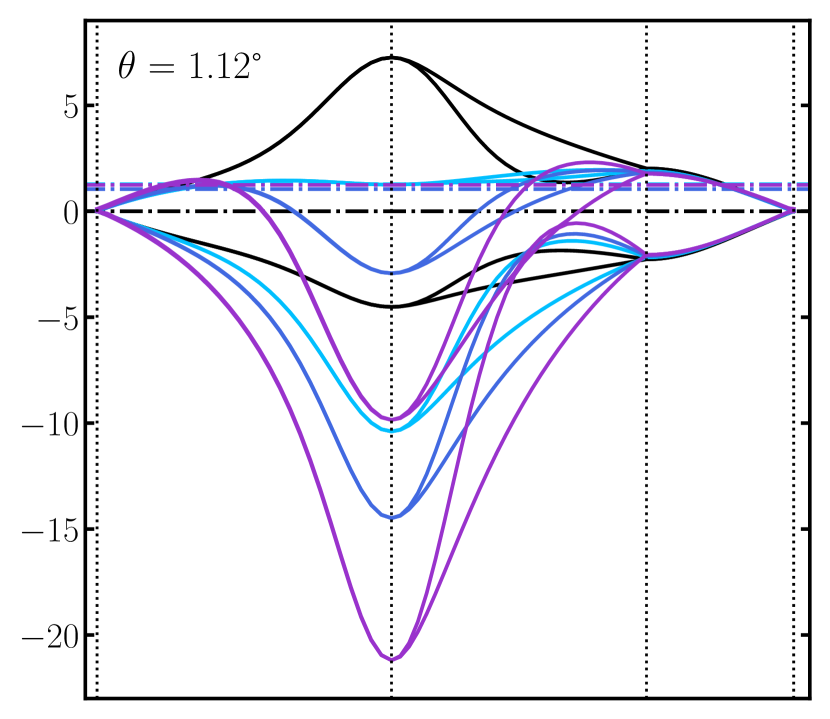
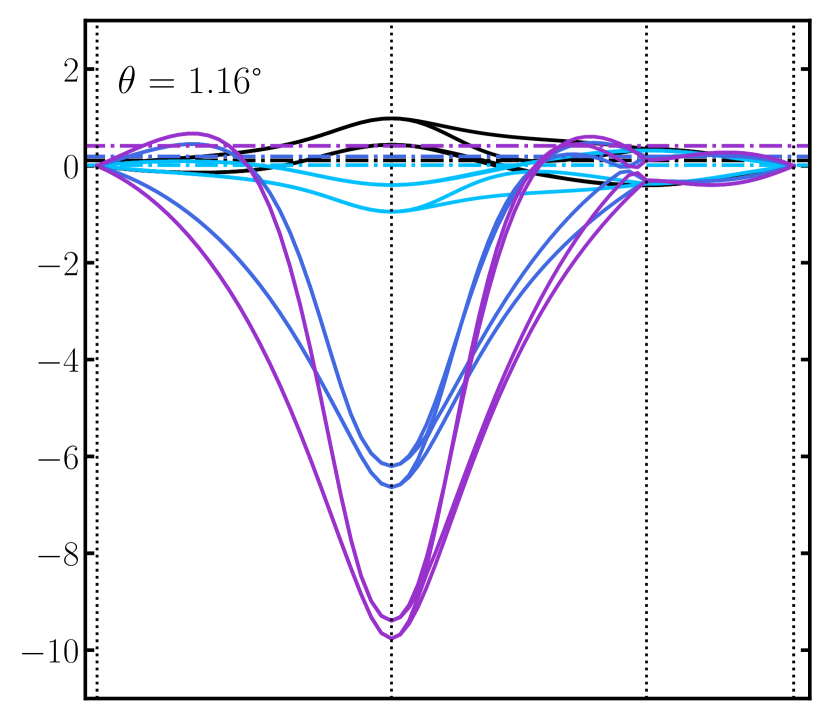
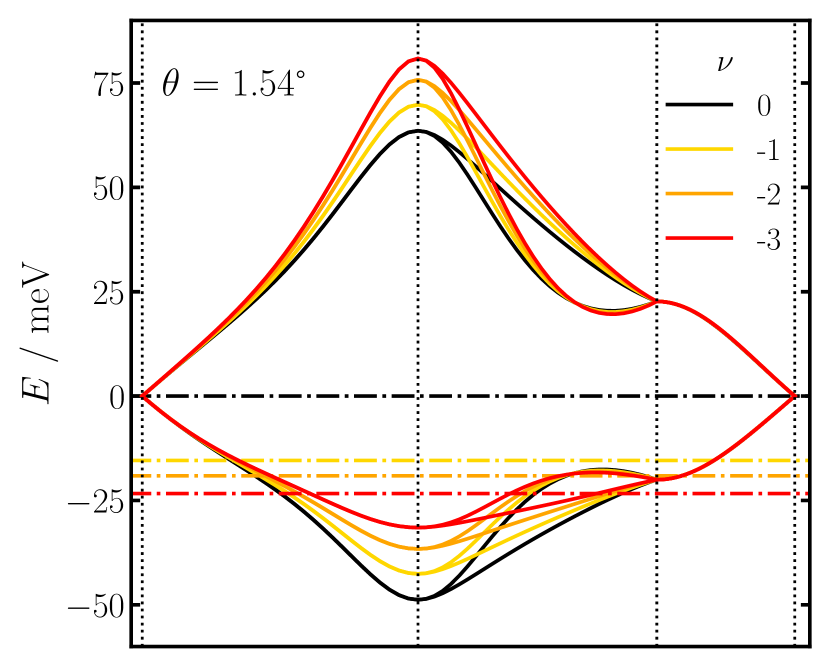
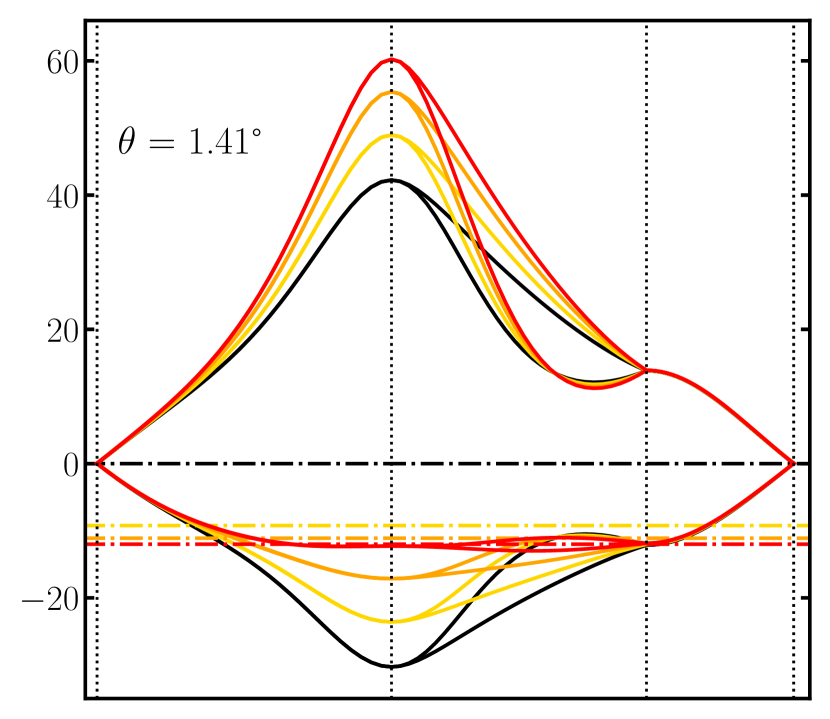
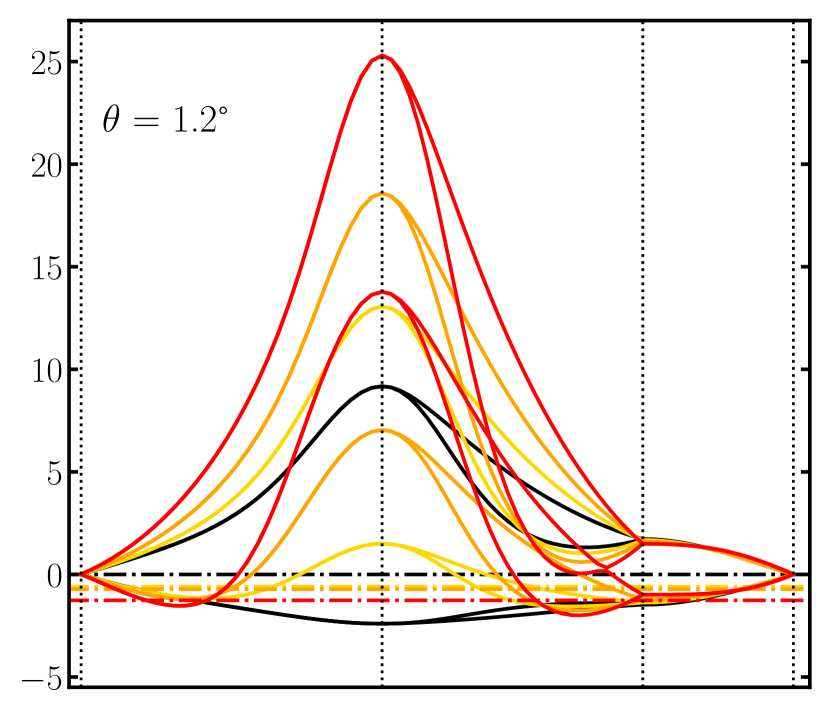
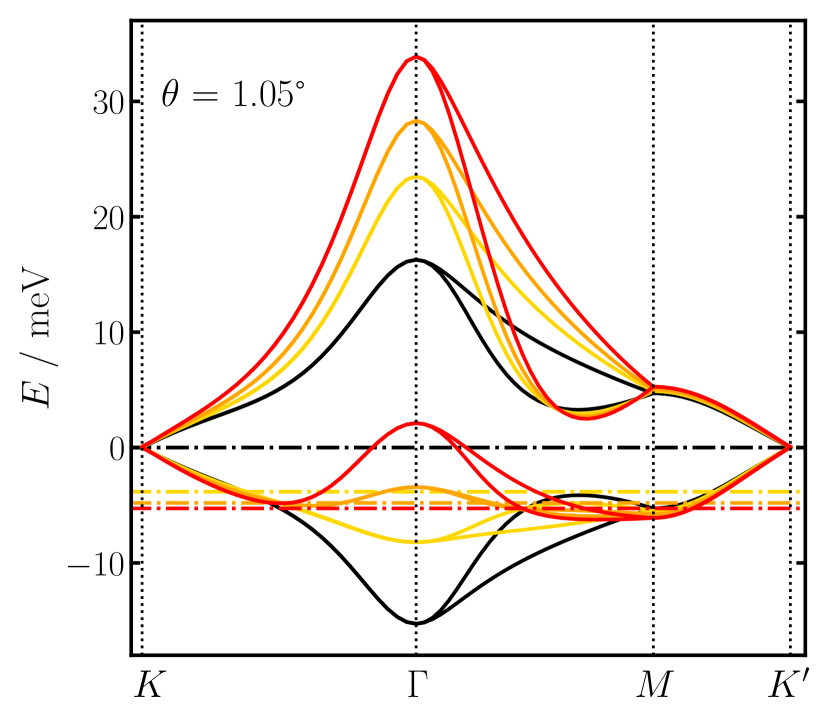
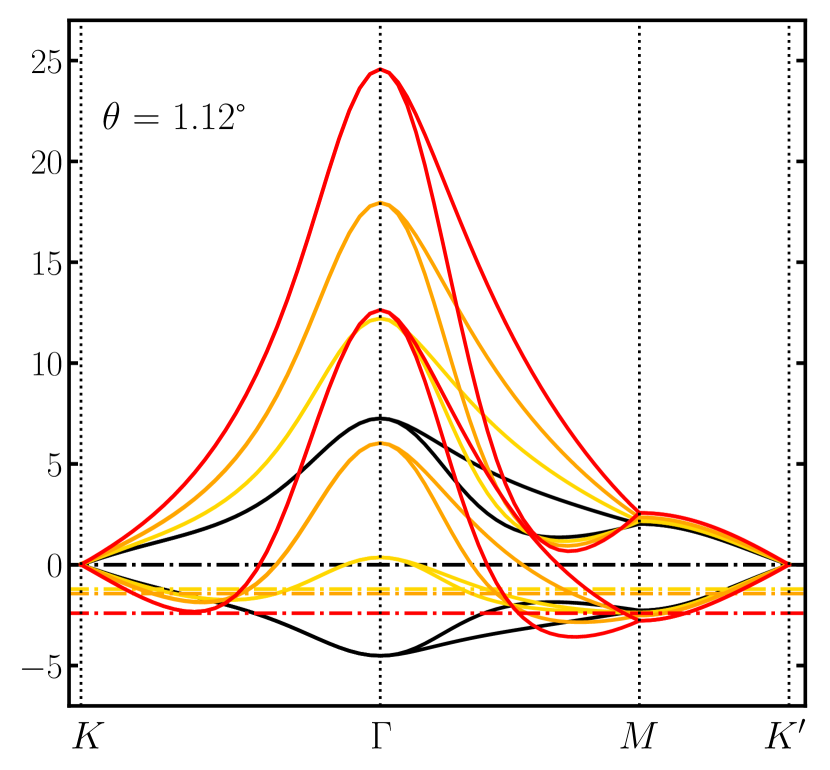
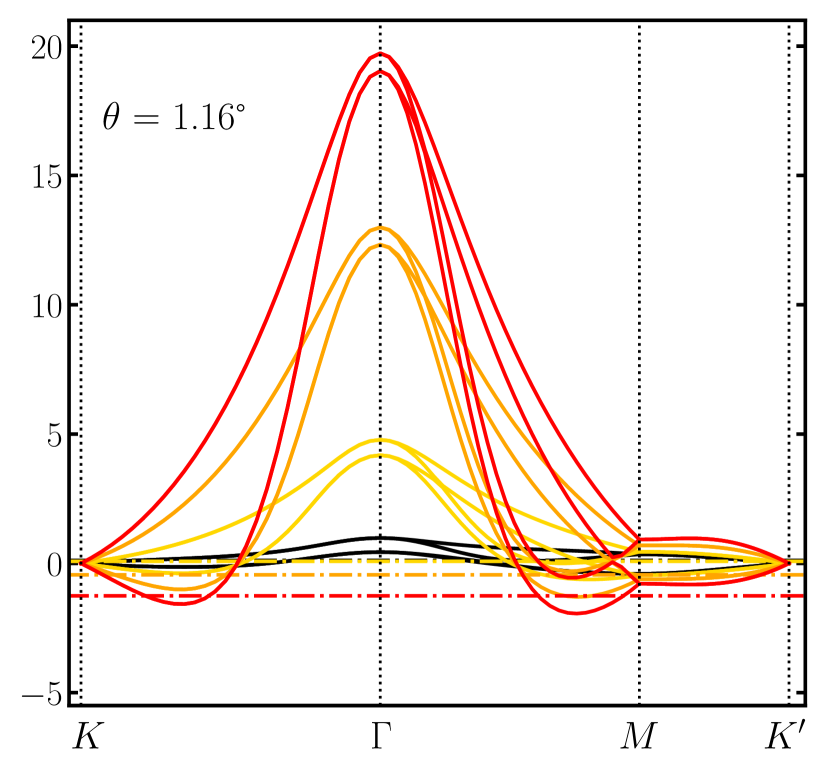
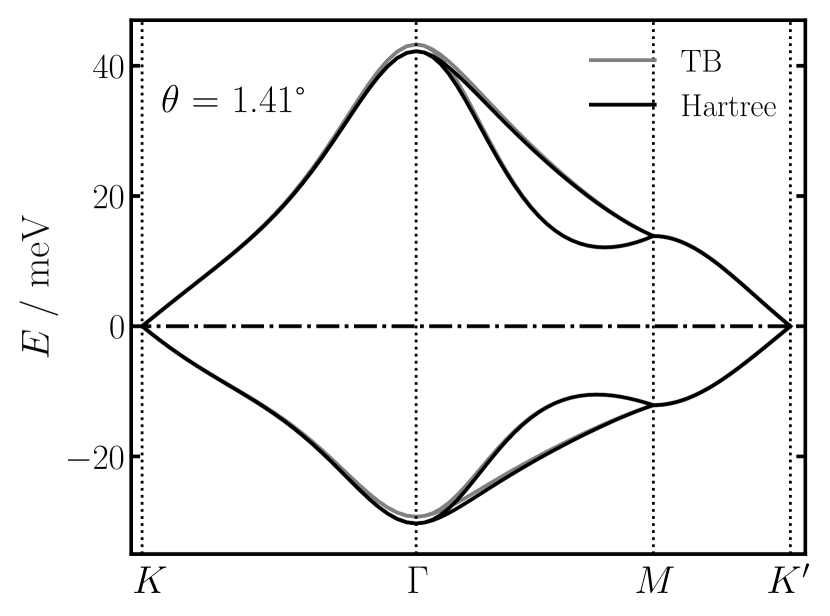
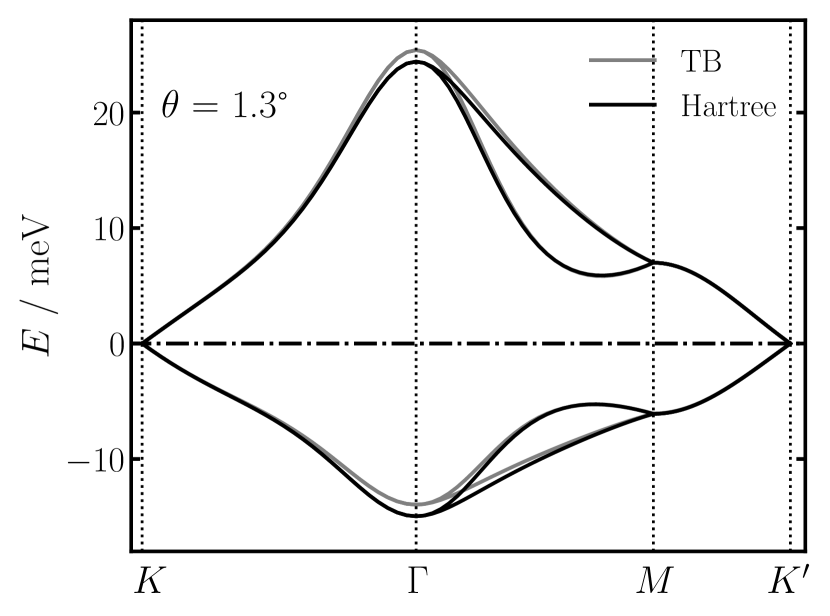
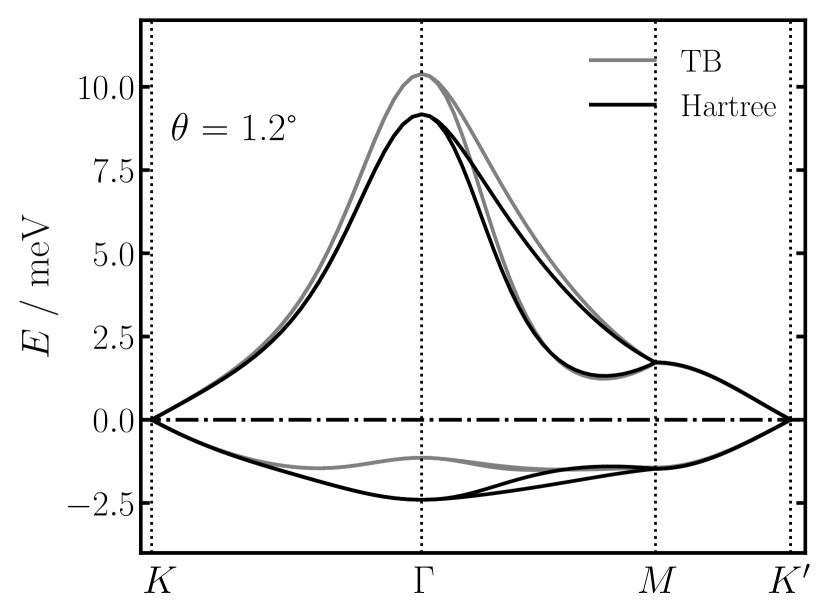
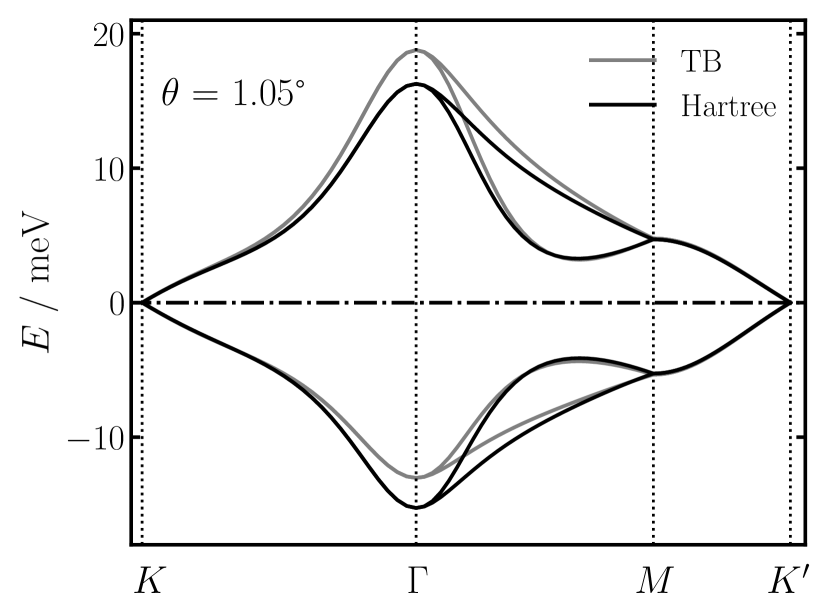
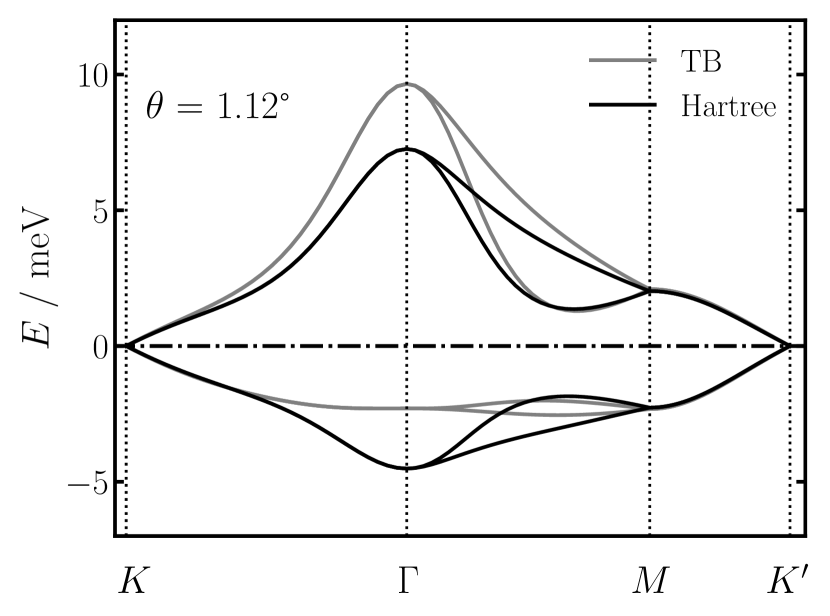
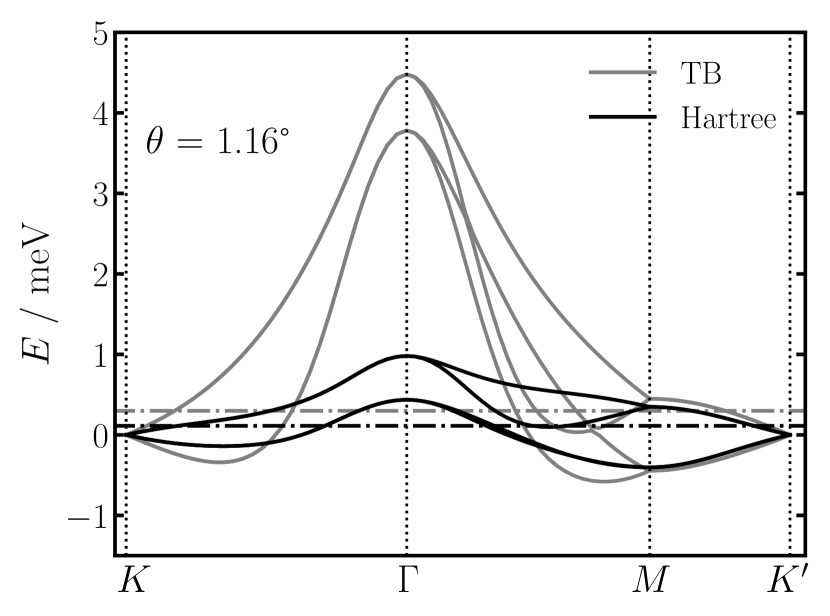
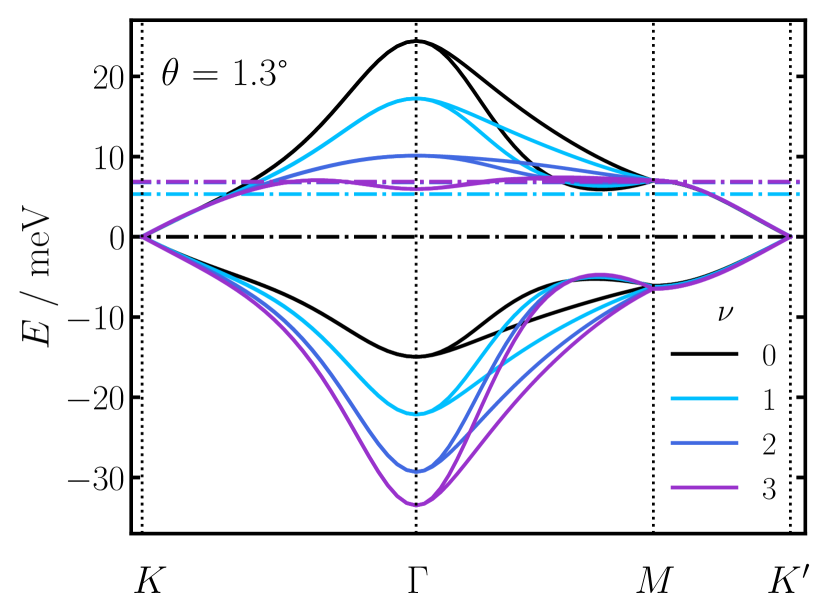
Figure 1 shows the band structures of tBLG suspended in air () from Hartree theory at six twist angles between and (below, we show that a dielectric substrate only leads to small changes in the Hartree band structures). Only the four flat bands closest to the Fermi energy are shown. We refer to the lower two of the flat bands as the flat valence bands and the upper two as the flat conduction bands. These four bands are separated from all other bands by energy gaps that result from the atomic corrugation of tBLG Koshino et al. (2018); Goodwin et al. (2019a); Lucignano et al. (2019); Carr et al. (2019a); Nam and Koshino (2017); Angeli et al. (2018). The width of the flat band manifold is smallest at and we refer to this twist angle as the magic angle.
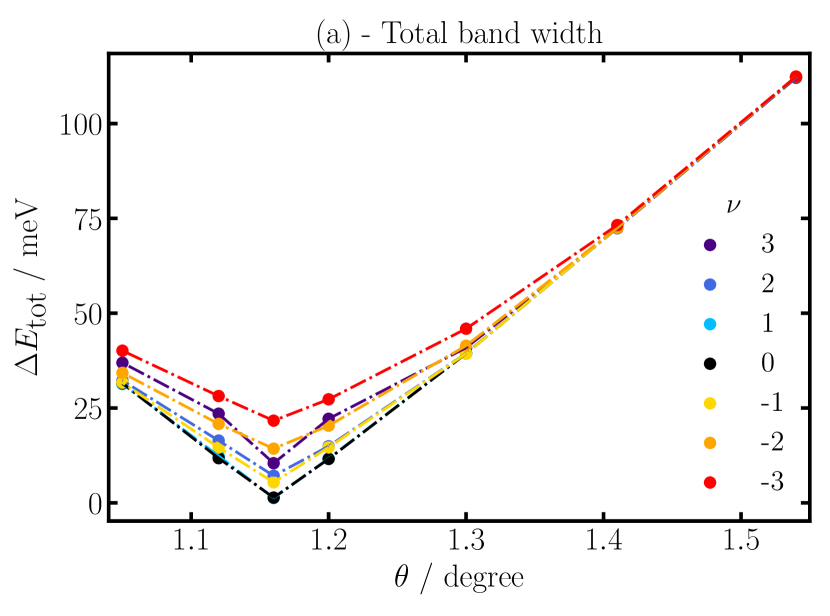
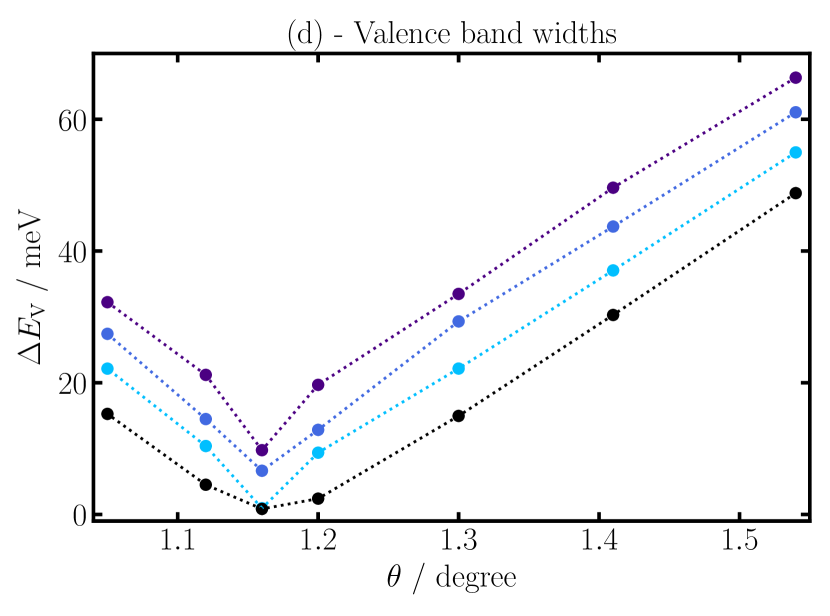
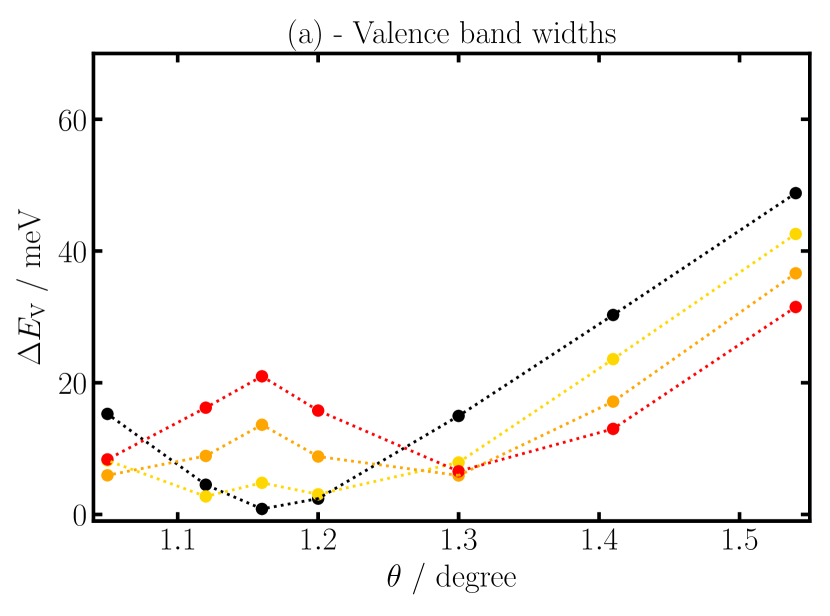
We first discuss the band structures of undoped tBLG, corresponding to (black curves in Fig. 1). The band structures at all twist angles except the magic angle are semi-metallic and feature linear bands at the and points. As the magic angle is approached, the total width of the flat band manifold decreases rapidly, see Fig. 2(a). Interestingly, at charge neutrality, the valence band widths are always smaller than the conduction band widths, see Figs. 2(c) and (d).
At the magic angle, the band structure of undoped tBLG is qualitatively different as compared to the other twist angles Carr et al. (2019a); Choi and Choi (2018). In particular, the two valence bands at are pushed up and are now higher in energy than the states at and . As a consequence, at this level of theory, tBLG is metallic at the magic angle even without doping with additional carriers.
The Hartree band structures of undoped tBLG are very similar to the non-interacting tight-binding band structures (see Supplementary Materials for a comparison). This can be understood by analyzing the charge density and the corresponding Hartree potential. Without doping the charge density oscillates on the atomic scale, but each region of the moiré unit cell is approximately charge neutral (when the atomic oscillations are averaged over a region) Rademaker et al. (2019) resulting in a small Hartree potential [Eq. (4)], as we shall discuss further later.
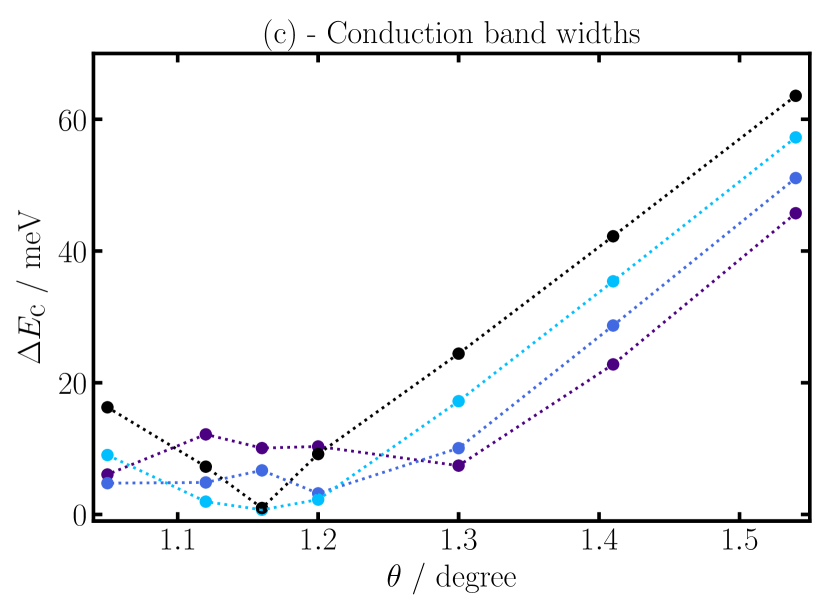
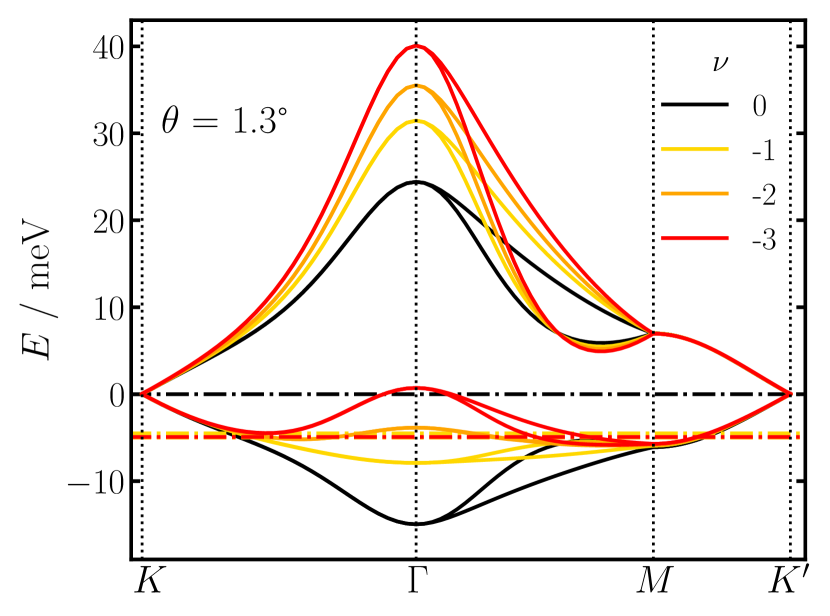
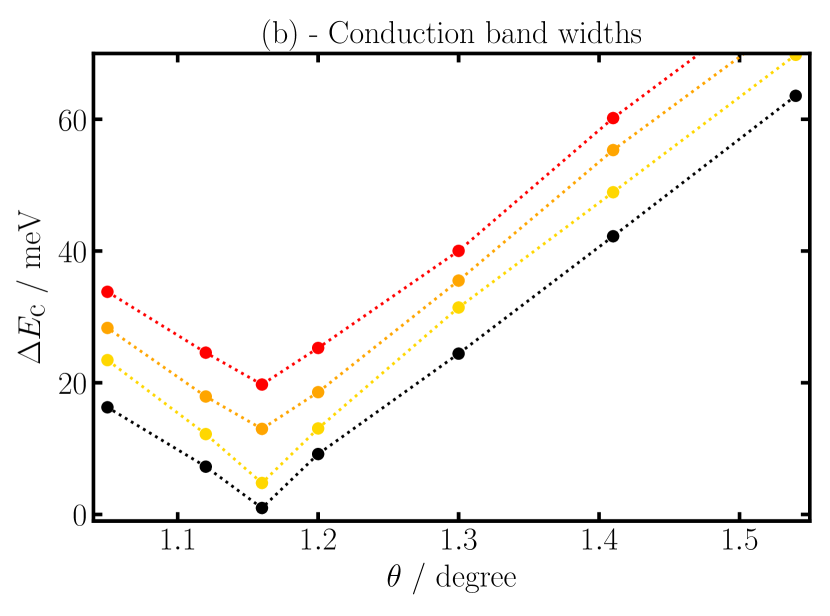
Figure 1 also shows Hartree band structures for electron-doped (upper two rows) and hole-doped (lower two rows) tBLG. In agreement with previous Hartree calculations Cea et al. (2019); Rademaker et al. (2019); Guinea and Walet (2018), we observe that doping results in significant changes in the band structures. In contrast, the tight-binding band structures that are widely used to understand the electronic properties of doped tBLG do not change upon doping. Focusing first on the largest twist angle considered, , electron doping (corresponding to , 2 or 3) flattens the conduction bands, while the valence bands become more dispersive. Figure 2(c) shows that the conduction band width decreases by approximately meV for each added electron. However, the valence band width increases by the same amount [Fig. 2(d)] and the total band width of the flat band manifold remains constant at this twist angle, as shown in Fig. 2(a). For hole doping (, and ), the situation is similar but the valence bands flatten and the conduction bands become more dispersive.
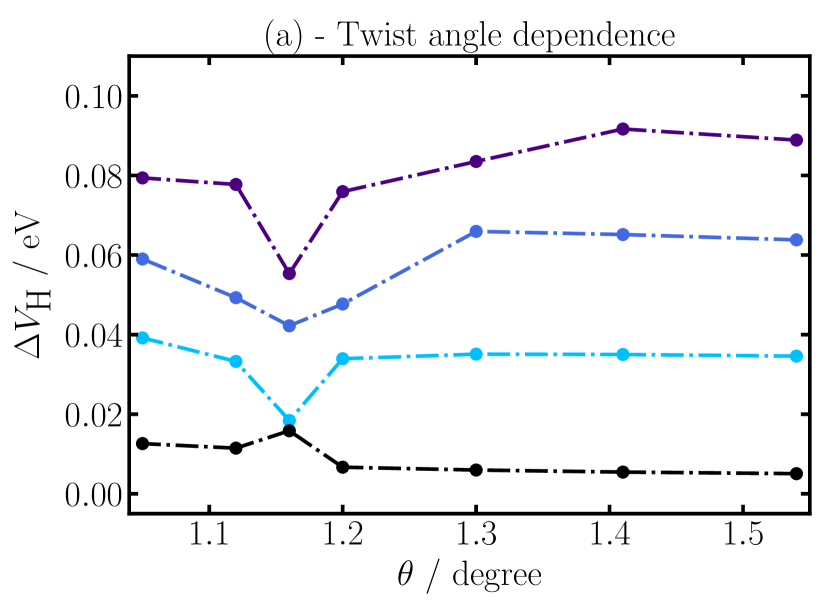
To understand why electron-electron interactions are more relevant for the doped system, we analyze again the charge density and the corresponding Hartree potential (the explanation here follows that outlined by Rademaker et al. in Ref. Rademaker et al. (2019)). As the local density of states is larger in the AA regions than in the AB/BA regions, additional carriers (both electrons and holes) preferentially localize in the AA regions Rademaker et al. (2019). This creates a highly non-uniform charge distribution, which gives rise a strong Hartree potential Rademaker et al. (2019). Fig. 6(a) shows that (the difference between the Hartree potential in the centers of the AA and AB regions) increases by approximately meV for each added electron. States near the and points are localized in the AA regions and are pushed up in energy relative to the states at (which have a ring-like shape surrounding the AA regions) for electron-doped systems Rademaker et al. (2019). In contrast, the / states are pushed down in energy relative to the -states for hole-doped systems Rademaker et al. (2019).
For smaller twist angles, doping induces even more significant changes in the band structure. At , the valence bands are almost completely flat between and for . In contrast, the flattening of the conduction bands upon electron doping is not quite as pronounced at this twist angle. For , the -states have moved past the /-states so that the curvature of the conduction band at changes sign at all doping levels (both electron and hole doping) except . For this doping level, the conduction band is very flat in the vicinity of the -point. Interestingly, for the width of the conduction bands exhibits a local minimum at , see Fig. 2(c), and is even smaller than at the magic angle (defined as the twist angle that exhibits the smallest total band width of the flat band manifold, ). Similarly, for the width of the conduction bands exhibits a local minimum at . This suggests that long-ranged Coulomb interactions between electrons can modify the twist angle at which electron correlation phenomena are strongest and that this may not necessarily be at the magic angle.
These qualitative changes in the band structures of doped tBLG close to the magic angle can be understood by analyzing the twist angle dependence of the Hartree potential. Fig. 6(a) shows that only depends weakly on the twist angle. In contrast, the band widths decrease rapidly as the magic angle is approached and therefore the importance of long-ranged electron-electron increases strongly.
At the magic angle (), the band structures of hole-doped tBLG (, and ) look qualitatively similar to the undoped band structure, but with a significantly larger band width. For example, for we find a band width of 13 meV (compared to 1 meV for the undoped system). For electron-doped systems, the conduction bands ‘invert’ such that both the valence and conduction bands at are at lower energies than the states at and .
For twist angles smaller than the magic angle, the band structures of doped tBLG are quite similar to those of twist angles larger than the magic angle. In particular, the band structures at correspond closely to those of (both differ from the magic angle by ) and the band structures of are similar to those of (which differ from the magic angle by and , respectively).
III.2 DOS and LDOS
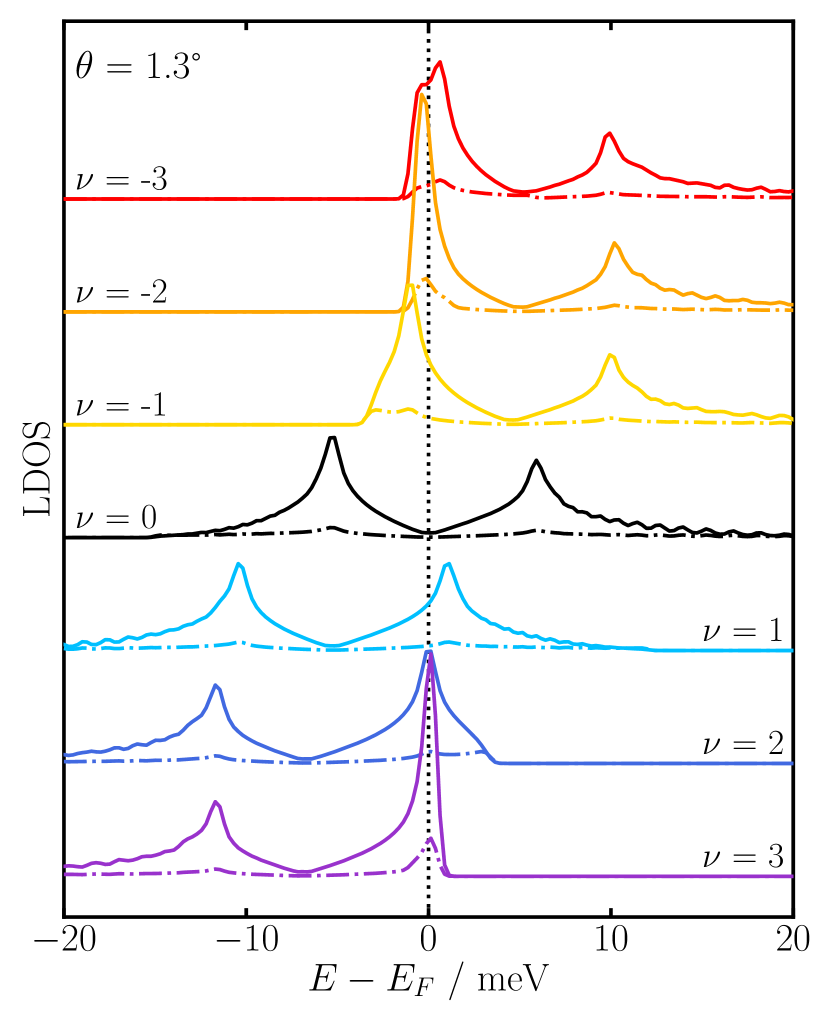
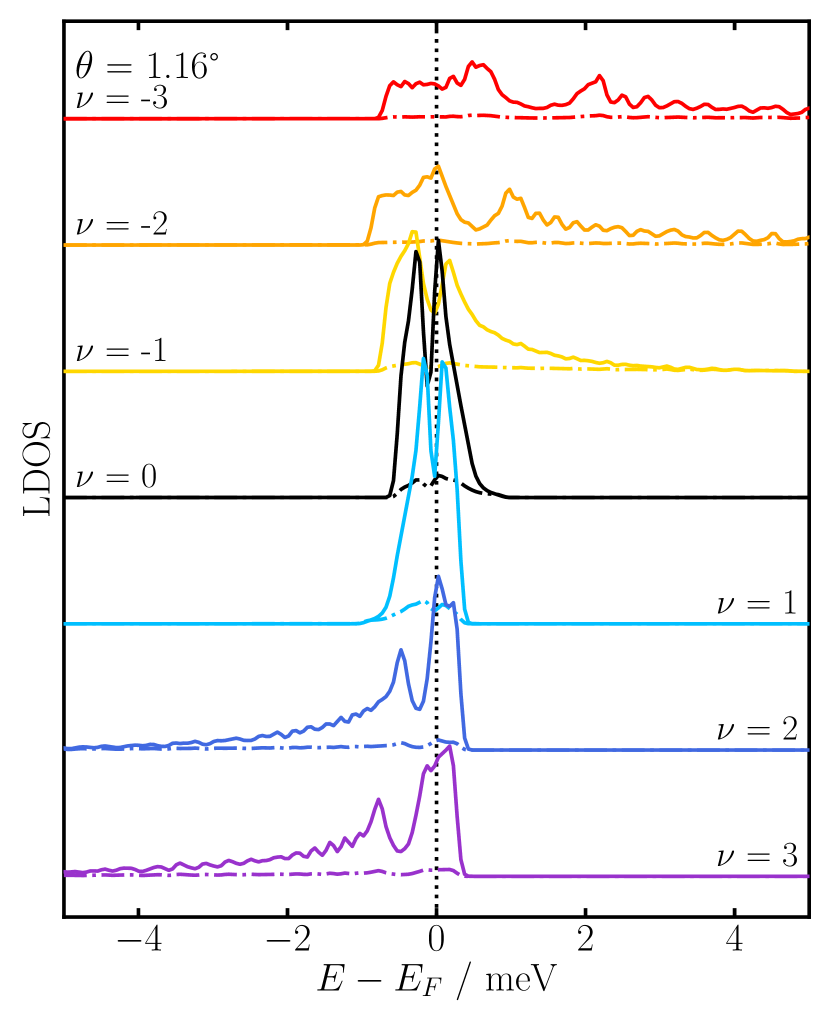
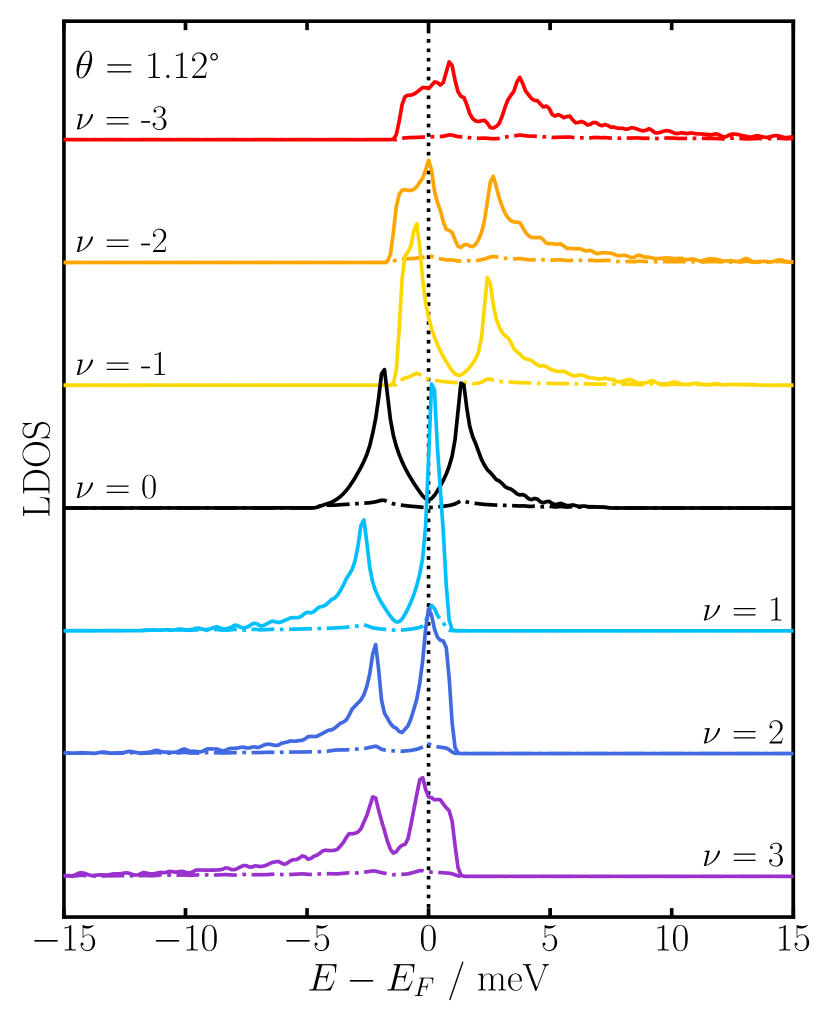
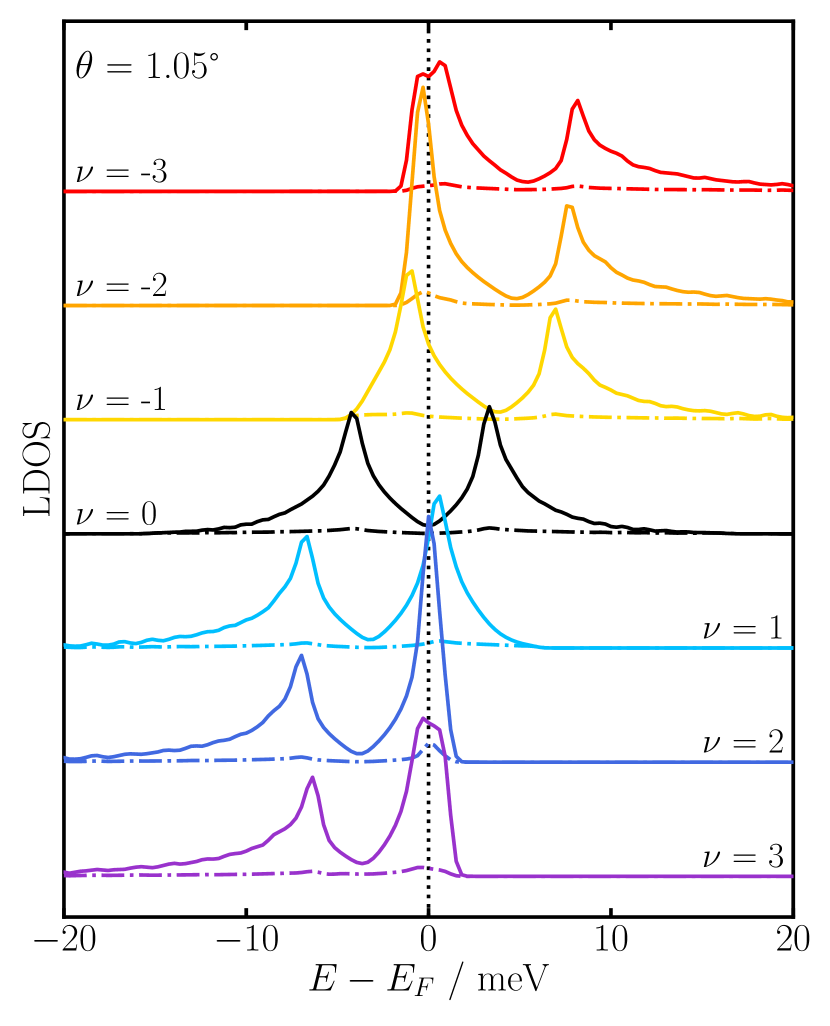
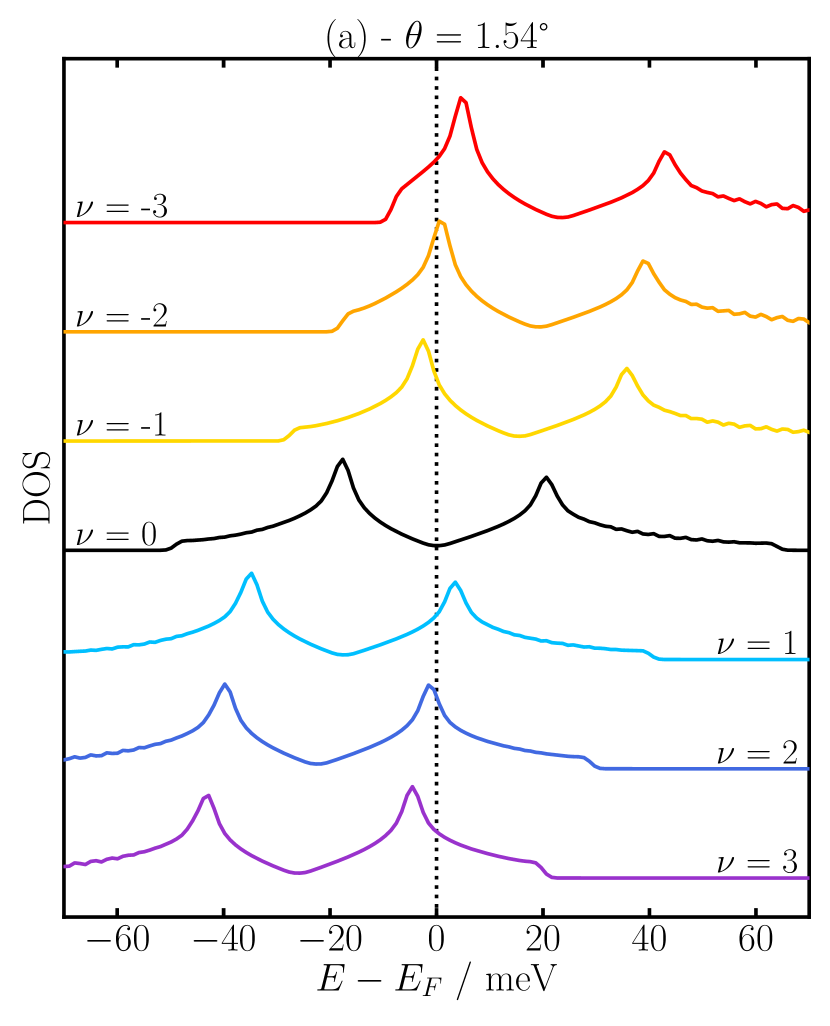
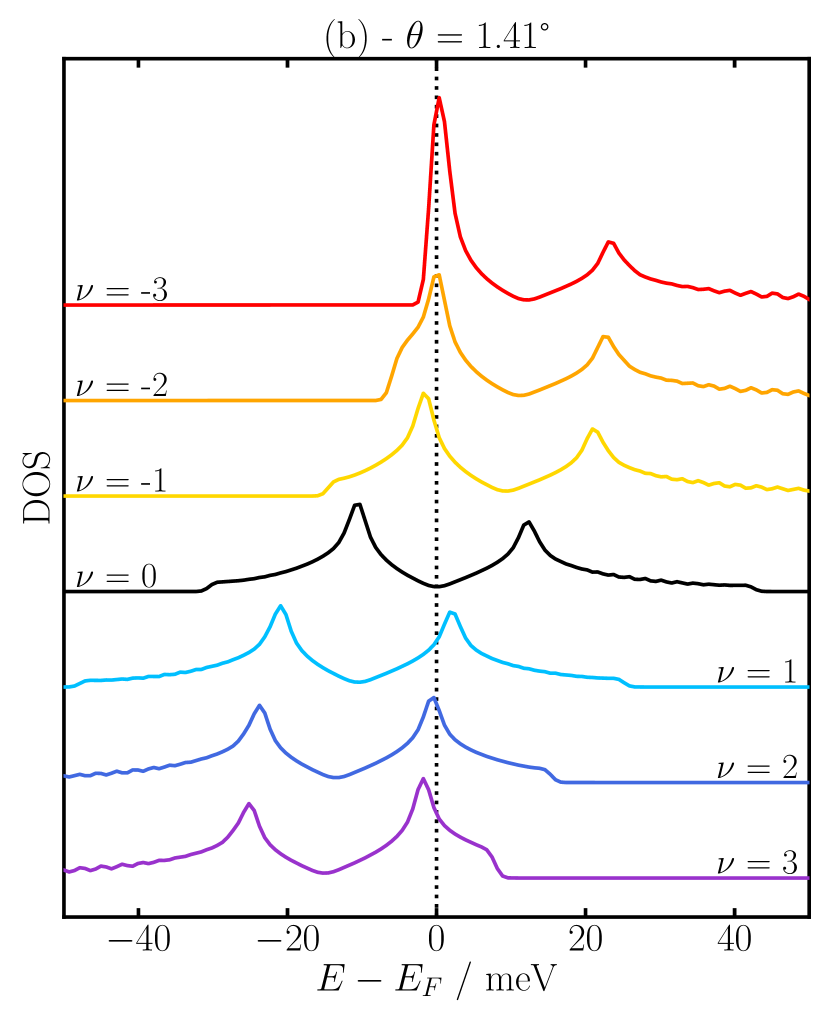
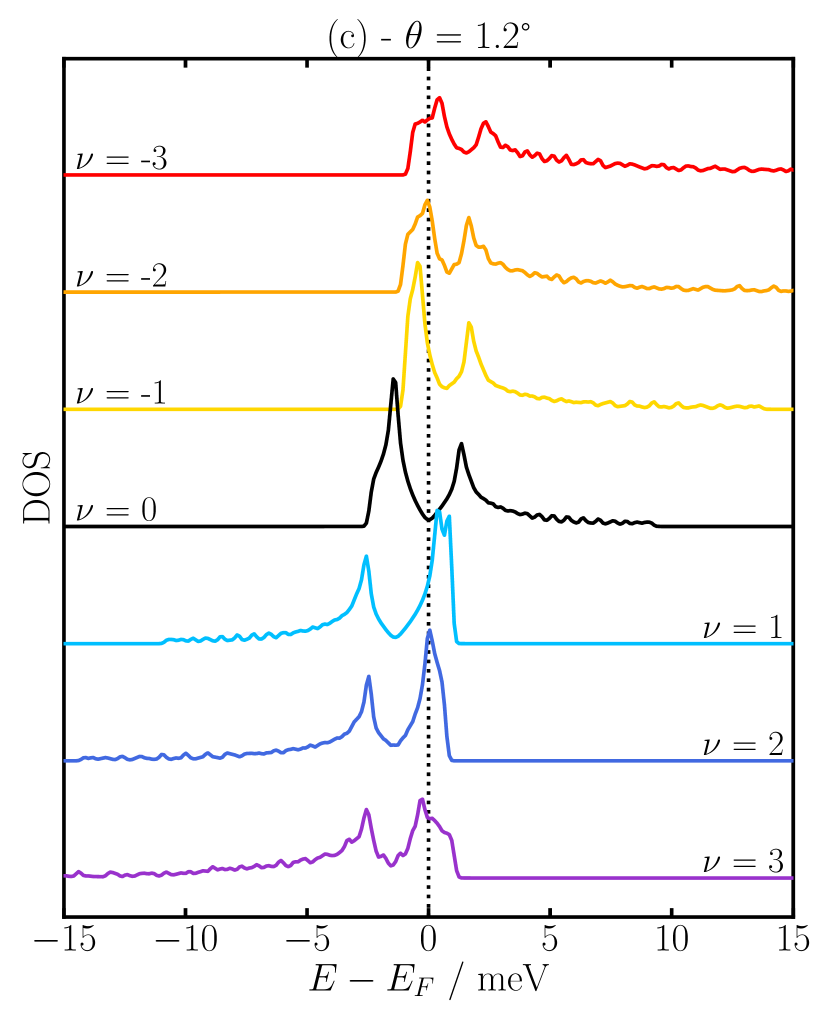
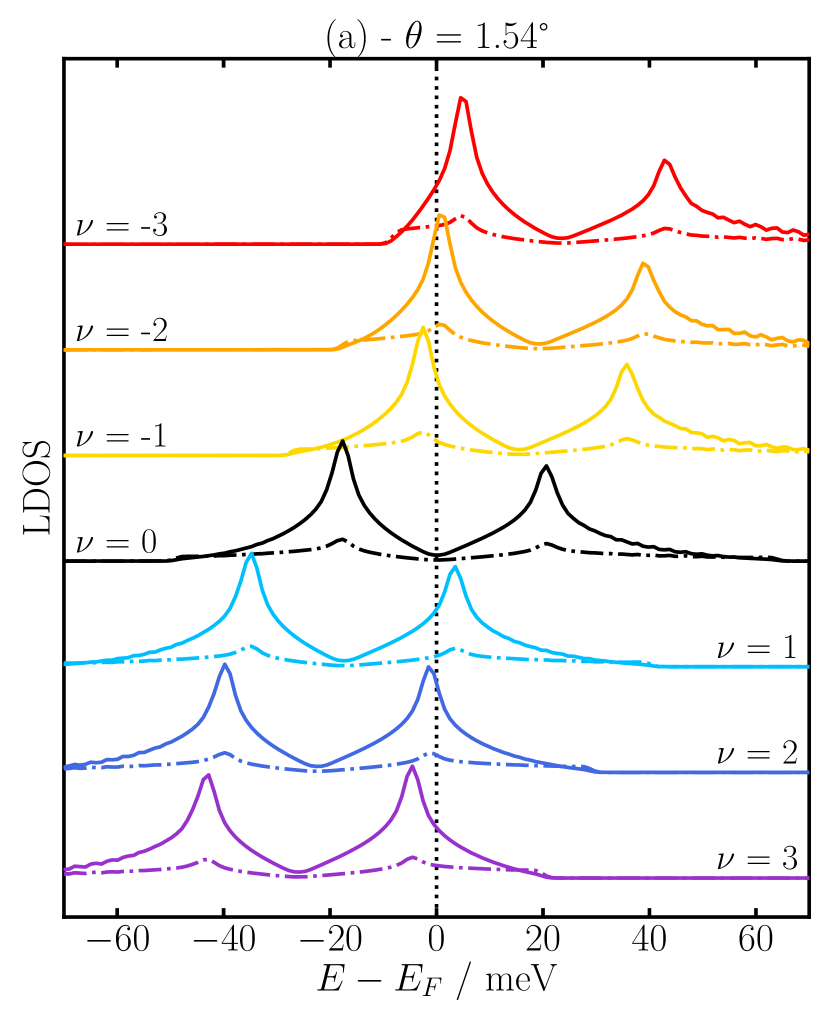
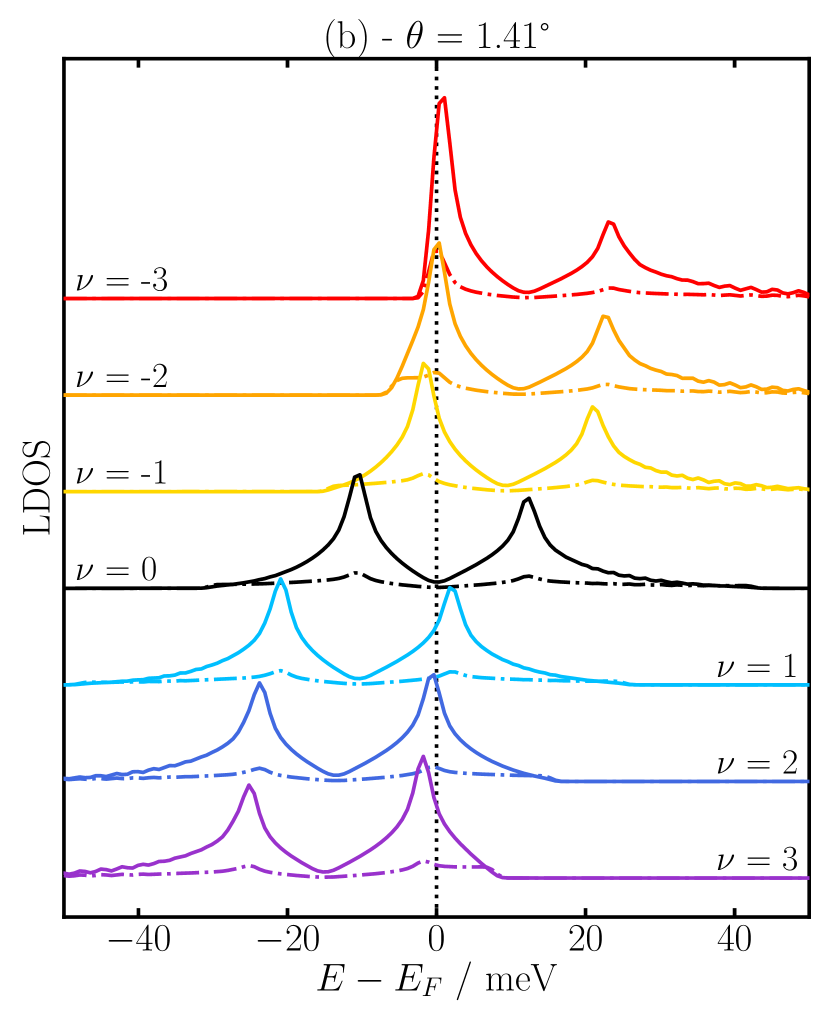
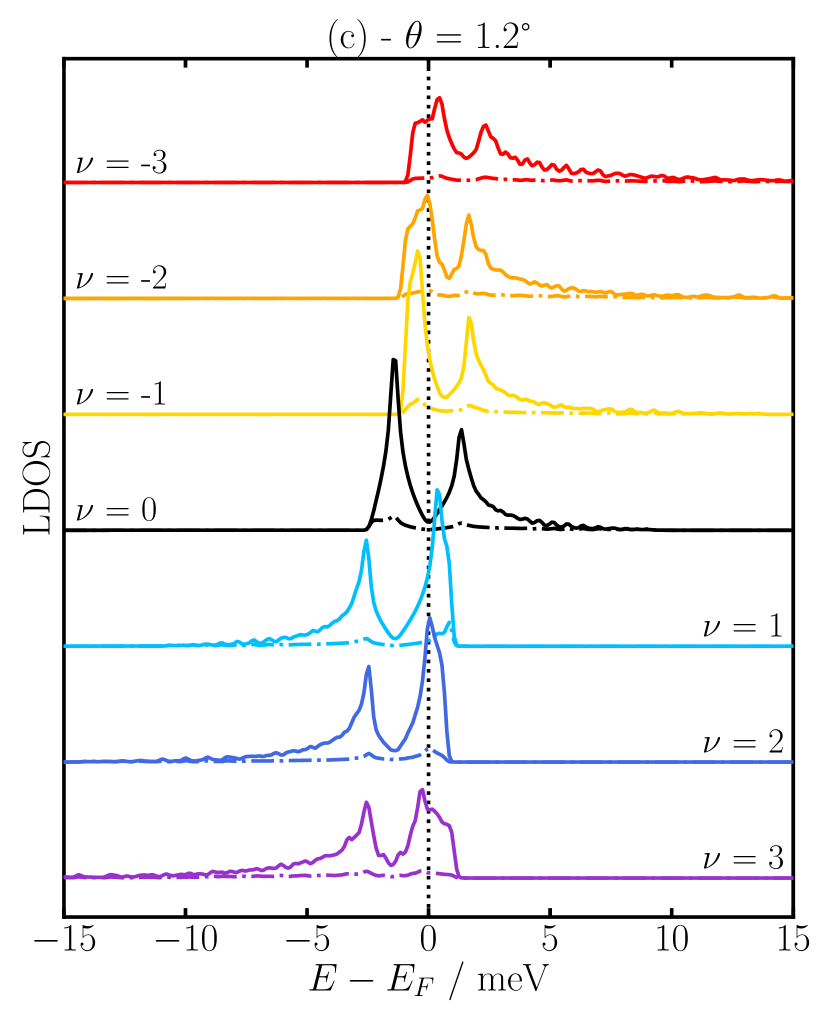
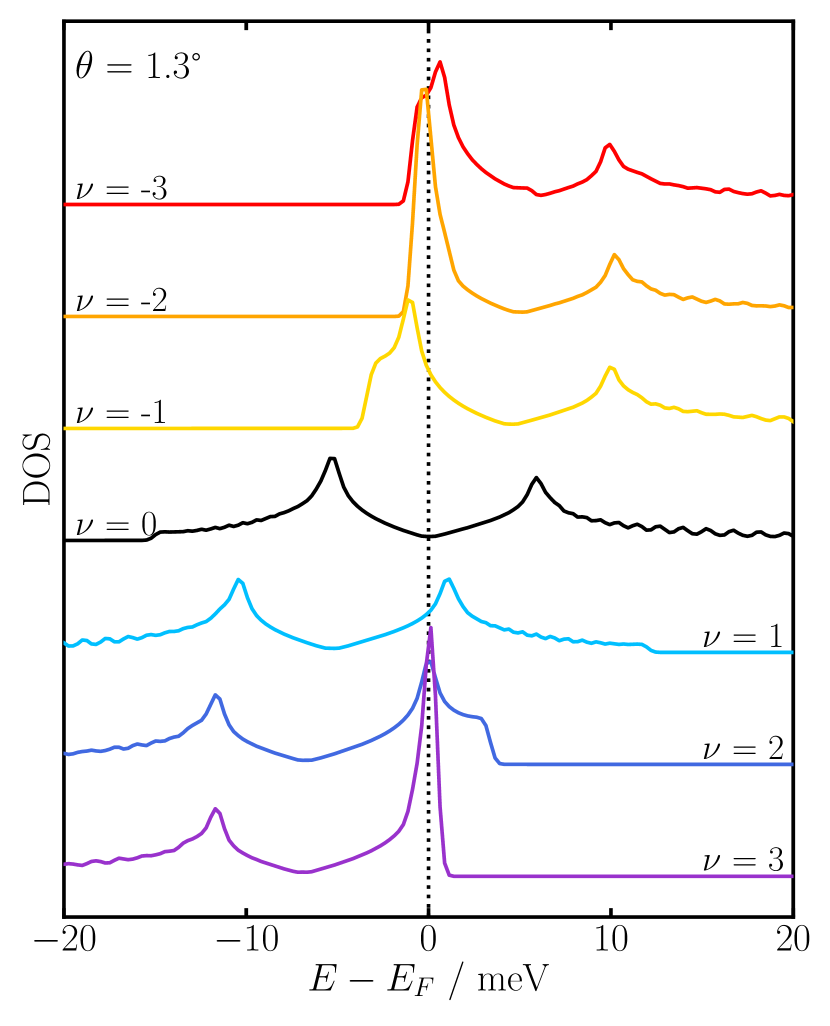
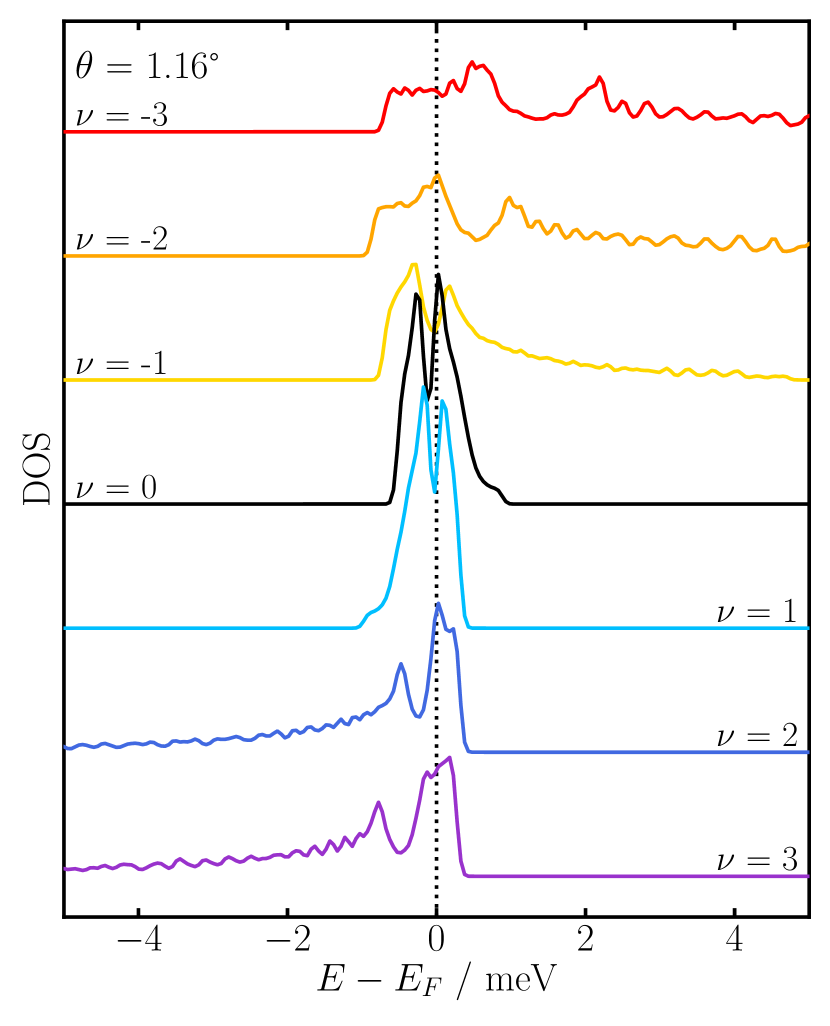
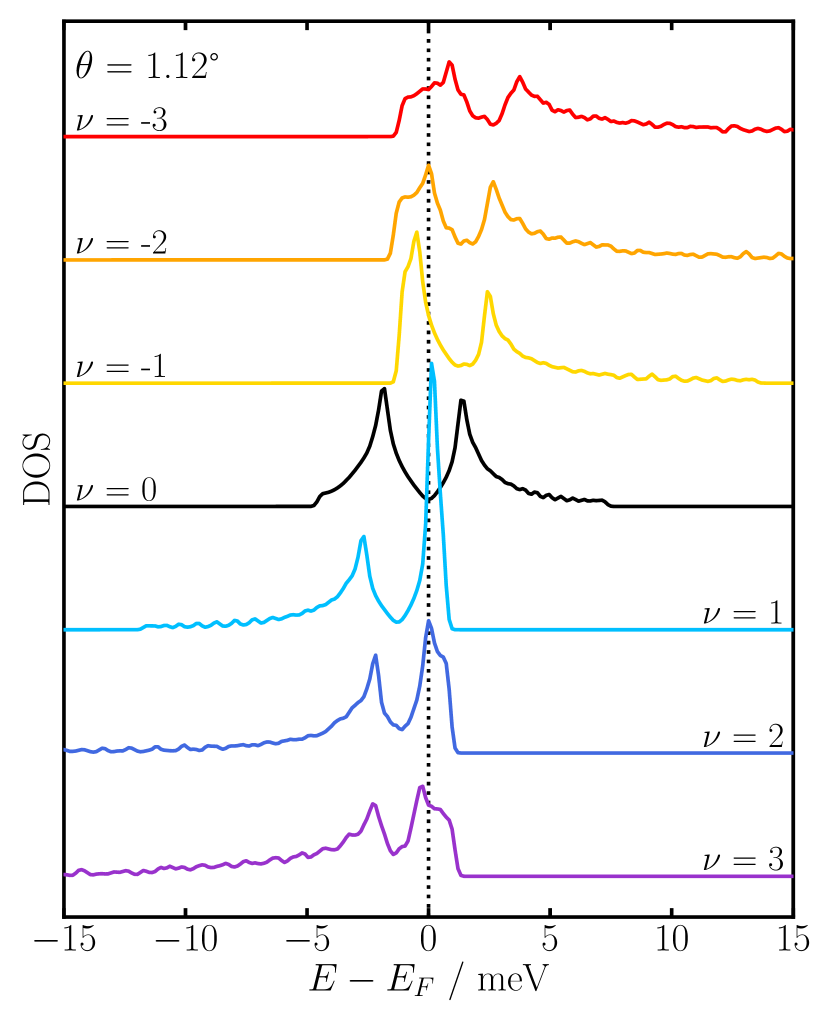
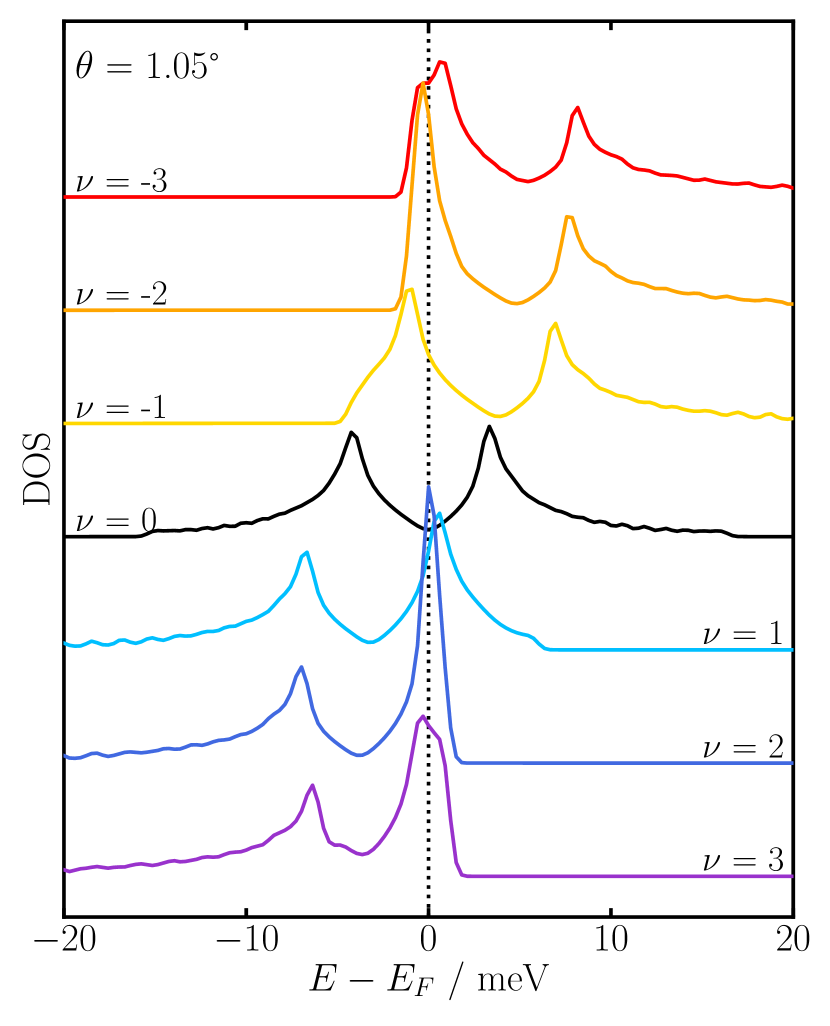
Figures 4 and 4 show the DOS and LDOS from Hartree theory for three twist angles: [panel (a)], [panel (b)] and [panel (c)]. The LDOS is shown both for the AA (solid lines) and AB (dash-dotted lines) regions, averaged over a region around the centre of the respective region (as discussed in the Methods section). When the tunnelling matrix elements are constant (which is likely a good approximation for the flat bands of tBLG), the LDOS is proportional to the measured tunnelling spectrum and thus directly accessible in experiments. Several STS studies of tBLG have been reported recently Xie et al. (2019); Kerelsky et al. (2019); Jiang et al. (2019) and we will discuss the similarities and differences of our calculations with these experimental measurements. Below, we analyse each of the three twist angles in turn; the results for the other twist angles can be found in the Supplementary Materials.
For , the DOS exhibits two pronounced peaks at all doping levels. At zero doping, these van Hove singularities (VHS) are located at meV on both sides of the Fermi energy (so their energy separation is approximately meV). Comparing the DOS to the LDOS, we find that the dominant contribution to the DOS derives from the AA regions de Laissardière et al. (2010). The LDOS in the AB regions also exhibits small peaks in the vicinity of the VHS. The valence band VHS is somewhat larger than the conduction band one because the valence bands are flatter than the conduction bands, see Fig. 1. These findings are in agreement with several recent experimental STS measurements Xie et al. (2019); Kerelsky et al. (2019); Jiang et al. (2019). Note, however, that our values for the energy difference between valence and conduction VHS are smaller (for the same twist angle) than the experimental results. In Ref. 9, this was attributed to the use of DFT-derived tight-binding parameters for the interlayer hopping which are about 20 percent smaller than more accurate GW values.
Upon electron doping, the conduction VHS becomes larger while the valence VHS becomes smaller. This is a consequence of the doping-induced band flattening of the conduction bands, while the valence bands become more dispersive, see Fig. 1. In contrast, hole doping increases the valence VHS while the conduction VHS becomes smaller. Again, these findings are in agreement with several recent experimental measurements and cannot be explained by tight-binding theory. Note that at this twist angle the Fermi level of the doped system is not pinned at the VHS.
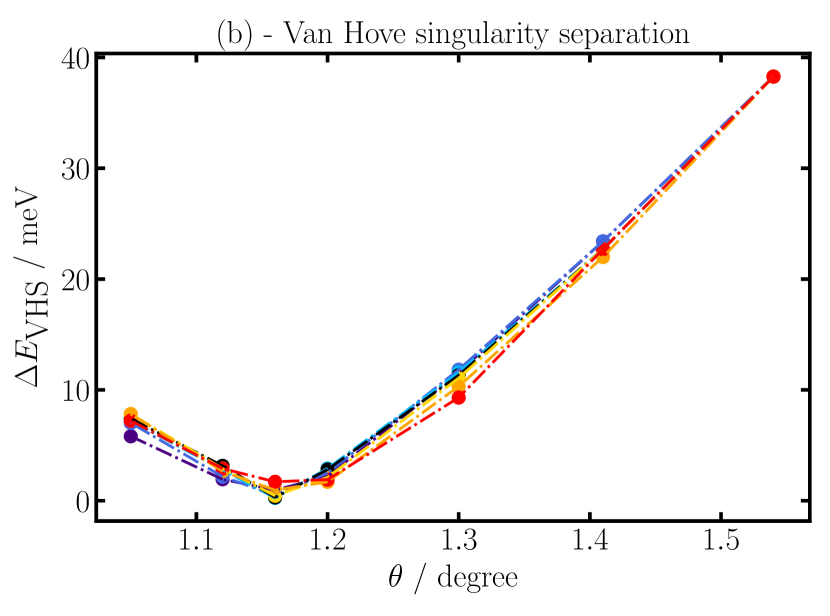
At , the separation between the VHS is reduced to meV. Upon hole doping, the difference between valence and conduction band VHS is much clearer than at . This is caused by the strong distortion of the doped valence bands resulting in extremely flat valence bands throughout large regions of the Brillouin zone, see Fig. 1 (recall that the distortion of the valence bands is always more pronounced that that of the conduction bands). For and , we observe that the Fermi level is pinned at the valence VHS. This Fermi level pinning has also been reported in several experimental STS studies and is a consequence of electron-electron interaction induced changes in the band structure. The LDOS in the AA region is again very similar to the DOS. However, we find that the valence peak of the LDOS in the AB regions grows upon hole doping (see SM for further details). This is because the wave functions of the flat valence bands are partly localized in the AB regions (in particular, the valence states near ). This prediction can be tested by STM measurements and would provide direct evidence of the doping-induced band flattening in Hartree theory. Figure 2(b) shows that the separation of the VHS is reduced by hole doping for twist angles larger than the magic angle and increased by electron doping. The opposite trend is observed for twist angles smaller than the magic angle. While this is in qualitative agreement with some experimental measurements, the absolute magnitude of the change in VHS separation is typically smaller than in experiments Choi et al. (2019); Xie et al. (2019); Kerelsky et al. (2019); Jiang et al. (2019); Kim et al. (2017); Li et al. (2010); Cherkez et al. (2015); Yan et al. (2012); Li et al. (2017); Zhang et al. (2020b).
Besides Fermi level pinning, the enhancement of the DOS at the Fermi level due to the doping-induced flattening of the partially occupied bands is also relevant for understanding broken-symmetry phases, such as correlated insulator or superconducting states Balents et al. (2020). In particular, the values of the transition temperatures to these states are usually very sensitive to the DOS at the Fermi energy Balents et al. (2020), . For example, the superconducting critical transition temperature is given by with describing the coupling strength of the electrons to the superconducting glue (e.g., phonons or spin waves). The doping-induced increase of the DOS at the Fermi level should therefore result in a dramatic increase of the critical temperature. Again, this effect is not captured by tight-binding theory.
At , very close to the magic angle, the VHS separation is only meV in the undoped system and the valence VHS is much larger than the conduction VHS. Fermi level pinning is observed both for electron and hole doping. In the DOS, the shape of the VHS of the partially filled band is highly asymmetric. In particular, the leading edge of the peak (i.e., the side of the peak facing towards the other VHS) rises more sharply than the trailing edge (i.e., the side facing away from the other VHS). Interestingly, we also observe a double peak in the conduction VHS at . The second peak is caused by a peak of the LDOS in the AB regions which does not coincide with the main peak of the LDOS in the AA regions. Again, this double peak structure is caused by the electron-electron interaction induced distortion of the conduction band near . Fig. 1 shows that the conduction bands are extremely flat near , but have a slightly higher energy than the states at which give rise to the main peak of the VHS.
III.3 Environmental screening
So far, we have presented results for tBLG suspended in air (). In experiments, however, the tBLG is placed on or sandwiched by a dielectric substrate (typically, hBN) and the presence of this dielectric environment screens the interaction between electrons in the tBLG Cao et al. (2018a, b); Yankowitz et al. (2019); Lu et al. (2019); Xie et al. (2019); Kerelsky et al. (2019); Jiang et al. (2019); Goodwin et al. (2019c). In transport experiments, the dielectric substrate separates the tBLG from a metallic gate which is used to control the charge density in the tBLG and the presence of gates further modifies the effective interaction between the electrons in the tBLG [Eq. (5)].
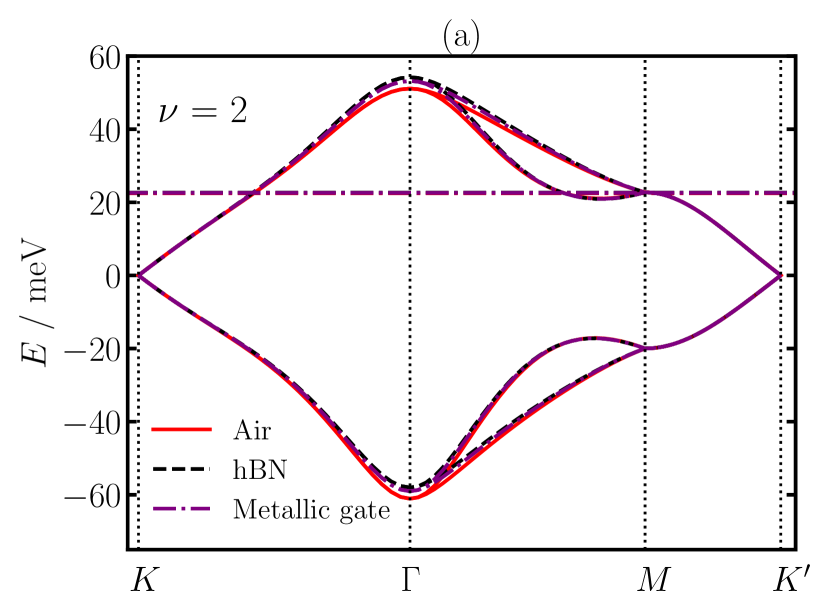
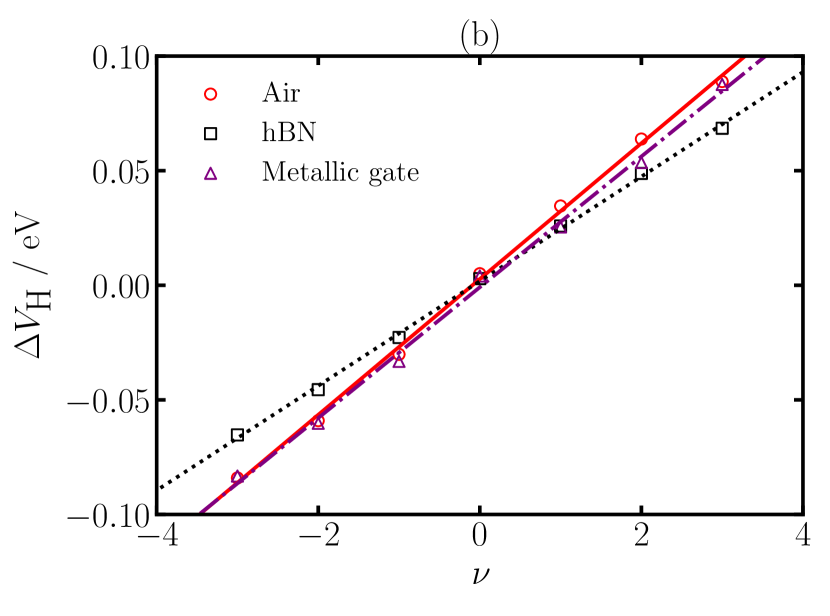
Figure 5(a) compares Hartree band structures of electron-doped tBLG () at (similar band width to that of the experiments in Ref. 9) with (tBLG suspended in air) and (tBLG sandwiched by thick layers of hBN). Surprisingly, the difference between the two band structures is small on the scale of the band width of the flat bands (similar band widths to those in experiments too). To understand this finding, we analyze the Hartree potentials of the two systems. Fig. 5(b) shows (the difference between the Hartree potential in the centers of the AA and AB regions) as a function of doping for the two cases. While one might naively expect that the slope of should be reduced by a factor of when the dielectric environment is included, we find that the reduction is much smaller ( is only reduced by 30% when the dielectric environment is included).
The inclusion of metallic gates on both sides of hBN-encapsulated tBLG at a distance of nm for a twist angle of also has little effect on the band structure [Fig. 5(a), purple dash-dotted line] because the Hartree potential does not change significantly, as shown in Fig. 5(b). It is worth noting that most experiments use larger gate distances than 10 nm which would result in an even smaller effect. Very recently, experiments employing very small gate distances reported dramatic changes of the electronic phase diagram and suggested that these were induced by changes in the environmental screening Stepanov et al. (2019). While further work is required to study the effect of metallic gates for small gate distances and twist angles very close to the magic angle, we stress that the phase diagram is determined by the relative stability of the competing phase, i.e. the total energy differences. It is possible that relatively small changes in the dielectric screening can change the relative stability of the competing phases and thereby lead to drastic changes in the phase diagram, while only mildly affecting quasiparticle properties.
This surprising robustness of the Hartree band structure of tBLG towards changes in the dielectric environment has two reasons. First, the weakening of the Coulomb repulsion by the dielectric substrate allows for a greater inhomogeneity of the charge density. This results in a larger Hartree potential energy than the one that would have been obtained if the charge density had been frozen in its unscreened configuration. Second, the change in the dielectric environment only leads to small changes in the total screening response because the internal screening of the tBLG is already quite strong Goodwin et al. (2019b); Pizarro et al. (2019).
| V() / meV | ||||
|---|---|---|---|---|
| — | — | |||
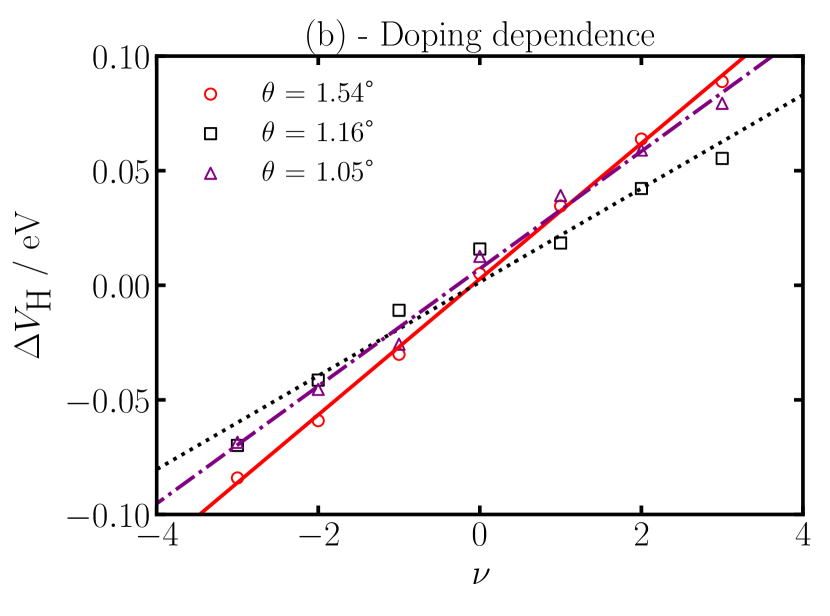
In Fig. 6 we show how changes as a function of twist angle and doping. It can be seen that there is little change as a function of twist angle (with the exception of the magic angle) and that changes approximately linearly with doping. Except at the magic angle, the doping and twist-angle dependent atomistic Hartree potential energy is accurately described by
| (9) |
where is the doping level where the Hartree potential vanishes, is a twist angle dependent energy parameter and denote the three reciprocal lattice vectors that are used to describe the out-of-plane corrugation of tBLG in Ref. 30. Also note that the form of this equation is very similar to the continuum model of Ref. 36. Table 1 shows the optimal values of these parameters for the twist angles that we have studied and Fig. 6(b) compares the fit to the calculated Hartree potential as function of doping for different twist angles. Using Eq. (9) as an on-site energy in a tight-binding calculation allows the determination of Hartree-theory band structures without the need for self-consistent calculations. We believe that this approach is a useful starting point for understanding broken symmetry phases in doped tBLG.
IV Conclusion
We have calculated quasiparticle properties, such as band structures and (local) densities of states, of interacting electrons in twisted bilayer graphene as function of doping and twist angle using atomistic Hartree theory. We find that doping results in significant changes to quasiparticle properties which are not captured by tight-binding approaches. In particular, we find that the partially occupied bands flatten between and in the Brillouin zone and even invert upon doping. The resulting local densities of states are in good agreement with several recent scanning tunneling spectroscopy experiments: in particular, we capture the Fermi level pinning and the shapes of the van Hove singularities in the AA regions of tBLG that were reported in these experiments. We predict that the band flattening gives rise to a strong enhancement of the peak in the AB regions. We also study the dependence of quasiparticle properties on the dielectric environment and find that they are surprisingly robust as a consequence of the strong internal screening of tBLG. As a consequence, the properties of broken symmetry phases of tBLG could result from a delicate interplay of long-ranged Coulomb interactions arising from the emergent moiré lattice and short-ranged atomic Hubbard interactions inherited from the untwisted bilayer. This will be the subject of future work.
V Acknowledgements
We wish to thank K. Atalar, P. Guinea, N. Walet, D. Kennes and F. Corsetti for helpful discussions. We also wish to thank A. Kerelsky and L. Xian for sharing their data and for helpful discussions. ZG was supported through a studentship in the Centre for Doctoral Training on Theory and Simulation of Materials at Imperial College London funded by the EPSRC (EP/L015579/1). We acknowledge funding from EPSRC grant EP/S025324/1 and the Thomas Young Centre under grant number TYC-101.
References
- Cao et al. (2018a) Y. Cao, V. Fatemi, A. Demir, S. Fang, S. L. Tomarken, J. Y. Luo, J. D. Sanchez-Yamagishi, K. Watanabe, T. Taniguchi, E. Kaxiras, R. C. Ashoori, and P. Jarillo-Herrero, Nature 556, 80 (2018a).
- Cao et al. (2018b) Y. Cao, V. Fatemi, S. Fang, K. Watanabe, T. Taniguchi, E. Kaxiras, and P. Jarillo-Herrero, Nature 556, 43 (2018b).
- Yankowitz et al. (2019) M. Yankowitz, S. Chen, H. Polshyn, Y. Zhang, K. Watanabe, T. Taniguchi, D. Graf, A. F. Young, and C. R. Dean, Science 363, 1059 (2019).
- Lu et al. (2019) X. Lu, P. Stepanov, W. Yang, M. Xie, M. A. Aamir, I. Das, C. Urgell, K. Watanabe, T. Taniguchi, G. Zhang, A. Bachtold, A. H. MacDonald, and D. K. Efetov, Nature 574, 653–657 (2019).
- Saito et al. (2019) Y. Saito, J. Ge, K. Watanabe, T. Taniguchi, and A. F. Young, arXiv:1911.13302v2 (2019).
- Stepanov et al. (2019) P. Stepanov, I. Das, X. Lu, A. Fahimniya, K. Watanabe, T. Taniguchi, F. H. L. Koppens, J. Lischner, L. Levitov, and D. K. Efetov, arXiv:1911.09198 (2019).
- Choi et al. (2019) Y. Choi, J. Kemmer, Y. Peng, A. Thomson, H. Arora, R. Polski, Y. Zhang, H. Ren, J. Alicea, G. Refael, F. von Oppen, K. Watanabe, T. Taniguchi, and S. Nadj-Perge, Nat. Phys. 15, 1174–1180 (2019).
- Xie et al. (2019) Y. Xie, B. Lian, B. Jäck, X. Liu1, C.-L. Chiu, K. Watanabe, T. Taniguchi, B. A. Bernevig, and A. Yazdani, Nature 572, 101 (2019).
- Kerelsky et al. (2019) A. Kerelsky, L. J. McGilly, D. M. Kennes, L. Xian, M. Yankowitz, S. Chen, K. Watanabe, T. Taniguchi, J. Hone, C. Dean, A. Rubio, and . A. N. Pasupathy, Nature 572, 95 (2019).
- Jiang et al. (2019) Y. Jiang, X. Lai, K. Watanabe, T. Taniguchi, K. Haule, J. Mao, and E. Y. Andrei, Nature 573, 91 (2019).
- Carr et al. (2017) S. Carr, D. Massatt, S. Fang, P. Cazeaux, M. Luskin, and E. Kaxiras, Phys. Rev. B 95, 075420 (2017).
- Jin et al. (2019) C. Jin, E. C. Regan, A. Yan, M. Iqbal Bakti Utama, D. Wang, S. Zhao, Y. Qin, S. Yang, Z. Zheng, S. Shi, K. Watanabe, T. Taniguchi, S. Tongay, A. Zettl, and F. Wang, Nature 567, 76 (2019).
- Wang et al. (2019) L. Wang, E.-M. Shih, A. Ghiotto, L. Xian, D. A. Rhodes, C. Tan, M. Claassen, D. M. Kennes, Y. Bai, B. Kim, K. Watanabe, T. Taniguchi, X. Zhu, J. Hone, A. Rubio, A. Pasupathy, and C. R. Dean, “Magic continuum in twisted bilayer wse2,” (2019), arXiv:1910.12147 .
- Cao et al. (2019) Y. Cao, D. Rodan-Legrain, O. Rubies-Bigorda, J. M. Park, K. Watanabe, T. Taniguchi, and P. Jarillo-Herrero, (2019), arXiv:1903.08596 [cond-mat.str-el] .
- Kennes et al. (2020) D. Kennes, L. Xian, M. Claassen, and A. Rubio, Nat. Commun. 11, 1124 (2020).
- Liu et al. (2016) Y. Liu, N. O. Weiss, X. Duan, H.-C. Cheng, Y. Huang, and X. Duan, Nat. Rev. Mater. 1, 1 (2016).
- Balents et al. (2020) L. Balents, C. R. Dean, D. K. Efetov, and A. F. Young, Nat. Phys. (2020).
- dos Santos et al. (2007) J. M. B. L. dos Santos, N. M. R. Peres, and A. H. C. Neto, Phys. Rev. Lett. 99, 256802 (2007).
- Bistritzer and MacDonald (2010) R. Bistritzer and A. H. MacDonald, PNAS 108, 12233 (2010).
- Morell et al. (2010) E. S. Morell, J. D. Correa, M. P. P. Vargas, and Z. Barticevic, Phys. Rev. B 82, 121407(R) (2010).
- de Laissardière et al. (2010) G. T. de Laissardière, D. Mayou, and L. Magaud, Nano Lett. 10, 804 (2010).
- de Laissardière et al. (2012) G. T. de Laissardière, D. Mayou, and L. Magaud, Phys. Rev. B 86, 125413 (2012).
- Carr et al. (2018) S. Carr, S. Fang, P. Jarillo-Herrero, and E. Kaxiras, Phys. Rev. B 98, 085144 (2018).
- Carr et al. (2019a) S. Carr, S. Fang, Z. Zhu, and E. Kaxiras, Phys. Rev. Research 1, 013001 (2019a).
- Guinea and Walet (2018) F. Guinea and N. R. Walet, PNAS 115, 13174–13179 (2018).
- Georges et al. (1996) A. Georges, G. Kotliar, W. Krauth, and M. J. Rozenberg, Rev. Mod. Phys. 13, 68 (1996).
- Yan et al. (2018) X. Yan, X. K. T. Law, and P. A. Lee, Phys. Rev. B 98, 121406(R) (2018).
- Liao et al. (2019) Y. D. Liao, Z. Y. Meng, and X. Y. Xu, Phys. Rev. Lett. 129, 157601 (2019).
- Ochi et al. (2018) M. Ochi, M. Koshino, and K. Kuroki, Phys. Rev. B 98, 081102(R) (2018).
- Koshino et al. (2018) M. Koshino, N. F. Q. Yuan, T. Koretsune, M. Ochi, K. Kuroki, and L. Fu, Phys. Rev. X 8, 031087 (2018).
- Kang and Vafek (2018) J. Kang and O. Vafek, Phys. Rev. X 8, 031088 (2018).
- Goodwin et al. (2019a) Z. A. H. Goodwin, F. Corsetti, A. A. Mostofi, and J. Lischner, Phys. Rev. B 100, 121106(R) (2019a).
- Goodwin et al. (2019b) Z. A. H. Goodwin, F. Corsetti, A. A. Mostofi, and J. Lischner, Phys. Rev. B 100, 235424 (2019b).
- Po et al. (2019) H. C. Po, L. Zou, T. Senthil, and A. Vishwanath, Phys. Rev. B 99, 195455 (2019).
- Carr et al. (2019b) S. Carr, S. Fang, H. C. Po, A. Vishwanath, and E. Kaxiras, Phys. Rev. Research 1, 033072 (2019b).
- Cea et al. (2019) T. Cea, N. R. Walet, and F. Guinea, Phys. Rev. B 100, 205113 (2019).
- Xie and MacDonald (2020) M. Xie and A. H. MacDonald, Phys. Rev. Lett. 124, 097601 (2020).
- Cea and Guinea (2020) T. Cea and F. Guinea, arXiv:2004.01577v1 (2020).
- Zhang et al. (2020a) Y. Zhang, K. Jiang, Z. Wang, and F. Zhang, arXiv:2001.02476v2 (2020a).
- Bultinck et al. (2019) N. Bultinck, E. Khalaf, S. Liu, S. Chatterjee, A. Vishwanath, and M. P. Zaletel, arXiv:1911.02045v1 (2019).
- Liu et al. (2019) S. Liu, E. Khalaf, J. Y. Lee, and A. Vishwanath, arXiv:1905.07409v3 (2019).
- Liu and Dai (2020) J. Liu and X. Dai, arXiv:1911.03760v2 (2020).
- Klebl and Honerkamp (2019) L. Klebl and C. Honerkamp, Phys. Rev. B 100, 155145 (2019).
- Gonzalez-Arraga et al. (2017) L. A. Gonzalez-Arraga, J. L. Lado, F. Guinea, and P. San-Jose, Phys. Rev. Lett. 119, 107201 (2017).
- Ramires and Lado (2019) A. Ramires and J. L. Lado, Phys. Rev. B 99, 245188 (2019).
- Rademaker et al. (2019) L. Rademaker, D. A. Abanin, and P. Mellado, Phys. Rev. B 100, 205114 (2019).
- González and Stauber (2020) J. González and T. Stauber, arXiv:2002.12039v1 (2020).
- Uchida et al. (2014) K. Uchida, S. Furuya, J.-I. Iwata, and A. Oshiyama, Phys. Rev. B 90, 155451 (2014).
- Nam and Koshino (2017) N. N. T. Nam and M. Koshino, Phys. Rev. B 96, 075311 (2017).
- Lucignano et al. (2019) P. Lucignano, D. Alfé, V. Cataudella, D. Ninno, and G. Cantele, Phys. Rev. B 99, 195419 (2019).
- Jain et al. (2017) S. K. Jain, V. Juric̆ić, and G. T. Barkema, 2D Mater. 4, 015018 (2017).
- Gargiulo and Yazyev (2018) F. Gargiulo and O. V. Yazyev, 2D Mater. 5, 015019 (2018).
- Walet and Guinea (2019) N. R. Walet and F. Guinea, Phys. Rev. B 99, 205134 (2019).
- O’Connor et al. (2015) T. C. O’Connor, J. Andzelm, and M. O. Robbins, J. Chem. Phys. 142, 024903 (2015).
- Kolmogorov and Crespi (2005) A. N. Kolmogorov and V. H. Crespi, Phys. Rev. B 71, 235415 (2005).
- Plimpton (1995) S. Plimpton, J. Comp. Phys. 117, 1 (1995).
- Slater and Koster (1954) J. C. Slater and G. F. Koster, Phys. Rev. 94, 1498 (1954).
- Corsetti et al. (2017) F. Corsetti, A. A. Mostofi, and J. Lischner, 2D Mater. 4, 025070 (2017).
- Neto et al. (2009) A. H. C. Neto, F. Guinea, N. M. R. Peres, K. S. Novoselov, and A. K. Geim, Rev. Mod. Phys. 81, 109 (2009).
- Angeli et al. (2018) M. Angeli, D. Mandelli, A. Valli, A. Amaricci, M. Capone, E. Tosatti, and M. Fabrizio, Phys. Rev. B 98, 235137 (2018).
- Throckmorton and Vafek (2012) R. E. Throckmorton and O. Vafek, Phys. Rev. B 86, 115447 (2012).
- Goodwin et al. (2019c) Z. A. H. Goodwin, V. Vitale, F. Corsetti, D. K. Efetov, A. A. Mostofi, and J. Lischner, Phys. Rev.B 101, 165110 (2019c).
- Wehling et al. (2011) T. O. Wehling, E. Şaşıoğlu, C. Friedrich, A. I. Lichtenstein, M. I. Katsnelson, and S. Blügel, Phys. Rev. Lett. 106, 236805 (2011).
- Choi and Choi (2018) Y. W. Choi and H. J. Choi, Phys. Rev. B 98, 241412(R) (2018).
- Kim et al. (2017) K. Kim, A. DaSilva, S. Huang, S. L. Babak Fallahazad and, T. Taniguchi, K. Watanabe, B. J. LeRoy, A. H. MacDonald, , and E. Tutuc, PNAS 114, 3364–3369 (2017).
- Li et al. (2010) G. Li, A. Luican, J. M. B. L. dos Santos, A. H. C. Neto, J. K. A. Reina4, and E. Y. Andrei, Nat. Phys. 6, 109 (2010).
- Cherkez et al. (2015) V. Cherkez, G. T. de Laissardiére, P. Mallet, and J.-Y. Veuillen, Phys. Rev. B 91, 155428 (2015).
- Yan et al. (2012) W. Yan, M. Liu, R.-F. Dou, L. Meng, L. Feng, Z.-D. Chu, Y. Zhang, Z. Liu, J.-C. Nie, and L. He, Phys. Rev. Lett. 109, 126801 (2012).
- Li et al. (2017) S.-Y. Li, K.-Q. Liu, L.-J. Yin, W.-X. Wang, W. Yan, X.-Q. Yang, J.-K. Yang, H. Liu, H. Jiang, , and L. He, Phys. Rev. B 96, 155416 (2017).
- Zhang et al. (2020b) Z. Zhang, R. Myers, K. Watanabe, T. Taniguchi, and B. J. LeRoy, arXiv:2003.09482 (2020b).
- Pizarro et al. (2019) J. M. Pizarro, M. Rosner, R. Thomale, R. Valent, and T. O. Wehling, Phys. Rev. B 100, 161102(R) (2019).
VI Supplementary Material
VI.1 Hartree comparison to tight-binding band structures
VI.2 Additional band structures
VI.3 Additional DOS calculations
VI.4 Additional LDOS calculations