Abstract
A review is given of a priori predictions made for the dynamics of rotating galaxies. One theory—MOND—has had many predictions corroborated by subsequent observations. While it is sometimes possible to offer post hoc explanations for these observations in terms of dark matter, it is seldom possible to use dark matter to predict the same phenomena.
keywords:
gravitation; dark matter; galaxies; galactic rotation; alternative modelsxx \issuenum1 \articlenumber5 \historyReceived: 15 March 2020; Accepted: 20 April 2020; Published: date \updatesyes \TitlePredictions and Outcomes for the Dynamics of Rotating Galaxies \AuthorStacy McGaugh\orcidA \AuthorNamesStacy McGaugh
1 Introduction
The dark matter problem remains unsolved after decades of intensive research. The observational evidence for mass discrepancies in extragalactic systems is overwhelming, but a laboratory detection of dark matter particles is still lacking. While the need for “dark matter” is clear, its existence remains hypothetical.
I place “dark matter” in quotes because the widespread use of this term presupposes the answer. All that is really known is that the application of conventional dynamics to the visible mass distributions of extragalactic systems fails to explain the observed motions. Though this discrepancy is clear and the evidence is abundant Faber and Gallagher (1979); Trimble (1987); Ostriker (1993), much of this evidence is ambiguous as to whether the cause is unseen mass—literal dark matter—or a failure of the equations that lead to its inference McGaugh and de Blok (1998a, b); Sanders and McGaugh (2002).
At present, the mainstream paradigm (the "normal component," as Feyerabend called it Feyerabend (1985)) is lambda cold dark matter (CDM). This paradigm works if and only if the cold dark matter (CDM) it presupposes is a real, physical substance, and not merely an abstraction that is convenient to cosmic calculations. This has motivated extensive laboratory searches for plausible dark matter candidates Peebles (1984); Steigman and Turner (1985); Feng (2010). These remarkable experiments Porter et al. (2011); Aprile et al. (2018) have excluded essentially all of the parameter space in which the hypothesized dark matter particles were expected Trotta et al. (2008) to reside. This provides one motivation for considering ideas outside the normal component, including new dark matter candidates and modified dynamics.
Another motivation arises if a theory makes successful predictions. Novel predictions that provide unique tests of hypotheses are the keystone of the scientific method. The gold standard for scientific predictions are those made in advance of the observation Merritt (2017). Here I highlight important a priori predictions made by the modified Newtonian dynamics (MOND) Milgrom (1983a, b, c) that meet this gold standard. I also discuss the contemporaneous expectation for dark matter.
I make no attempt to cover all aspects of MOND and the mass discrepancy problem here, as the subject is now vast. More extensive reviews of MOND are provided elsewhere Milgrom (1999, 2001); Bekenstein (2006); Milgrom (2008); Famaey and McGaugh (2012); Milgrom (2014); McGaugh (2015), as are reviews of the relevant data Sanders (1990, 1996); McGaugh and de Blok (1998b); Sanders and McGaugh (2002); McGaugh (2006); McGaugh et al. (2019). Here I focus on tests of a priori predictions utilizing the most accurate data that relate to the subject McGaugh et al. (2019); Lelli et al. (2016).
2 Predictions and Tests
General relativity has been tested with extraordinary precision in the solar system Will (2014), and high acceleration systems, such as binary neutron stars Hulse and Taylor (1975) and merging black holes Abbott et al. (2016). In contrast, it manifestly fails in systems that exhibit mass discrepancies; hence the need for dark matter. Attempts to modify dynamics often start by noting that problem systems—galaxies, clusters of galaxies, and the universe as a whole—are much bigger than the systems where established theory works so well. Consequently, it is tempting to imagine that the force law changes on some length scale so that its effects are imperceptible in the solar system but pronounced in galaxies. This approach immediately runs afoul of the observation that some large galaxies appear to require little dark matter, while some small galaxies evince large discrepancies. Modifications based on a length scale can be generically excluded McGaugh and de Blok (1998a).
Size is not the only scale that sets problematic systems apart from solar system tests of gravity. The typical accelerations of stars in galaxies are of order 1 Å s-2 or less; this is eleven orders of magnitude less than we experience on the surface of the Earth, and many orders of magnitude removed from sensitive solar system probes. MOND Milgrom (1983a) hypothesizes a change to the effective force law at low accelerations, . The acceleration scale is empirically determined to be Begeman et al. (1991). The value of has been remarkably stable, having not changed meaningfully in decades McGaugh et al. (2016).
As noted in the original publication Milgrom (1983a), MOND is not a complete theory that replaces general relativity. Indeed, MOND may be either a modification of gravity (Newton’s universal gravitation) or a modification of the law of inertia (: the inertial mass may differ from the gravitational charge at low accelerations) Milgrom (1983a, 2014). Perhaps it is only an effective theory that arises for reasons we have yet to imagine. Irrespective of why it happens, strong predictions follow once a force is hypothesized.
MOND contains Newton in the limit of high acceleration: for , the effective acceleration , where is the usual Newtonian gravitational force per unit mass. Everything is "normal" until we reach the regime of low acceleration (); an immediate corollary is that the need for dark matter should never appear at high accelerations. Unique predictions of MOND emerge in the deep MOND regime: for , the effective acceleration becomes . Intriguingly, dynamics become scale invariant in this deep MOND regime Milgrom (2009). The Newtonian and deep MOND regimes are connected by a theoretically arbitrary but empirically well-constrained interpolation function whose details are only relevant within a factor of a few of . The essence of the idea is captured by the asymptotic limits at high and low accelerations, which is where the important predictions arise.
In the following, I review observational tests of the specific predictions elaborated in section VIII of Milgrom (1983b) that have been subsequently tested.
2.1 Tully–Fisher and the Mass–Asymptotic Speed Relation
"The relation should hold exactly."
—M. Milgrom Milgrom (1983b)
One consequence of MOND is a relation between the mass of a galaxy and its rotation speed. One immediately recognizes this mass–asymptotic speed relation (MASR) Milgrom (2014) as the basis of the empirical Tully–Fisher relation Tully and Fisher (1977),
| (1) |
provided that luminosity is a proxy for mass () and line-width is a proxy for rotation speed (). The Tully–Fisher relation provides several tests of MOND.
Testing the MASR requires careful measurement of both the mass and the asymptotic speed.
Many rotation curves are observed to be flat, but it sometimes happens that the observational sensitivity tapers off before the asymptotic rotation speed is obtained. One must therefore take care to test the theory and not just the limits of data quality McGaugh et al. (2019): the result will differ from the prediction if either of the proxies for mass or are imperfect Lelli et al. (2019).
The flat rotation velocity measured from resolved rotation curves provides a better proxy for than line-widths. It is still only a proxy, as rotation curves in MOND may approach a constant rotation speed quickly, but may also decline slowly or rise gradually depending on the details of the mass distribution Milgrom (1983b). This morphology is clearly seen in the data Lelli et al. (2017); McGaugh et al. (2019). Nevertheless, it is often possible111It is also possible to mistakenly conclude that MOND is incorrect Ogle et al. (2019) by utilizing an inadequate proxy for Noordermeer et al. (2007); Noordermeer and Verheijen (2007). to measure to within 5% Lelli et al. (2016, 2019).
Another important effect is geometric: flattened mass distributions like spiral galaxies rotate faster than the spherically equivalent distribution Binney and Tremaine (1987). The MASR predicts a Tully–Fisher-like relation of the form
| (2) |
where is a factor of order unity that accounts for the flattened geometries of disk galaxies. This can be computed analytically for a razor thin exponential disk (see Equation (16) of McGaugh and de Blok (1998b)), with the result that at four disk scale lengths. For disks of realistic finite thickness, McGaugh (2005). As a practical matter, this quantity likely has some intrinsic scatter Lelli et al. (2016), and may vary systematically with mass or morphological type. Systematic variation would affect the slope of the BTFR.
Empirically, the data evince a baryonic Tully–Fisher relation (BTFR) McGaugh et al. (2000)
| (3) |
Here includes all relevant forms of baryonic mass: stars, their remnants, all phases of interstellar gas, and dust. In practice, the dominant forms of baryonic mass in late type galaxies are stars (including the corresponding remnants) and atomic gas. We estimate the baryonic mass using stellar population models Schombert and McGaugh (2014); McGaugh and Schombert (2014) to estimate mass-to-light ratios and near-IR luminosities Schombert and McGaugh (2014); Lelli et al. (2016) in the band of the Spitzer Space Telescope so that . The gas mass is estimated from the atomic gas mass corrected for the hydrogen fraction (see McGaugh et al. (2020)) so that the total baryonic mass is .
The BTFR is equivalent to the MASR if is an adequate proxy for , the slope , and the normalization is consistent with for realistic galaxy masses. Another important implication of the MASR that follows from MOND is that it is only the baryonic mass of a galaxy that sets its asymptotic rotation speed, not as in Newtonian dynamics. We discuss these distinct aspects of the MOND prediction for the BTFR in turn.
MASR Normalization
The normalization of the MASR predicted by MOND is determined by fundamental constants: .
Do the data corroborate the prediction of MOND?
Yes. For finite thickness disk galaxies with , the prediction of the MASR corresponds to a BTFR with . This is consistent with the available data for rotationally supported galaxies Verheijen (2001); McGaugh (2005); Noordermeer and Verheijen (2007); Stark et al. (2009); Trachternach et al. (2009); McGaugh (2011, 2012); Lelli et al. (2016, 2019).
Was the prediction made a priori?
No. This is a good test of MOND, but one has to appeal to data to set the value of in the first place. Consequently, this test of MOND is successful, but does not meet the gold standard of an a priori prediction.
What does dark matter predict?
The expectation for the normalization of the Tully–Fisher relation in CDM was discussed at length in McGaugh (2012). Nominally, one expects a higher normalization than observed Steinmetz and Navarro (1999); Navarro and Steinmetz (2000); Mayer and Moore (2004), in the sense that the are more baryons available in dark matter halos to form stars than apparently do so McGaugh et al. (2010). One of the primary reasons for invoking highly efficient feedback in more recent numerical simulations is to prevent the otherwise inevitable cooling and subsequent formation into stars of these excess baryons.
MASR Slope
Do the data corroborate the prediction of MOND?
Yes. The data are consistent with the predicted slope . Figure 1 shows the data reviewed by McGaugh et al. (2019) along with the MOND prediction. The line representing MOND has not been fit. It has a slope and a normalization , as discussed above McGaugh (2005). Clearly, these data are consistent with the prediction of MOND.
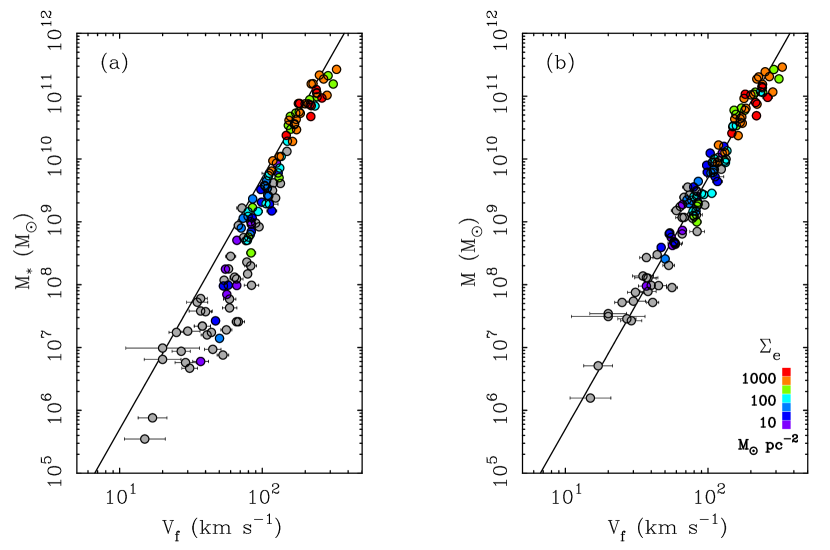
An important consideration in constraining the slope of the BTFR is the dynamic range in the data. Observational selection effects severely bias galaxy samples in favor of high luminosity, high surface brightness (HSB) galaxies and against low luminosity and low surface brightness (LSB) galaxies McGaugh et al. (1995, 2019). Consequently, most realizations of the Tully–Fisher relation are dominated by high mass galaxies, and sample only a narrow range in mass: the bulk of most data sets are confined to spiral galaxies with , typically with only a few galaxies down to . This results in a systematic underestimate of the fitted slope Akritas and Bershady (1996). As the dynamic range over which data are available has expanded () Stark et al. (2009); Trachternach et al. (2009); Begum et al. (2008); McGaugh and Schombert (2015), the slope steepens and McGaugh and Schombert (2015).
Was the prediction made a priori?
Yes and no. The Tully–Fisher relation was known prior to the development of MOND Tully and Fisher (1977); Aaronson et al. (1979), such that it was not an a priori prediction. The slope was highly uncertain when MOND was developed: Milgrom quotes the range Milgrom (1983b). A slope of 4 is within that range, but there was no guarantee that the data would settle on that value.
An important consequence of the slope 4 MASR of MOND is the location of low mass galaxies in the BTFR plane McGaugh (2011); McGaugh and Wolf (2010). Rotation speeds of the low mass galaxies represented by grey points in Figure 1 were not known at the time MOND was hypothesized. Yet it was possible to use MOND to successfully predict the rotation speeds of these objects. This prediction follows directly from the statement of the MASR. Its specific application in this context was discussed by McGaugh (2005) and subsequently applied by McGaugh (2011). This does constitute a successful a priori prediction.
What does dark matter predict?
CDM does not make a specific prediction for the BTFR. It does predict a mass–rotation speed relation for dark matter halos: Mo et al. (1998); Steinmetz and Navarro (1999). To connect this to the BTFR, we must introduce proportionality factors and that relate the observed baryonic mass to the total mass and the observed rotation speed to that predicted at the virial radius McGaugh (2012). These necessary proportionality factors are not cleanly predicted by galaxy formation models. The obvious assumption is that they be constants Mo et al. (1998); this predicts a slope that is inconsistent with the observations. Various effects during galaxy formation may steepen the slope Bullock et al. (2001); Gnedin et al. (2007), but typically only to . It often happens that CDM models Trujillo-Gomez et al. (2011) induce curvature (variable ) in the BTFR that is not observed (Figure 1). Indeed, it has become difficult to avoid such curvature given the shape of the abundance matching relation Bullock and Boylan-Kolchin (2017). One can tune models to impose a slope of 4 van den Bosch (2000), but then one has a fine-tuned model which is not satisfactory. This approach has a propensity to violate other constraints. For example, one can vary in the models of Mo et al. (1998) to obtain the desired BTFR slope. The required variation () then ruins the otherwise good agreement with the disk size–mass relation that is obtained with constant Mo et al. (1998). One cannot have it both ways; one property can be fit, but not both. More elaborate models can be constructed with more parameters, but these violate Occam’s rule of parsimony, and inevitably lack predictive power: they chase the data rather than predict it Sanders (2019).
Baryonic Mass and Flat Velocity
A fundamental prediction of MOND is that the physical basis of the Tully–Fisher relation is a relation between flat rotation speed and baryonic mass. All the normal mass matters. It does not matter whether the mass is in the form of a star or gas.
Do the data corroborate the prediction of MOND?
Yes. The BTFR (Figure 1) is a direct consequence of the MASR in MOND.
Was the prediction made a priori?
Yes. The absolute nature of the MASR was emphasized in the original papers Milgrom (1983b). The importance of gas and stars in this context was not widely appreciated until much later.
What does dark matter predict?
I am not aware of any dark matter models that addressed this aspect of the Tully–Fisher relation prior to the empirical identification of the BTFR McGaugh et al. (2000). This is unsurprising, since the BTFR is something of a non-sequitur in CDM: dark matter plays no direct role in its construction. It is often assumed that is set by the dark matter halo, but this presupposition is inadequate, as the baryons make a non-negligible contribution to in HSB galaxies (see below).
Surface Brightness Independence
"Disk galaxies with low surface brightness provide particularly strong tests."
—M. Milgrom Milgrom (1983b)
An important consequence of the absolute nature of the MASR is that there should be no residuals from the BTFR. The only variables that appear are the total baryonic mass and the flat rotation speed. Neither size nor surface brightness appear in the equation, so there should be no dependence on these quantities.
Do the data corroborate the prediction of MOND?
Was the prediction made a priori?
Yes. This was explicitly predicted Milgrom (1983b): "We predict, for example, that the proportionality factor in the relation for (LSB) galaxies is the same as for the high surface density galaxies."
What does dark matter predict?
Conventionally, it had been expected that LSB galaxies should shift off of the Tully–Fisher relation defined by HSB galaxies Aaronson et al. (1979); Milgrom (1983b), since the rotation speed depends on size as well as mass: . By squaring this, we obtain . It was argued Aaronson et al. (1979) that a Tully–Fisher relation of the form follows if the surface brightness is the same for all galaxies, as was then believed Freeman (1970). This fails when confronted with data for LSB galaxies Zwaan et al. (1995), which have different by definition.
The absence of the anticipated residuals poses a fine-tuning problem for conventional dynamics McGaugh and de Blok (1998a); Courteau and Rix (1999). The observed flat rotation speed is the sum of a declining luminous contribution and increasing dark contribution: . Galaxies span a wide range of surface brightness at a given mass, but are indistinguishable to Tully–Fisher de Blok and McGaugh (1996); Tully and Verheijen (1997); McGaugh and de Blok (1998a, b); McGaugh et al. (2019). As surface brightness declines at fixed mass, declines with it, so must increase to precisely compensate and keep unchanged. The only way to avoid this fine-tuning is if all galaxies are dark matter dominated Courteau and Rix (1999) so that at all relevant radii Courteau and Rix (1999); McGaugh (2005). This limit requires implausibly low stellar masses Starkman et al. (2018), and is directly contradicted by the observed dependence of rotation curve shape on surface brightness McGaugh et al. (2019); de Blok and McGaugh (1996); Tully and Verheijen (1997); Swaters et al. (2009, 2012); Lelli et al. (2013, 2016); Oman et al. (2015).
2.2 Predictions for Rotation Curves
"Rotation curves calculated on the basis of the observed mass distribution and the modified dynamics should agree with the observed velocity curves."
—M. Milgrom Milgrom (1983b)
This simple statement has a variety of testable consequences.
Flat Rotation Curves
The striking flatness of the rotation curves of spiral galaxies Rubin et al. (1978); Bosma (1981) was an animating motivation for both dark matter and MOND. That they are observed to be so is thus not an a priori prediction. It is nevertheless a test: one should not observe galaxies that show a Keplerian decline. So far, rotation curves remain flat indefinitely far out de Blok et al. (2008); Brouwer et al. (2017).
Do the data corroborate the prediction of MOND?
Yes.
Was the prediction made a priori?
No: flat rotation curves were the motivation for MOND, not a prediction thereof. The theory takes flat rotation curves to be axiomatic, an expectation that could be falsified but has not been de Blok et al. (2008).
What does dark matter predict?
Flat rotation curves were a primary motivation for dark matter, not a prediction thereof. It is generally possible to fit a variety of dark matter halos to the data, once given Kent (1987); Li et al. (2020). It is another matter to predict rotation curves a priori. It is easy to build plausible-seeming models with rotation curves that are not as flat as those observed—indeed, it is hard to avoid McGaugh and de Blok (1998a). Models with realistic rotation curve shapes are restricted to an unnaturally narrow range of the available parameter space Sellwood and McGaugh (2005); Disney et al. (2008); Dubinski et al. (1999).
The Acceleration Discrepancy
A straightforward property to compute for a galaxy is the enclosed dynamical mass-to-light ratio. Assuming a spherical mass distribution, the dynamical mass enclosed within radius is simply . This may be compared to the luminosity or baryonic mass enclosed by the same radius, giving some idea of the amount of dark matter required. This can be quantified by the mass discrepancy Sanders (1990); McGaugh (1999, 2004), which is the ratio of the observed centripetal acceleration to that predicted by the observed baryons: . The equation with the ratio of dynamical to baryonic mass is not exact because spiral galaxies are not spherical. Consequently, a more accurate name would be the acceleration discrepancy Bekenstein (1990).
In MOND, the amplitude of the discrepancy depends on the distribution of luminous mass. If we interpret this in terms of conventional dynamics, we should find that the enclosed dynamical mass-to-light ratio varies predictably Milgrom (1983b). Specifically, there should be no discrepancy when accelerations are above the critical value . That is, the dynamical mass-to-light ratio should be comparable to that expected for the stellar population mass-to-light ratio (typically of order unity in solar units, depending on pass-band McGaugh and Schombert (2014)). A transition should occur at , after which the discrepancy should increase with increasing radius as the acceleration declines (for a flat rotation curve, ). The transition radius should vary systematically from galaxy to galaxy: it is that is constant. Consequently, the discrepancy should be larger and set in at smaller radii in galaxies of lower surface brightness, which are predicted to have lower accelerations.
Indeed, the point of MOND is that the mass discrepancy is an acceleration-dependent phenomenon. Hence the amplitude of the discrepancy should correlate with acceleration. This is apparent in Figure 2b, a purely empirical correlation that has been known for a long time Sanders (1990); McGaugh (1999, 2004) and which has become especially clear with the availability of near-IR data from Spitzer McGaugh et al. (2016).

Do the data corroborate the prediction of MOND?
Yes. All aspects of the prediction are apparent in Figure 2 (see also Figure 3 of McGaugh and de Blok (1998b)). In the highest surface brightness spiral galaxies, the accelerations are close to at small radii, and there is little indication of a dynamical discrepancy. The discrepancy appears gradually as one goes out in radius, as seen in a steadily increasing dynamical mass-to-baryonic mass ratio. As we consider galaxies of progressively lower surface brightness, the discrepancy appears sooner, at smaller radii, and is also larger in amplitude. An important empirical point is that it is surface brightness, not luminosity McGaugh and de Blok (1998a); McGaugh (2014), that determins and drives the correlation with Sanders (1990); McGaugh (1999, 2004); McGaugh et al. (2016).
Was the prediction made a priori?
What does dark matter predict?
I am not aware of an explicit prediction having been made for this observation in the context of dark matter. It is now widely known that LSB galaxies tend to be dark matter dominated, but that is a recognition driven entirely by the data de Blok and McGaugh (1996, 1997). There was no reason to expect this to be the case a priori. MOND was the only theory to correctly predict this behavior in advance of its observation.
Rotation Curves Shapes
"The rotation curve of a galaxy can remain flat down to very small radii, as observed, only if the galaxy’s average surface density falls in some narrow range of values which agrees with the Fish and Freeman laws. For smaller , the velocity rises more slowly to the asymptotic value."
—M. Milgrom Milgrom (1983b)
Do the data corroborate the prediction of MOND?
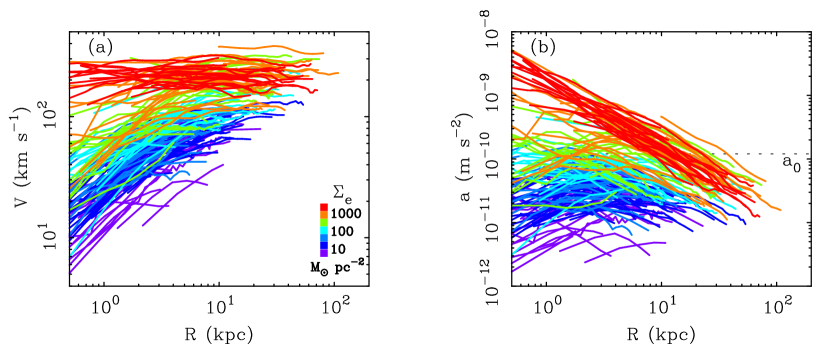
Yes. In MOND, the shapes of rotation curves follow from their baryonic mass distributions. Bright, high surface brightness spirals are predicted to have steeply rising rotation curves that flatten quickly, or even decline before flattening. Low surface brightness galaxies should have slowly rising rotation curves that only gradually approach the flat velocity. Precisely this morphology is observed McGaugh and de Blok (1998b); Famaey and McGaugh (2012); Lelli et al. (2017); McGaugh et al. (2019).
Was the prediction made a priori?
Yes. Flat rotation curves were known at the time that MOND was developed. However, the overall shapes of rotation curves were only beginning to be explored. Milgrom’s quote above nicely summarizes the state of knowledge at that time. Rotation curves that remain flat to small radii can only occur in MOND for HSB galaxies—hence his explicit comment about a galaxy’s average surface density. The rotation curves of LSB galaxies were essentially unknown. Indeed, at the time, it was widely believed that rotationally supported galaxies all had essentially the same surface brightness (Freeman’s Law Freeman (1970)), and LSB galaxies did not exist. Hence it is remarkable that an explicit prediction was made for LSB galaxies, let alone that this prediction was realized by subsequent observations McGaugh and de Blok (1998b); de Blok and McGaugh (1998).
What does dark matter predict?
There are many schools of thought as to what should happen with LSB galaxies, once they were recognized to exist. These fall into two broad categories McGaugh and de Blok (1998a). In one, it was imagined that LSB galaxies were stretched out versions of HSB galaxies, residing in late-forming dark matter halos that were themselves of lower average density. This hypothesis is rejected by the absence of surface brightness residuals in the BTFR (Figure 1), as LSB galaxies should have lower overall rotation speeds simply because , and by construction, they have larger radii at a given mass.
A more persistent school of thought is that galaxies of the same stellar mass reside in halos of the same total mass. Size follows from the initial angular momentum of the parent dark matter halo Fall and Efstathiou (1980), and the lack of BTFR residuals with surface brightness can be explained if and only if the stellar disk is sufficiently sub-maximal that it does not impact . However, if this is the case, then the rotation curve is dominated by dark matter halos, which are expected to be very self-similar at a given mass Navarro et al. (1997). This predicts that galaxies of the same mass have not only the same , but that the entire shape of the rotation curve should be very nearly the same. This expectation is not realized; there is a greater diversity of observed rotation curve shapes McGaugh et al. (2019); de Blok and McGaugh (1996); Tully and Verheijen (1997); Swaters et al. (2009, 2012); Lelli et al. (2013, 2016) than is predicted by such models Oman et al. (2015). This diversity is obvious in Figure 3: LSB galaxies have slowly rising rotation curves, and HSB galaxies have rapidly rising rotation curves, just as predicted by MOND: the distribution of baryons matters as does their total mass. The hypothesis that should be essentially the same for galaxies of the same mass—still present in some modern galaxy formation simulations Oman et al. (2015)—is rejected by the data.
Surface Density Follows from Surface Brightness
In MOND, the dynamical surface density should follow from the surface density of baryonic mass. This surface density of stars is well traced by the surface brightness in the near-infrared (e.g., the -band at or the band of the Spitzer Space Telescope). The mass surface density is traced by the dynamics: . Consequently, we expect a correlation between surface brightness and measured acceleration.
Do the data corroborate the prediction of MOND?
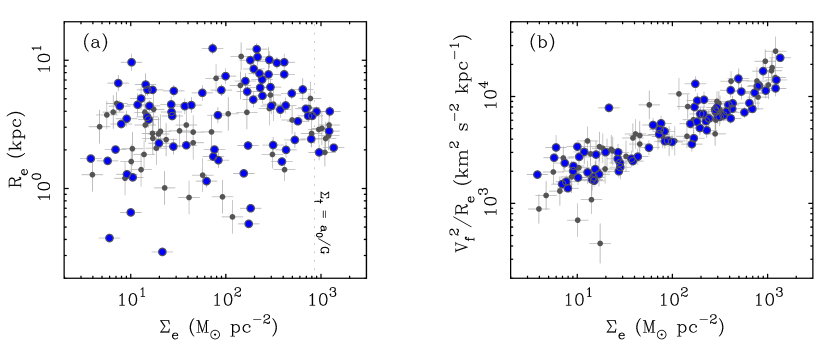
Yes. This is apparent directly from the observed dynamical accelerations (Figure 4). These vary in direct correspondence to the observed surface brightness. Low surface brightness systems have low accelerations; high surface brightness galaxies display high accelerations. There is a clear continuum from one end of the galaxy spectrum to the other. This happens despite the enormous scatter in the size–surface brightness plane.
Was the prediction made a priori?
Yes. Figure 4 is purely empirical. It simply plots the data Lelli et al. (2016); there is no fitting of any sort. The correlation apparent in Figure 4 directly indicates the connection between surface brightness and acceleration, which traces the dynamical surface density. That this should happen was predicted a priori by MOND at its inception.
What does dark matter predict?
In order to predict how surface density correlates with surface brightness, one needs to know both. Dark matter-only simulations provide excellent predictions for what the density profiles of dark matter halos should be Navarro et al. (1997), but are mute about the surface brightnesses of the galaxies they contain. Hydrodynamical simulations obtain a variety of results for the distribution of baryons, and there is no clear consensus about what this should be Scannapieco et al. (2012). Consequently, CDM makes no clear prediction for this observable.
Predicting Rotation Curves
In MOND, the dynamics should follow from the observed mass distribution. To perform this test, we need to calculate the Newtonian gravitational potential associated with the observed mass, calculate the corresponding force in MOND, and observe a tracer of that force. Rotation curves provide a test in which this ideal is nearly achieved.
It is possible to predict rotation curves from the baryonic mass distribution of galaxies: the atomic gas is traced by 21cm observations while the stellar mass is well-traced by the near-IR light. With the adopted mass-to-light ratio, we convert the surface brightness profiles of galaxies observed by Spitzer Schombert and McGaugh (2014) into mass models Lelli et al. (2016) that represent the gravitational potential of the stars. The same has been done for the gas in the course of obtaining 21cm rotation curves (see the many references in Lelli et al. (2016)). These mass models are representations of the Newtonian gravitational potential of stars and gas (e.g., Figure 5). These potentials add linearly and predict radial accelerations that must match the centripetal acceleration to sustain circular motion.
The observed stars and gas () fall short of explaining the centripetal acceleration indicated by rotation curves ()—hence the need for dark matter or MOND. In the former case, we simply attribute any excess to dark matter. In MOND, there is a mathematical relation between what we see and what we get Milgrom (2010):
| (4) |
where is an interpolation function that smoothly joins the high and low acceleration regimes Milgrom (1983a); Milgrom and Sanders (2008); McGaugh (2008). This is not specified theoretically, but is constrained empirically to be something very close to the so-called "simple" function Famaey and Binney (2005); Hees et al. (2016). Here we adopt McGaugh (2008)
| (5) |
which describes the data well McGaugh et al. (2016). Once we specify this function, we can use Equation (4) to predict rotation curves from the baryonic mass distribution.
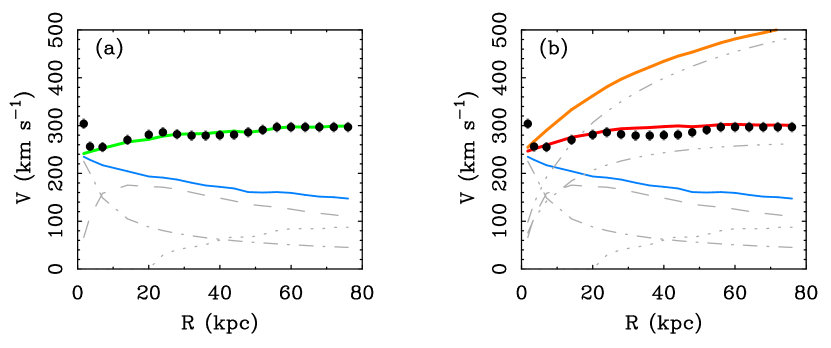
Figure 5 shows an example rotation curve prediction. First, the Newtonian acceleration is estimated using the nominal mass-to-light ratios for the stellar components. We then use Equation (4) to obtain the MOND-predicted acceleration. This is shown as the green line () in Figure 5a. This provides a remarkably good match to the data for a hands-free prediction. Only the first point is missed; this is because our nominal bulge mass-to-light ratio in a bit small for this galaxy—in a fit, it grows to Li et al. (2018). This is within the range of expected variation. Moreover, this must be the case in either theory. It occurs in the high acceleration limit, so MOND gives no boost. Nor can we invoke a dark matter halo, as the rotation curve declines steeply after the first point, just as the shape of the bulge light distribution predicts, while the rotation curve of the dark matter halo must rise monotonically if it is to fit the data further out. In either case, we need a higher mass-to-light ratio for the bulge.
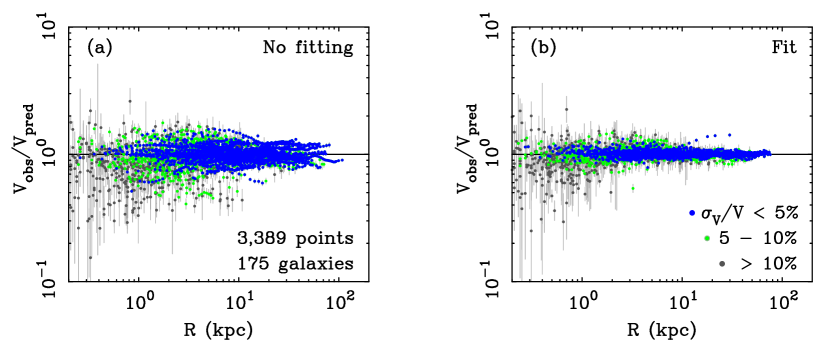
The successful MOND prediction of the rotation curve of UGC 2885 seen in Figure 5 is not a fluke; it is the general rule. Figure 6 shows the residuals of MOND-predicted rotation curves for 175 galaxies for which all necessary, credible data (a Spitzer map of the stellar mass, an HI map of the atomic gas mass, and a rotation curve) are available. No fitting has been performed in Figure 6a, which simply plots the ratio of the observed velocity to that predicted by MOND for the nominal mass-to-light ratio. The same has been assumed for all galaxies: what you see is what you get. That it was possible to effectively predicted rotation curves with near-IR surface photometry was also noted by Sanders and Verheijen (1998). The same holds in galaxies where atomic gas is the dominant form of baryonic mass Sanders (2019), as the stellar mass-to-light ratio matters little for such galaxies.
The result of fitting the data Li et al. (2018) is shown in Figure 6b. The scatter declines as expected, albeit by a modest factor: the raw prediction with a constant mass-to-light ratio for all galaxies in Figure 6a is already pretty good. The reduction in scatter here manifests in an increased scatter in the stellar mass-to-light ratio (see below). This must happen; a constant makes for a nice, hands-free assumption, but there must be some intrinsic scatter in this quantity. It turns out that the scatter so induced is about that expected from variations in the star formation histories of galaxies Meidt et al. (2014). There is the expected amount of variation in the mass-to-light ratio, leaving little room for intrinsic scatter in the underlying relation.
A subtle point worth noting is that the deviations seen at small radii in Figure 6 velocity skew preferentially to . This is the effect that is expected from the combination of observational resolution ("beam smearing") and asymmetric drift (non-circular motion). It is hard to measure the velocity accurately as small radii where the gradient of the rotation curve is large so that different velocities contribute within the first beam; the result is often an underestimate of the true rotation speed. It is also the case that non-circular motions sometimes make up a large fraction of the kinetic energy at small radii so that the measured velocity sometimes falls short of the desired circular velocity of the gravitational potential. These effects both result in a systematic skew in the sense observed, particularly in the lowest quality data (the grey points in Figure 6).
Do the data corroborate the prediction of MOND?
Yes. The predictive ability of MOND is as good as can be expected given the fundamental limitation of converting the observed starlight into the corresponding stellar mass. One can reduce the scatter in Figure 6a by treating as an adjustable parameter. The efficacy of this procedure is apparent in Figure 6b and has been demonstrated many times before Begeman et al. (1991); Sanders (1996); de Blok and McGaugh (1998); Sanders and McGaugh (2002); Swaters et al. (2010); Gentile et al. (2011); Famaey and McGaugh (2012). There are, of course, exceptions: galaxies that do not fit in detail. For example, NGC 2841 was long considered problematic Bottema et al. (2002), but a good fit falls out of a Bayesian analysis Li et al. (2018). Still, problematic cases persist (e.g., NGC 2915). There are always cases like this in astronomy; it would be suspicious if all the data could be fit without some outliers. The failure rate increases as data quality declines, as expected. We should not lose sight of the forest for the occasional outlying tree.
Was the prediction made a priori?
That it should be possible to predict rotation curves from the observed mass distribution of galaxies was predicted a priori. The extent to which this is possible for any individual galaxy is limited by astrophysical uncertainties in how well we can measure the mass distribution; in particular, the unavoidable uncertainty in . That it is possible to come as close as illustrated by Figure 6 is a remarkable accomplishment.
What does dark matter predict?
CDM makes clear predictions for the rotation curves of dark matter halos Navarro et al. (1997). Predictions for the observable properties of galaxies are model-dependent. Many different models are possible; Figure 5 illustrates two possibilities.
In order to predict the rotation curve of a specific galaxy, we need a mechanism to specify the dark matter halo within which it resides. Perhaps the most obvious mechanism at present is offered by the stellar mass–halo mass relation obtained from abundance matching Bullock and Boylan-Kolchin (2017). A massive galaxy like UGC 2885 with should reside in a halo of mass (see Figure 6 of Bullock and Boylan-Kolchin (2017)). Together with the halo mass–concentration relation Dutton and Macciò (2014), this predicts the expected rotation attributable to the dark matter halo. Adding this in quadrature with the baryonic component results in the orange line depicted in Figure 5b. This grossly over-predicts the observed rotation.
If one did this exercise twenty years ago (I did), then the stellar mass–halo mass relation from abundance matching was not yet available. The common approach then was to assume a constant disk to halo ratio around Mo et al. (1998). Adopting this, we predict . This comes much closer to matching the observed rotation, performing almost as well as MOND in predicting the rotation curve.
The good performance of assuming a disk fraction is certainly a fluke. We could just as easily have assumed or 0.025 (both values considered by Mo et al. (1998)), and we would again mispredict the rotation curve. There is no reason to expect, a prior, that this particular galaxy should have this particular disk fraction. We can fit the data to infer , but we cannot predict the rotation curve. If we use one galaxy to fix , we then get incorrect results for other galaxies: must vary with mass McGaugh et al. (2010).
The stellar mass–halo mass relation of abundance matching is now an essential element of the CDM paradigm Wechsler and Tinker (2018), so the discrepancy of the optimal disk fraction from this relation cannot be ignored. It is tempting to conclude that this particular galaxy happens to be an outlier in the scatter about the mean – relation, by chance having a small total mass for its observed stellar mass. This is equivalent to suggesting that it has an abnormally low velocity (the green line in Figure 5 rather than the expected orange line). This in turn predicts that it should sit far off of the Tully–Fisher relation defined by other galaxies of the same stellar mass. It does not. Indeed, in general, there is too little scatter in the BTFR to accommodate that expected in the stellar mass–halo mass relation.
There exist many other possibilities in the context of CDM that are not considered here. Indeed, we have ignored processes that must be relevant, like adiabatic compression of the halo Sellwood and McGaugh (2005), and any form of stellar feedback (though this is usually said not to be important in galaxies of this high mass). It seems common to imagine that the solution lies in getting the combination of these effects right, but really this makes the problem worse, not better: there is no unique way to predict rotation curves with CDM. A huge number of models are possible; many are plausible. Nature appears to have declined to implement any reasonable CDM model. The best we can hope to do is very precisely mimic the behavior of MOND, reproducing after the fact the phenomenology it correctly predicted in advance.
Stellar Population Mass-to-Light Ratios
The stellar mass-to-light ratio is the only physical parameter available to MOND fits. A considerable amount is known about stellar populations, so these provide an independent check. If MOND is simply a strange fitting function, there is no need for its fitting parameter to return plausible mass-to-light ratios. If instead there is something to it, then the fitted values of should make sense in terms of stellar populations.
Figure 7a shows the stellar mass-to-light ratios for SPARC galaxies as assumed throughout this work ([3.6] for stellar disks and for bulges). The luminosity-weighted mass-to-light ratio is shown, so the slight variation seen for a few points is from differences in the bulge fraction. Most galaxies appear as beads on a string. This morphology is anathema to stellar populations, which must inevitably suffer scatter from variations in the star formation history, the metallicity distribution of the stars, and differences in the IMF (Initial Mass Function: the distribution of masses with which stars form). In short, the absence of scatter in Figure 7a is unphysical. This suffices only as a first estimate, but there must be some intrinsic scatter in .
In Figure 6 we predicted rotation curves using the shown in Figure 7a. Figure 7b shows the stellar mass-to-light ratios obtained from rotation curve fits Li et al. (2018). This is what is required to eliminate nearly all the scatter in Figure 6, transferring it from deviations in the predicted velocity to the scatter that appears here. The amount of scatter required to make rotation curve fits could have been arbitrarily large. Instead, it is rather modest. Indeed, the scatter in seen in Figure 7b is consistent with that expected from the combination of observational errors and intrinsic scatter in stellar population ( dex at [3.6] Meidt et al. (2014)) stemming simply from variations in the star formation history. There is little room for other plausible sources of variation, like galaxy-to-galaxy differences in the average IMF. Given that some intrinsic scatter in is inevitable, it is hard to imagine a more favorable outcome.
Do the data corroborate the prediction of MOND?
Yes. The stellar mass-to-light ratios of MOND fits (Figure 7; Sanders and McGaugh (2002); Famaey and McGaugh (2012); Li et al. (2018)) are in excellent accord with the expectations of stellar population models Bell and de Jong (2001); Portinari et al. (2004); Meidt et al. (2014); Schombert and McGaugh (2014); McGaugh and Schombert (2014); Schombert et al. (2019). The amplitude of is consistent with what is expected for a Kroupa or Chabrier IMF, which are practically indistinguishable. Heavier or lighter IMFs are disfavored. The scatter increases from red to blue bandpasses, as expected, and the expected color- relations are also recovered Famaey and McGaugh (2012); McGaugh and Schombert (2015).
Was the prediction made a priori?
No, and it cannot be. The test here is whether the mass-to-light ratios required in MOND fits are consistent with the astrophysical expectations of stellar population models. To a remarkable extent, they are.
What does dark matter predict?
I am not aware of any mechanism by which a similar test could be made in CDM as the stellar mass-to-light ratio does not play an equivalent role in determining the dynamics that specify the rotation curve. In MOND, is uniquely specified, within the uncertainties, while in dark matter models there is an unavoidable degeneracy between dark and luminous mass Kent (1987), precluding a unique test.
The Correspondence of Features
An important aspect of galaxy dynamics is the observed correspondence between features observed in the baryonic mass distribution and those seen in rotation curves. The "bumps and wiggles" in one are reflected in the other. This is known among experts as "Renzo’s Rule" Sancisi (2004).
It was recognized early on van Albada and Sancisi (1986) that the observed correspondence of bumps and wiggles implied that stars were the dominant mass component at small radii. The correspondence exists because the stellar mass dominates the gravitational potential, so features in the stellar distribution are necessarily reflected in the rotation curve. This situation is generally known as maximum disk: the stellar mass is close to the maximum allowed by the rotation curve Sellwood (1999); Palunas and Williams (2000); Freeman (2010).
In HSB galaxies, the maximum disk mass is generally comparable to or slightly higher than what is expected for stellar populations (0.7 vs. at [3.6] for disks and 0.8 vs. 0.7 for bulges, with substantial individual variation Starkman et al. (2018)). In these situations, the correspondence between photometric and kinematic features is natural: the stars dominate the gravitational potential at small radii. The bulge of UGC 2885 in Figure 5 is one example. There are many others Sellwood (1999); Palunas and Williams (2000); Starkman et al. (2018); McGaugh et al. (2019).
The situation is different in LSB galaxies. Since the stellar mass is spread over a greater radius, the contribution of the stars to the total velocity is reduced simply because . For the masses expected for stellar populations, LSB galaxies are far removed from being maximal. One might choose to favor the maximum disk mass-to-light ratio over the stellar population expectation, but this would violate the constraints discussed above: LSB galaxies cannot be maximal and also fall on the BTFR. Imposing maximum disk mass-to-light ratios would induce surface-brightness correlated scatter in Figure 1 that is not present in the raw data.
Thin, dynamically cold stellar disks can support features like spiral arms while quasi-spherical, dynamically hot dark matter halos cannot Binney and Tremaine (1987). One therefore expects the correspondence between features to dissipate as surface brightness decreases and the dark matter halo comes to dominate. Nevertheless, the correspondence of features persists (Figure 8; Sancisi (2004); Verheijen and de Blok (1999); Swaters et al. (2009, 2012); Lelli et al. (2013)).
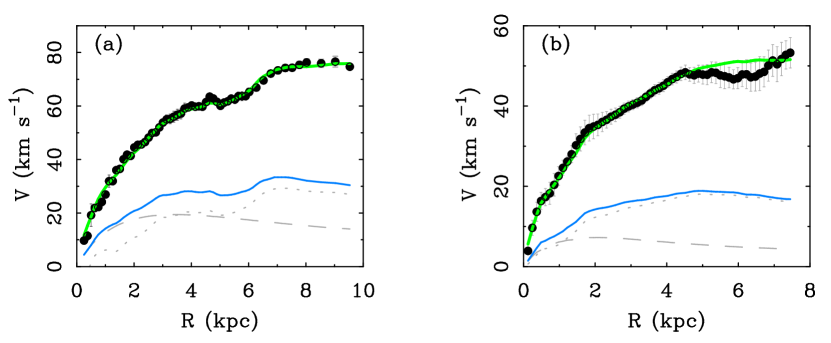
Figure 8 shows two examples that illustrate the correspondence of photometric and kinematic features in low surface density galaxies. NGC 1560 has a prominent dip from 5–6 kpc in both the baryonic and total rotation curve Begeman et al. (1991); Gentile et al. (2010). DDO 154 has a more subtle correspondence between the two, with kinks around 0.5, 2, and 5 kpc de Blok et al. (2008). These are not happenstance; this is the general rule Sancisi (2004); Li et al. (2018): details like this are subsumed in the residuals for all the galaxies in Figure 6.
The majority of the baryonic mass in the galaxies in Figure 8 is in the form of gas, not stars. Consequently, there is no leverage to fit the data by adjusting the stellar mass-to-light ratio: the shape of the rotation curve follows directly from the observed distribution of gas. As emphasized by Sanders (2019), galaxies like these provide very nearly a direct prediction without any fitting. However, there are nuisance parameters that need to be considered Li et al. (2018). The distance and inclination is measured independently for each galaxy, but of course these are not known perfectly well. These influence the baryonic mass () and rotation speed [through ]. The case of DDO 154 provides a good illustration of both effects. Distance estimates to DDO 154 range222The NASA/IPAC Extragalactic Database (NED) is operated by the Jet Propulsion Laboratory, California Institute of Technology, under contract with the National Aeronautics and Space Administration. from 3 to 6 Mpc. The formally most accurate measurement is Mpc Tully et al. (2009); Jacobs et al. (2009). If we hold the distance fixed at 4.04 Mpc, then the shape of the rotation curve is the same but the amplitude slightly overshoots the data (see Figure S5 of Ren et al. (2019)). Distances are never known perfectly; treating it as a nuisance parameter in a Bayesian fit with a prior that matches the measurement uncertainty leads to Mpc Li et al. (2018). This small reduction in the distance is the difference between overshooting the data and the excellent fit seen in Figure 8. Similarly, the inclination is not perfectly well known. In the case of DDO 154, it becomes particularly uncertain at large radii (see Figure 81 of de Blok et al. (2008)) where the shape of the rotation curve becomes dodgy. The slight mismatch in the shape of the MOND fit in the outer fringes of DDO 154 is a good thing: it cannot be fooled into tracing unphysical variations de Blok and McGaugh (1998).
A good theory should not only fit the data, it should also fail to fit data that are incorrect. To test this, an outright mistake in the baryon distribution was intentionally introduced by de Blok and McGaugh (1998). An acceptable MOND fit to these incorrect data could not be found: confronted with a situation in which it should fail, it did so. In contrast, there is substantially more freedom in fits with dark matter halos: one could happily fit the data without noticing that the baryonic distribution was wrong, much less notice a detail like a slight issue with the distance.
The experiment of using an incorrect baryon distribution has been unintentionally replicated by Ren et al. (2019) in the case of D631-7 (the first example in their Figure S5). D631-7 is a gas rich galaxy similar to those in Figure 8. However, only a total gas mass is available; the detailed gas distribution is not. For inclusion in the SPARC database Lelli et al. (2016), a scaling relation between gas mass and radius was applied to make a crude estimate of the gas distribution Lelli et al. (2016, 2017). This estimate is certainly wrong in detail, and indeed, the MOND fit that Ren et al. (2019) obtain using it is a poor match to the data—as it should be in such a circumstance. In contrast, the fit Ren et al. (2019) make with dark matter shows no indication of a problem. There is sufficient freedom in fits with dark matter halos to absorb even gross errors in the input data; they are incapable of failing when they should de Blok and McGaugh (1998).
Do the data corroborate the prediction of MOND?
Yes. In MOND, the detailed shape of the rotation curve must follow from the observed distribution of mass. This is what is observed.
Was the prediction made a priori?
What does dark matter predict?
The conventional expectation is that dark matter halos should not support the same features that are seen in the luminous disk. Dynamically hot dark matter halos that dominate the mass budget should not be affected by the small minority of mass in the disks of LSB galaxies, and are not able to sustain similar features on their own Binney and Tremaine (1987). Any one case might be dismissed as a happenstance of some non-equilibrium event, but the specific cases illustrated in Figure 8 are not the exception; they are examples of the general rule (Figure 6). The widespread correspondence between features in the baryonic mass profiles and the kinematics of LSB galaxies is contradictory to any flavor of dark matter that does not interact with baryons by some mechanism more direct than gravity.
2.3 Disk Stability
There are many indications of mass discrepancies in extragalactic astronomy and cosmology Faber and Gallagher (1979); McGaugh and de Blok (1998a); Sanders and McGaugh (2002); Famaey and McGaugh (2012); McGaugh (2015). One of the early indications was disk stability. Left to themselves, spiral disks that are not embedded in dark matter halos are subject to a violent bar instability Ostriker and Peebles (1973). Maintaining thin, stable, dynamically cold spiral disks for the better part of a Hubble time seems to require some assistance Sellwood (2014, 2016); Sellwood et al. (2019). A simple way to think of this is a competition between disk self-gravity, which drives instabilities like bars and spiral arms, and the gravity of a dynamically hot dark matter halo, which tends to suppress these instabilities. Explaining the observed morphologies of spiral disks requires some of both.
The Freeman Limit
The highest surface brightness galaxies have the most disk self-gravity, so are most subject to self-destructive instabilities. These HSB galaxies are at the Freeman limit, which is a generalization of Freeman’s Law Freeman (1970). LSB galaxies exist in great numbers Disney (1976); Allen and Shu (1979); McGaugh et al. (1995); Cross and Driver (2002); what was called Freeman’s Law is not a constancy of surface brightness for all galaxies, but an upper limit on surface brightness that disk galaxies do not exceed Allen and Shu (1979); McGaugh et al. (1995).
A first investigation of disk stability in MOND was discussed in Milgrom (1989), and numerical simulations have been conducted by Brada and Milgrom (1999); Tiret and Combes (2008); Jiménez and Hernandez (2014); Thies et al. (2016); Sánchez-Salcedo et al. (2016); Banik et al. (2018). The basic result is that MOND stabilizes galaxy disks without a dark matter halo. There are two essential predictions that appear already in the first work Milgrom (1989) and persist in the numerical simulations: disk galaxies can only exist in the MOND regime, and the amount of stability predicted for LSB galaxies differs from that expected with dark matter halos.
Do the data corroborate the prediction of MOND?
Yes. Bare Newtonian disks should suffer the usual instability in the absence of dark matter, so are predicted not to exist. This sets an upper limit to the surface brightness, as stabilizing accelerations are only obtained for . The observed value of the Freeman limit corresponds well to (Figure 4; Famaey and McGaugh (2012)).
Note that the scale appears in disk stability in a way that is different from its appearance in galaxy kinematics. In kinematic relations like the BTR, it appears with Netwon’s constant as the product . In disk stability, it appears through the ratio with Newton’s constant: . Hence the scale appears in galaxy data in distinct ways that are unique to MOND.
Was the prediction made a priori?
No and yes. The Freeman surface brightness was known before MOND was invented, and before the first investigation of disk stability therein. However, it was correctly anticipated Milgrom (1989) that the Freeman surface brightness was a limit rather than a universal value at a time when most of the community interpreted it to be the latter.
What does dark matter predict?
Disk stability in CDM depends, crudely speaking, on the disk-to-halo ratio. If this is too large, the disk becomes unstable. The dense, cuspy halos that emerge from numerical simulations are capable of stabilizing disks of considerably higher surface density than the Freeman limit Sellwood and Evans (2001); the scale had to be inserted into models by hand Dalcanton et al. (1997); McGaugh and de Blok (1998a). There is no reason that the threshold for stability should be that predicted by MOND, as observed.
Vertical Velocity Dispersions
"An analog of the Oort discrepancy should exist in all galaxies and become more severe with increasing [radius] in a predictable way."
—M. Milgrom Milgrom (1983b).
The vertical velocity dispersions of disk galaxies are related to their stability. Disks are dynamically cold, in the sense that Oh et al. (2008); Martinsson et al. (2013). Cold disks are especially subject to instabilities Oh et al. (2008); Martinsson et al. (2013), which was an important consideration driving early work Ostriker and Peebles (1973) and remains an important consideration today. A related property is the Oort discrepancy; i.e., the excess vertical velocity dispersion over that which can be explained by the Newtonian restoring force to the stellar disk.
Conventionally, the Oort discrepancy should be modest. Near the disk, the stars dominate the mass budget and provide the lion’s share of the restoring force. It is only as one looks to high vertical distances from the center of the plane that one begins to notice the contribution of the quasi-spherical dark matter halo.
In MOND, the amplitude of the discrepancy depends on the acceleration. In high acceleration regimes, there should be no discrepancy. The discrepancy should appear around , and grow larger as accelerations decrease. In HSB galaxies, the severity of the Oort discrepancy should increase with radius because acceleration decreases with radius (Figure 3b). Interpreted conventionally, one would infer a dark matter halo that is very squashed near the disk plane, or even a disk of dark matter, transitioning to a more spherical potential farther out. The quantitative details of how this occurs may be theory-specific: not all theories Bekenstein and Milgrom (1984); Milgrom (2010, 1994, 1999) that follow the basic tenets of MOND Milgrom (2014) need necessarily be identical in this regard.
Do the data corroborate the prediction of MOND?
For this test, the results are mixed. In general, the shape of the predicted velocity dispersion profile is often correct, but the amplitude is frequently over-predicted. This makes no sense in either MOND or dark matter. MOND should get both right. In dark matter, the shape of should follow the prediction of Newton Das et al. (2020), not MOND. A similar conundrum arises for clusters of galaxies Sanders (2003, 2007); Angus et al. (2008); McGaugh (2015); Tian et al. (2020).
In the Milky Way, the rotation curve is well described by MOND, which successfully predicted its outer slope McGaugh (2019). However, the vertical velocities are over-predicted McGaugh (2016) by Lisanti et al. (2018). This is about a discrepancy, so dark matter is favored by the vertical velocity data, provided that we spot it MOND-like behavior in the radial direction. It is not obvious that this make sense in principle, and it leads to a puzzle in practice. The local dark matter density inferred from the rotation curve is McGaugh (2018) while that from vertical motions implies twice as much: Bienaymé et al. (2014). This implies a squashed halo Bienaymé et al. (2014), but this is contrary to the findings of Lisanti et al. (2018) for which a spherical halo is a reasonable fit.
In external galaxies, we encounter a similar problem. This challenging observation has been undertaken by the DiskMass project Bershady et al. (2010), with the result that disks are not merely cold dynamically, but downright frigid. Using conventional dynamics, the observed vertical velocity dispersions imply stellar mass-to-light ratios that are a factor of Martinsson et al. (2013) or more Swaters et al. (2014) lower than expected for stellar populations McGaugh and Schombert (2014). This is equivalent to removing all stars of mass from a Kroupa IMF. This is not a viable solution, as it implies that the sun and lower mass stars that are numerically common locally do not exist in other galaxies. The problem gets worse in MOND, which predicts larger velocity dispersions Angus et al. (2015). However, the shape of the radial variation is well-predicted Milgrom (2015); the problem is a small offset between the observed and predicted dispersion that remains roughly constant as varies by a large factor. Since the result makes little sense in the conventional context Angus et al. (2016); Aniyan et al. (2016), it is not surprising that it does not work for MOND either. As in the Milky Way, we are confronted with a situation that is problematic for both paradigms.
There are some qualitative suggestions of MOND-like behavior in this context. The velocity dispersions of the gas in the outer regions of galaxies are consistently higher than can be sustained by the restoring force of the Newtonian disk Meurer et al. (1998). This leads to the inference of highly flattened dark matter halos Olling (1996) or dark disk components Das et al. (2020) distinct from quasi-spherical halos, or some non-gravitational effect. That the velocity dispersion in these low density regions are higher than expected conventionally is the qualitative signature of MOND. By the same token, there exist ultrathin disk galaxies Matthews et al. (1999); Matthews (2000); Matthews and Uson (2008) that are difficult to sustain conventionally with the weak restoring of their low surface density stellar disks: they should be much thicker than observed. That these galaxies are thin follows naturally from the enhanced restoring force provided by MOND (see Figure 9 of McGaugh and de Blok (1998b)).
There is no clear conclusion that can be drawn from the vertical velocity dispersion data at this time. There are a number of qualitative indications of MOND-like behavior, especially in low surface density systems where its effects should be pronounced. However, its quantitative predictions persistently over-predict vertical velocities in the best observed systems, albeit by a small amount.
Was the prediction made a priori?
Yes. It remains the irrevocable prediction that the vertical velocity dispersion should follow from the observed distribution of baryonic mass. However, the details of the quantitative prediction may depend on whether MOND is a modification of gravity Bekenstein and Milgrom (1984); Milgrom (2010) or inertia Milgrom (1994, 1999).
What does dark matter predict?
The prediction of conventional dynamics with dark matter depends on the detailed distribution of both dark and luminous mass. The former is not observed, so we are free to assign to each dark matter halo whatever degree of flattening is required to fit the data. This is not as satisfactory as an a priori prediction, but it should be possible to predict the distribution of halo shapes Dutton and Macciò (2014); Springel et al. (2004); Chua et al. (2019) to make a statistical test. I am not aware of a conclusive observational test of this type.
Spiral Structure in LSB Galaxies
"In LSB disks, it is conceivable that the minimum disk mass required to generate spiral arms might exceed the maximum disk mass allowed by the rotation curve."
—S. McGaugh McGaugh and de Blok (1998b)
For disk galaxies near the Freeman limit, the stability provided by a dark matter halo is about the same as that provided by MOND. However, the two theories diverge to lower accelerations. In order to explain the amplitude of the rotation curve, the disk-to-halo ratio must steadily decline as the surface brightness declines: LSB galaxies are dark matter dominated. Consequently, they should be very stable Mihos et al. (1997). In contrast, the stability provided by MOND does not continue to increase indefinitely in the regime of very low accelerations, instead saturating after a mild increase Milgrom (1989); Brada and Milgrom (1999).
The difference in the predicted stability properties of LSB disk galaxies leads to a difference in the expected morphology. Dark matter halos over-stabilize low surface density disks, suppressing the development of bars and spiral arms Mihos et al. (1997); Banik et al. (2018). In contrast, MOND predicts a more similar development of such features in high and low surface brightness disks, with numerical simulations showing remarkably realistic morphologies Tiret and Combes (2008).
Though dark matter halos were originally invoked to stabilize disks Ostriker and Peebles (1973), it was also recognized early that the disk-to-halo ratio should not be too low, or it would over-stabilize disks and suppress the observed spiral modes. This marginal stability condition places a lower limit on the masses of the stellar disks Athanassoula et al. (1987). This minimum disk is not far removed from maximum disk for HSB galaxies. In contrast, LSB galaxies are well below maximum disk: for the stellar masses expected from population synthesis, stars contribute little to the gravitational potential, even at small radii McGaugh (2005); Starkman et al. (2018).
As a consequence, LSB galaxies should not exhibit bars or spiral structure if embedded in dominant dark matter halos Mihos et al. (1997). Though there are certainly differences in morphology between HSB and LSB galaxies, these are modest and there is no lack of examples of LSB galaxies with bars Peters and Kuzio de Naray (2018) and spiral arms (Figure 9 McGaugh et al. (1995); Schombert (2006); Schombert et al. (2011)). This observation is natural in MOND, as there is ample disk self-gravity to drive the observed spiral structure, and little dynamical friction to slow bars, which are observed to have higher pattern speeds Peters and Kuzio de Naray (2019) than expected when dark matter dominates Debattista and Sellwood (2000); Weiner et al. (2001).
Figure 9 shows the example of the LSB galaxy F568-1. This galaxy is dim but large, with a disk scale length kpc Lelli et al. (2016), somewhat larger than that of the Milky Way Bovy and Rix (2013). Its diffuse stellar disk exhibits a clear two-armed, grand design spiral pattern. This should be strongly suppressed by the dominant dark matter halo: the disk-to-halo ratio is tiny, so there is insufficient disk self-gravity to drive the instabilities that feed spiral structure. And yet, there it is.
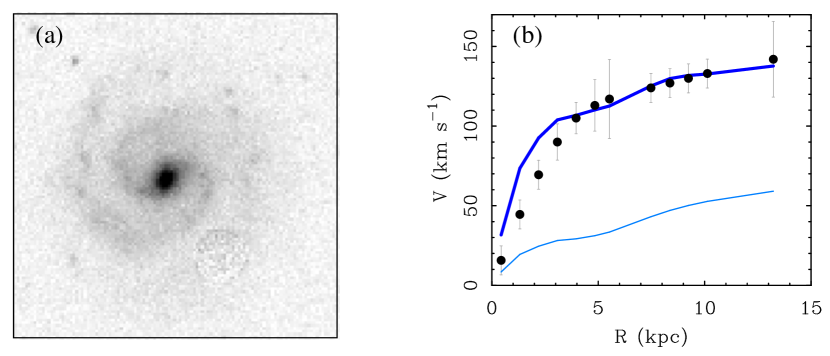
If MOND is the cause of spiral structure in LSB galaxies, then it is straightforward to predict McGaugh and de Blok (1998b) how this would be interpreted in conventional terms. Specifically, if one were to apply the marginal stability condition Athanassoula et al. (1987) to LSB galaxies, one would infer unnaturally large disk masses McGaugh and de Blok (1998b). F568-1 (Figure 9) has a [3.6] luminosity of Lelli et al. (2016), so population synthesis leads us to expect . In order to explain the observed spiral structure of F568-1, the conventional analysis requires Fuchs (2003). This is an order of magnitude more than expected for a normal stellar population, and comparable to the much brighter Milky Way Bland-Hawthorn and Gerhard (2016). Scaled to this mass, the rotation curve of the disk accounts for essentially all the mass in this LSB galaxy (Figure 9b). There is no room left for the dark matter halo, and formally the disk exceeds the observed rotation at small radii. Taken at face value, more mass is required to drive spiral structure than is allowed by the rotation curve. This is the contradiction to conventional dynamics anticipated in the quote above McGaugh and de Blok (1998b).
More generally, the expectation is that the conventional analysis of spiral structure in LSB galaxies will indicate a stellar mass in excess of that which is reasonable for stellar populations. This more general prediction is realized in the LSB galaxies for which a careful analysis has been performed Fuchs (2003, 2008); Saburova and Zasov (2013). Quoting from these works: "these estimates seem to indicate that the disks of low surface brightness galaxies might be much more massive than currently thought. This puzzling result contradicts stellar population synthesis models" Fuchs (2003); "When I apply this method to the disks of low surface brightness galaxies, I find unexpectedly high mass-to light ratios" Fuchs (2008); and "For four low-surface-brightness galaxies, we find the disk masses corresponding to the marginal stability condition to be significantly higher than one may expect from their brightness" Saburova and Zasov (2013). These statements are exactly what was predicted to happen if disk stability is provided by MOND rather than a dark matter halo.
It may be tempting to take these high masses literally rather than accept that they might be due to MOND. Note, however, that all the correlations discussed above follow from stellar masses that are very much in accord with our expectations for stellar populations. If instead we adopt these higher masses, it will vastly increase the scatter in the BTFR (Figure 1), building in a correlation of residuals with surface density where there are none with surface brightness, and make nonsense of the correlations seen in Figures 3 and 4. We cannot fix this without breaking those.
Do the data corroborate the prediction of MOND?
Yes. Application of modal analysis resulted in precisely the predicted effect.
Was the prediction made a priori?
Yes. This was the obvious effect that could be anticipated for a conventional analysis McGaugh and de Blok (1998b).
What does dark matter predict?
Nominally, one expects LSB galaxies with stellar disk masses that are reasonable from the perspective of stellar populations to be more stable than observed due to their tiny disk-to-halo ratios Mihos et al. (1997). There are any number of effects that could be invoked which might or might not circumvent this baseline expectation. These do nothing to explain why the observed phenomenon follows from the predictions of MOND.
3 Discussion
"In science, all new and startling facts must encounter in sequence the responses
- 1.
It is not true!
- 2.
It is contrary to orthodoxy.
- 3.
We knew it all along."
—L. Agassiz (paraphrased)
We have now completed each step in this progression. The results of the earliest rotation curve data for LSB galaxies de Blok et al. (1996) were disputed333Systematic errors were repeatedly invoked. First it was beam smearing van den Bosch et al. (2000). This was a legitimate concern in a minority of cases; it was addressed by improving the spatial resolution of the data with long slit observations McGaugh et al. (2001); de Blok and Bosma (2002). Then concerns were raised that these observations suffered from slit alignment errors Swaters et al. (2003). This was never a serious concern McGaugh et al. (2001); de Blok et al. (2003), as confirmed by subsequent improvements to the data Kuzio de Naray et al. (2006, 2008). A variety of physical effects were then invoked; e.g., grossly non-circular motions Hayashi et al. (2007), which could also be excluded Kuzio de Naray et al. (2009); Kuzio de Naray and Kaufmann (2011). This is what it looks like when the normal component makes excuses to disregard the obvious implications of inconvenient data. (it is not true!); attempts to pose the results in an empirical framework McGaugh (2004) independent of MOND were met with antipathy444At the 2006 conference Galaxies in the Cosmic Web, I showed McGaugh (2004) that the systematic dependence of the mass discrepancy on acceleration seen in Figure 2b was true empirically irrespective of MOND. In response, a prominent galaxy formation theorist shouted, ”We don’t have to explain MOND!” (it is against orthodoxy!), and more recently, improved data McGaugh et al. (2016) corroborating the results in McGaugh (2004) are now frequently described555Recent papers describing the observed MONDian phenomenology as natural in CDM include Ludlow et al. (2017); Navarro et al. (2017); Ren et al. (2019); Dutton et al. (2019); Wheeler et al. (2019). If it were natural, it would have fallen out of CDM models long ago McGaugh and de Blok (1998a); Mo et al. (1998). as "natural" (we knew it all along).
Unfortunately, we did not know it all along. We have been surprised at every turn: these were startling facts, when new. Only one theory succeeded in predicting these phenomena in advance: MOND. It has met the gold standard of scientific prediction repeatedly for a wide variety of phenomena, including many beyond the scope of this review Famaey and McGaugh (2012); McGaugh (2015); McGaugh and Milgrom (2013a, b); Pawlowski and McGaugh (2014); McGaugh (2016). I do not see how this can be a fluke.
A common reaction at this juncture is "MOND may get X right, but it gets666Most commonly, Y clusters of galaxies or large scale structure. These are discussed in McGaugh (2015) and references therein. Y wrong. Therefore dark matter must be correct." The second sentence does not follow from the first, as it presupposes that dark matter automatically explains everything that MOND predicted in advance. This fails to address why MOND has predictive power that dark matter lacks: just saying "dark matter does it" is not a satisfactory scientific explanation. We need to understand X irrespective of Y, not use Y as an excuse to ignore X.
The set X of properties discussed here is listed in Table 1. These include many successful a priori predictions of MOND. In contrast, many of these observations are problematic for the dark matter paradigm. There is no good reason for properties (2.1), (2.2), (2.2), and (2.3) to arise in the context of dark matter: they were not predicted, and require fine-tuning to explain McGaugh (1999); McGaugh and de Blok (1998a, b); McGaugh (2004, 2005, 2005, 2011, 2012, 2015). Properties (2.1), (2.2), and (2.3) appear to be outright contradictions to the dark matter interpretation of galaxy dynamics. Whether they amount to a falsification depends on where we set that bar: what would constitute a falsification of the dark matter? At the very least, it is disturbing that a completely different theory correctly predicted a wide range of phenomena that the dark matter paradigm did not.
| Prediction | Test Positive? | A Priori? |
|---|---|---|
| MASR (Tully–Fisher) | ||
| Property 2.1. Normalization | Yes | No |
| Property 2.1. Slope | Yes | No |
| Property 2.1. Mass & Asymptotic Speed | Yes | Yes |
| Property 2.1. Surface Brightness Independence | Yes | Yes |
| Rotation Curves | ||
| Property 2.2. Flat Rotation Curves | Yes | No |
| Property 2.2. Acceleration Discrepancy | Yes | Yes |
| Property 2.2. Rotation Curve Shapes | Yes | Yes |
| Property 2.2. Surface Brightness & Density | Yes | Yes |
| Property 2.2. Detailed Fits | Yes | No |
| Property 2.2. Stellar Population | Yes | — |
| Property 2.2. Feature Correspondence | Yes | — |
| Disk Stability | ||
| Property 2.3. Freeman Limit | Yes | No |
| Property 2.3. Vertical Velocity Dispersions | ? | No |
| Property 2.3. LSB Galaxy Morphology | Yes | Yes |
In most cases, the MOND-predicted properties in Table 1 are obvious in the data with no fitting whatsoever. For example, of the four properties of the MASR, only its normalization must be fit. Once the value of is specified, the slope is fixed, and is consistent with subsequently obtained data. That the MASR would be independent of surface brightness was also a genuine, and conventionally unexpected, a priori prediction. That the relation was fundamentally one between baryonic mass and was first anticipated by MOND.
In a similar manner, many of the predicted properties of rotation curves follow directly without recourse to fitting. This includes the amplitude of the acceleration discrepancy (Figure 2), the shapes of rotation curves (Figure 3), and the dependence of acceleration on surface brightness (Figure 4). The predictions of MOND can be seen directly in the data.
In order to make detailed rotation curve fits, we must treat the stellar mass-to-light ratio as a fit parameter. This one degree of freedom is unavoidable in any theory. MOND fits work well with a single, universal value of Sanders (1996); Sanders and Verheijen (1998); Li et al. (2018). The value of is not allowed to vary from galaxy to galaxy, and there is no indication777The literature contains contradictory statements on this point Rodrigues et al. (2018), but these usually stem from holding MOND to a higher standard than dark matter. Galaxies that have bad fits in MOND also have bad dark matter fits (in terms of Li et al. (2020)). This is a sign that the uncertainties have been underestimated, not that must vary or that all conceivable models are wrong. in the data of a need to do so Li et al. (2018). An independent test of the best-fit values of is provided by stellar population synthesis models. The agreement with these the two could hardly be better (Figure 7).
When the cold dark matter paradigm became widely accepted, the only properties in Table 1 that had seriously informed its development was that rotation curves are flat and the Oort discrepancy exists. These were taken to mean that there had to be dark matter, and little more. The Tully–Fisher relation was known at the time, but was widely viewed as a method to determine distances, not inform theory. The remaining elements of Table 1 were essentially unknown, or, in the case of Freeman’s Law, widely misinterpreted. It is not obvious that we would develop the same paradigm had we known then what we know now.
4 Conclusions
Many predictions of MOND have been corroborated over the years. It has repeatedly met the gold standard of the scientific method in which predictions are made in advance of their observation. The dark matter paradigm does not share a comparable record of predictive success in galaxy dynamics.
There are three broad categories of interpretation admitted by the data discussed here.
-
1.
The data corroborate the predictions of MOND because there is something to it.
-
2.
The physics of galaxy formation somehow mimic MOND, at least for rotating galaxies.
-
3.
There is something new and different going on that we have yet to imagine.
These are essentially identical to the possibilities discussed over 20 years ago McGaugh and de Blok (1998b), with the addition of (3), which is sufficiently vague to always be a logical possibility. There has been some progress in this direction, with hypotheses for dark fluids Zhao and Li (2010), or bipolar Blanchet (2007) or superfluid Berezhiani and Khoury (2015) dark matter with built-in MOND-like behavior while retaining the putative successes of CDM on large scales. There remains a great deal to be explored in this direction.
Nevertheless, the obvious interpretation of the data discussed here is (1): MOND gets all these predictions correct, in advance of their observation, because there is something to it. This motivates the search for a satisfactory theory that encompasses both general relativity and MOND. Some progress has been made along these lines Bekenstein (2004); Milgrom (2009); Famaey and McGaugh (2012); Milgrom (2014); Clifton et al. (2012); Skordis and Złośnik (2019); Hernandez et al. (2019), but overall, shockingly little effort has been made to investigate in this possibility.
In contrast, an enormous amount of effort has been invested in (2), a thorough discussion of which is well beyond the scope of this review. However, the basic problem is simple: MOND has made many successful, a priori predictions that dark matter did not. We are obliged to adjust our dark matter models to accommodate the successful predictions of a contrary theory.
There remains a considerable amount that we do not understand about the universe, including whether the invisible particles hypothesized to dominate its mass budget actually exist.
"The normal component (i.e., the accepted paradigm and its adherents) is large and well entrenched. Hence, a change of the normal component is very noticeable. So is the resistance of the normal component to change. This resistance becomes especially strong and noticeable in periods where a change seems to be imminent."
—P. Feyerabend Feyerabend (1985)
This research has been supported in part by NSF grant PHY-1911909 and NASA grant 80NSSC19K0570.
Acknowledgements.
The author is grateful to many colleagues for critical conversations over the years; in particular, Greg Bothun, Jim Schombert, Doug Richstone, Joel Bregman, Jim Peebles, Houjun Mo, Simon White, Donald Lynden-Bell, Chris Mihos, Thijs van der Hulst, Renzo Sancisi, Erwin de Blok, Bob Sanders, Vera Rubin, Moti Milgrom, Jerry Sellwood, David Merritt, Arthur Kosowsky, James Binney, Frank van den Bosch, Roelof de Jong, Eric Bell, Rachel Kuzio de Naray, Benoit Famaey, Pavel Kroupa, Marcel Pawlowski, Federico Lelli, Hongsheng Zhao, and Xavier Hernandez. \conflictsofinterestThe author declares no conflict of interest. \abbreviationsThe following abbreviations are used in this manuscript:| BTFR | Baryonic Tully–Fisher relation |
| CDM | Cold dark matter |
| HSB | High surface brightness |
| IMF | Initial mass function |
| CDM | Lambda cold dark matter |
| LSB | Low surface brightness |
| MASR | Mass–asymptotic speed relationn |
| MOND | Modified Newtonian dynamics |
References
- Faber and Gallagher (1979) Faber, S.M.; Gallagher, J.S. Masses and mass-to-light ratios of galaxies. Ann. Rev. Astron. Astrophys. 1979, 17, 135–187, doi:10.1146/annurev.aa.17.090179.001031.
- Trimble (1987) Trimble, V. Existence and nature of dark matter in the universe. Ann. Rev. Astron. Astrophys. 1987, 25, 425–472, doi:10.1146/annurev.aa.25.090187.002233.
- Ostriker (1993) Ostriker, J.P. Astronomical tests of the cold dark matter scenario. Ann. Rev. Astron. Astrophys. 1993, 31, 689–716, doi:10.1146/annurev.aa.31.090193.003353.
- McGaugh and de Blok (1998a) McGaugh, S.S.; de Blok, W.J.G. Testing the Dark Matter Hypothesis with Low Surface Brightness Galaxies and Other Evidence. Astrophys. J. 1998, 499, 41.
- McGaugh and de Blok (1998b) McGaugh, S.S.; de Blok, W.J.G. Testing the Hypothesis of Modified Dynamics with Low Surface Brightness Galaxies and Other Evidence. Astrophys. J. 1998, 499, 66.
- Sanders and McGaugh (2002) Sanders, R.H.; McGaugh, S.S. Modified Newtonian Dynamics as an Alternative to Dark Matter. Ann. Rev. Astron. Astrophys. 2002, 40, 263–317. doi:10.1146/annurev.astro.40.060401.093923.
- Feyerabend (1985) Feyerabend, P. Problems of Empiricism; Cambridge University Press: Cambridge, UK, 1985.
- Peebles (1984) Peebles, P.J.E. Dark matter and the origin of galaxies and globular star clusters. Astrophys. J. 1984, 277, 470–477, doi:10.1086/161714.
- Steigman and Turner (1985) Steigman, G.; Turner, M.S. Cosmological constraints on the properties of weakly interacting massive particles. Nucl. Phys. B 1985, 253, 375–386, doi:10.1016/0550-3213(85)90537-1.
- Feng (2010) Feng, J.L. Dark Matter Candidates from Particle Physics and Methods of Detection. Ann. Rev. Astron. Astrophys. 2010, 48, 495–545. doi:10.1146/annurev-astro-082708-101659.
- Porter et al. (2011) Porter, T.A.; Johnson, R.P.; Graham, P.W. Dark Matter Searches with Astroparticle Data. Ann. Rev. Astron. Astrophys. 2011, 49, 155–194. doi:10.1146/annurev-astro-081710-102528.
- Aprile et al. (2018) Aprile, E.; et al. [Xenon Collaboration]. Dark Matter Search Results from a One Ton-Year Exposure of XENON1T. Phys. Rev. Lett. 2018, 121, 111302. doi:10.1103/PhysRevLett.121.111302.
- Trotta et al. (2008) Trotta, R.; Feroz, F.; Hobson, M.; Roszkowski, L.; Ruiz de Austri, R. The impact of priors and observables on parameter inferences in the constrained MSSM. J. High Energy Phys. 2008, 2008, 024. doi:10.1088/1126-6708/2008/12/024.
- Merritt (2017) Merritt, D. Cosmology and convention. Stud. Hist. Philos. Mod. Phys. 2017, 57, 41–52. doi:10.1016/j.shpsb.2016.12.002.
- Milgrom (1983a) Milgrom, M. A modification of the Newtonian dynamics as a possible alternative to the hidden mass hypothesis. Astrophys. J. 1983, 270, 365–370, doi:10.1086/161130.
- Milgrom (1983b) Milgrom, M. A modification of the Newtonian dynamics—Implications for galaxies. Astrophys. J. 1983, 270, 371–389, doi:10.1086/161131.
- Milgrom (1983c) Milgrom, M. A modification of the newtonian dynamics: Implications for galaxy systems. Astrophys. J. 1983, 270, 384–389, doi:10.1086/161132.
- Milgrom (1999) Milgrom, M. The modified dynamics—A status review. In Dark Matter in Astrophysics and Particle Physics; Klapdor-Kleingrothaus, H.V., Baudis, L., Eds.; Springer: Berlin, Germany, 1999; p. 443.
- Milgrom (2001) Milgrom, M. MOND—A Pedagogical Review. Acta Phys. Pol. B 2001, 32, 3613.
- Bekenstein (2006) Bekenstein, J. The modified Newtonian dynamics - MOND and its implications for new physics. Contemp. Phys. 2006, 47, 387–403. doi:10.1080/00107510701244055.
- Milgrom (2008) Milgrom, M. The MOND paradigm. arXiv 2008, arXiv:0801.3133.
- Famaey and McGaugh (2012) Famaey, B.; McGaugh, S.S. Modified Newtonian Dynamics (MOND): Observational Phenomenology and Relativistic Extensions. Living Rev. Relativ. 2012, 15, 10. doi:10.12942/lrr-2012-10.
- Milgrom (2014) Milgrom, M. The MOND paradigm of modified dynamics. Scholarpedia 2014, 9, 31410, doi:\changeurlcolorblack10.4249/scholarpedia.31410.
- McGaugh (2015) McGaugh, S.S. A tale of two paradigms: The mutual incommensurability of CDM and MOND. Can. J. Phys. 2015, 93, 250–259. doi:10.1139/cjp-2014-0203.
- Sanders (1990) Sanders, R.H. Mass discrepancies in galaxies: Dark matter and alternatives. A&Ar 1990, 2, 1–28, doi:10.1007/BF00873540.
- Sanders (1996) Sanders, R.H. The Published Extended Rotation Curves of Spiral Galaxies: Confrontation with Modified Dynamics. Astrophys. J. 1996, 473, 117. doi:10.1086/178131.
- McGaugh (2006) McGaugh, S.S. Observational Constraints on the Acceleration Discrepancy Problem. arXiv 2006, arXiv:astro-ph/0606351.
- McGaugh et al. (2019) McGaugh, S.S.; Lelli, F.; Li, P.; Schombert, J. Dynamical Regularities in Galaxies. arXiv 2019, arXiv:1909.02011.
- Lelli et al. (2016) Lelli, F.; McGaugh, S.S.; Schombert, J.M. SPARC: Mass Models for 175 Disk Galaxies with Spitzer Photometry and Accurate Rotation Curves. Astron. J. 2016, 152, 157. doi:10.3847/0004-6256/152/6/157.
- Will (2014) Will, C.M. The Confrontation between General Relativity and Experiment. Living Rev. Relativ. 2014, 17, 4. doi:10.12942/lrr-2014-4.
- Hulse and Taylor (1975) Hulse, R.A.; Taylor, J.H. Discovery of a pulsar in a binary system. Astrophys. J. 1975, 195, L51–L53, doi:10.1086/181708.
- Abbott et al. (2016) Abbott, B.P.; et al. [Virgo Collaboration]. Observation of Gravitational Waves from a Binary Black Hole Merger. Phys. Rev. Lett. 2016, 116, 061102. doi:10.1103/PhysRevLett.116.061102.
- Begeman et al. (1991) Begeman, K.G.; Broeils, A.H.; Sanders, R.H. Extended rotation curves of spiral galaxies - Dark haloes and modified dynamics. Mon. Not. R. Astron. Soc. 1991, 249, 523–537.
- McGaugh et al. (2016) McGaugh, S.S.; Lelli, F.; Schombert, J.M. Radial Acceleration Relation in Rotationally Supported Galaxies. Phys. Rev. Lett. 2016, 117, 201101. doi:10.1103/PhysRevLett.117.201101.
- Milgrom (2009) Milgrom, M. The Mond Limit from Spacetime Scale Invariance. Astrophys. J. 2009, 698, 1630–1638. doi:10.1088/0004-637X/698/2/1630.
- Tully and Fisher (1977) Tully, R.B.; Fisher, J.R. A new method of determining distances to galaxies. Astron. Astrophys. 1977, 54, 661–673.
- Lelli et al. (2019) Lelli, F.; McGaugh, S.S.; Schombert, J.M.; Desmond, H.; Katz, H. The baryonic Tully-Fisher relation for different velocity definitions and implications for galaxy angular momentum. Mon. Not. R. Astron. Soc. 2019, 484, 3267–3278. doi:10.1093/mnras/stz205.
- Lelli et al. (2017) Lelli, F.; McGaugh, S.S.; Schombert, J.M.; Pawlowski, M.S. One Law to Rule Them All: The Radial Acceleration Relation of Galaxies. Astrophys. J. 2017, 836, 152. doi:10.3847/1538-4357/836/2/152.
- Ogle et al. (2019) Ogle, P.M.; Jarrett, T.; Lanz, L.; Cluver, M.; Alatalo, K.; Appleton, P.N.; Mazzarella, J.M. A Break in Spiral Galaxy Scaling Relations at the Upper Limit of Galaxy Mass. Astrophys. J. 2019, 884, L11. doi:10.3847/2041-8213/ab459e.
- Noordermeer et al. (2007) Noordermeer, E.; van der Hulst, J.M.; Sancisi, R.; Swaters, R.S.; van Albada, T.S. The mass distribution in early-type disc galaxies: Declining rotation curves and correlations with optical properties. Mon. Not. R. Astron. Soc. 2007, 376, 1513–1546. doi:10.1111/j.1365-2966.2007.11533.x.
- Noordermeer and Verheijen (2007) Noordermeer, E.; Verheijen, M.A.W. The high-mass end of the Tully-Fisher relation. Mon. Not. R. Astron. Soc. 2007, 381, 1463–1472. doi:10.1111/j.1365-2966.2007.12369.x.
- Lelli et al. (2016) Lelli, F.; McGaugh, S.S.; Schombert, J.M. The Small Scatter of the Baryonic Tully-Fisher Relation. Astrophys. J. 2016, 816, L14. doi:10.3847/2041-8205/816/1/L14.
- Binney and Tremaine (1987) Binney, J.; Tremaine, S. Galactic Dynamics; Princeton University Press: Princeton, NJ, USA, 1987.
- McGaugh (2005) McGaugh, S.S. The Baryonic Tully-Fisher Relation of Galaxies with Extended Rotation Curves and the Stellar Mass of Rotating Galaxies. Astrophys. J. 2005, 632, 859–871, doi:10.1086/432968.
- Lelli et al. (2016) Lelli, F.; McGaugh, S.S.; Schombert, J.M.; Pawlowski, M.S. The Relation between Stellar and Dynamical Surface Densities in the Central Regions of Disk Galaxies. Astrophys. J. 2016, 827, L19. doi:10.3847/2041-8205/827/1/L19.
- McGaugh et al. (2000) McGaugh, S.S.; Schombert, J.M.; Bothun, G.D.; de Blok, W.J.G. The Baryonic Tully-Fisher Relation. Astrophys. J. 2000, 533, L99–L102. doi:10.1086/312628.
- Schombert and McGaugh (2014) Schombert, J.; McGaugh, S. Stellar Populations and the Star Formation Histories of LSB Galaxies: III. Stellar Population Models. Publ. Astron. Soc. Aust. 2014, 31, e036. doi:10.1017/pasa.2014.32.
- McGaugh and Schombert (2014) McGaugh, S.S.; Schombert, J.M. Color-Mass-to-light-ratio Relations for Disk Galaxies. Astron. J. 2014, 148, 77. doi:10.1088/0004-6256/148/5/77.
- Schombert and McGaugh (2014) Schombert, J.M.; McGaugh, S. Stellar Populations and the Star Formation Histories of LSB Galaxies: IV Spitzer Surface Photometry of LSB Galaxies. Publ. Astron. Soc. Aust. 2014, 31, e011. doi:10.1017/pasa.2014.2.
- McGaugh et al. (2020) McGaugh, S.S.; Lelli, F.; Schombert, J.M. Scaling Relations for Molecular Gas and Metallicity: Impact on the Baryonic Tully-Fisher Relation. Res. Notes Am. Astron. Soc. 2020, 4, 45, doi:10.3847/2515-5172/ab8471.
- Verheijen (2001) Verheijen, M.A.W. The Ursa Major Cluster of Galaxies. V. H I Rotation Curve Shapes and the Tully-Fisher Relations. Astrophys. J. 2001, 563, 694–715.
- Stark et al. (2009) Stark, D.V.; McGaugh, S.S.; Swaters, R.A. A First Attempt to Calibrate the Baryonic Tully-Fisher Relation with Gas-Dominated Galaxies. Astron. J. 2009, 138, 392–401, doi:10.1088/0004-6256/138/2/392.
- Trachternach et al. (2009) Trachternach, C.; de Blok, W.J.G.; McGaugh, S.S.; van der Hulst, J.M.; Dettmar, R. The baryonic Tully-Fisher relation and its implication for dark matter halos. Astron. Astrophys. 2009, 505, 577–587. doi:10.1051/0004-6361/200811136.
- McGaugh (2011) McGaugh, S.S. Novel Test of Modified Newtonian Dynamics with Gas Rich Galaxies. Phys. Rev. Lett. 2011, 106, 121303. doi:10.1103/PhysRevLett.106.121303.
- McGaugh (2012) McGaugh, S.S. The Baryonic Tully-Fisher Relation of Gas-rich Galaxies as a Test of CDM and MOND. Astron. J. 2012, 143, 40. doi:10.1088/0004-6256/143/2/40.
- Steinmetz and Navarro (1999) Steinmetz, M.; Navarro, J.F. The Cosmological Origin of the Tully-Fisher Relation. Astrophys. J. 1999, 513, 555–560.
- Navarro and Steinmetz (2000) Navarro, J.F.; Steinmetz, M. The Core Density of Dark Matter Halos: A Critical Challenge to the CDM Paradigm? Astrophys. J. 2000, 528, 607–611. doi:10.1086/308225.
- Mayer and Moore (2004) Mayer, L.; Moore, B. The baryonic mass-velocity relation: Clues to feedback processes during structure formation and the cosmic baryon inventory. Mon. Not. R. Astron. Soc. 2004, 354, 477–484.
- McGaugh et al. (2010) McGaugh, S.S.; Schombert, J.M.; de Blok, W.J.G.; Zagursky, M.J. The Baryon Content of Cosmic Structures. Astrophys. J. 2010, 708, L14–L17. doi:10.1088/2041-8205/708/1/L14.
- Draine (2011) Draine, B.T. Physics of the Interstellar and Intergalactic Medium; Princeton University Press: Princeton, NJ, USA, 2011.
- Meidt et al. (2014) Meidt, S.E.; Schinnerer, E.; van de Ven, G.; Zaritsky, D.; Peletier, R.; Knapen, J.H.; Sheth, K.; Regan, M.; Querejeta, M.; Muñoz-Mateos, J.C.; et al. Reconstructing the Stellar Mass Distributions of Galaxies Using S4G IRAC 3.6 and 4.5 m Images. II. The Conversion from Light to Mass. Astrophys. J. 2014, 788, 144. doi:10.1088/0004-637X/788/2/144.
- Schombert et al. (2019) Schombert, J.; McGaugh, S.; Lelli, F. The mass-to-light ratios and the star formation histories of disc galaxies. Mon. Not. R. Astron. Soc. 2019, 483, 1496–1512. doi:10.1093/mnras/sty3223.
- McGaugh et al. (1995) McGaugh, S.S.; Bothun, G.D.; Schombert, J.M. Galaxy Selection and the Surface Brightness Distribution. Astron. J. 1995, 110, 573. doi:10.1086/117543.
- Akritas and Bershady (1996) Akritas, M.G.; Bershady, M.A. Linear Regression for Astronomical Data with Measurement Errors and Intrinsic Scatter. Astrophys. J. 1996, 470, 706. doi:10.1086/177901.
- Begum et al. (2008) Begum, A.; Chengalur, J.N.; Karachentsev, I.D.; Sharina, M.E. Baryonic Tully-Fisher relation for extremely low mass Galaxies. Mon. Not. R. Astron. Soc. 2008, 386, 138–144. doi:10.1111/j.1365-2966.2008.13010.x.
- McGaugh and Schombert (2015) McGaugh, S.S.; Schombert, J.M. Weighing Galaxy Disks With the Baryonic Tully-Fisher Relation. Astrophys. J. 2015, 802, 18. doi:10.1088/0004-637X/802/1/18.
- Aaronson et al. (1979) Aaronson, M.; Huchra, J.; Mould, J. The infrared luminosity/H I velocity-width relation and its application to the distance scale. Astrophys. J. 1979, 229, 1–13, doi:10.1086/156923.
- McGaugh and Wolf (2010) McGaugh, S.S.; Wolf, J. Local Group Dwarf Spheroidals: Correlated Deviations from the Baryonic Tully-Fisher Relation. Astrophys. J. 2010, 722, 248–261. doi:10.1088/0004-637X/722/1/248.
- Mo et al. (1998) Mo, H.J.; Mao, S.; White, S.D.M. The formation of galactic discs. Mon. Not. R. Astron. Soc. 1998, 295, 319–336. doi:10.1046/j.1365-8711.1998.01227.x.
- Bullock et al. (2001) Bullock, J.S.; Kolatt, T.S.; Sigad, Y.; Somerville, R.S.; Kravtsov, A.V.; Klypin, A.A.; Primack, J.R.; Dekel, A. Profiles of dark haloes: Evolution, scatter and environment. Mon. Not. R. Astron. Soc. 2001, 321, 559–575. doi:10.1046/j.1365-8711.2001.04068.x.
- Gnedin et al. (2007) Gnedin, O.Y.; Weinberg, D.H.; Pizagno, J.; Prada, F.; Rix, H. Dark Matter Halos of Disk Galaxies: Constraints from the Tully-Fisher Relation. Astrophys. J. 2007, 671, 1115–1134. doi:10.1086/523256.
- Trujillo-Gomez et al. (2011) Trujillo-Gomez, S.; Klypin, A.; Primack, J.; Romanowsky, A.J. Galaxies in CDM with Halo Abundance Matching: Luminosity-Velocity Relation, Baryonic Mass-Velocity Relation, Velocity Function, and Clustering. Astrophys. J. 2011, 742, 16. doi:10.1088/0004-637X/742/1/16.
- Bullock and Boylan-Kolchin (2017) Bullock, J.S.; Boylan-Kolchin, M. Small-Scale Challenges to the CDM Paradigm. Ann. Rev. Astron. Astrophys. 2017, 55, 343–387. doi:10.1146/annurev-astro-091916-055313.
- van den Bosch (2000) van den Bosch, F.C. Semianalytical Models for the Formation of Disk Galaxies. I. Constraints from the Tully-Fisher Relation. Astrophys. J. 2000, 530, 177–192. doi:10.1086/308337.
- Sanders (2019) Sanders, R.H. Dark matter – Modified dynamics: Reaction vs. Prediction. arXiv 2019, arXiv:1912.00716.
- Zwaan et al. (1995) Zwaan, M.A.; van der Hulst, J.M.; de Blok, W.J.G.; McGaugh, S.S. The Tully-Fisher relation for low surface brightness galaxies: implications for galaxy evolution. Mon. Not. R. Astron. Soc. 1995, 273, L35–L38.
- Sprayberry et al. (1995) Sprayberry, D.; Bernstein, G.M.; Impey, C.D.; Bothun, G.D. The mass-to-light ratios of low surface brightness spiral galaxies: Clues from the Tully-Fisher relation. Astrophys. J. 1995, 438, 72–82, doi:10.1086/175055.
- Hoffman et al. (1996) Hoffman, G.L.; Salpeter, E.E.; Farhat, B.; Roos, T.; Williams, H.; Helou, G. Arecibo H i Mapping of a Large Sample of Dwarf Irregular Galaxies. Astrophys. J. Suppl. 1996, 105, 269. doi:10.1086/192314.
- Freeman (1970) Freeman, K.C. On the Disks of Spiral and S0 Galaxies. Astrophys. J. 1970, 160, 811, doi:10.1086/150474.
- Courteau and Rix (1999) Courteau, S.; Rix, H. Maximal Disks and the Tully-Fisher Relation. Astrophys. J. 1999, 513, 561–571, doi:10.1086/306872.
- de Blok and McGaugh (1996) de Blok, W.J.G.; McGaugh, S.S. Does Low Surface Brightness Mean Low Density? Astrophys. J. 1996, 469, L89. doi:10.1086/310266.
- Tully and Verheijen (1997) Tully, R.B.; Verheijen, M.A.W. The Ursa Major Cluster of Galaxies. II. Bimodality of the Distribution of Central Surface Brightnesses. Astrophys. J. 1997, 484, 145. doi:10.1086/304318.
- McGaugh (2005) McGaugh, S.S. Balance of Dark and Luminous Mass in Rotating Galaxies. Phys. Rev. Lett. 2005, 95, 171302. doi:10.1103/PhysRevLett.95.171302.
- Starkman et al. (2018) Starkman, N.; Lelli, F.; McGaugh, S.; Schombert, J. A new algorithm to quantify maximum discs in galaxies. Mon. Not. R. Astron. Soc. 2018, 480, 2292–2301. doi:10.1093/mnras/sty2011.
- Swaters et al. (2009) Swaters, R.A.; Sancisi, R.; van Albada, T.S.; van der Hulst, J.M. The rotation curves shapes of late-type dwarf galaxies. Astron. Astrophys. 2009, 493, 871–892. doi:10.1051/0004-6361:200810516.
- Swaters et al. (2012) Swaters, R.A.; Sancisi, R.; van der Hulst, J.M.; van Albada, T.S. The link between the baryonic mass distribution and the rotation curve shape. Mon. Not. R. Astron. Soc. 2012, 425, 2299–2308. doi:10.1111/j.1365-2966.2012.21599.x.
- Lelli et al. (2013) Lelli, F.; Fraternali, F.; Verheijen, M. A scaling relation for disc galaxies: Circular-velocity gradient versus central surface brightness. Mon. Not. R. Astron. Soc. 2013, 433, L30–L34. doi:10.1093/mnrasl/slt053.
- Oman et al. (2015) Oman, K.A.; Navarro, J.F.; Fattahi, A.; Frenk, C.S.; Sawala, T.; White, S.D.M.; Bower, R.; Crain, R.A.; Furlong, M.; Schaller, M.; Schaye, J.; Theuns, T. The unexpected diversity of dwarf galaxy rotation curves. Mon. Not. R. Astron. Soc. 2015, 452, 3650–3665. doi:10.1093/mnras/stv1504.
- Rubin et al. (1978) Rubin, V.C.; Thonnard, N.; Ford, Jr., W.K. Extended rotation curves of high-luminosity spiral galaxies. IV—Systematic dynamical properties, SA through SC. Astrophys. J. 1978, 225, L107–L111, doi:10.1086/182804.
- Bosma (1981) Bosma, A. 21-cm line studies of spiral galaxies. II—The distribution and kinematics of neutral hydrogen in spiral galaxies of various morphological types. Astron. J. 1981, 86, 1825–1846, doi:10.1086/113063.
- de Blok et al. (2008) de Blok, W.J.G.; Walter, F.; Brinks, E.; Trachternach, C.; Oh, S.H.; Kennicutt, R.C. High-Resolution Rotation Curves and Galaxy Mass Models from THINGS. Astron. J. 2008, 136, 2648–2719, doi:10.1088/0004-6256/136/6/2648.
- Brouwer et al. (2017) Brouwer, M.M.; Visser, M.R.; Dvornik, A.; Hoekstra, H.; Kuijken, K.; Valentijn, E.A.; Bilicki, M.; Blake, C.; Brough, S.; Buddelmeijer, H.; et al. First test of Verlinde’s theory of emergent gravity using weak gravitational lensing measurements. Mon. Not. R. Astron. Soc. 2017, 466, 2547–2559. doi:10.1093/mnras/stw3192.
- Kent (1987) Kent, S.M. Dark Matter in Spiral Galaxies. II. Galaxies with H I Rotation Curves. Astron. J. 1987, 93, 816, doi:10.1086/114366.
- Li et al. (2020) Li, P.; Lelli, F.; McGaugh, S.; Schombert, J. A comprehensive catalog of dark matter halo models for SPARC galaxies. arXiv 2020, arXiv:2001.10538.
- Sellwood and McGaugh (2005) Sellwood, J.A.; McGaugh, S.S. The Compression of Dark Matter Halos by Baryonic Infall. Astrophys. J. 2005, 634, 70–76. doi:10.1086/491731.
- Disney et al. (2008) Disney, M.J.; Romano, J.D.; Garcia-Appadoo, D.A.; West, A.A.; Dalcanton, J.J.; Cortese, L. Galaxies appear simpler than expected. Nature 2008, 455, 1082–1084. doi:10.1038/nature07366.
- Dubinski et al. (1999) Dubinski, J.; Mihos, J.C.; Hernquist, L. Constraining Dark Halo Potentials with Tidal Tails. Astrophys. J. 1999, 526, 607–622. doi:10.1086/308024.
- McGaugh (1999) McGaugh, S.S. How Galaxies Don’t Form: The Effective Force Law in Disk Galaxies. In Galaxy Dynamics—A Rutgers Symposium; Merritt, D.R., Valluri, M., Sellwood, J.A., Eds.; Astronomical Society of the Pacific Conference Series; Astronomical Society of the Pacific: San Francisco, CA, USA, 1999; Volume 182, p. 528.
- McGaugh (2004) McGaugh, S.S. The Mass Discrepancy-Acceleration Relation: Disk Mass and the Dark Matter Distribution. Astrophys. J. 2004, 609, 652–666. doi:10.1086/421338.
- Bekenstein (1990) Bekenstein, J.D. Non-Newtonian gravitation and causality. In Developments in General Relativity, Astrophysics and Quantum Theory; Institute of Physics Publishing: Bristol, UK, 1990, pp. 155–174.
- McGaugh (2014) McGaugh, S. The Third Law of Galactic Rotation. Galaxies 2014, 2, 601–622. doi:10.3390/galaxies2040601.
- de Blok and McGaugh (1997) de Blok, W.J.G.; McGaugh, S.S. The dark and visible matter content of low surface brightness disc galaxies. Mon. Not. R. Astron. Soc. 1997, 290, 533–552. doi:10.1093/mnras/290.3.533.
- de Blok and McGaugh (1998) de Blok, W.J.G.; McGaugh, S.S. Testing Modified Newtonian Dynamics with Low Surface Brightness Galaxies: Rotation Curve FITS. Astrophys. J. 1998, 508, 132–140. doi:10.1086/306390.
- Fall and Efstathiou (1980) Fall, S.M.; Efstathiou, G. Formation and rotation of disc galaxies with haloes. Mon. Not. R. Astron. Soc. 1980, 193, 189–206, doi:10.1093/mnras/193.2.189.
- Navarro et al. (1997) Navarro, J.F.; Frenk, C.S.; White, S.D.M. A Universal Density Profile from Hierarchical Clustering. Astrophys. J. 1997, 490, 493–508, doi:10.1086/304888.
- Scannapieco et al. (2012) Scannapieco, C.; Wadepuhl, M.; Parry, O.H.; Navarro, J.F.; Jenkins, A.; Springel, V.; Teyssier, R.; Carlson, E.; Couchman, H.M.P.; Crain, R.A.; et al. The Aquila comparison project: The effects of feedback and numerical methods on simulations of galaxy formation. Mon. Not. R. Astron. Soc. 2012, 423, 1726–1749. doi:10.1111/j.1365-2966.2012.20993.x.
- Milgrom (2010) Milgrom, M. Quasi-linear formulation of MOND. Mon. Not. R. Astron. Soc. 2010, 403, 886–895. doi:10.1111/j.1365-2966.2009.16184.x.
- Milgrom and Sanders (2008) Milgrom, M.; Sanders, R.H. Rings and Shells of “Dark Matter” as MOND Artifacts. Astrophys. J. 2008, 678, 131–143. doi:10.1086/529119.
- McGaugh (2008) McGaugh, S.S. Milky Way Mass Models and MOND. Astrophys. J. 2008, 683, 137–148. doi:10.1086/589148.
- Famaey and Binney (2005) Famaey, B.; Binney, J. Modified Newtonian dynamics in the Milky Way. Mon. Not. R. Astron. Soc. 2005, 363, 603–608. doi:10.1111/j.1365-2966.2005.09474.x.
- Hees et al. (2016) Hees, A.; Famaey, B.; Angus, G.W.; Gentile, G. Combined Solar system and rotation curve constraints on MOND. Mon. Not. R. Astron. Soc. 2016, 455, 449–461. doi:10.1093/mnras/stv2330.
- Li et al. (2018) Li, P.; Lelli, F.; McGaugh, S.; Schombert, J. Fitting the radial acceleration relation to individual SPARC galaxies. Astron. Astrophys. 2018, 615, A3. doi:10.1051/0004-6361/201732547.
- Sanders and Verheijen (1998) Sanders, R.H.; Verheijen, M.A.W. Rotation Curves of Ursa Major Galaxies in the Context of Modified Newtonian Dynamics. Astrophys. J. 1998, 503, 97–108. doi:10.1086/305986.
- Sanders (2019) Sanders, R.H. The prediction of rotation curves in gas-dominated dwarf galaxies with modified dynamics. Mon. Not. R. Astron. Soc. 2019, 485, 513–521. doi:10.1093/mnras/stz353.
- Swaters et al. (2010) Swaters, R.A.; Sanders, R.H.; McGaugh, S.S. Testing Modified Newtonian Dynamics with Rotation Curves of Dwarf and Low Surface Brightness Galaxies. Astrophys. J. 2010, 718, 380–391. doi:10.1088/0004-637X/718/1/380.
- Gentile et al. (2011) Gentile, G.; Famaey, B.; de Blok, W.J.G. THINGS about MOND. Astron. Astrophys. 2011, 527, A76. doi:10.1051/0004-6361/201015283.
- Bottema et al. (2002) Bottema, R.; Pestaña, J.L.G.; Rothberg, B.; Sand ers, R.H. MOND rotation curves for spiral galaxies with Cepheid-based distances. Astron. Astrophys. 2002, 393, 453–460. doi:10.1051/0004-6361:20021021.
- Dutton and Macciò (2014) Dutton, A.A.; Macciò, A.V. Cold dark matter haloes in the Planck era: Evolution of structural parameters for Einasto and NFW profiles. Mon. Not. R. Astron. Soc. 2014, 441, 3359–3374. doi:10.1093/mnras/stu742.
- Wechsler and Tinker (2018) Wechsler, R.H.; Tinker, J.L. The Connection Between Galaxies and Their Dark Matter Halos. Ann. Rev. Astron. Astrophys. 2018, 56, 435–487. doi:10.1146/annurev-astro-081817-051756.
- Bell and de Jong (2001) Bell, E.F.; de Jong, R.S. Stellar Mass-to-Light Ratios and the Tully-Fisher Relation. Astrophys. J. 2001, 550, 212–229. doi:10.1086/319728.
- Portinari et al. (2004) Portinari, L.; Sommer-Larsen, J.; Tantalo, R. On the mass-to-light ratio and the initial mass function in disc galaxies. Mon. Not. R. Astron. Soc. 2004, 347, 691–719, doi:10.1111/j.1365-2966.2004.07207.x.
- Sancisi (2004) Sancisi, R. The visible matter—Dark matter coupling. In Dark Matter in Galaxies; Ryder, S., Pisano, D., Walker, M., Freeman, K., Eds.; IAU Symposium; Cambridge University Press: Cambridge, UK, 2004; Volume 220, p. 233.
- van Albada and Sancisi (1986) van Albada, T.S.; Sancisi, R. Dark Matter in Spiral Galaxies. Philos. Trans. R. Soc. Lond. Ser. A 1986, 320, 447–464, doi:10.1098/rsta.1986.0128.
- Sellwood (1999) Sellwood, J.A. Dynamical Constraints on Disk Masses. In Galaxy Dynamics—A Rutgers Symposium; Merritt, D.R., Valluri, M., Sellwood, J.A., Eds.; Astronomical Society of the Pacific Conference Series; Astronomical Society of the Pacific: San Francisco, CA, USA, 1999; Volume 182.
- Palunas and Williams (2000) Palunas, P.; Williams, T.B. Maximum Disk Mass Models for Spiral Galaxies. Astron. J. 2000, 120, 2884–2903. doi:10.1086/316878.
- Freeman (2010) Freeman, K.C. Dark Matter from the Observational Perspective. In American Institute of Physics Conference Series; Debattista, V.P., Popescu, C.C., Eds.; AIP Publishing: Melville, NY, USA, 2010; Volume 1240, pp. 309–318, doi:10.1063/1.3458522.
- Verheijen and de Blok (1999) Verheijen, M.; de Blok, E. The HSB/LSB Galaxies NGC 2403 and UGC 128. Ap&SS 1999, 269, 673–674, doi:10.1023/A:1017015229229.
- Gentile et al. (2010) Gentile, G.; Baes, M.; Famaey, B.; van Acoleyen, K. Mass models from high-resolution HI data of the dwarf galaxy NGC 1560. Mon. Not. R. Astron. Soc. 2010, 406, 2493–2503. doi:10.1111/j.1365-2966.2010.16838.x.
- Tully et al. (2009) Tully, R.B.; Rizzi, L.; Shaya, E.J.; Courtois, H.M.; Makarov, D.I.; Jacobs, B.A. The Extragalactic Distance Database. Astron. J. 2009, 138, 323–331, doi:10.1088/0004-6256/138/2/323.
- Jacobs et al. (2009) Jacobs, B.A.; Rizzi, L.; Tully, R.B.; Shaya, E.J.; Makarov, D.I.; Makarova, L. The Extragalactic Distance Database: Color-Magnitude Diagrams. Astron. J. 2009, 138, 332–337. doi:10.1088/0004-6256/138/2/332.
- Ren et al. (2019) Ren, T.; Kwa, A.; Kaplinghat, M.; Yu, H.B. Reconciling the Diversity and Uniformity of Galactic Rotation Curves with Self-Interacting Dark Matter. PRX 2019, 9, 031020. doi:10.1103/PhysRevX.9.031020.
- Ostriker and Peebles (1973) Ostriker, J.P.; Peebles, P.J.E. A Numerical Study of the Stability of Flattened Galaxies: Or, can Cold Galaxies Survive? Astrophys. J. 1973, 186, 467–480, doi:10.1086/152513.
- Sellwood (2014) Sellwood, J.A. Secular evolution in disk galaxies. Rev. Mod. Phys. 2014, 86, 1–46. doi:10.1103/RevModPhys.86.1.
- Sellwood (2016) Sellwood, J.A. Bar Instability in Disk-Halo Systems. Astrophys. J. 2016, 819, 92. doi:10.3847/0004-637X/819/2/92.
- Sellwood et al. (2019) Sellwood, J.A.; Shen, J.; Li, Z. The global stability of M33: Still a puzzle. Mon. Not. R. Astron. Soc. 2019, 486, 4710–4723. doi:10.1093/mnras/stz1145.
- Disney (1976) Disney, M.J. Visibility of galaxies. Nature 1976, 263, 573–575, doi:10.1038/263573a0.
- Allen and Shu (1979) Allen, R.J.; Shu, F.H. The extrapolated central surface brightness of galaxies. Astrophys. J. 1979, 227, 67–72, doi:10.1086/156705.
- Cross and Driver (2002) Cross, N.; Driver, S.P. The bivariate brightness function of galaxies and a demonstration of the impact of surface brightness selection effects on luminosity function estimations. Mon. Not. R. Astron. Soc. 2002, 329, 579–587. doi:10.1046/j.1365-8711.2002.05052.x.
- Milgrom (1989) Milgrom, M. On Stability of Galactic Disks in the Modified Dynamics and the Distribution of Their Mean Surface-Brightness. Astrophys. J. 1989, 338, 121, doi:10.1086/167184.
- Brada and Milgrom (1999) Brada, R.; Milgrom, M. Stability of Disk Galaxies in the Modified Dynamics. Astrophys. J. 1999, 519, 590–598. doi:10.1086/307402.
- Tiret and Combes (2008) Tiret, O.; Combes, F. Evolution of spiral galaxies in modified gravity. II. Gas dynamics. Astron. Astrophys. 2008, 483, 719–726. doi:10.1051/0004-6361:200809357.
- Jiménez and Hernandez (2014) Jiménez, M.A.; Hernandez, X. Disk stability under MONDian gravity. arXiv 2014, arXiv:1406.0537.
- Thies et al. (2016) Thies, I.; Kroupa, P.; Famaey, B. Simulating disk galaxies and interactions in Milgromian dynamics. arXiv 2016, arXiv:1606.04942.
- Sánchez-Salcedo et al. (2016) Sánchez-Salcedo, F.J.; Martínez-Gómez, E.; Aguirre-Torres, V.M.; Hernández-Toledo, H.M. Low-mass disc galaxies and the issue of stability: MOND versus dark matter. Mon. Not. R. Astron. Soc. 2016, 462, 3918–3936. doi:10.1093/mnras/stw1911.
- Banik et al. (2018) Banik, I.; Milgrom, M.; Zhao, H. Toomre stability of disk galaxies in quasi-linear MOND. arXiv 2018, arXiv:1808.10545.
- Sellwood and Evans (2001) Sellwood, J.A.; Evans, N.W. The Stability of Disks in Cusped Potentials. Astrophys. J. 2001, 546, 176–188. doi:10.1086/318228.
- Dalcanton et al. (1997) Dalcanton, J.J.; Spergel, D.N.; Summers, F.J. The Formation of Disk Galaxies. Astrophys. J. 1997, 482, 659–676. doi:10.1086/304182.
- Oh et al. (2008) Oh, S.; de Blok, W.J.G.; Walter, F.; Brinks, E.; Kennicutt, R.C. High-Resolution Dark Matter Density Profiles of THINGS Dwarf Galaxies: Correcting for Noncircular Motions. Astron. J. 2008, 136, 2761–2781. doi:10.1088/0004-6256/136/6/2761.
- Martinsson et al. (2013) Martinsson, T.P.K.; Verheijen, M.A.W.; Westfall, K.B.; Bershady, M.A.; Andersen, D.R.; Swaters, R.A. The DiskMass Survey. VII. The distribution of luminous and dark matter in spiral galaxies. Astron. Astrophys. 2013, 557, A131. doi:10.1051/0004-6361/201321390.
- Bekenstein and Milgrom (1984) Bekenstein, J.; Milgrom, M. Does the missing mass problem signal the breakdown of Newtonian gravity? Astrophys. J. 1984, 286, 7–14, doi:10.1086/162570.
- Milgrom (1994) Milgrom, M. Dynamics with a Nonstandard Inertia-Acceleration Relation: An Alternative to Dark Matter in Galactic Systems. Ann. Phys. 1994, 229, 384–415. doi:10.1006/aphy.1994.1012.
- Milgrom (1999) Milgrom, M. The modified dynamics as a vacuum effect. Phys. Lett. A 1999, 253, 273–279. doi:10.1016/S0375-9601(99)00077-8.
- Milgrom (2014) Milgrom, M. MOND laws of galactic dynamics. Mon. Not. R. Astron. Soc. 2014, 437, 2531–2541. doi:10.1093/mnras/stt2066.
- Das et al. (2020) Das, M.; McGaugh, S.S.; Ianjamasimanana, R.; Schombert, J.; Dwarakanath, K.S. Tracing the Dynamical Mass in Galaxy Disks Using H i Velocity Dispersion and Its Implications for the Dark Matter Distribution in Galaxies. Astrophys. J. 2020, 889, 10. doi:10.3847/1538-4357/ab5fcd.
- Sanders (2003) Sanders, R.H. Clusters of galaxies with modified Newtonian dynamics. Mon. Not. R. Astron. Soc. 2003, 342, 901–908. doi:10.1046/j.1365-8711.2003.06596.x.
- Sanders (2007) Sanders, R.H. Neutrinos as cluster dark matter. Mon. Not. R. Astron. Soc. 2007, 380, 331–338. doi:10.1111/j.1365-2966.2007.12073.x.
- Angus et al. (2008) Angus, G.W.; Famaey, B.; Buote, D.A. X-ray group and cluster mass profiles in MOND: Unexplained mass on the group scale. Mon. Not. R. Astron. Soc. 2008, 387, 1470–1480. doi:10.1111/j.1365-2966.2008.13353.x.
- Tian et al. (2020) Tian, Y.; Umetsu, K.; Ko, C.M.; Donahue, M.; Chiu, I.N. The Radial Acceleration Relation in CLASH Galaxy Clusters. arXiv 2020, arXiv:2001.08340.
- McGaugh (2019) McGaugh, S.S. The Imprint of Spiral Arms on the Galactic Rotation Curve. Astrophys. J. 2019, 885, 87. doi:10.3847/1538-4357/ab479b.
- McGaugh (2016) McGaugh, S.S. The Surface Density Profile of the Galactic Disk from the Terminal Velocity Curve. Astrophys. J. 2016, 816, 42. doi:10.3847/0004-637X/816/1/42.
- Lisanti et al. (2018) Lisanti, M.; Moschella, M.; Outmezguine, N.J.; Slone, O. Testing Dark Matter and Modifications to Gravity using Local Milky Way Observables. arXiv 2018, arXiv:1812.08169.
- McGaugh (2018) McGaugh, S.S. A Precise Milky Way Rotation Curve Model for an Accurate Galactocentric Distance. Res. Notes Am. Astron. Soc. 2018, 2, 156. doi:10.3847/2515-5172/aadd4b.
- Bienaymé et al. (2014) Bienaymé, O.; Famaey, B.; Siebert, A.; Freeman, K.C.; Gibson, B.K.; Gilmore, G.; Grebel, E.K.; Bland-Hawthorn, J.; Kordopatis, G.; Munari, U.; et al. Weighing the local dark matter with RAVE red clump stars. Astron. Astrophys. 2014, 571, A92. doi:10.1051/0004-6361/201424478.
- Bershady et al. (2010) Bershady, M.A.; Verheijen, M.A.W.; Swaters, R.A.; Andersen, D.R.; Westfall, K.B.; Martinsson, T. The DiskMass Survey. I. Overview. Astrophys. J. 2010, 716, 198–233. doi:10.1088/0004-637X/716/1/198.
- Swaters et al. (2014) Swaters, R.A.; Bershady, M.A.; Martinsson, T.P.K.; Westfall, K.B.; Andersen, D.R.; Verheijen, M.A.W. The Link between Light and Mass in Late-type Spiral Galaxy Disks. Astrophys. J. 2014, 797, L28. doi:10.1088/2041-8205/797/2/L28.
- Angus et al. (2015) Angus, G.W.; Gentile, G.; Swaters, R.; Famaey, B.; Diaferio, A.; McGaugh, S.S.; Heyden, K.J.v.d. Mass models of disc galaxies from the DiskMass Survey in modified Newtonian dynamics. Mon. Not. R. Astron. Soc. 2015, 451, 3551–3580. doi:10.1093/mnras/stv1132.
- Milgrom (2015) Milgrom, M. Critical take on “Mass models of disk galaxies from the DiskMass Survey in MOND”. arXiv 2015, arXiv:1511.08087.
- Angus et al. (2016) Angus, G.W.; Gentile, G.; Famaey, B. Dynamical measurement of the stellar surface density of face-on galaxies. Astron. Astrophys. 2016, 585, A17. doi:10.1051/0004-6361/201527122.
- Aniyan et al. (2016) Aniyan, S.; Freeman, K.C.; Gerhard, O.E.; Arnaboldi, M.; Flynn, C. The influence of a kinematically cold young component on disc-halo decompositions in spiral galaxies: Insights from solar neighbourhood K-giants. Mon. Not. R. Astron. Soc. 2016, 456, 1484–1494. doi:10.1093/mnras/stv2730.
- Meurer et al. (1998) Meurer, G.R.; Staveley-Smith, L.; Killeen, N.E.B. HI and dark matter in the windy starburst dwarf galaxy NGC 1705. Mon. Not. R. Astron. Soc. 1998, 300, 705–717. doi:10.1046/j.1365-8711.1998.01905.x.
- Olling (1996) Olling, R.P. The Highly Flattened Dark Matter Halo of NGC 4244. Astron. J. 1996, 112, 481. doi:10.1086/118029.
- Matthews et al. (1999) Matthews, L.D.; Gallagher, J. S., I; van Driel, W. The Extraordinary “Superthin” Spiral Galaxy UGC 7321. I. Disk Color Gradients and Global Properties from Multiwavelength Observations. Astron. J. 1999, 118, 2751–2766. doi:10.1086/301128.
- Matthews (2000) Matthews, L.D. The Extraordinary “Superthin” Spiral Galaxy UGC 7321. II. The Vertical Disk Structure. Astron. J. 2000, 120, 1764–1778. doi:10.1086/301555.
- Matthews and Uson (2008) Matthews, L.D.; Uson, J.M. H I Imaging Observations of Superthin Galaxies. II. IC 2233 and the Blue Compact Dwarf NGC 2537. Astron. J. 2008, 135, 291–318. doi:10.1088/0004-6256/135/1/291.
- Springel et al. (2004) Springel, V.; White, S.D.M.; Hernquist, L. The shapes of simulated dark matter halos. In Dark Matter in Galaxies; Ryder, S., Pisano, D., Walker, M., Freeman, K., Eds.; IAU Symposium; Cambridge University Press: Cambridge, UK, 2004; Volume 220, p. 421.
- Chua et al. (2019) Chua, K.T.E.; Pillepich, A.; Vogelsberger, M.; Hernquist, L. Shape of dark matter haloes in the Illustris simulation: Effects of baryons. Mon. Not. R. Astron. Soc. 2019, 484, 476–493. doi:10.1093/mnras/sty3531.
- Mihos et al. (1997) Mihos, J.C.; McGaugh, S.S.; de Blok, W.J.G. Dynamical Stability and Environmental Influences in Low Surface Brightness Disk Galaxies. Astrophys. J. 1997, 477, L79–L83, doi:10.1086/310528.
- Athanassoula et al. (1987) Athanassoula, E.; Bosma, A.; Papaioannou, S. Halo parameters of spiral galaxies. Astron. Astrophys. 1987, 179, 23–40.
- Peters and Kuzio de Naray (2018) Peters, W.; Kuzio de Naray, R. Characterizing bars in low surface brightness disc galaxies. Mon. Not. R. Astron. Soc. 2018, 476, 2938–2961. doi:10.1093/mnras/sty441.
- Schombert et al. (2011) Schombert, J.; Maciel, T.; McGaugh, S.S. Stellar Populations and the Star Formation Histories of LSB Galaxies—Part I: Optical and H Imaging. Adv. Astron. 2011, 2011, 143698. doi:10.1155/2011/143698.
- McGaugh et al. (1995) McGaugh, S.S.; Schombert, J.M.; Bothun, G.D. The Morphology of Low Surface Brightness Disk Galaxies. Astron. J. 1995, 109, 2019. doi:10.1086/117427.
- Schombert (2006) Schombert, J.M. On the Structural Differences between Disk and Dwarf Galaxies. Astron. J. 2006, 131, 296–303. doi:10.1086/497964.
- Peters and Kuzio de Naray (2019) Peters, W.; Kuzio de Naray, R. Bar properties and photometry of barred low surface brightness disc galaxies. Mon. Not. R. Astron. Soc. 2019, 484, 850–868. doi:10.1093/mnras/sty3505.
- Debattista and Sellwood (2000) Debattista, V.P.; Sellwood, J.A. Constraints from Dynamical Friction on the Dark Matter Content of Barred Galaxies. Astrophys. J. 2000, 543, 704–721. doi:10.1086/317148.
- Weiner et al. (2001) Weiner, B.J.; Williams, T.B.; van Gorkom, J.H.; Sellwood, J.A. The Disk and Dark Halo Mass of the Barred Galaxy NGC 4123. I. Observations. Astrophys. J. 2001, 546, 916–930. doi:10.1086/318288.
- Bovy and Rix (2013) Bovy, J.; Rix, H.W. A Direct Dynamical Measurement of the Milky Way’s Disk Surface Density Profile, Disk Scale Length, and Dark Matter Profile at 4 kpc ~ R ~ 9 kpc. Astrophys. J. 2013, 779, 115. doi:10.1088/0004-637X/779/2/115.
- Fuchs (2003) Fuchs, B. Massive disks in low surface brightness galaxies. Astrophys. Space Sci. 2003, 284, 719–722. doi:10.1023/A:1024011601885.
- Bland-Hawthorn and Gerhard (2016) Bland-Hawthorn, J.; Gerhard, O. The Galaxy in Context: Structural, Kinematic, and Integrated Properties. Ann. Rev. Astron. Astrophys. 2016, 54, 529–596. doi:10.1146/annurev-astro-081915-023441.
- Fuchs (2008) Fuchs, B. Dynamics of the disks of nearby galaxies. Astron. Nachrichten 2008, 329, 916. doi:10.1002/asna.200811047.
- Saburova and Zasov (2013) Saburova, A.S.; Zasov, A.V. Gravitational stability and mass estimation of stellar disks. Astron. Nachrichten 2013, 334, 785. doi:10.1002/asna.201311922.
- de Blok et al. (1996) de Blok, W.J.G.; McGaugh, S.S.; van der Hulst, J.M. HI observations of low surface brightness galaxies: Probing low-density galaxies. Mon. Not. R. Astron. Soc. 1996, 283, 18–54.
- van den Bosch et al. (2000) van den Bosch, F.C.; Robertson, B.E.; Dalcanton, J.J.; de Blok, W.J.G. Constraints on the Structure of Dark Matter Halos from the Rotation Curves of Low Surface Brightness Galaxies. Astron. J. 2000, 119, 1579–1591. doi:10.1086/301315.
- McGaugh et al. (2001) McGaugh, S.S.; Rubin, V.C.; de Blok, W.J.G. High-Resolution Rotation Curves of Low Surface Brightness Galaxies. I. Data. Astron. J. 2001, 122, 2381–2395. doi:10.1086/323448.
- de Blok and Bosma (2002) de Blok, W.J.G.; Bosma, A. High-resolution rotation curves of low surface brightness galaxies. Astron. Astrophys. 2002, 385, 816–846. doi:10.1051/0004-6361:20020080.
- Swaters et al. (2003) Swaters, R.A.; Madore, B.F.; van den Bosch, F.C.; Balcells, M. The Central Mass Distribution in Dwarf and Low Surface Brightness Galaxies. Astrophys. J. 2003, 583, 732–751. doi:10.1086/345426.
- de Blok et al. (2003) de Blok, W.J.G.; Bosma, A.; McGaugh, S. Simulating observations of dark matter dominated galaxies: Towards the optimal halo profile. Mon. Not. R. Astron. Soc. 2003, 340, 657–678. doi:10.1046/j.1365-8711.2003.06330.x.
- Kuzio de Naray et al. (2006) Kuzio de Naray, R.; McGaugh, S.S.; de Blok, W.J.G.; Bosma, A. High-Resolution Optical Velocity Fields of 11 Low Surface Brightness Galaxies. Astrophys. J. 2006, 165, 461–479. doi:10.1086/505345.
- Kuzio de Naray et al. (2008) Kuzio de Naray, R.; McGaugh, S.S.; de Blok, W.J.G. Mass Models for Low Surface Brightness Galaxies with High-Resolution Optical Velocity Fields. Astrophys. J. 2008, 676, 920–943. doi:10.1086/527543.
- Hayashi et al. (2007) Hayashi, E.; Navarro, J.F.; Springel, V. The shape of the gravitational potential in cold dark matter haloes. Mon. Not. R. Astron. Soc. 2007, 377, 50–62. doi:10.1111/j.1365-2966.2007.11599.x.
- Kuzio de Naray et al. (2009) Kuzio de Naray, R.; McGaugh, S.S.; Mihos, J.C. Constraining the NFW Potential with Observations and Modeling of Low Surface Brightness Galaxy Velocity Fields. Astrophys. J. 2009, 692, 1321–1332. doi:10.1088/0004-637X/692/2/1321.
- Kuzio de Naray and Kaufmann (2011) Kuzio de Naray, R.; Kaufmann, T. Recovering cores and cusps in dark matter haloes using mock velocity field observations. Mon. Not. R. Astron. Soc. 2011, 414, 3617–3626. doi:10.1111/j.1365-2966.2011.18656.x.
- Ludlow et al. (2017) Ludlow, A.D.; Benítez-Llambay, A.; Schaller, M.; Theuns, T.; Frenk, C.S.; Bower, R.; Schaye, J.; Crain, R.A.; Navarro, J.F.; Fattahi, A. Mass-Discrepancy Acceleration Relation: A Natural Outcome of Galaxy Formation in Cold Dark Matter Halos. Phys. Rev. Lett. 2017, 118, 161103. doi:10.1103/PhysRevLett.118.161103.
- Navarro et al. (2017) Navarro, J.F.; Benítez-Llambay, A.; Fattahi, A.; Frenk, C.S.; Ludlow, A.D.; Oman, K.A.; Schaller, M.; Theuns, T. The origin of the mass discrepancy-acceleration relation in CDM. Mon. Not. R. Astron. Soc. 2017, 471, 1841–1848. doi:10.1093/mnras/stx1705.
- Dutton et al. (2019) Dutton, A.A.; Macciò, A.V.; Obreja, A.; Buck, T. NIHAO - XVIII. Origin of the MOND phenomenology of galactic rotation curves in a CDM universe. Mon. Not. R. Astron. Soc. 2019, 485, 1886–1899. doi:10.1093/mnras/stz531.
- Wheeler et al. (2019) Wheeler, C.; Hopkins, P.F.; Doré, O. The Radial Acceleration Relation Is a Natural Consequence of the Baryonic Tully-Fisher Relation. Astrophys. J. 2019, 882, 46. doi:10.3847/1538-4357/ab311b.
- McGaugh and Milgrom (2013a) McGaugh, S.S.; Milgrom, M. Andromeda Dwarfs in Light of Modified Newtonian Dynamics. Astrophys. J. 2013, 766, 22. doi:10.1088/0004-637X/766/1/22.
- McGaugh and Milgrom (2013b) McGaugh, S.S.; Milgrom, M. Andromeda Dwarfs in Light of MOND. II. Testing Prior Predictions. Astrophys. J. 2013, 775, 139. doi:10.1088/0004-637X/775/2/139.
- Pawlowski and McGaugh (2014) Pawlowski, M.S.; McGaugh, S.S. Perseus I and the NGC 3109 association in the context of the Local Group dwarf galaxy structures. Mon. Not. R. Astron. Soc. 2014, 440, 908–919. doi:10.1093/mnras/stu321.
- McGaugh (2016) McGaugh, S.S. MOND Prediction for the Velocity Dispersion of the “Feeble Giant” Crater II. Astrophys. J. 2016, 832, L8. doi:10.3847/2041-8205/832/1/L8.
- Rodrigues et al. (2018) Rodrigues, D.C.; Marra, V.; del Popolo, A.; Davari, Z. Absence of a fundamental acceleration scale in galaxies. Nat. Astron. 2018, 2, 668–672. doi:10.1038/s41550-018-0498-9.
- Zhao and Li (2010) Zhao, H.; Li, B. Dark Fluid: A Unified Framework for Modified Newtonian Dynamics, Dark Matter, and Dark Energy. Astrophys. J. 2010, 712, 130–141. doi:10.1088/0004-637X/712/1/130.
- Blanchet (2007) Blanchet, L. Gravitational polarization and the phenomenology of MOND. Class. Quantum Gravity 2007, 24, 3529–3539. doi:10.1088/0264-9381/24/14/001.
- Berezhiani and Khoury (2015) Berezhiani, L.; Khoury, J. Theory of dark matter superfluidity. Phys. Rev. D 2015, 92, 103510. doi:10.1103/PhysRevD.92.103510.
- Bekenstein (2004) Bekenstein, J.D. Relativistic gravitation theory for the modified Newtonian dynamics paradigm. Phys. Rev. D 2004, 70, 083509.
- Milgrom (2009) Milgrom, M. Bimetric MOND gravity. Phys. Rev. D 2009, 80, 123536. doi:10.1103/PhysRevD.80.123536.
- Clifton et al. (2012) Clifton, T.; Ferreira, P.G.; Padilla, A.; Skordis, C. Modified gravity and cosmology. Phys. Rep. 2012, 513, 1–189. doi:10.1016/j.physrep.2012.01.001.
- Skordis and Złośnik (2019) Skordis, C.; Złośnik, T. Gravitational alternatives to dark matter with tensor mode speed equaling the speed of light. Phys. Rev. D 2019, 100, 104013. doi:10.1103/PhysRevD.100.104013.
- Hernandez et al. (2019) Hernandez, X.; Sussman, R.A.; Nasser, L. Approaching the Dark Sector through a bounding curvature criterion. Mon. Not. R. Astron. Soc. 2019, 483, 147–151. doi:10.1093/mnras/sty3073.