Complete NLO QCD study of single- and double-quarkonium hadroproduction in the colour-evaporation model at the Tevatron and the LHC
Abstract
We study the Single-Parton-Scattering (SPS) production of double quarkonia (, , and ) in and collisions at the LHC and the Tevatron as measured by the CMS, ATLAS, LHCb, and D0 experiments in the Colour-Evaporation Model (CEM), based on the quark-hadron-duality, including Next-to-Leading Order (NLO) QCD corrections up to . To do so, we also perform the first true NLO –up to – study of the -differential cross section for single-quarkonium production. This allows us to fix the non-perturbative CEM parameters at NLO accuracy in the region where quarkonium-pair data are measured. Our results show that the CEM at NLO in general significantly undershoots these experimental data and, in view of the other existing SPS studies, confirm the need for Double Parton Scattering (DPS) to account for the data. Our NLO study of single-quarkonium production at mid and large also confirms the difficulty of the approach to account for the measured spectra; this is reminiscent of the impossibility to fit single-quarkonium data with the sole NRQCD contribution from gluon fragmentation. We stress that the discrepancy occurs in a kinematical region where the new features of the improved CEM are not relevant.
1 Introduction
Quarkonium-pair production in high-energy hadron-hadron collisions is an interesting probe of many physics phenomena. It can help us study the physics underlying double parton scatterings (DPS) [1, 2], thence the gluon-gluon correlations in the proton (see e.g. [3, 4, 5, 6, 7, 8, 9, 10, 11, 12, 13, 14]). It can also provide us with unique information about the distribution of linearly-polarised gluons inside the proton [15, 16]. Finally, it remains a crucial test of quarkonium-production models (see [17, 18, 19, 20] for reviews) which should of course account both for single- and double-quarkonium yields as well as associated production [20]. Going further, triple- production should also help us probe both DPS and Triple Parton Scatterings (TPS) [21, 22].
In the recent years, there has been an accumulation of experimental hints [23, 24, 25, 2, 26, 27, 28, 29, 30] that quarkonium pairs can be produced in a significant amount by two simultaneous parton-parton scatterings – the DPS. This is particularly true at large rapidity separations, , where the a priori leading Single Parton Scatterings (SPS) are suppressed since they generate highly correlated quarkonium pairs, thus at low . The region of large is therefore a good candidate for a control region for DPS extraction.
Di-quarkonia from DPS are in principle fully decorrelated. Such a property was in fact used to disentangle their contributions from those of the SPS. For instance, one expects a flat event distribution as a function of the azimuthal angle between both quarkonia, . However, a reliable SPS-DPS separation often calls for a good control of the SPS kinematical distribution which can be similar to that of the DPS in some phase-space regions. Many theoretical di-quarkonium SPS studies have been carried out [31, 32, 33, 34, 35, 36, 37, 38, 39, 40, 41, 2, 42, 43, 44, 45, 46, 15, 47, 48, 49, 50] but only a few [38, 41, 42, 2, 46, 27, 51] dealt with QCD corrections, some of which might be relevant where the DPS yields are found to be large.
At small , all the experimental data sets are in fact in good agreement with the SPS predictions from the Colour-Singlet Model (CSM), i.e. the LO in the heavy-quark relative velocity, , expansion of Non Relativistic QCD (NRQCD) [52]. These predictions are known up to NLO accuracy [41, 42, 46]. In addition, the NRQCD Colour-Octet (CO) contributions are found to be negligible111This remains true [51] whatever values of the NRQCD Long Distance Matrix Elements (LDMEs) are used – provided of course that they account for the majority of the corresponding existing single-quarkonium production data. in this region [2, 43, 51] which is in line with the expected suppression by with respect to the CS contributions.
For increasing , the lack of complete NLO NRQCD studies is prejudicial and opens the door to some debates [2, 43, 51] about the possibility for unexpectedly large SPS contributions from CO contributions. Indeed, owing to the large uncertainties in the LDME determinations [51], NRQCD at LO shows a very low predictive power, e.g. in regions where the DPS is thought to be the dominant source of quarkonium pairs. Hopefully, possible future NLO studies could close this debate.
This is important since recent direct and indirect DPS extractions based on quarkonia in pairs [2, 26, 27, 28] or in association with a vector boson [53, 54] seem to point [54] at an unexpected flavour or momentum dependence of the parton correlations in the proton –as encoded in the well known quantity [11]–, when compared to other (direct and indirect) extractions [55, 56, 57, 58, 59, 60, 61, 62, 63, 64, 65, 66].
Using the colour-evaporation model (CEM) [67, 68] –a model based on quark-hadron duality but which shares some features of NRQCD [69], in particular the direct production of vector quarkonia from gluon fragmentation– we wish to advance our understanding of the SPS contributions to quarkonium pairs. In addition, its implementation is very similar to that of open heavy-flavour production and can be done in MadGraph5_aMC@NLO [70] with some tunings. Finally, it is straightforward to treat the feed-down contributions (e.g. from ) to prompt in the CEM. Altogether, this allows us to perform the first complete NLO study of quarkonium-pair production using one of the widely used quarkonium-production models.
In the case of [53] and [54] production, we have shown that the CEM provides an upper limit on the SPS contributions. This is also likely the case for production and for the case in the kinematical region where gluon fragmentation to both quarkonia is expected to be dominant. More generally, it offers an indirect way to scrutinise whether some specific configurations of the heavy-quark pair receive at NLO kinematically-enhanced contributions, which result in large factors (see e.g. [41]). Indeed, if we were to observe a large factor to the di-quarkonium CEM yields, where all the pair (spin and colour) configurations are summed with the same weights, this would necessarily signal a potential large factor to some NRQCD contributions.
Such a complete NLO study for di-quarkonium necessitates a coherent determination of the non-perturbative CEM parameters – one per particle. Therefore, an interesting side product of our study is the corresponding NLO study of the -differential cross section of single , and hadroproduction. To what concerns the and , this is the very first study of this kind. So far the NLO CEM studies [71, 72] were held for the -integrated yield at .
This paper is organised as follows. In section 2, we explain the methodology of our NLO CEM calculation. In section 3, we discuss our original results for the distribution of single , and in the CEM at NLO, which we use to fit the corresponding non-perturbative CEM parameters. In section 4, we then present our results for the production of di- for the CMS, ATLAS, and LHCb acceptances, of in the D0 acceptance and for the di- in the CMS acceptance. Section 5 is devoted to our conclusions and outlook.
2 The CEM in a few formulae
In the CEM, a given quarkonium-production cross section is obtained from that to produce the corresponding heavy quark-antiquark pair with the sole constraint that its invariant mass lies between twice the quark mass, , and twice that of the lightest open-heavy-flavour hadron, . The same logic applies in the case of a pair of quarkonia. The cross section for single quarkonium production is then given by
| (1) |
and that for the production of a pair, , of quarkonia
| (2) |
where () is the corresponding (doubly) differential cross section for () production as a function of the pair invariant mass(es), () and is a non-perturbative parameter encapsulating the probability for the hadronisation of the pair into the quarkonium . It is supposed to be universal and independent of the production of the pair.
In principle, having the heavy-quark cross section differential in the invariant mass, is sufficient to obtain the short-distance part of the CEM for single or associated production and correspondingly for pair production. The automated tool MadGraph5_aMC@NLO with specific cuts can provide such cross sections up to NLO accuracy, also differential in other variables, like the rapidity or the transverse momentum of the pair which translates222In an improved version of the CEM [73], the quarkonium momentum is taken as that of the pair rescaled by the ratio of the quarkonium mass over the pair invariant mass. In the case of the , it slightly modifies the spectrum up to about 15 GeV. into that of the quarkonium . Such cross sections should just then be multiplied by the non-perturbative parameter which is usally tuned to match the single-quarkonium production data.
3 The -differential cross section for single-quarkonium hadroproduction at NLO
The existing CEM studies of quarkonium production at RHIC, the Tevatron and the LHC rely on a hard-scattering matrix element at one loop for inclusive heavy-quark production, namely (see [20] for a recent review). This is based on the well-known multi-differential MNR computation [74] using the aforementioned invariant-mass cut. At this order, a heavy-quark pair with a non-zero (irrespectively of the invariant mass of the pair) comes from real-emission graphs, where a final light parton recoils against the pair. The virtual-emission contributions do not contribute away from . Such existing computations for are effectively Born-order or tree-level computation from the partonic processes or , and thus not effectively at NLO accuracy. As a case in point, the renormalisation-scale dependence of the resulting cross section is simply that of the third power of .
Thanks to MadGraph5_aMC@NLO, we are able to provide complete NLO CEM hadroproduction results for by computing + 1 parton up to where the subscript indicates that the pair invariant mass is integrated as in Eq. (1). A first study was presented along with our CEM computation [53]. Here we go further and consider in addition the and cases. We also discuss in more details the resulting CEM parameter depending on whether it is fit at mid or large or on the -integrated yields.
| Fits from : LO at & NLO at | ||
|---|---|---|
| ATLAS [75]: TeV, , GeV | ||
| (2S) | ||
| ATLAS [75]: TeV, , GeV | ||
| (2S) | ||
| CMS [76] TeV, , GeV | ||
| (1S) | ||
| (2S) | ||
| (3S) | ||
| CMS [76] TeV, , GeV) | ||
| (1S) | ||
| (2S) | ||
| (3S) | ||
| Fits from : LO at ) & NLO at | ||
| ALICE [77]: TeV, , integrated | ||
| (2S) | ||
| CMS [78] TeV, , integrated | ||
| (1S) | ||
| (2S) | ||
| (3S) | ||
As what regards the parameters of our computation, they remain very standard. We have used the PDF set NLO NNPDF 3.0 set [79] with provided by LHAPDF [80] from which we have derived the PDF uncertainty. The latter remains negligible compared to the factorisation- and renormalisation-scale uncertainties, which are evaluated by varying them independently in the interval , where is identified to the quarkonium transverse mass, .
Like in [53], we use GeV for charmonium production in the CEM as suggested in [72]. It is important to note that the quark mass enters the cross section both via and via the integration range. Results with GeV are sometimes slightly different. However, when the CEM is tuned to data, the mass dependence is mostly absorbed in the change of and the physics conclusion always remains nearly identical. For the bottomonia, we have used GeV. For the upper bounds of integrations, , we have used 3.728 GeV for and 10.56 GeV for .
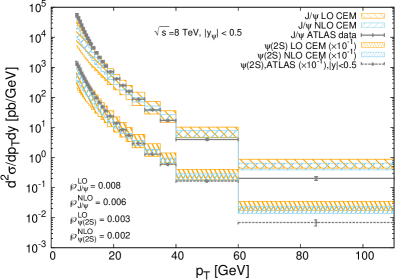
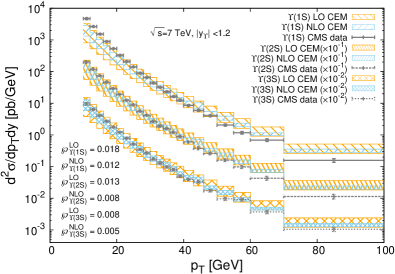
We have performed a number of fits of using the experimental data of single inclusive prompt and (2S) and data from ALICE, ATLAS and CMS over different ranges. We could also have used the very precise LHCb data [81, 82, 83] but we preferred to restrict our fit to central rapidity data. Including them would not have changed our conclusions since the CEM does not describe well the spectrum in any case. In the and cases, the obtained values of correspond to prompt production. For , they hold for direct production. Table 1 gathers the used kinematical ranges and the corresponding fit results at LO and NLO.
Since the factors for and near threshold are larger than unity, the at NLO are correspondingly smaller than at LO. Moreover, since the CEM spectra are usually too hard (see [20]), the also tend to decrease in order to match data at high and the fits overall worsen. This well-known (LO) trend is indeed confirmed at NLO. In the present LHC kinematics, this is particularly obvious in Fig. 1a and Fig. 1b.
The ALICE data set and one CMS data set extend to which allowed us to fit the -integrated cross section with a NLO computation of . These results for the case for the entire range are comparable to those of Vogt, i.e. 2 to 3% depending on , the scale choice and the PDFs (see ”” and ”” of Table 8 of Ref. [71]). We see that the CEM parameters obtained by fitting the spectra are systematically smaller than those obtained by fitting -integrated yields. For the case, we have quoted a range. Indeed, as can be seen in [72], shows a very large uncertainty, which even tends to increase at large ending up to be as large as one order of magnitude. The obtained lower values are systematically much smaller than the open-charm data. If we were to fit the ALICE data with computed with the scale values corresponding to these lower values, the discrepancy would be absorbed in which would become anomalously large, even above unity in some cases. This would be unphysical. Since the open-charm data systematically lie between the central and upper NLO values, we thus only quote in Table 1 the corresponding range for . It is in fact in line with the values quoted in [72] for GeV but for different (fixed) scales and PDFs. The data sets used for these older fits are also obviously different.
4 LO and NLO CEM results for di-quarkonium hadroproduction
In this section, we present our LO and NLO CEM results for all the existing LHC and Tevatron results [28, 25, 29, 24, 84, 30], but the D0 analysis [24] for which no normalised distributions were released and the early LHCb analysis at TeV [23] which we consider to be superseded by their 13 TeV analysis. The corresponding kinematical conditions are summarised in Table 2.
Like for the NLO single-quarkonium study presented above, we employ the NLO NNPDF 3.0 set [79]. The dependence of the result on the renormalisation and factorisation scales is quantified by varying them independently in the interval where depends on the considered system. For charmonium and bottomonium pairs, it is fixed to be where is randomly selected from one of the pair members. For charmonium+bottomonium, it is the average of the transverse masses, . We also do not consider uncertainties from the heavy-quark mass as they are mostly absorbed in the CEM parameters, . This is surely the case for the invariant-mass-integration region. The remaining uncertainty from the value of the hard matrix element may differ, but in view of the data-theory disagreements which we discuss next, we consider this approximation to be reasonable.
| Data set | Kinematical conditions |
|---|---|
| TeV () | |
| (CMS inclusive) [25] | GeV when |
| 4.5 GeV GeV when | |
| GeV when | |
| TeV () | |
| (ATLAS fiducial) [28] | GeV, |
| GeV, | |
| TeV () | |
| (LHCb inclusive) [29] | GeV |
| (nS) | TeV () |
| (D0 fiducial) [26] | GeV |
| TeV () | |
| (CMS inclusive) [84] | |
| TeV () | |
| (CMS inclusive) [30] |
4.1 pairs
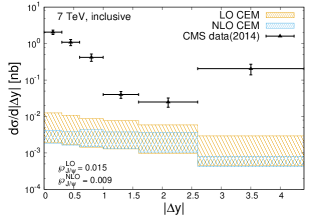
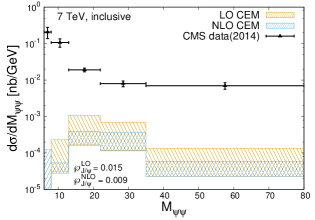
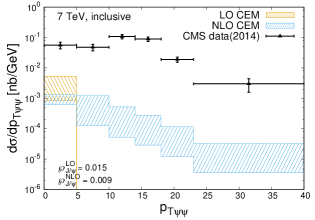
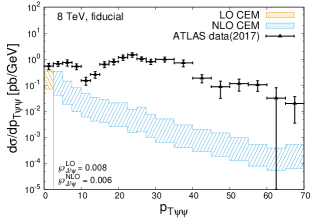
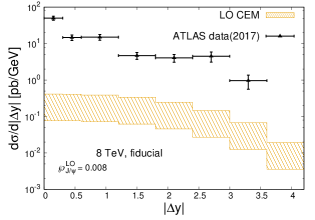
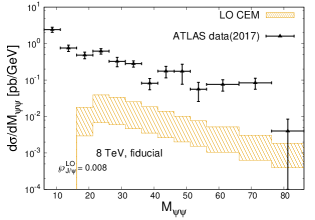
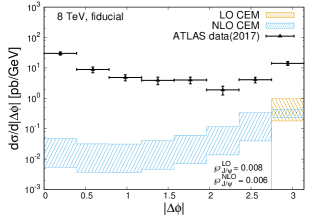
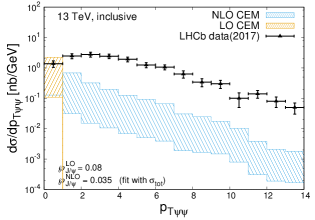
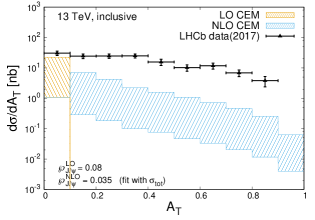
Let us first discuss our results of the CEM calculation of -pair production in the CMS setup. The differential cross section in the rapidity separation, , is shown in Fig. 2a, in the invariant mass, , in Fig. 2b, and in the transverse momentum of the -pair, , in Fig. 2c. We see that the CEM results are at least an order of magnitude below the experimental data of CMS at both LO and NLO, even considering their (large) uncertainties. We note that the scale uncertainty in the NLO calculations is half of that in the LO ones which indicates the absence of kinematically-enhanced topologies. The regions of large and large are those where the DPS contributions are extracted and our computations confirm that SPS contributions, from the CEM for sure but likely as from other models, are negligible there. Unsurprisingly, the NLO yield populates the distributions but its contribution is clearly too small and does not even show the bump generated by the kinematical cut in the CMS acceptance. Such a bump is well seen in NLO CSM computations, which describes the data well all over the entire spectrum [2, 51]. The very same observations can be made for the distributions measured by ATLAS [28].
We note that ATLAS only released the and distributions for their fiducial yields. For the latter, only a small fraction of the events passes the muon cuts, even after the cuts (which are also stringent, GeV). In addition, the CEM yield is computed over a tiny fraction of the possible invariant masses. Overall, the relevant multi-dimensional hyperspace where the integration is performed can be extremely small and complex. The result depends on an extremely small part of the physical phase for , especially at LHC energies. To help the integrator find the CEM ‘domain’, one has to enlarge the invariant-mass regions at the MC generation level and then to restrict it at the histogramming level. This is unfortunately extremely ineffective. Whereas the MadGraph5_aMC@NLO integrator manages to perform well the integration at LO in a reasonable amount of time, it becomes highly CPU consuming at NLO, for instance CPUseconds to get distributions where all the bins are simply populated. Unfortunately, we did not manage to obtain reliable NLO results for these distributions. As such, we only plot the LO results (see Fig. 2e for , Fig. 2f for ). We expect the NLO results to be similar in view of the LO/NLO ratio for the corresponding CMS distribution in a similar (inclusive) phase space.
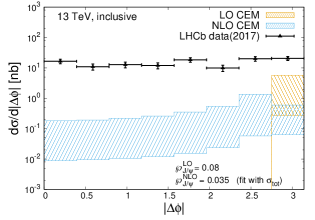
Contrary to CMS, ATLAS also released their data as a function of , the azimuthal angle between both . It is useful in quantifying the relative size of the DPS vs SPS contributions, especially when transverse-momentum-smearing effects can be neglected. Indeed, in such a case, the SPS contributions usually exhibit a peak at (both particles recoil on each other) and sometimes at (the pair recoils against a third particle) whereas the DPS contributions should exhibit a flat distribution if both partonic scatterings are indeed uncorrelated. This remains of course an approximation although, until now, never falsified.
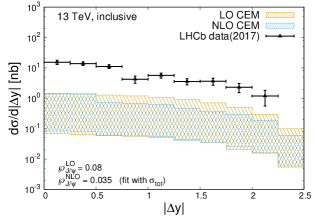
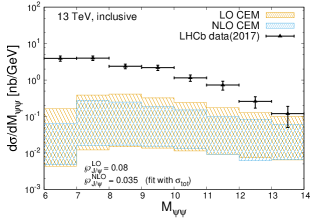
Along these lines, the concave data distribution shown in Fig. 2g is indicative of a significant SPS contributions. According to ATLAS [28], it amounts to about 90% of the entire yield. Clearly, the CEM is unable to account for this SPS contribution. The same distribution measured by LHCb at 13 TeV shown on Fig. 2h is however much more intricate to interpret. Indeed, the LHCb measurement was performed without cut which allows the momentum-smearing effects to be significant. As a consequence, the DPS vs SPS separation is much more involved. On a logarithmic plot, the NLO CEM yield already looks nearly flat, not very different than the shape of the data distribution. Yet, the normalisation is again off by more than an order of magnitude. Let us stress that, for the LHCb acceptance, we have used a value fit on the -integrated yields, which is the largest of all those discussed above. One observes a similar gap on the other distributions333, also called the transverse momentum asymmetry, is defined as . (see Fig. 2i-2l) which confirms that the CEM is unable to account for any measured di- data sets. This is even the case in regions where at the same time the DPS contributions are expected to be mild –if not negligible– and the CSM has been found to match the data.
4.2 pairs
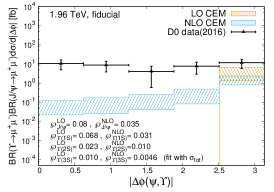
We now move to the case as measured by the D0 Collaboration at TeV [26]. The only released kinematical distribution was that of which we have compared to our CEM computations in Fig. 3a. We note that this measurement was performed at low and we have used the corresponding CEM parameter values. If we had used parameters fit to the -differential data, the CEM predictions would have been even smaller. At , the NLO CEM is at best 5 times below the data and ends up to be 100 times lower at . This is in line with the current interpretation of these D0 data, namely that they are dominated by DPS contributions [27].
4.3 pairs
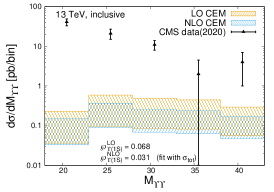
Finally, we move to (1S)-pair production as measured by the CMS experiment. In a first study at 8 TeV [84] for , they only measured the integrated cross section, which they found to be
| (3) |
to be compared to our CEM results (with fit to the -integrated spectrum, 0.068 and 0.031)
| (4) |
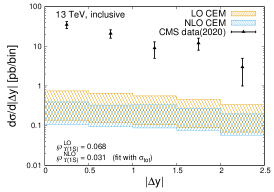
Very recently, CMS performed a new study at 13 TeV [30] with significantly more events which allowed them to perform differential measurements as a function of and . The comparisons are shown in Fig. 3b & 3c.
As of now, there does not exist any direct or indirect DPS/SPS separation. As such, we are not able to claim that the CEM is in contradiction with the data. Yet, any reasonable estimate of the DPS yield would indicate that the SPS fraction should be significant [20]. This would mean that the CEM indeed cannot account for the SPS yield to di- in the CMS acceptance.
5 Conclusions
We have presented the first CEM study at LO and NLO for the SPS yields in hadroproduction of quarkonium pairs. Our computation –fully accounting for contributions up to – was performed thanks to a tuned version of MadGraph5_aMC@NLO taking into account the specificities of the CEM. Except for those kinematical distributions where the LO distributions are trivially suppressed, the -factors we have found are systematically on the order of the unity, in particular at large and . This lends support to the irrelevance of possible kinematically-enhanced contributions from QCD corrections in these regions (see also [38, 47, 50, 51]) where the dominance of DPS contributions is sometimes questioned. Owing to the similarities between the CEM and the COM of NRQCD, we foresee a similar situation when the first NLO COM studies are performed.
On the quantitative level, we have compared our computations to a large selection of data for , , and hadroproduction in and collisions at the LHC and the Tevatron as measured by the ATLAS, CMS, D0, and LHCb collaborations. In all the cases, the computed yields are one to two orders of magnitude below the experimental data. This is also the case in the kinematical regions where it is established that the SPS contributions are dominant, or equivalently that the DPS contributions cannot reasonably describe the data. As such, it provides evidence that the CEM does not encapsulate the leading production mechanism for this SPS yield. This is another case, with [20], where the CEM fails to describe the data while the CSM can.
In order to present coherent results at one-loop accuracy, we have also studied -differential cross sections for single quarkonium hadroproduction up to . We have used these in order to fit the non-perturbative CEM parameters. As far as the description of -differential yields are concerned, our results therefore naturally supersede existing CEM results available in the literature (see e.g. [71]) which were only performed up to . We have also updated our NLO results made along a previous NLO CEM study [53]. Let us add that this is the first time that -differential cross sections for are computed at this order and compared to the data.
Overall, the CEM features for single quarkonium hadroproduction observed at , i.e. at LO, are confirmed and the CEM remains unable to provide a satisfactory description of the single-quarkonium-hadroproduction data with too hard a spectrum at large . For this reason, we provide different values of the CEM parameters as needed makeshift if one wants to still perform other phenomenological studies similar to the present one for di-quarkonium production. Indeed, the CEM still represents a handy approach to estimate quarkonium cross sections when computations under other approaches like the CSM and NRQCD are too complex, especially beyond LO accuracy.
Acknowledgements
We thank C. Caillol, C. Flore, O. Mattelaer, M.A. Ozcelik and F. Scarpa for useful discussions. This project has received funding from the European Union’s Horizon 2020 research and innovation programme under grant agreement No 824093 in order to contribute to the EU Virtual Access NLOAccess and from the Franco-Chinese LIA FCPPL (Quarkonium4AFTER). The work of J.P.L. is supported in part by the French IN2P3–CNRS via the project GLUE@NLO. H.S.S. is supported by the ILP Labex (ANR-11-IDEX-0004-02, ANR-10-LABX-63). N.Y. was supported by JSPS Postdoctoral Fellowships for Research Abroad. Y.J.Z is supported by the National Natural Science Foundation of China (Grants No. 11722539).
References
- [1] C. H. Kom, A. Kulesza, and W. J. Stirling, “Pair Production of J/psi as a Probe of Double Parton Scattering at LHCb,” Phys. Rev. Lett. 107 (2011) 082002, arXiv:1105.4186 [hep-ph].
- [2] J.-P. Lansberg and H.-S. Shao, “ -pair production at large momenta: Indications for double parton scatterings and large contributions,” Phys. Lett. B751 (2015) 479–486, arXiv:1410.8822 [hep-ph].
- [3] B. Blok, Yu. Dokshitser, L. Frankfurt, and M. Strikman, “pQCD physics of multiparton interactions,” Eur. Phys. J. C72 (2012) 1963, arXiv:1106.5533 [hep-ph].
- [4] M. G. Ryskin and A. M. Snigirev, “Double parton scattering in double logarithm approximation of perturbative QCD,” Phys. Rev. D86 (2012) 014018, arXiv:1203.2330 [hep-ph].
- [5] J. R. Gaunt, “Single Perturbative Splitting Diagrams in Double Parton Scattering,” JHEP 01 (2013) 042, arXiv:1207.0480 [hep-ph].
- [6] B. Blok, Yu. Dokshitzer, L. Frankfurt, and M. Strikman, “Perturbative QCD correlations in multi-parton collisions,” Eur. Phys. J. C74 (2014) 2926, arXiv:1306.3763 [hep-ph].
- [7] M. Diehl, T. Kasemets, and S. Keane, “Correlations in double parton distributions: effects of evolution,” JHEP 05 (2014) 118, arXiv:1401.1233 [hep-ph].
- [8] B. Blok and M. Strikman, “Open charm production in Double Parton Scattering processes in the forward kinematics,” Eur. Phys. J. C76 no. 12, (2016) 694, arXiv:1608.00014 [hep-ph].
- [9] M. Diehl and J. R. Gaunt, “Double parton scattering theory overview,” Adv. Ser. Direct. High Energy Phys. 29 (2018) 7–28, arXiv:1710.04408 [hep-ph].
- [10] T. Kasemets and S. Scopetta, “Parton correlations in double parton scattering,” Adv. Ser. Direct. High Energy Phys. 29 (2018) 49–62, arXiv:1712.02884 [hep-ph].
- [11] M. Rinaldi and F. A. Ceccopieri, “Hadronic structure from double parton scattering,” Phys. Rev. D97 no. 7, (2018) 071501, arXiv:1801.04760 [hep-ph].
- [12] M. Rinaldi and F. A. Ceccopieri, “Double parton scattering and the proton transverse structure at the LHC,” JHEP 09 (2019) 097, arXiv:1812.04286 [hep-ph].
- [13] R. Nagar, Double parton scattering: effects of colour. PhD thesis, Hamburg U., Hamburg, 2019.
- [14] S. Cotogno, T. Kasemets, and M. Myska, “Confronting same-sign W-boson production with parton correlations,” arXiv:2003.03347 [hep-ph].
- [15] J.-P. Lansberg, C. Pisano, F. Scarpa, and M. Schlegel, “Pinning down the linearly-polarised gluons inside unpolarised protons using quarkonium-pair production at the LHC,” Phys. Lett. B 784 (2018) 217–222, arXiv:1710.01684 [hep-ph]. [Erratum: Phys.Lett.B 791, 420–421 (2019)].
- [16] F. Scarpa, D. Boer, M. G. Echevarria, J.-P. Lansberg, C. Pisano, and M. Schlegel, “Studying the gluon TMDs with - and -pair production at the LHC,” PoS DIS2019 (2019) 201, arXiv:1910.06725 [hep-ph].
- [17] J. P. Lansberg, “, and production at hadron colliders: A Review,” Int. J. Mod. Phys. A21 (2006) 3857–3916, arXiv:hep-ph/0602091 [hep-ph].
- [18] N. Brambilla et al., “Heavy quarkonium: progress, puzzles, and opportunities,” Eur. Phys. J. C71 (2011) 1534, arXiv:1010.5827 [hep-ph].
- [19] A. Andronic et al., “Heavy-flavour and quarkonium production in the LHC era: from proton–proton to heavy-ion collisions,” Eur. Phys. J. C76 no. 3, (2016) 107, arXiv:1506.03981 [nucl-ex].
- [20] J.-P. Lansberg, “New Observables in Inclusive Production of Quarkonia,” arXiv:1903.09185 [hep-ph].
- [21] D. d’Enterria and A. M. Snigirev, “Triple parton scatterings in high-energy proton-proton collisions,” Phys. Rev. Lett. 118 no. 12, (2017) 122001, arXiv:1612.05582 [hep-ph].
- [22] H.-S. Shao and Y.-J. Zhang, “Triple prompt hadroproduction as a hard probe of multiple-parton scatterings,” Phys. Rev. Lett. 122 no. 19, (2019) 192002, arXiv:1902.04949 [hep-ph].
- [23] LHCb Collaboration, R. Aaij et al., “Observation of pair production in collisions at ,” Phys. Lett. B707 (2012) 52–59, arXiv:1109.0963 [hep-ex].
- [24] D0 Collaboration, V. M. Abazov et al., “Observation and studies of double production at the Tevatron,” Phys. Rev. D90 no. 11, (2014) 111101, arXiv:1406.2380 [hep-ex].
- [25] CMS Collaboration, V. Khachatryan et al., “Measurement of prompt pair production in pp collisions at = 7 Tev,” JHEP 09 (2014) 094, arXiv:1406.0484 [hep-ex].
- [26] D0 Collaboration, V. M. Abazov et al., “Evidence for simultaneous production of and mesons,” Phys. Rev. Lett. 116 no. 8, (2016) 082002, arXiv:1511.02428 [hep-ex].
- [27] H.-S. Shao and Y.-J. Zhang, “Complete study of hadroproduction of a meson associated with a prompt ,” Phys. Rev. Lett. 117 no. 6, (2016) 062001, arXiv:1605.03061 [hep-ph].
- [28] ATLAS Collaboration, M. Aaboud et al., “Measurement of the prompt J/ pair production cross-section in pp collisions at TeV with the ATLAS detector,” Eur. Phys. J. C77 no. 2, (2017) 76, arXiv:1612.02950 [hep-ex].
- [29] LHCb Collaboration, R. Aaij et al., “Measurement of the J/ pair production cross-section in pp collisions at TeV,” JHEP 06 (2017) 047, arXiv:1612.07451 [hep-ex]. [Erratum: JHEP10,068(2017)].
- [30] CMS Collaboration, A. M. Sirunyan et al., “Measurement of the (1S) pair production cross section and search for resonances decaying to (1S) in proton-proton collisions at 13 TeV,” arXiv:2002.06393 [hep-ex].
- [31] V. G. Kartvelishvili and S. M. Esakiya, “ON HADRON INDUCED PRODUCTION OF J / PSI MESON PAIRS. (IN RUSSIAN),” Yad. Fiz. 38 (1983) 722–726.
- [32] B. Humpert and P. Mery, “psi psi PRODUCTION AT COLLIDER ENERGIES,” Z. Phys. C20 (1983) 83.
- [33] R. Vogt and S. J. Brodsky, “Intrinsic charm contribution to double quarkonium hadroproduction,” Phys. Lett. B349 (1995) 569–575, arXiv:hep-ph/9503206 [hep-ph].
- [34] R. Li, Y.-J. Zhang, and K.-T. Chao, “Pair Production of Heavy Quarkonium and B(c)(*) Mesons at Hadron Colliders,” Phys. Rev. D80 (2009) 014020, arXiv:0903.2250 [hep-ph].
- [35] C.-F. Qiao, L.-P. Sun, and P. Sun, “Testing Charmonium Production Mechamism via Polarized J/psi Pair Production at the LHC,” J. Phys. G37 (2010) 075019, arXiv:0903.0954 [hep-ph].
- [36] P. Ko, C. Yu, and J. Lee, “Inclusive double-quarkonium production at the Large Hadron Collider,” JHEP 01 (2011) 070, arXiv:1007.3095 [hep-ph].
- [37] S. P. Baranov, “Pair production of mesons in the -factorization approach,” Phys. Rev. D84 (2011) 054012.
- [38] S. P. Baranov, A. M. Snigirev, N. P. Zotov, A. Szczurek, and W. Schaefer, “Interparticle correlations in the production of pairs in proton-proton collisions,” Phys. Rev. D87 no. 3, (2013) 034035, arXiv:1210.1806 [hep-ph].
- [39] A. V. Berezhnoy, A. K. Likhoded, A. V. Luchinsky, and A. A. Novoselov, “Double J/psi-meson Production at LHC and 4c-tetraquark state,” Phys. Rev. D84 (2011) 094023, arXiv:1101.5881 [hep-ph].
- [40] Y.-J. Li, G.-Z. Xu, K.-Y. Liu, and Y.-J. Zhang, “Relativistic Correction to J/psi and Upsilon Pair Production,” JHEP 07 (2013) 051, arXiv:1303.1383 [hep-ph].
- [41] J.-P. Lansberg and H.-S. Shao, “Production of versus at the LHC: Importance of Real Corrections,” Phys. Rev. Lett. 111 (2013) 122001, arXiv:1308.0474 [hep-ph].
- [42] L.-P. Sun, H. Han, and K.-T. Chao, “Impact of pair production at the LHC and predictions in nonrelativistic QCD,” Phys. Rev. D94 no. 7, (2016) 074033, arXiv:1404.4042 [hep-ph].
- [43] Z.-G. He and B. A. Kniehl, “Complete Nonrelativistic-QCD Prediction for Prompt Double J/ψ Hadroproduction,” Phys. Rev. Lett. 115 no. 2, (2015) 022002, arXiv:1609.02786 [hep-ph].
- [44] S. P. Baranov and A. H. Rezaeian, “Prompt double production in proton-proton collisions at the LHC,” Phys. Rev. D93 no. 11, (2016) 114011, arXiv:1511.04089 [hep-ph].
- [45] J.-P. Lansberg and H.-S. Shao, “Double-quarkonium production at a fixed-target experiment at the LHC (AFTER@LHC),” Nucl. Phys. B900 (2015) 273–294, arXiv:1504.06531 [hep-ph].
- [46] A. K. Likhoded, A. V. Luchinsky, and S. V. Poslavsky, “Production of and with real gluon emission at LHC,” Phys. Rev. D94 no. 5, (2016) 054017, arXiv:1606.06767 [hep-ph].
- [47] A. Cisek, W. Schaefer, and A. Szczurek, “Production of pairs with large rapidity separation in factorization,” Phys. Rev. D97 no. 11, (2018) 114018, arXiv:1711.07366 [hep-ph].
- [48] Z.-G. He, B. A. Kniehl, and X.-P. Wang, “Breakdown of Nonrelativistic QCD Factorization in Processes Involving Two Quarkonia and its Cure,” Phys. Rev. Lett. 121 no. 17, (2018) 172001, arXiv:1809.07993 [hep-ph].
- [49] Z.-G. He, B. A. Kniehl, M. A. Nefedov, and V. A. Saleev, “Double Prompt Hadroproduction in the Parton Reggeization Approach with High-Energy Resummation,” Phys. Rev. Lett. 123 no. 16, (2019) 162002, arXiv:1906.08979 [hep-ph].
- [50] I. Babiarz, W. Schaefer, and A. Szczurek, “Associated production of pairs with a gluon in the collinear-factorization approach,” Phys. Rev. D99 no. 7, (2019) 074014, arXiv:1902.08426 [hep-ph].
- [51] J.-P. Lansberg, H.-S. Shao, N. Yamanaka, and Y.-J. Zhang, “Prompt -pair production at the LHC: impact of loop-induced contributions and of the colour-octet mechanism,” Eur. Phys. J. C 79 no. 12, (2019) 1006, arXiv:1906.10049 [hep-ph].
- [52] G. T. Bodwin, E. Braaten, and G. P. Lepage, “Rigorous QCD analysis of inclusive annihilation and production of heavy quarkonium,” Phys. Rev. D51 (1995) 1125–1171, arXiv:hep-ph/9407339 [hep-ph]. [Erratum: Phys. Rev.D55,5853(1997)].
- [53] J.-P. Lansberg and H.-S. Shao, “Associated production of a quarkonium and a Z boson at one loop in a quark-hadron-duality approach,” JHEP 10 (2016) 153, arXiv:1608.03198 [hep-ph].
- [54] J.-P. Lansberg, H.-S. Shao, and N. Yamanaka, “Indication for double parton scatterings in prompt production at the LHC,” Phys. Lett. B781 (2018) 485–491, arXiv:1707.04350 [hep-ph].
- [55] Axial Field Spectrometer Collaboration, T. Åkesson et al., “Double Parton Scattering in Collisions at -GeV,” Z. Phys. C34 (1987) 163.
- [56] UA2 Collaboration, J. Alitti et al., “A Study of multi - jet events at the CERN anti-p p collider and a search for double parton scattering,” Phys. Lett. B268 (1991) 145–154.
- [57] CDF Collaboration, F. Abe et al., “Study of four jet events and evidence for double parton interactions in collisions at TeV,” Phys. Rev. D47 (1993) 4857–4871.
- [58] CDF Collaboration, F. Abe et al., “Double parton scattering in collisions at TeV,” Phys. Rev. D56 (1997) 3811–3832.
- [59] D0 Collaboration, V. M. Abazov et al., “Double parton interactions in +3 jet events in bar collisions TeV.,” Phys. Rev. D81 (2010) 052012, arXiv:0912.5104 [hep-ex].
- [60] LHCb Collaboration, R. Aaij et al., “Observation of double charm production involving open charm in pp collisions at = 7 TeV,” JHEP 06 (2012) 141, arXiv:1205.0975 [hep-ex]. [Addendum: JHEP03,108(2014)].
- [61] ATLAS Collaboration, G. Aad et al., “Measurement of hard double-parton interactions in + 2 jet events at =7 TeV with the ATLAS detector,” New J. Phys. 15 (2013) 033038, arXiv:1301.6872 [hep-ex].
- [62] CMS Collaboration, S. Chatrchyan et al., “Study of Double Parton Scattering Using W + 2-Jet Events in Proton-Proton Collisions at = 7 TeV,” JHEP 03 (2014) 032, arXiv:1312.5729 [hep-ex].
- [63] LHCb Collaboration, R. Aaij et al., “Production of associated Y and open charm hadrons in pp collisions at and 8 TeV via double parton scattering,” JHEP 07 (2016) 052, arXiv:1510.05949 [hep-ex].
- [64] ATLAS Collaboration, M. Aaboud et al., “Study of hard double-parton scattering in four-jet events in pp collisions at TeV with the ATLAS experiment,” JHEP 11 (2016) 110, arXiv:1608.01857 [hep-ex].
- [65] J.-P. Lansberg and H.-S. Shao, “Phenomenological analysis of associated production of in the decay channel at the LHC,” Nucl. Phys. B916 (2017) 132–142, arXiv:1611.09303 [hep-ph].
- [66] CMS Collaboration, A. M. Sirunyan et al., “Constraints on the double-parton scattering cross section from same-sign W boson pair production in proton-proton collisions at TeV,” JHEP 02 (2018) 032, arXiv:1712.02280 [hep-ex].
- [67] H. Fritzsch, “Producing Heavy Quark Flavors in Hadronic Collisions: A Test of Quantum Chromodynamics,” Phys. Lett. 67B (1977) 217–221.
- [68] F. Halzen, “Cvc for Gluons and Hadroproduction of Quark Flavors,” Phys. Lett. 69B (1977) 105–108.
- [69] G. T. Bodwin, E. Braaten, and J. Lee, “Comparison of the color-evaporation model and the NRQCD factorization approach in charmonium production,” Phys. Rev. D72 (2005) 014004, arXiv:hep-ph/0504014 [hep-ph].
- [70] J. Alwall, R. Frederix, S. Frixione, V. Hirschi, F. Maltoni, O. Mattelaer, H. S. Shao, T. Stelzer, P. Torrielli, and M. Zaro, “The automated computation of tree-level and next-to-leading order differential cross sections, and their matching to parton shower simulations,” JHEP 07 (2014) 079, arXiv:1405.0301 [hep-ph].
- [71] M. Bedjidian et al., “Hard probes in heavy ion collisions at the LHC: Heavy flavor physics,” 2004. arXiv:hep-ph/0311048 [hep-ph]. http://doc.cern.ch/cernrep/2004/2004-009/2004-009.html.
- [72] R. E. Nelson, R. Vogt, and A. D. Frawley, “Narrowing the uncertainty on the total charm cross section and its effect on the J/ψ cross section,” Phys. Rev. C87 no. 1, (2013) 014908, arXiv:1210.4610 [hep-ph].
- [73] Y.-Q. Ma and R. Vogt, “Quarkonium Production in an Improved Color Evaporation Model,” Phys. Rev. D94 no. 11, (2016) 114029, arXiv:1609.06042 [hep-ph].
- [74] M. L. Mangano, P. Nason, and G. Ridolfi, “Heavy quark correlations in hadron collisions at next-to-leading order,” Nucl. Phys. B373 (1992) 295–345.
- [75] ATLAS Collaboration, G. Aad et al., “Measurement of the differential cross-sections of prompt and non-prompt production of and in collisions at and 8 TeV with the ATLAS detector,” Eur. Phys. J. C76 no. 5, (2016) 283, arXiv:1512.03657 [hep-ex].
- [76] CMS Collaboration, V. Khachatryan et al., “Measurements of the (1S), (2S), and (3S) differential cross sections in pp collisions at 7 TeV,” Phys. Lett. B749 (2015) 14–34, arXiv:1501.07750 [hep-ex].
- [77] ALICE Collaboration, S. Acharya et al., “Inclusive J/ production at mid-rapidity in pp collisions at = 5.02 TeVInclusive J/ψ production at mid-rapidity in pp collisions at = 5.02 TeV,” JHEP 10 (2019) 084, arXiv:1905.07211 [nucl-ex].
- [78] CMS Collaboration, S. Chatrchyan et al., “Measurement of the , and Cross Sections in Collisions at = 7 TeV,” Phys. Lett. B727 (2013) 101–125, arXiv:1303.5900 [hep-ex].
- [79] R. D. Ball et al., “Parton distributions with LHC data,” Nucl. Phys. B867 (2013) 244–289, arXiv:1207.1303 [hep-ph].
- [80] A. Buckley, J. Ferrando, S. Lloyd, K. Nordstroem, B. Page, M. Ruefenacht, M. Schoenherr, and G. Watt, “LHAPDF6: parton density access in the LHC precision era,” Eur. Phys. J. C75 (2015) 132, arXiv:1412.7420 [hep-ph].
- [81] LHCb Collaboration, R. Aaij et al., “Production of J/psi and Upsilon mesons in pp collisions at sqrt(s) = 8 TeV,” JHEP 06 (2013) 064, arXiv:1304.6977 [hep-ex].
- [82] LHCb Collaboration, R. Aaij et al., “Measurement of forward production cross-sections in collisions at TeV,” JHEP 10 (2015) 172, arXiv:1509.00771 [hep-ex]. [Erratum: JHEP05,063(2017)].
- [83] LHCb Collaboration, R. Aaij et al., “Measurement of psi(2S) production cross-sections in proton-proton collisions at 7 and 13 TeV,” Eur. Phys. J. C80 no. 3, (2020) 185, arXiv:1908.03099 [hep-ex].
- [84] CMS Collaboration, V. Khachatryan et al., “Observation of (1S) pair production in proton-proton collisions at TeV,” JHEP 05 (2017) 013, arXiv:1610.07095 [hep-ex].