Muon spin rotation and infrared spectroscopy study of Ba1-xNaxFe2As2
Abstract
The magnetic and superconducting properties of a series of underdoped Ba1-xNaxFe2As2 (BNFA) single crystals with has been investigated with the complementary muon-spin-rotation (SR) and infrared spectroscopy techniques. The focus has been on the different antiferromagnetic states in the underdoped regime and their competition with superconductivity, especially for the ones with a tetragonal crystal structure and a so-called double-Q magnetic order. Besides the collinear state with a spatially inhomogeneous spin-charge-density wave (i-SCDW) order at and 0.26, that was previously identified in BNFA, we obtained evidence for an orthomagnetic state with a “hedgehog”-type spin vortex crystal (SVC) structure at and 0.34. Whereas in the former i-SCDW state the infrared spectra show no sign of a superconducting response down to the lowest measured temperature of about 10K, in the SVC state there is a strong superconducting response similar to the one at optimum doping. The magnetic order is strongly suppressed here in the superconducting state and at there is even a partial re-entrance into a paramagnetic state at .
I Introduction
The phase diagram of the iron arsenide superconductors is characterized by a close proximity of the antiferromagnetic (AF) and superconducting (SC) orders Paglione and Greene (2010); Basov and Chubukov (2011). This is exemplified by the prototypical system BaFe2As2 (Ba-122) for which large, high-quality single crystals are readily available. The undoped parent compound is an itinerant antiferromagnet with a Neel temperature of Paglione and Greene (2010). Upon electron- or hole doping in Ba(Fe1-xCox)2As2 (BFCA) Sefat et al. (2008) or Ba1-xKxFe2As2 (BKFA) Rotter et al. (2008) and Ba1-xNaxFe2As2 (BNFA) Wang et al. (2016); Yi et al. (2018), the AF order gets gradually suppressed and superconductivity emerges well before the magnetic order vanishes. In this so-called underdoped regime the AF and SC orders coexist and compete for the same low-energy electronic states Pratt et al. (2009); Marsik et al. (2010); Yi et al. (2014); Kim et al. (2014). Upon doping, the superconducting critical temperature, , and other SC parameters, like the magnetic penetration depth, , or the condensation energy, , are enhanced whereas the AF order parameter (the staggered magnetisation) is reduced. The full suppression of the static AF order is observed around optimum doping at which , , and reach their maximal values Storey et al. (2013); Hardy et al. (2016). A further increase of the doping leads to a decrease of in the so-called overdoped regime for which the AF spin fluctuations also diminish. This characteristic doping phase diagram is one of the reasons, besides the unconventional s symmetry of the SC order parameter, why AF fluctuations are believed to be responsible for the SC pairing Paglione and Greene (2010). Nevertheless, there exist other candidates for the SC pairing mechanism such as the nematic/orbital fluctuations Saito et al. (2011); Fernandes et al. (2014). Even a phonon mediated pairing or a coupled spin-phonon mechanism is not excluded yet Yndurain and Soler (2009); Xu et al. (2019).
There is also a strong coupling between the spin, orbital, and lattice degrees of freedom that is exemplified by the coupled AF and structural phase transition from a tetragonal paramagnetic state with symmetry at high temperature to an orthorhombic antiferromagnetic AF (o-AF) state with symmetry Boeri et al. (2010); Egami et al. (2010); Coh et al. (2016). For this o-AF state, which occupies major parts of the magnetic phase diagram, the spins are antiparallel along and parallel along , giving rise to a so-called single-Q or stripe-like AF order de la Cruz et al. (2008). Deviations from this o-AF order occur closer to optimum doping. For example, in BFCA the o-AF order and the associated lattice distortions are reported to become incommensurate and to be strongly suppressed by SC and eventually vanish below Pratt et al. (2011).
A different type of AF order, for which the lattice structure remains tetragonal ( symmetry), albeit with a fourfold enlarged unit cell, was recently observed in the hole-doped BKFA and BNFA systems Avci et al. (2014); Waßer et al. (2015); Böhmer et al. (2015); Allred et al. (2015); Mallett et al. (2015a, b); Allred et al. (2016). This tetragonal antiferromagnetic (t-AF) order can be described in terms of a so-called double-Q order due to a superposition of the single-Q states along and . It can be realized either with a non-collinear magnetisation of the single-Q components, corresponding to a so-called orthomagnetic or “spin-vortex-crystal” (SVC) order, or with a collinear magnetisation that gives rise to an inhomogeneous state for which the Fe magnetic moment either vanishes or is doubled Lorenzana et al. (2008); Khalyavin et al. (2014); Kang et al. (2015). The latter state is accompanied by a subordinate charge density wave, forming a so-called spin-charge-density wave (SCDW) Mallett et al. (2015a); Fernandes et al. (2016). Experiments on BNFA Mallett et al. (2015b) and BKFA Allred et al. (2015) have identified the SCDW order with the spins oriented along the c-axis direction Waßer et al. (2015), suggesting that spin-orbit interaction plays an important role Christensen et al. (2015). It is still unknown which factors are most relevant for stabilizing these single-Q and double-Q AF orders, and even an important role of disorder has been proposed Hoyer et al. (2016). In this context, it is interesting that a “hedgehog”-type orthomagnetic state has recently been identified in underdoped KCa(Fe1-xNix)4As4 for which the K+ and Ca2+ ions reside in separate layers that alternate along the c-axis. It has been speculated that the SVC order is stabilized here by the broken glide symmetry across the FeAs planes or by a reduced cation disorder Meier et al. (2018); Ding et al. (2018). Of equal interest is the recent observation of yet another magnetic phase in BNFA that occurs at , i.e. between the i-SCDW phase and optimum doping Wang et al. (2016). The latter is accompanied by a tiny orthorhombic distortion and therefore has been discussed in terms of an o-AF order with a very small magnetic moment Wang et al. (2016). Alternatively, it could be explained in terms of one of the SVC phases with tetragonal () symmetry that is somewhat distorted or coexists with a small fraction of the o-AF phase.
The above described questions have motivated us to further explore the complex magnetic phase diagram of the iron arsenides and its relationship with SC. Here, we present an experimental approach using the complementary techniques of muon spin rotation (SR) and infrared spectroscopy to study a series of BNFA single crystals that span the underdoped regime with its various magnetic phases. In particular, we provide evidence that the recently discovered AF phase that occurs shortly before optimum doping likely corresponds to an orthomagnetic “hedgehog”-type SVC order.
This paper is organized as follows. The experimental methods are presented in Section II. Subsequently, we discuss in Section III the SR data and in Section IV the infrared spectroscopy data. We conclude with a discussion and summary in Section V.
II Experimental methods
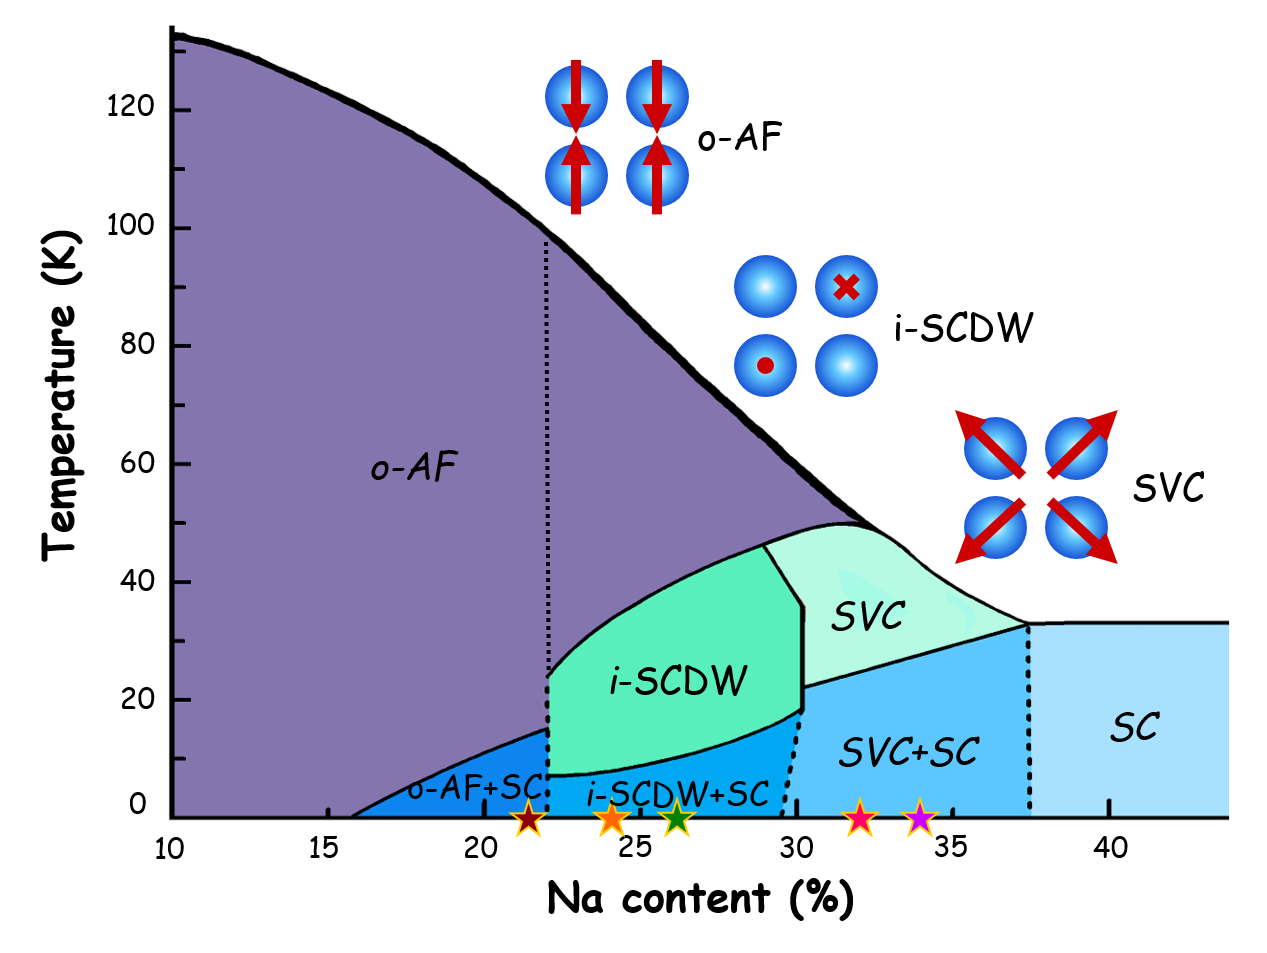
Ba1-xNaxFe2As2 (BNFA) single crystals were grown in alumina crucibles with an FeAs flux as described in Ref. Wang et al. (2016). They were millimeter-sized and cleavable yielding flat and shiny surface suitable for optical measurements. Selected crystals were characterized by x-ray diffraction refinement. For each crystal presented here, the Na-content, , was determined with electron dispersion spectroscopy with an accuracy of about 0.02 (estimated from the variation over the crystal surface). Figure 1 shows the location of these crystals in the temperature vs doping phase diagram (marked with stars) that has been adopted from Ref. Wang et al. (2016). It also shows sketches of the various o-AF, i-SCDW and SVC magnetic orders. The magnetic and superconducting transition temperatures of the crystals, or of corresponding crystals from the same growth batch, have been derived from transport and from thermal expansion and thermodynamic experiments as described e.g. in Ref. Wang et al. (2016). Except for the SC transition of the crystals in the SCDW state at and 0.26, the various magnetic and superconducting transitions have been confirmed with the SR and infrared spectroscopy measurements as described below. The bulk SC transition of the crystal at is evident from additional specific heat data that are also shown below.
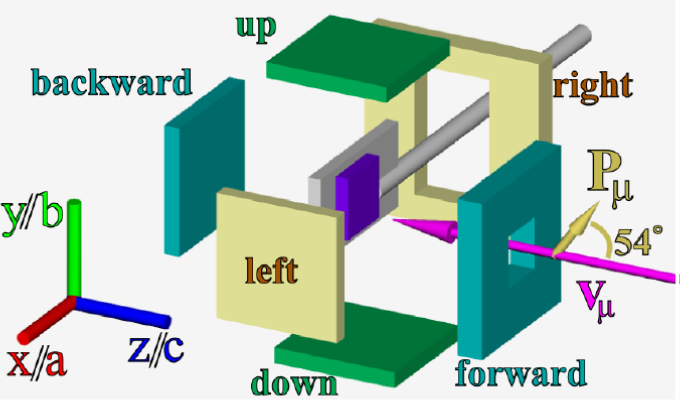
The SR experiments were performed at the general purposes spectrometer (GPS) at the M3 beamline of the Paul Scherrer Institute (PSI) in Villigen, Switzerland which provides a beam of 100% spin-polarized, positive muons. This muon beam was implanted in the crystals along the c-axis with an energy of about 4.2. MeV. These muons thermalize very rapidly without a significant loss of their initial spin polarization and stop at interstitial lattice sites with a depth distribution of about 100-200 m. The magnetic and superconducting properties probed by the muons are thus representative of the bulk. The muons sites are assumed to be the same as in BKFA with a majority and a minority site that account for about 80% and 20% of the muons, respectively. As discussed in the Appendix A and also shown in Fig. 3(a) of Ref. Mallett et al. (2015b), the majority site has a rather high local symmetry and is located on the line that connects the Ba and As ions along the c-axis (at the coordinate of the I4/mmm setting Christensen et al. (2015)). The minority site is located at and has a similar high local symmetry with the same direction and qualitative changes of the local magnetic field. The spin of the muons precesses in its local magnetic field, , with a frequency , where is the gyromagnetic ratio of the muon. In a SR experiment one measures the time evolution of the spin polarisation of an ensemble of (typically several million) muons, . This is done via the detection of the asymmetry of the positrons that originate from the radioactive decay of the muons with a mean life time of and which are preferentially emitted in the direction of P(t) at the instant of decay. This asymmetry is recorded within a time window of about 10-6 – 10-9 s which allows one to detect magnetic fields ranging from about 0.1 Gauss to several Tesla. Most of the zero-field (ZF) and transverse field (TF) experiments reported here were performed in the TF-geometry using the so-called upward (u) and downward (d) counters which have higher and more balanced count rates than the forward (f) and backward (b) counters. The signal of the pair of fb-counters was only used in combination with the one from the ud-counters for the determination of the direction of (as specified in the relevant figures). The initial asymmetry of the ud-counter in the so-called transverse-field (TF) geometry, for which the muon spin is rotated by about 54o (toward the upward counter) in the direction perpendicular to the momentum of the muon beam as shown in Fig. 2, is about 20-22%. This variation of the initial asymmetry typically arises from a difference in the size and the exact positioning of the samples with respect to the positron counters as well as the so-called veto counter that is used for small samples to reduce the background signal due to muons that missed the sample. Further details about the SR technique can be found e.g. in Refs. Schenck (1985); Lee et al. (1999); Brewer (1994).
The optical response was measured in terms of an in-plane reflectivity function at a near-normal angle of incidence with a Fourier-Transform Infrared (FTIR) spectrometer Bruker Vertex 70V in the frequency range from 40-8000 cm-1 with an in situ gold evaporation technique Homes et al. (1993). Data were collected at different temperatures between 10 K and 300 K using a ARS Helitran cryostat. Room temperature spectra of the complex dielectric function in the near-infrared to ultra-violet (NIR-UV) range of 4000-52000 cm-1 were obtained with a commercial Woollam VASE ellipsometer. The combined ellipsometry and reflectivity spectra were used to perform a Kramers-Kronig analysis to derive the complex optical response functions Dressel and Grüner (2002) which in the following are expressed in terms of the complex optical conductivity , or, likewise, the complex dielectric function, ), that are related according to . Below 40 cm-1 we extrapolated the reflectivity data with a Hagen-Rubens model in the normal state and a superconducting model below . On the high-frequency side above 52000 cm-1 we assumed a constant reflectivity up to 225000 cm-1 that is followed by a free-electron () response.
III Muon Spin Rotation - SR
We start with the discussion of the zero-field (ZF)-SR data for which only the internal magnetic moments contribute to the magnetic field at the muon site, .
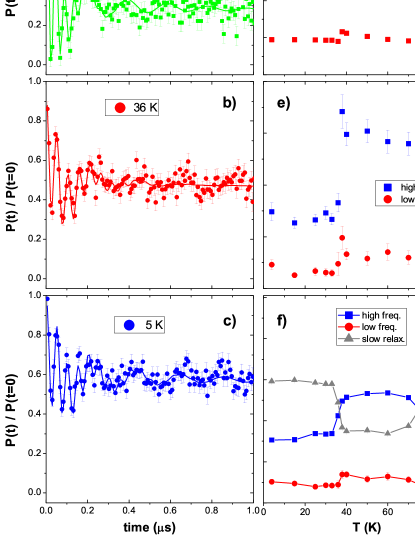
Figure 3 summarizes the (ZF)-SR study of the BNFA crystal with that exhibits a transition from a high temperature paramagnetic state to an o-AF state at and a subsequent transition to a t-AF and i-SCDW state at that is followed by a SC transition at . Figures 3(a)-3(c) display characteristic, time-resolved spectra of the evolution of the muon spin polarisation, , in the o-AF state at 50K and in the i-SCDW state at 36K and 5K. They exhibit clear oscillatory signals that are indicative of a bulk magnetic order. The solid lines show fits with the function:
| (1) |
where , , , and account for the relative amplitudes of the signal, the local magnetic field at the muon sites, the initial phase of the muon spin, and the relaxation rates, respectively. The two oscillating signals with amplitudes and arise from two muon sites with different local fields, as discussed in Ref. Mallett et al. (2015b). The non-oscillating signal results from the non-orthogonal orientation of P and . In addition, it contains a small contribution due to a non-magnetic background from muons that stopped outside the sample. The latter is typically less than 5% of the total signal.
The temperature dependence of the obtained fit parameters is displayed in Fig. 3(d) for the two precession frequencies, in Fig. 3(e) for the corresponding relaxation rates, and in Fig. 3(f) for the normalized amplitudes. All three parameters exhibit pronounced changes at . As outlined in Ref. Mallett et al. (2015b), the decrease of the precession frequency, the relaxation rate and the amplitude of the oscillatory signal below are indicative of a transition from the o-AF to a t-AF and i-SCDW order. The only difference with respect to BKFA in Ref. Mallett et al. (2015b) is that the present BNFA crystal does not show any sign of a re-entrance towards an o-AF state below , i.e. it remains in the i-SCDW state down to 5K without any noticeable anomaly at .
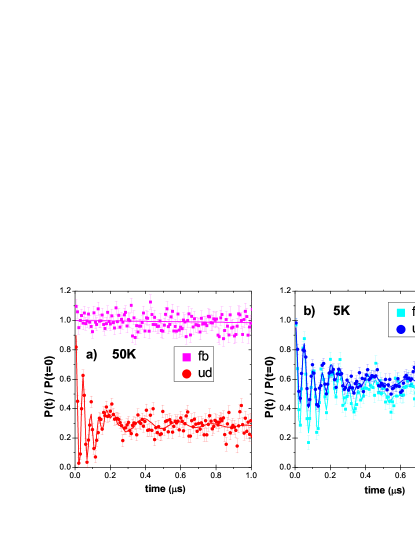
Figures 4(a) and 4(b) reveal that the ZF-SR data show clear signatures of a change of the Fe-spin direction from an in-plane orientation in the o-AF phase to a c-axis orientation in the i-SCDW state. This is evident from the comparison of the amplitudes of the oscillatory signals of two different pairs of positron counters, i.e. of the upward (u) and downward (d) counters and the forward (f) and backward (b) counters (a sketch of the counter geometry is shown in Fig. 2). According to the calculations in Appendix B, the in-plane oriented Fe spins in the o-AF phase give rise to a local magnetic field at the muon site, , that is pointing along the c-axis, . This is because of the high symmetry of the majority muon site which is on a straight line between the As and Ba (or Na) ions. To the contrary, the c-axis oriented spins (on every second Fe site) in the i-SCDW phase cause to be parallel to the ab-plane, Mallett et al. (2015b). From the sketch in Fig. 2 it is seen that the former case with (o-AF phase) gives rise to a vanishing oscillatory signal for the fb-counters and a large oscillatory signal for the ud-counters. Such a behavior is evident for the ZF-SR spectra in the o-AF phase at 50K in Fig. 4(a). In contrast, for the ZF-spectra at 5K in the t-AF and i-SCDW state in Fig. 4(b), the fb-counters exhibit a large oscillatory signal that is characteristic of an in-plane orientation of due to a c-axis orientation of the spins.
Note that this change of the direction of is also evident from the TF-SR spectra (not shown) for which in the o-AF phase the applied field Bext and the field from the magnetic moments Bmag are along the c-axis, yielding , whereas in the i-SCDW phase Bmag is along the ab-plane such that Mallett et al. (2015b).
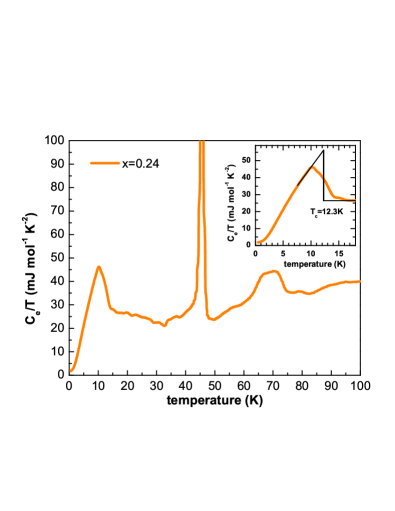
Our SR data thus provide clear evidence that the BNFA crystal with undergoes a transition from a bulk o-AF state below with in-plane oriented spins to a bulk i-SCDW phase below that persists to the lowest measured temperature of 5K, even well below the SC transition at . The bulk nature of the superconducting state with is evident from the specific heat data shown in Fig. 5 for which the phonon contribution has been subtracted as described in Ref. Wang et al. (2016). As detailed in the inset, the value of has been determined by the midpoint of the specific heat jump using an entropy conserving construction (black line). The bulk nature of SC is evident from the more or less complete suppression of the electronic specific heat at very low temperature. The specific heat curves also exhibit two more strong peaks at higher temperature that are due to the magnetic transitions into the o-AF state and the i-SCDW state at and , respectively. Note that these magnetic transition temperatures are somewhat lower than the ones obtained from the SR data in Fig. 4. Since the specific heat measurements have been performed on a smaller piece that was cleaved from the thick crystal measured with SR (from the same side from which the infrared data have been obtained), the difference of the and values is most likely due to a variation of the Na content that is within the limits of as determined with electron dispersion spectroscopy. Finally, note that the SR data of the BNFA crystal with (not shown) reveal a corresponding behavior as described above with two magnetic transitions from an o-AF phase below to a i-SCDW phase below .
Next, we discuss the ZF-SR data of the BNFA crystal with and a Neel temperature of and . The nature of this AF order, which appears just shortly before static magnetism vanishes around optimal doping, remains to be identified. The thermal expansion measurements of Ref. Wang et al. (2016) have shown that this AF order is accompanied by a very weak orthorhombic lattice distortion. In addition, magnetization measurements on Sr1-xNaxFe2As2 crystals with a corresponding magnetic order revealed an in-plane orientation of the magnetic moments Wang et al. (2019). Accordingly, these data have been interpreted in terms of an o-AF order with a very small magnetic moment Wang et al. (2016) or a small magnetic volume fraction. To the contrary, our ZF-SR data in Fig. 6 establish that this magnetic order is very strong and bulk-like (at least at ).
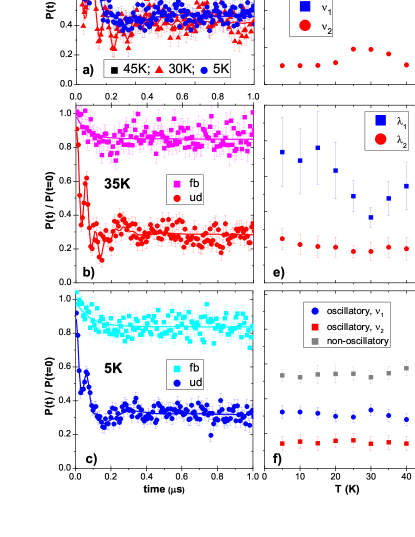
Figure 6(a) confirms that the ZF-spectra below exhibit a large oscillatory signal with a rather high precession frequency. The temperature dependence of the precession frequencies and (due to the two different muon sites) and of the corresponding amplitudes, as obtained from fitting with the function in eq. (1), are displayed in Figs. 6(d) and 6(f), respectively. The value of increases steeply below and reaches a maximum of at 25 K. The latter is only about 10% lower than the one obtained for the sample in the o-AF state where it reaches a maximum of at 40 K (see Fig. 3(d)). Note that the precession frequency is proportional to and thus to the magnitude of the magnetic moment, given that the muon site remains the same (which is most likely the case). Figure 6(f) shows that the amplitude of the oscillatory signal amounts to about 60% of the total amplitude. Assuming that the local field is pointing along the c-axis and thus is at an angle of 54o with respect to P (see Fig. 2), this suggests that the magnetic volume fraction is close to 100%. The SR data are therefore incompatible with an o-AF state that has a small magnetic moment or only a very small volume fraction.
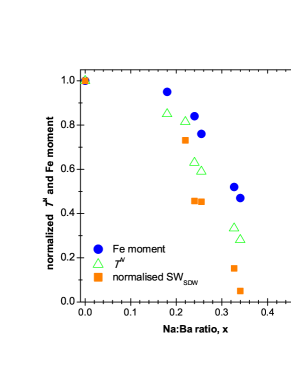
Instead, it seems likely that the observed magnetic state at corresponds to the orthomagnetic, so-called “hedgehog”-type SVC order for which the spins are oriented within the ab-plane as shown in the Appendix B and sketched in Fig. 1. The in-plane orientation of the magnetic moments is evident from the comparison of the ZF-SR spectra of the forward-backward (fb) and up-down (ud) pairs of positron counters in Figs. 6(b) and 6(c). Here the fb-signal has no detectable oscillatory component, meaning that is mainly directed along the c-axis and the magnetic moments thus are oriented within the ab-plane. The small component (about 15%) with a fast initial relaxation might arise from disordered regions. It might arise from a minority o-AF phase that would also explain the small orthorhombic distortion seen in Ref. Wang et al. (2016). Our SR data are thus indicative of an SVC order at as discussed in the Appendix B and sketched in Fig. 1. According to the calculations in Appendix B, the value of for the loop-type SVC order is zero whereas for the hedgehog-type SVC order it is about 40% higher than for the single-Q AF order (assuming the same magnitude of the magnetic moment). When comparing the values of the precession frequencies with the one of the parent compound at x=0, with and a magnetic moment of about 1 /Fe ion as reported in Refs. Bernhard et al. (2012); Aczel et al. (2008), we thus obtain an estimate of the magnetic moment of the hedgehog SVC phase at of about 0.5 /Fe ion. Likewise, the magnetic moment in the o-AF phase at with at 40K amounts to 0.85 /Fe ion. Figure 7 shows the resulting doping dependence of the estimated magnetic moment and the corresponding Neel temperature which both evolve continuously and tend to vanish around .
Notably, Fig. 6(d) reveals that the onset of SC at is accompanied by a pronounced reduction of the precession frequency, from at to at , and thus of the magnetic moment of the SVC order. Figure 6(e) shows that there is also a clear increase of the relaxation rate below , which suggests that the magnetic order parameter becomes less homogeneous in the SC state. Nevertheless, the amplitude of the magnetic signal does not show any sign of a suppression below , suggesting that the magnetic order remains a bulk phenomenon even at .
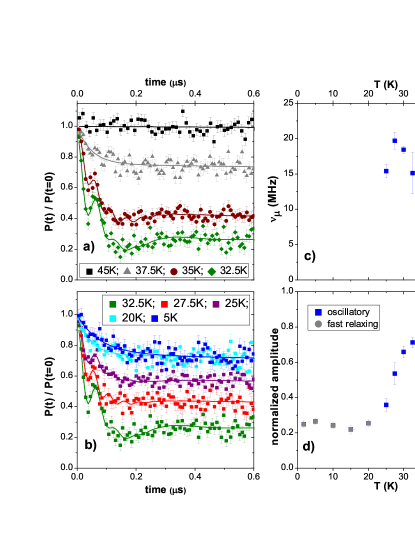
Figure 8 reveals that the suppression of the magnetic order due to the competition with SC becomes even more severe for the BNFA crystal with . The magnetic signal in the ZF-spectra develops here below and the frequency and amplitude of the precession signal are rising rapidly to values of and about 65%, respectively, at 30K. These are characteristic signatures of a bulk AF order that seems to be of the SVC type for the same reasons as discussed above for the crystal. Notably, the onset of SC below at gives rise to a much stronger suppression of the magnetic order than at . Not only the frequency is rapidly suppressed here but, as shown in Fig. 8(d), even the amplitude of the magnetic signal gets strongly reduced to about 25% below 20K. This highlights that the magnetic order becomes spatially inhomogeneous with a large fraction of the sample re-entering a paramagnetic state. A similar re-entrance behaviour of the AF order was previously only observed for BFCA crystals in the region very close to optimum doping Pratt et al. (2009).
This re-entrance of large parts of the sample volume from a magnetic state at to a non-magnetic state at is also evident from the 100G TF-SR data in Fig. 9. The solid lines in Figs. 9(a)-9(c) show fits with the function:
| (2) |
The first two terms describe the magnetic signal. The fast relaxing one with the normalized amplitude, , accounts for the strongly damped or even overdamped oscillatory part and the constant term with amplitude, , for the non-oscillatory part of the magnetic signal that arises below . The third term represents the non-magnetic signal with a Gaussian relaxation rate, . The value of is much smaller than the one of and is governed above by the nuclear spins and below by the SC vortex lattice. The frequency of this non-magnetic signal is determined by the external magnetic field, except for the diamagnetic shift in the SC state. In contrast, the signal from the magnetic regions is governed by the internal magnetic moments (the contribution of the 100G TF is considerably smaller) which yield a higher frequency and a much faster relaxation such that this signal vanishing on a time scale of less than 0.5 s.
Figure 9(d) shows the temperature dependence of the normalized amplitudes of the magnetic signals and , and of the non-magnetic signal, . It reveals that the magnetic volume fraction increases rapidly to about 80% at 30K and then decreases again below to about 35% at low temperature. Correspondingly, the non-magnetic fraction is reduced to about 20% at 30K and increases again to about 65% well below . Figures 9(e) and 9(f) show that this non-magnetic part exhibits clear signs of a SC response in terms of a diamagnetic shift and an enhanced relaxation from the SC vortex lattice, respectively, that both develop below . From this Gaussian relaxation rate the value of the in-plane magnetic penetration depth, , can be derived according to: , as outlined, e.g., in Refs. Pümpin et al. (1990); Bernhard et al. (1995). This yields a low temperature value of the magnetic penetration depth of and for the related SC condensate density of , where , , , are the magnetic vacuum permeability, the elementary charge of the electron, and the effective band mass and bare mass of the electron, respectively. This value has to be viewed as an upper limit to the penetration depth (lower limit to the condensate density), since the Gaussian function is symmetric in frequency space and thus does not capture the asymmetric “lineshape” of the frequency distribution due to a vortex lattice which has a tail toward higher frequency. Also note that from these SR data we cannot draw firm conclusions about the SC properties in the magnetic regions for which the relaxation due to the SC vortex lattice is much weaker than the magnetic one.
IV Infrared Spectroscopy
The SR study of the magnetic and superconducting properties of the BNFA crystals presented in Section III has been complemented with infrared spectroscopy measurements as shown in the following.
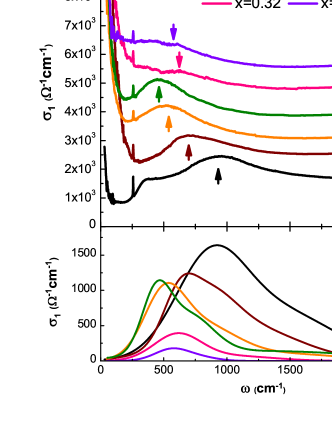
Figure 10 gives an overview of the temperature dependent spectra of the measured reflectivity (upper panels) and of the obtained real part of the optical conductivity (lower panels) for the crystals with and that cover the different AF orders of the BNFA phase diagram in the normal and in the superconducting states (see Fig. 1).
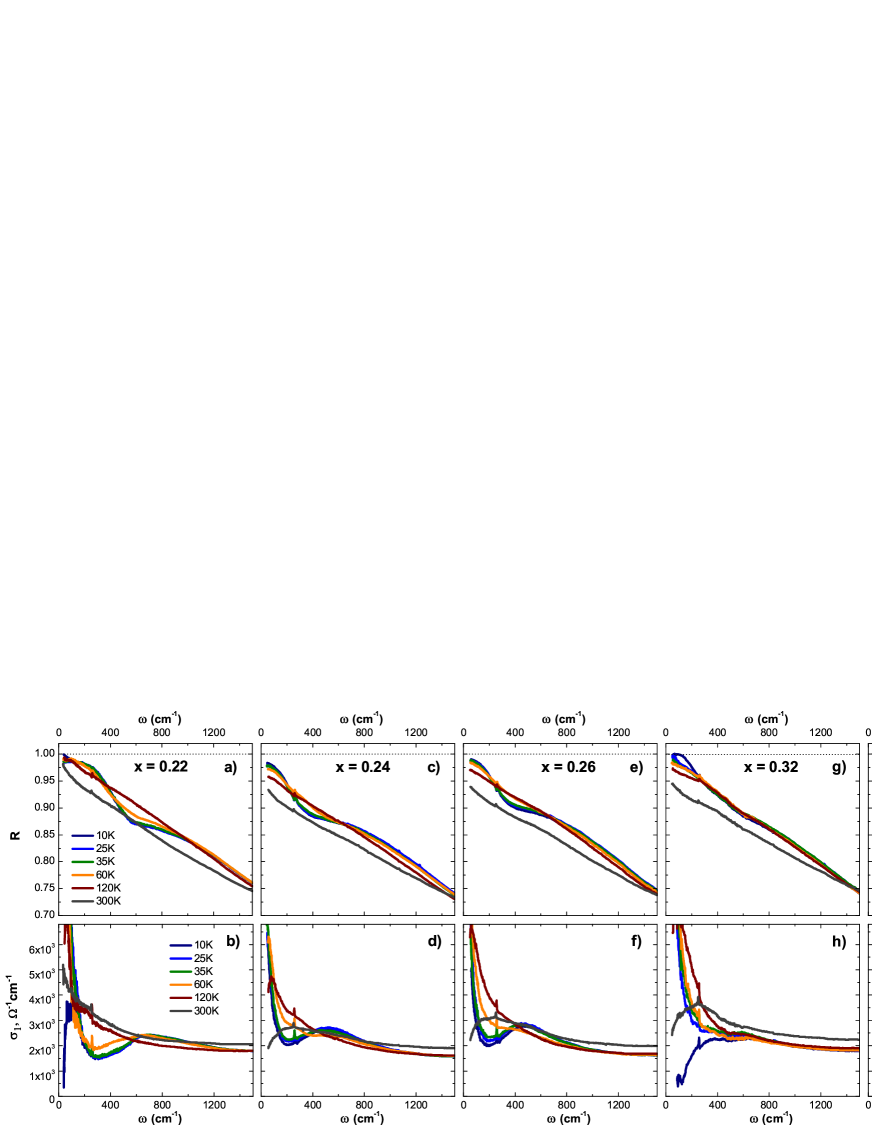
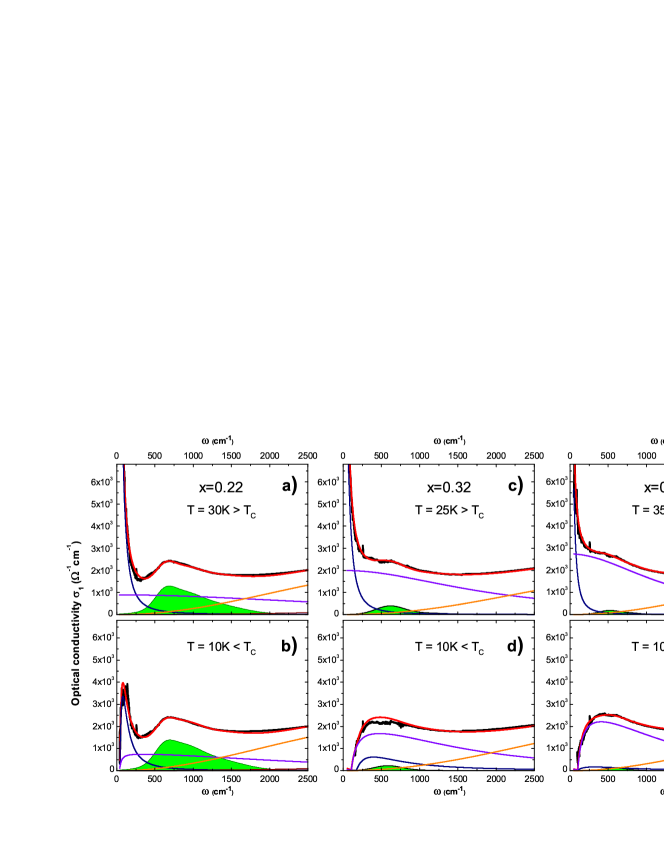
Figure 11 displays representative spectra of the infrared conductivity in the paramagnetic and the various AF states and shows their fitting with a model function that consists of a sum of Drude-, Lorentz- and Gaussian oscillators:
| (3) |
The first term contains two Drude peaks that account for the response of the itinerant carriers, each described by a plasma frequency, , and a broadening that is proportional to the scattering rate, . The Lorentz oscillators in the second term with an oscillator strength, , resonance frequency, , and linewidth , describe the low energy interband transitions in the mid-infrared region that are typically weakly temperature dependent Marsik et al. (2013). The Gaussian oscillators in the third term with the oscillator strength, , eigen-frequency, , and linewidth, , represent the so-called pair-breaking peak that develops in the itinerant AF state due to the excitation of the electronic quasi-particles across the gap of the spin density wave (SDW) Dressel and Grüner (2002). The spectral weight of this SDW peak originates from the Drude-bands whose spectral weight is accordingly reduced below . The sharp and much weaker feature around 260 cm-1 corresponds to an infrared-active phonon mode, the so-called Fe-As stretching mode Akrap et al. (2009), that has not been included in the modelling.
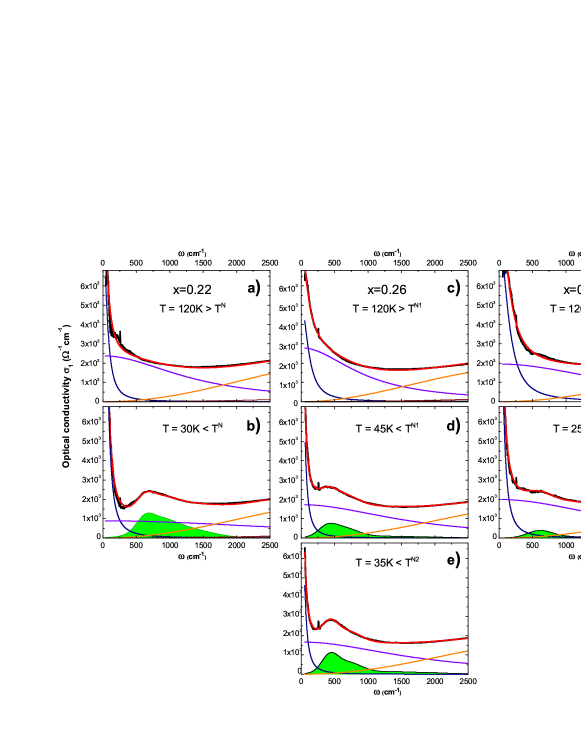
The upper row of panels in Fig. 11 shows the spectra in the paramagnetic state at that are described by a sum of two Drude-bands, a broad and a narrow one, plus one Lorentzian oscillator. A similar model was previously used to describe the spectra in the paramagnetic normal state of corresponding BKFA and BFCA crystals Wang et al. (2016); Wu et al. (2009); Barišić et al. (2010); Kim et al. (2010); van Heumen et al. (2010); Dai et al. (2013); Xu et al. (2017); Mallett et al. (2017). Based on the comparison with the electronic scattering rate of Raman experiments in the so-called and scattering geometries of the incident and reflected laser beam Muschler et al. (2009), which allow one to distinguish between the response of the hole-like and electron-like bands, we assign the broad Drude-peak in the infrared response to the hole-like bands near the center of the Brilluoin-zone (-point) and the narrow Drude-peak to the electron-like bands near the boundary of the Brilluoin-zone (-point), respectively.
The lower panels of Fig. 11 show corresponding spectra and their fitting for the different AF phases in the normal state above . The spectra are described by two additional Gaussian functions to account for the spectral weight that is accumulated above the SDW gap at . This so-called SDW peak arises from the quasi-particle excitations across the SDW gap. Its area (shaded in green) is a measure of the spectral weight of the itinerant charge carriers that contribute to the staggered magnetic moment of the SDW and thus is representative of the magnitude of the AF order parameter, see e.g. Figs. 3 and 8 of Ref. Mallett et al. (2017).
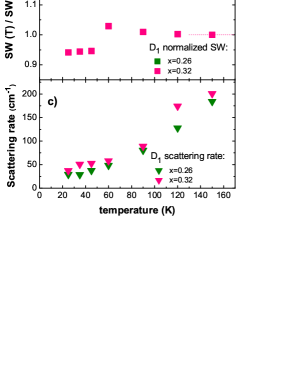
Figure 12 gives a full account of the obtained temperature dependence of the spectral weight (SW) of the SDW peak for the series of BNFA crystals. Also shown, for comparison, are the corresponding data for the undoped parent compound at that are adopted from Ref. Mallett et al. (2017). The various AF and SC transition temperatures are marked with arrows in the color code of the experimental data. Figure 12 reveals that the spectral weight of the SDW peak is continuously suppressed as a function of hole doping, . Concerning the temperature dependence, for the sample with , which exhibits an o-AF order and an orthorhombic () structure below , the SW of the SDW grows continuously below , without any noticeable anomaly due to the competition with superconductivity below . For the samples with and , the SW of the SDW peak exhibits a sudden, additional increase at the transition from the intermediate o-AF state with symmetry below to the i-SCDW order with symmetry below . A similar SW increase of the SDW peak in the i-SCDW state was previously reported in Ref. Mallett et al. (2015a) for a corresponding BKFA crystal. For the BNFA samples at and the infrared spectra show no sign of a bulk-like superconducting response down to the lowest measured temperature of 10K. Note, however, that a bulk SC transition with at is evident from the specific heat data in Fig. 5. Finally, at and the SDW peak acquires only a rather small amount of SW in the spin vortex crystal (SVC) state below and , respectively, that is assigned based on the SR data as discussed in section III. Nevertheless, as shown in Figs. 10 and 12, a SDW peak can still be identified in the infrared spectra. Moreover, pronounced anomalies occur in the SC state below and , respectively, where the SW of the SDW peak is reduced. This SC-induced suppression of the SDW peak corroborates the SR data which reveal a corresponding suppression of the ordered magnetic moment at and of the magnetic volume fraction at (see Figs. 6 and 8, respectively).
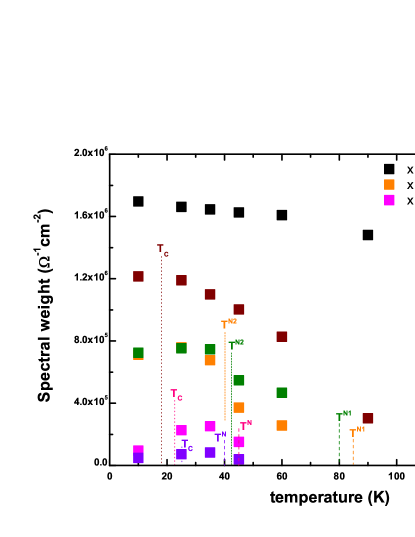
Figure 13 shows for the example of the and samples how the spectral weight and the scattering rate of the narrow () and broad () Drude peaks are affected by the formation of the SDW. The scattering rate of the broad Drude-peak remains almost constant and therefore has been fixed to reduce the number of fit parameters. Figure 13c shows that the scattering rate of the narrow Drude peak is strongly temperature dependent and exhibits a pronounced decrease toward low temperature that is quite similar for both samples. The most significant difference between the and samples concerns the spectral weight loss of the Drude peaks in the AF state that occurs due to the SDW formation, see Figs. 13(a) and (b). At , the broad Drude peak shows a pronounced spectral weight loss in the AF state whereas the spectral weight of the narrow Drude-peak remains almost constant or even increases slightly below . A similar behavior was reported for the undoped parent compound Dai et al. (2016) and, recently for an underdoped Sr1-xNaxFe2As2 crystal that undergoes a corresponding transition from o-AF to i-SCDW order Yang et al. (2019). To the contrary, for the sample in the assigned hedgehod SVC state, the major spectral weight loss involves the narrow Drude-peak (), whereas the SW of the broad Drude peak () remains almost constant. Since the narrow Drude peak is believed to arise from the electron-like bands near , and the broad Drude peak from the hole-like bands near , the results in Fig. 13a,b suggest that the o-AF and i-SCDW orders are giving rise to gaps primarily on the hole-like bands near , whilst the SVC order mostly causes a SDW gap on the electron-like bands near .
A different trend in the assigned SVC state, as compared to the one in the o-AF and the i-SCDW states, is also evident from the doping dependence of the frequency of the SDW peak. Figure 14a shows a comparison of the optical conductivity spectra in the AF state at 25K and Fig. 14b the evolution of the Gaussian fits of the SDW peak as detailed in Fig. 11. Whereas the SW of the SDW peak decreases continuously with hole doping (as was already discussed above and shown in Fig. 11), the peak frequency also decreases at first in the o-AF and i-SCDW states, from about 700 cm-1 at to about 400 cm-1 at , but then increases again to about 600 cm-1 in the SVC state at and . Since the SDW peak energy is expected to be proportional to the magnitude of the SDW gap, this anomaly suggests that the average magnitude of the SDW gap in the SVC state exceeds the one in the i-SCDW state. The combined evidence from our infrared data thus suggests that the SVC order at and involves an electron-like band around the -point that has quite a large SDW gap but only a weak contribution to the optical spectral weight. The latter point can be explained either in terms of a very low concentration or a large effective mass of the charge carriers of this band.
Additional information about the structural changes in the different AF phases has been obtained from the temperature and doping dependence of the infrared-active phonon mode around 260 cm-1 that is summarized in Figure 15. It was previously reported for BKFA that this in-plane Fe-As stretching mode develops a side band at a slightly higher energy in the i-SCDW state Mallett et al. (2015a, 2017). This new feature was explained in terms of an enlarged unit-cell and a subsequent Brillouin-zone folding due to the presence of two inequivalent Fe sites (with and without a static magnetic moment) in the i-SCDW state Mallett et al. (2015a). Figure 15 confirms that a corresponding phonon side band occurs in BNFA at and in terms of an additional peak around 275 cm-1 that develops right below . Notably, such a satellite peak is not observed in the assigned SVC phase at and . This finding confirms that the enlargement of the unit cell and the subsequent BZ folding is unique to the i-SCDW order and emphasizes the distinct nature of the SVC order at and .

Finally, we discuss how the onset of superconductivity affects the spectra of the infrared conductivity in the presence of the different AF orders. Figure 16 shows the corresponding changes to the optical conductivity due to the formation of the SC gap(s) for the samples in the o-AF state at and in the assigned SVC state at and . For the samples in the i-SCDW state at and no sign of the formation of a SC gap and a related delta-function at zero frequency due to a SC condensate has been observed down to the lowest measured temperature of 10K (see Figs. 10c-f). As shown in Fig. 5, this is despite of a bulk SC transition at at measured with the specific heat. Our infrared data thus reflect a strong suppression of the superconducting response due to the competition with the i-SCDW order that is more severe than in the o-AF and the assigned SVC states. Finally, note that clear signatures of a SC energy gap have very recently been reported for a similar BNFA sample for which was somewhat higher and the measurements were performed to a lower temperature of 5K Yang et al. (2019).
The upper panels of Fig. 16 show the spectra in the normal state slightly above for which the fitting has already been shown in Fig. 11. The lower panels display the corresponding spectra and their fitting in the SC state. Here the optical conductivity at low frequency (below 50 cm-1 at , 120 cm-1 at and 100 cm-1 at ) is strongly suppressed due to the opening of the superconducting energy gap(s). This SC gap formation has been accounted for using a Mattis-Bardeen-type model that allows for isotropic gaps of different magnitude on the narrow and the broad Drude-bands.
For the crystal, for which the SC state coexists with a strong o-AF order, there are clear signs of the SC gap formation below , i.e. Figure 16b reveals a strong suppression of the optical conductivity toward low frequency. The SC gap edge is also evident from the bare reflectivity spectrum in the inset of Fig. 10(a). The obtained gap energies amount to meV and 5.2 meV for the broad and narrow Drude-bands, respectively, and ratios of and 3.35 that compare rather well with the prediction of the weak coupling BCS theory of .
A strong increase of the SC gap energy is observed for the samples in the SVC state at (Fig. 16, middle panel) and (Fig. 16, right panel) for which the overall shape of the SC spectra is quite similar to the one of optimally doped BKFA Wu et al. (2009); Mallett et al. (2017); Xu et al. (2016); Charnukha et al. (2011a, b). Here for the narrow and broad Drude-bands amounts to 19.8 meV and 13 meV at , and 30 meV and 12 meV at , respectively (see also Table 1). Similar to BCFA and BKFA Kim et al. (2010); van Heumen et al. (2010); Xu et al. (2017); Yang et al. (2019) and also BCKFA Yang et al. (2017), the larger SC gap is assigned to the narrow Drude-peak, which supposedly originates from the electron-like bands near the -point of the Brillouin zone.
Finally, we derived the SC plasma frequency, , and the related ratio of the condensate density to the effective band mass, , from the analysis of the missing spectral weight using the Ferrell-Glover-Tinkham (FGT) sum rule:
| (4) |
where the upper cutoff frequency has been chosen such that the optical conductivity in the normal and SC states is almost identical above .
Alternatively, the superfluid density has been determined from the analysis of the inductive response in the imaginary part of the optical conductivity, , according to:
| (5) |
Here the contribution of the regular response to , due to the excitation of unpaired carriers, has been subtracted as described in Refs. Dordevic et al. (2002); Zimmers et al. (2004). Both methods yield consistent values of the SC condensate density, , and the related magnetic penetration depth, , that are listed in Table 1.
| x (Na) | (meV) | (meV) | (cm-2) | (nm) | ||
|---|---|---|---|---|---|---|
| 0.22 | 5.21 | 3.35 | 4.46 | 2.87 | 4.9 | 227 |
| 0.32 | 19.84 | 10.46 | 13.14 | 6.93 | 6.2 | 202 |
| 0.34 | 30.75 | 14.27 | 12.65 | 5.87 | 5.4 | 216 |
V Discussion and Summary
We have performed a combined SR- and infrared spectroscopy study of the magnetic part of the phase diagram of the hole doped BNFA system. We have confirmed that the so-called double-Q AF state with an inhomogeneous spin-charge density wave (i-SCDW) order exists in a sizable doping range where it persists to the lowest measured temperature, i.e. even below . This is different from BKFA where the i-SCDW order exists only in a rather narrow doping regime and exhibits a re-entrance to an o-AF state at low temperature Böhmer et al. (2015); Mallett et al. (2015a, b, 2017). Otherwise, we observed the same signatures of the i-SCDW state as in BKFA. This concerns the reorientation of the spins from an in-plane direction in the o-AF state to an out-of-plane one in the i-SCDW state. We also observed a satellite peak of the infrared-active Fe-As stretching phonon mode, which signals a folding of the Brilluoin zone due to an enlarged unit cell in the i-SCDW state. In the infrared spectra, at the lowest measured temperature of 10K, no sign of a bulk-like SC response has been seen with infrared spectroscopy in the i-SCDW state of the BNFA crystals with and 0.26, for which a bulk SC transition is evident from specific heat. This suggests that the superconducting response is strongly suppressed by the competition with i-SCDW order.
We also obtained evidence for a new type of t-AF state that is likely a hedgehog-type spin-vortex-crystal (SVC) order. This new AF phase shows up at a higher hole doping level than the i-SCDW phase and persists until the static magnetism is fully suppressed at optimum doping. This additional magnetic phase in the BNFA phase diagram was first discovered with thermal expansion measurements where it shows up in terms of a very small orthorhombic distortion Wang et al. (2016). Accordingly, it has been interpreted in terms of an o-AF order that is either very weak, strongly incommensurate, or inhomogeneous. To the contrary, our SR data establish that this AF state is bulk-like, more or less commensurate and has a surprisingly large magnetic moment (at least at ). Due to its almost tetragonal structure and since the SR data reveal magnetic moments that are rather large and oriented along the FeAs planes, we have assigned this new AF order to an orthomagnetic double-Q state, in particular, to the hedgehog-type spin vortex crystal (SVC) structure. This SVC state was previously only observed in the K,Ca-1144 structure where it is believed to be stabilized by the reduced disorder and/or the breaking of the glide-plane symmetry of the FeAs layers due to the alternating layers of Ca and K ions Meier et al. (2018); Ding et al. (2018). It is therefore interesting that this kind of SVC order also occurs in the present BNFA system for which the Na and Ba ions are randomly distributed. Another remarkable feature of this SVC order is its very strong competition with superconductivity which leads to a large reduction of the magnetic moment (at ) and even of the magnetic volume fraction (at ). A similarly large suppression of magnetic order due to the onset of SC was so far only observed in BFCA crystals close to optimum doping for which a very weak incommensurate o-AF order exhibits a re-entrance into a non-magnetic state below Pratt et al. (2011).
Another interesting aspect of our present work emerges from the comparison of the doping evolution of the magnitude of the ordered magnetic moment as deduced from the local magnetic field in the SR experiment and the SW of the SDW peak in the infrared spectroscopy data. The trends can be seen in Figure 7 which compares the doping evolution of the AF moment, normalized to the one of the undoped parent compound, as seen with SR (which probes the total ordered magnetic moment) and infrared spectroscopy (which is only sensitive to the itinerant moment). The solid blue symbols show the value of the AF order parameter as obtained from the local magnetic field at the muon site. The solid orange symbols show the corresponding values of the SW of the SDW peak. In both cases, the amplitude of the magnetic moment decreases continuously with doping, but the decrease is considerably stronger for the itinerant moments deduced from the infrared data, than for the total magnetic moment seen with SR. This might indicate that the ordered magnetic order has a mixed character with contribution from itinerant and from localized moments. The different trends of the optics and SR data thus could be explained if the magnetic moments are more strongly localized as the hole doping increases. An alternative, and to our opinion more likely explanation is in terms of a change of the effective mass of the itinerant charge carriers that are gapped by the SDW. The very small SW of the SDW peak in the SVC state, as compared to the large local magnetic field in the SR experiment, thus implies that the SDW gap develops on a flat band with a rather large effective mass. Note that such a scenario, that the SDW develops on different parts of the Fermi-surface in the SVC state, as compared to the o-AF and i-SCDW states, is consistent with the data in Figure 13 which show that the SDW peak obtains a major part of its SW from the narrow Drude peak, rather than from the broad one, as in the o-AF and i-SCDW states. This scenario could be probed e.g. by future ARPES studies on such BNFA crystals in the i-SCDW and SVC states.
Appendix A Muon site calculation
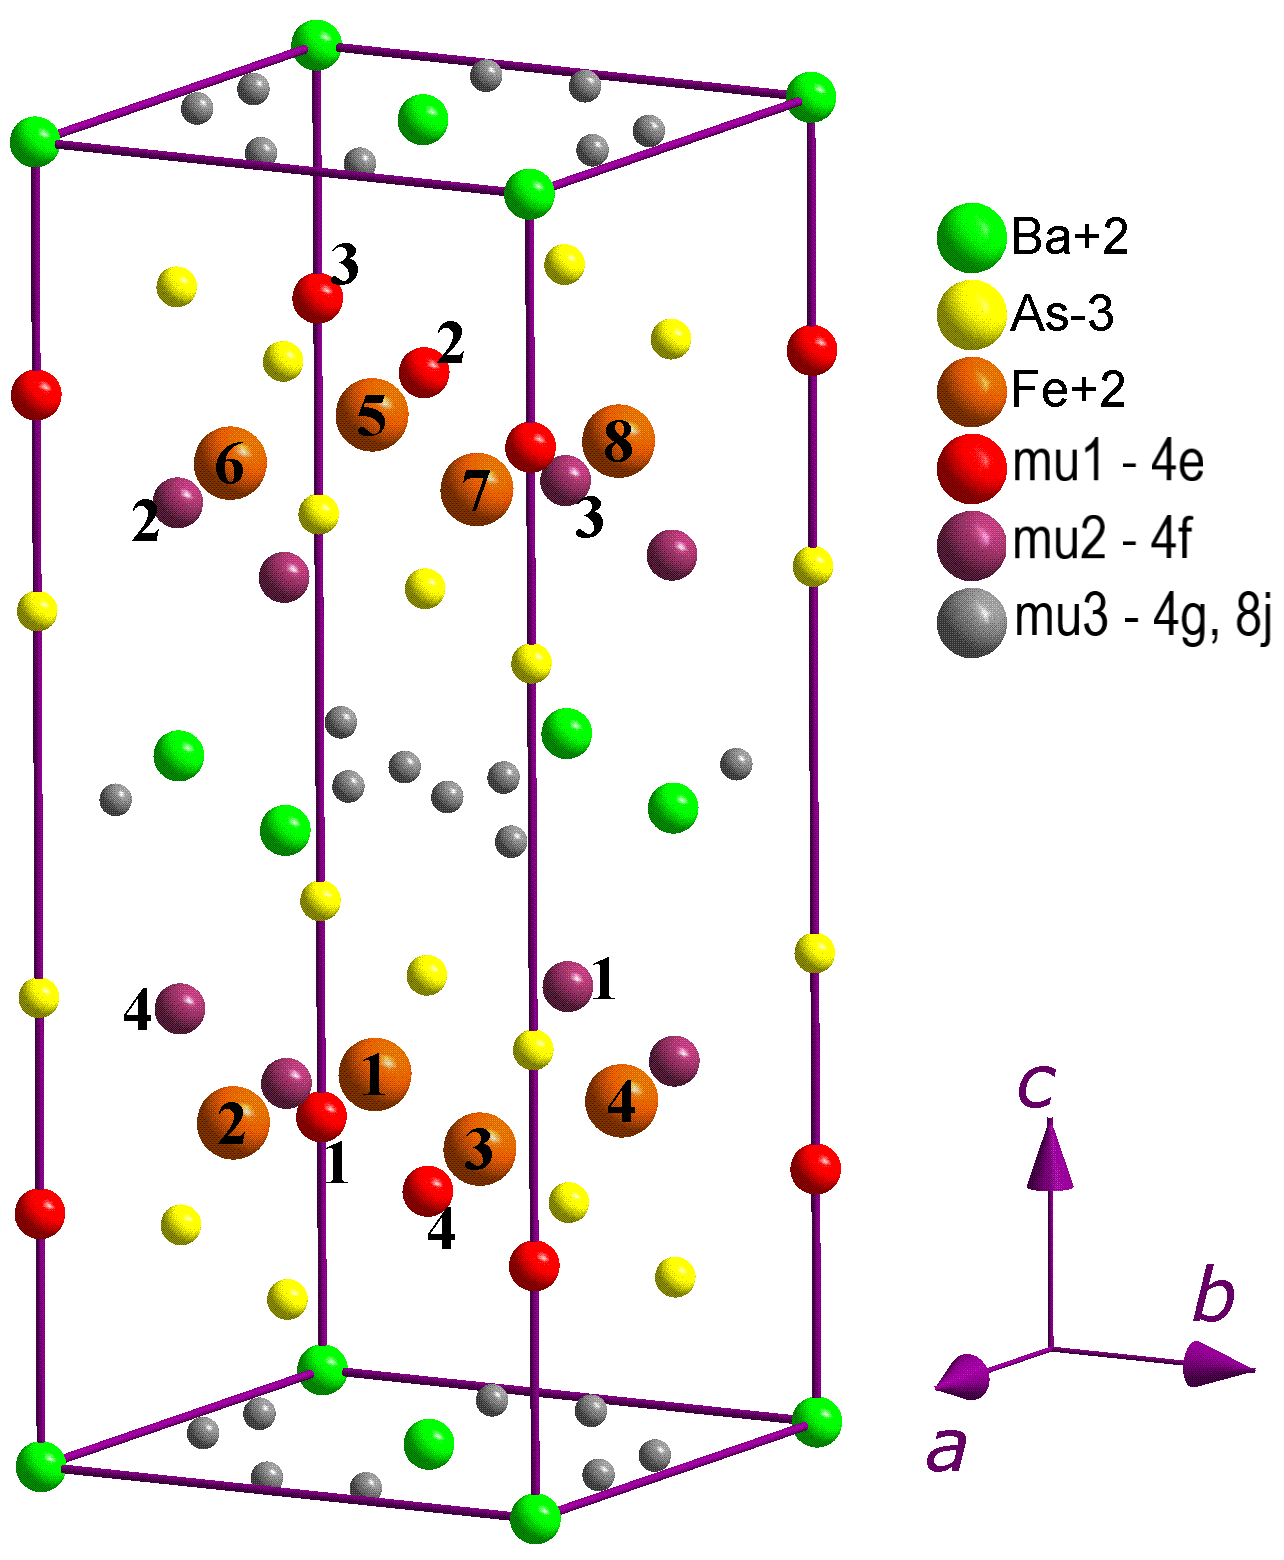
The space group symmetry of Ba1-xKxFe2As2 (BKFA) and Ba1-xNaxFe2As2 (BNFA) in the paramagnetic phase is I4/mmm with one formula unit () in the primitive cell. The Ba ions reside in the 1a – position , As in the 2e – position and Fe in the 2d – position . Note that the crystallographic unit cell differs from the primitive cell which is built by primitive translations: , , . In the following we analyze the position of the muon stopping sites for a K content of with the structural room temperature data: Å, Å, and Å. We assume here that these muon sites do not strongly change when the K-content is varied or when K is replaced by Na.
We used a modified Thomas Fermi approach Reznik et al. (1995) that allows a direct determination of the self-consistent distribution of the valence electron density from which the electrostatic potential can be restored. The local, interstitial minima of this electrostatic potential are identified as muon stopping sites.
For the same purposes we performed more elaborated ab initio calculations within the framework of density functional theory (DFT). We applied the all-electron full-potential linearized augmented plane wave method (Elk code) Elk (2009) with the local spin density approximation Perdew and Wang (1992) for the exchange correlation potential and with the revised generalized gradient approximation of Perdew-Burke-Ernzerhof Perdew et al. (2008). The calculations were performed on a grid which corresponds to 60 points in the irreducible Brillouin zone. In both approaches we used a supercell and supposed (e.g. Ba0.75K0.25Fe2As2). This allows one to explicitly incorporate K ions which were positioned in the supercell at coordinates K(1) - and K(2) - .
The DFT and modified Thomas Fermi approaches give almost the same answers. We observed three possible types of muon sites. Two of them are located on the line along the -direction connecting the nearest Ba or K and As ions at the coordinates with for Ba and for K. In the I4/mmm setting these muon sites have a 2e – local point symmetry (4mm), i.e. the same as the As ions. We have verified that the dipolar fields from a given magnetic structure of the Fe moments have nearly the same magnitudes at these two positions. Accordingly, in the dipolar field calculations we discuss only one type of muon stopping site.
The third muon site is located in the Ba -plane close to the line connecting the As-As ions along the -direction. In the I4/mmm setting it has a rather high 4j – local point symmetry (m2m) at the coordinates . Its electrostatic potential is roughly 20% less than the potential of the previous two sites. Accordingly, this site should be less populated in the SR experiment. The probability of the occupation of this secondary site, as compared to the one of the majority site, we calculate to be 0.24 which agrees rather well with the experimental amplitude ratio of (see Fig. 2 of the Ref. Mallett et al. (2015b)). The qualitative changes of the local dipole fields on this minority site at the o-AF to t-AF transition are very similar to the ones on the majority muon sites. Accordingly, in the following and in the paper we do not further discuss this minority muon site and focus instead on the changes of the local dipole field on the majority muon site.
Appendix B Calculation of the dipolar field at the muon site
To unify the description of the possible magnetic structures in the tetragonal phase of Ba1-xKxFe2As2 (BKFA) and Ba1-xNaxFe2As2 (BNFA) we used the space group P4/mbm N127 that is the subgroup of index 4 of the parent group I4/mmm N139. This choice is dictated by the expected four-fold increase of the magnetic unit cell as compared to the parent I4/mmm primitive cell that is caused by the lowering of the translation symmetry. The P4/mbm subgroup has the same origin as the parent group I4/mmm and the basis that is rotated by 45o in the ab-plane as compared to the I4/mmm basis with and . In the P4/mbm setting the eight Fe atoms in the unit cell are in the – 8k position. The 2e position of the As atoms and of the muon site in the I4/mmm notation are divided in the P4/mbm setting into the 4e – and 4f - positions. Respectively, the 4j position of the third muon site in the I4/mmm notation are divided in the P4/mbm setting into the 8j – and two 4g - positions. The primitive cell of BKFA in the P4/mbm setting is shown in Fig. 17.
The symmetry consideration of the possible 2k- and 1k- (or double-Q and single-Q) magnetic structures is based on the so called representation analysis of the magnetic degrees of freedom that are real and located on the magnetic ions and that are virtually assigned on the muon stopping sites Bertaut (1971); Opechowski and Dreyfus (1971); Izyumov et al. (1991). The magnetic degrees of freedom, for a set of atoms at a given Wyckoff position, form a magnetic representation which is reducible and can be decomposed into irreducible representations (IR). The possible magnetic structures can be presented in terms of a linear combination of magnetic moments, L, which transform under the symmetry operations as basic functions of a given IR. This is in accordance with the Landau concept that only one IR is realized at a phase transition for which L is a nonzero order parameter in the low symmetry phase.
Purely based on symmetry arguments one can make the following strict predictions for the local magnetic field that is seen in a zero-field SR experiment. The complex magnetic structure does not give rise to a finite magnetic field at the muon site if the IR of its order parameter does not enter into the decomposition of the magnetic representation for the muon site.
This circumstance is illustrated below for the possible magnetic structures in the tetragonal phase of BKFA. For the following analysis it is important to note that the lowering of the translation symmetry in the 2k-structures is already accounted for by using a four times enlarged primitive unit cell. In the P4/mbm setting thus we can perform the symmetry treatment for the Fe- and muon-site magnetic representations for the propagation vector .
To represent the order parameters of the respective 2k-magnetic structures, which can arise in the I4/mmm setting with the propagation vectors and , we introduce the following linear combinations L of the magnetic iron moments in the P4/mbm setting with .
| (6) |
The magnetic order parameters L consist of the Fourier components of the magnetic propagation vector, K0, in terms of the sub-lattice magnetic moments with . Similarly one can introduce linear combinations of the - Fourier components of the magnetic fields at the muon positions with 4e and 4f site symmetry that are enumerated by I and II respectively. The respective staggered magnetic fields at these muon sites have the form:
| (7) | ||||
The quantities defined in Eqs. 6 and 7 can serve as the basic functions of the irreducible representations of the P4/mbm group with propagation vector . The attribution of these basic functions to the IR of the tetragonal group P4/mbm is as shown in Table 2. The possible eight noncollinear spin vortex crystal structures which are allowed by the double-Q magnetic order are described by the irreducible repesentations.
The following examples illustrate how to read the data of Table 2. The magnetic structures which can be realized with the iron order parameters of a given IR give rise to staggered fields at the muon sites that transform by the same IR. For example, the magnetic structure which transforms according to the IR consists of the two order parameters and . According to Table 2, both order parameters and do not create finite dipolar fields at the 4e muon stopping sites. At the same time, at the 4f muon stopping sites they both create dipolar fields that are directed along the c-axis and have the same staggered structure . This is a strict result if we take the iron coordinates in the form Fe – 8k . However, there is the starting symmetry I4/mmm which we can reproduce by taking the iron coordinates as , so that we get 8k . This additional, internal symmetry leads to the disappearance of the magnetic fields at some of the muon stopping sites.
| P4/mbm | |||||
|---|---|---|---|---|---|
| IR | Fe order parameters |
Fields at
muon sites 4e I |
Frequency at 1
in MHz |
Fields at
muon sites 4f II |
Frequency at 1
in MHz |
| 52.84 | - | 0 | |||
| ; | 0 | 0 | |||
| ; | 0 | 0 | |||
| 52.03 | - | 0 | |||
| ; | - | 0 | 52.84 | ||
| - | 0 | - | 0 | ||
| - | 0 | - | 0 | ||
| ; | - | 0 | 52.03 | ||
| ; ; | ; | ; | |||
| ; ; | ; | ; | |||
The magnetic structures (order parameters), which do not give rise to a finite magnetic field at the muon site for , , are marked in ”yellow”. The ”pink” color denotes the magnetic structures (order parameters) that cannot be detected by SR for the given 4e and 4f muon stopping sites, even for an arbitrary choice of the -and -coordinates in Fe – 8k . All of these structures are illustrated in Fig. 18.
Note that structures marked in “yellow” can give rise to small, finite fields at the muon sites in the case of small, static deviations of the iron coordinates from the values and . In this case the local fields and the resulting SR precession frequencies will be more or less proportional to the amplitude of the deviations.
Below we summarize the outcome of the dipole field calculations for the magnetic order parameters with AF order for the case Fe – 8k . The magnetic fields are given in units of MHz, corresponding to the SR precession frequency, , and the magnetic order parameters (linear combinations from Eq. 6) in units of .
The fields at the 4e-muon sites with coordinates are:
| (8) | ||||
The fields at the 4f-muon sites with coordinates are:
| (9) | ||||
In the following Figure 18 we show the magnetic structures which do not give rise to a magnetic field at the muon site and thus to a finite SR precession frequency. These structures are therefore not compatible with our experimental data in the t-AF state. Interestingly, all of them belong to so called loop-type SVC structures.
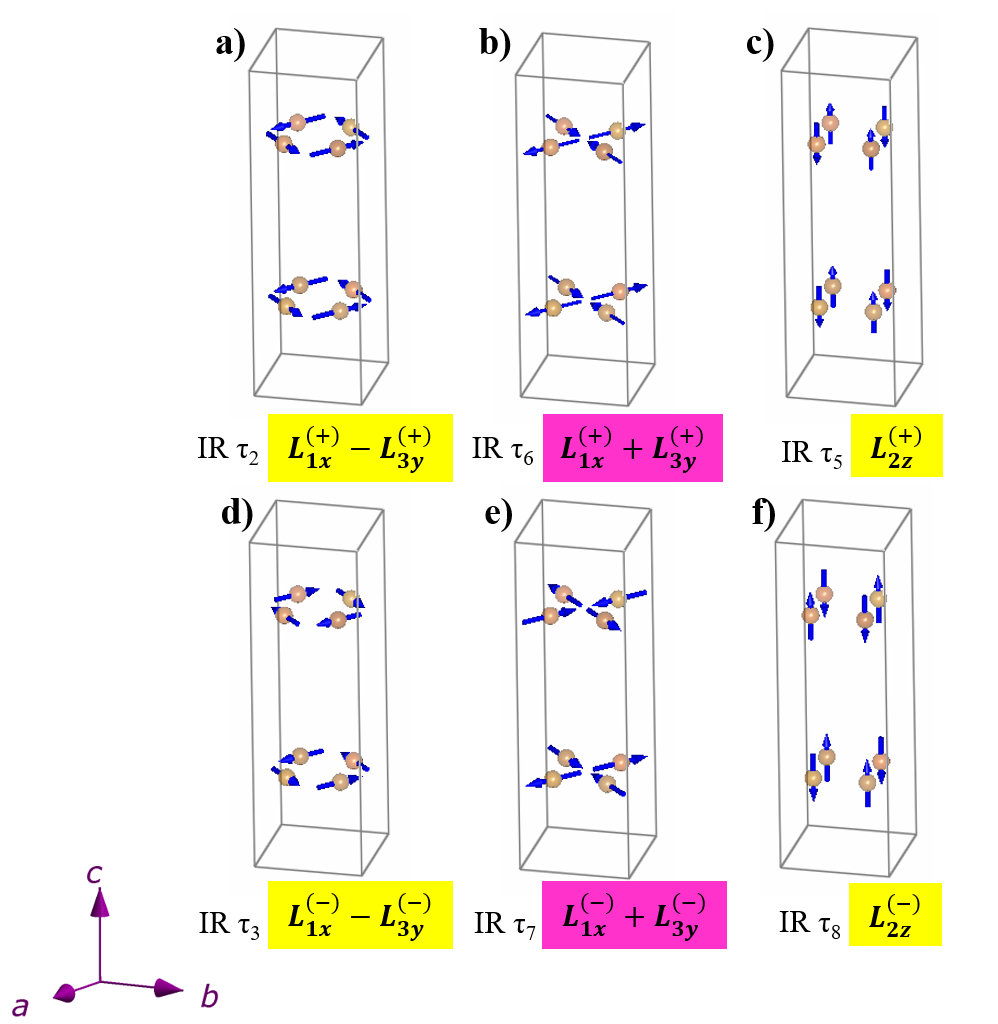
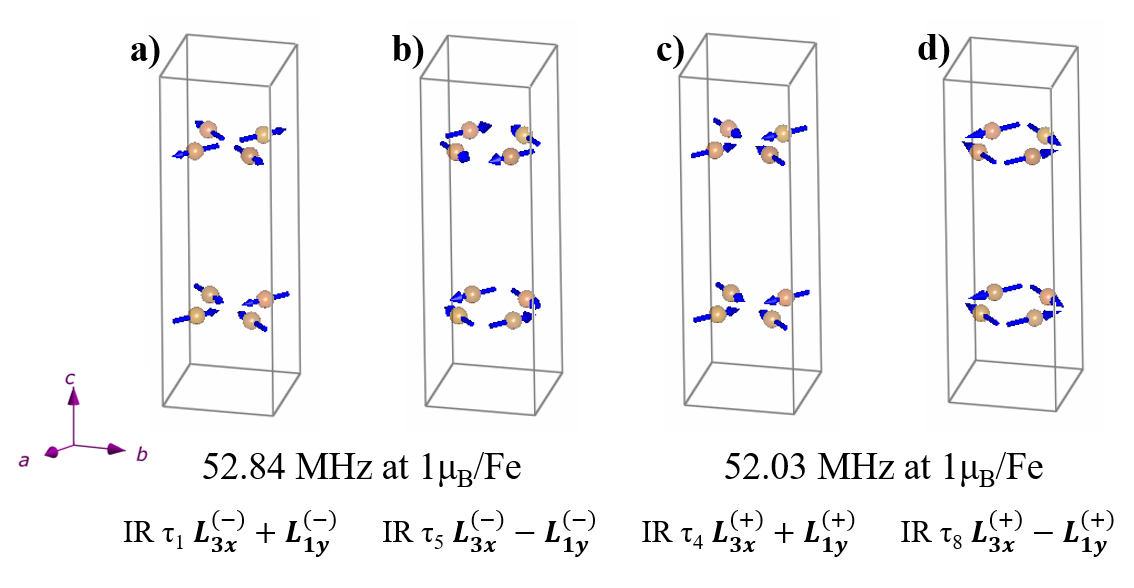
In Figure 19 we show the non-collinear double-Q structures with in-plane oriented magnetic moments which create a finite dipolar magnetic field at the muons sites of tetragonal BKFA or BNFA. All of them belong to the hedgehog-type SVC structures. The indicated SR precession frequencies have been obtained using Eqs. 7 and 8 under the assumption that each Fe ion has a magnetic moment of 1 Bernhard et al. (2012); Aczel et al. (2008). These local fields are larger than the ones calculated for the single-Q magnetic order in the o-AF state (see below and Fig. 21) as well as for the double-Q magnetic order of the tetragonal i-SCDW state (see Fig.20).
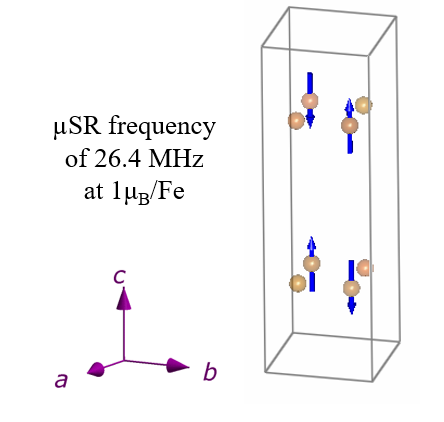
For the double-Q magnetic structures shown above, each Fe ion has the same magnetic moment which is assumed to amount to 1 . However, there exists also the possibility of a so-called inhomogeneous double-Q magnetic structure for which the magnetic moment becomes zero for half of the Fe sites. It is described by the PC42/ncm magnetic group symmetry and preserves the symmetry. In our P4/mbm setting this structure corresponds to the linear combination . In the I4/mmm setting, it is described by the linear combination of the order parameter which belong to different arms of the K13-star. This structure is shown below in Fig. 20. The calculations show that it yields a moderate SR precession frequency that is lower than the one in the orthorhombic phase (see below and Fig. 21) in agreement with the experimental data. In contrast to other magnetic phases, the coexistence of the nonmagnetic and magnetic sites may indicate an alteration of the iron spin states of the neighboring ions. A large variation of the iron spin state is indeed not uncommon to the parent compounds of the iron superconductors for which the magnetic moment varies from the high spin state with and a moment of 3.5 in Rb2Fe4Se5 to the low spin state with in FeSe.
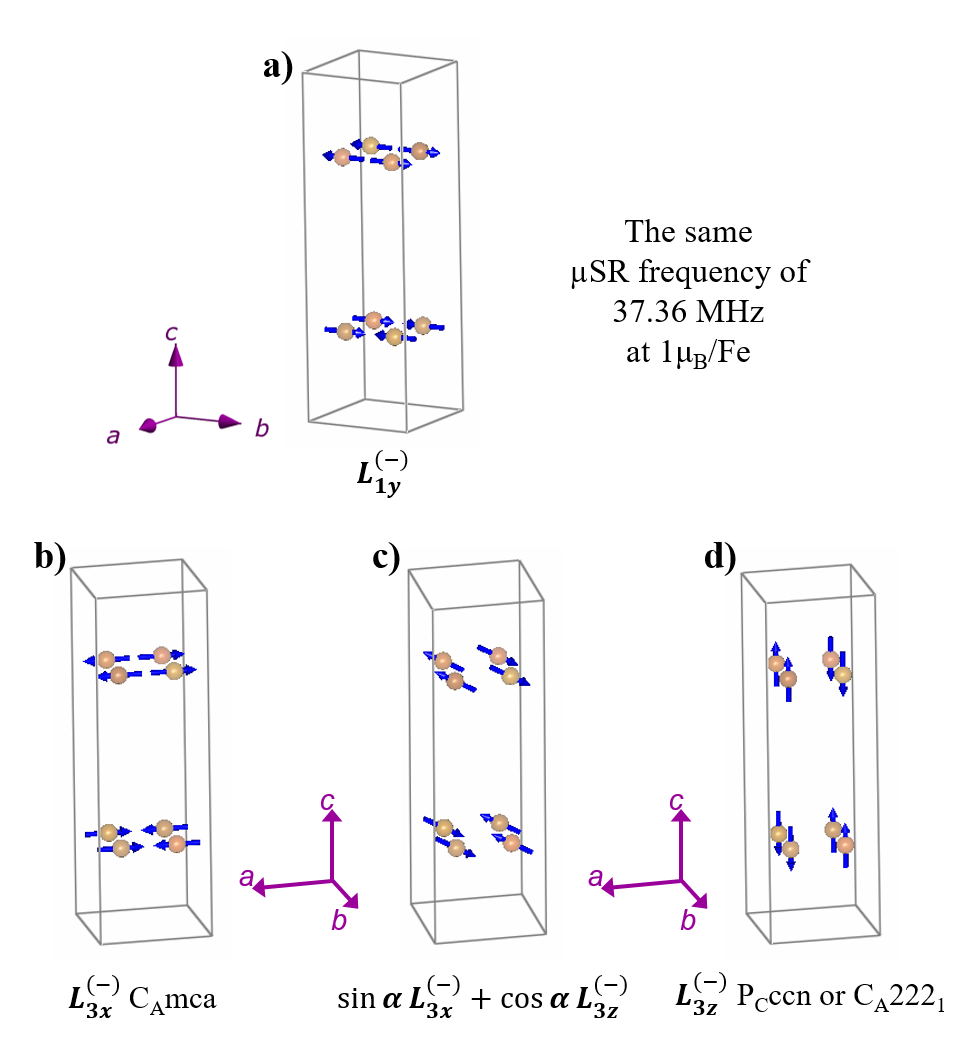
Finally we discuss the so-called single-Q magnetic structures which require an orthorhombic structure since they break the symmetry. From the magnetic symmetry point of view the symmetry reduction that takes place at the transition from the paramagnetic tetragonal I4/mmm1′ phase to the magnetic orthorhombic CAmca (or FCmm′m′) phase can be desscribed as a condensation of the magnetic order parameter or in the I4/mmm setting. Here two order parameters with different translation symmetry form two different orthorhombic domains. In our P4/mbm setting for the paramagnetic phase these two domains of the orthorhombic magnetic phase can be described as a condensation of the and order parameters, respectively. The structure with the out-of-plane direction of the magnetic moments in the tetragonal AF phase can be obtained by a continuous rotation of the magnetic moments in the -plane. The respective magnetic structures are shown in Fig. 21. Note that in accordance with Eqs. 7 and 8 all of them give rise to the same SR precession frequency which for a Fe moment of 1 amounts to 32.3 MHz.
At last we mention the SR precession frequency at the third muon site for the relevant magnetic structures under the assumption of a magnetic moment of 1 . In the o-AF state (for the structure shown in Fig. 21(b)) it amounts to about 8.9 MHz; whereas in the t-AF state (for the structure shown in Fig. 20) it is reduced to about 6.5 MHz. Moreover, the direction of the field at this third muon site is parallel to the -axis in the o-AF state and parallel to the -plane in the t-AF phase, similar to local magnetic field at the main muon site.
Acknowledgements.
Work at the University of Fribourg was supported by the Schweizerische Nationalfonds (SNF) by Grant No. 200020-172611. K. W. acknowledges funding from the Alexander von Humboldt Foundation. K. W. acknowledges valuable discussions with Frédéric Hardy. We thank Christof Neuruhrer and Bernard Grobety for their technical assistance in performing the EDX measurements.References
- Paglione and Greene (2010) J. Paglione and R. L. Greene, Nature Physics 6, 645 (2010).
- Basov and Chubukov (2011) D. N. Basov and A. V. Chubukov, Nature Physics 7, 272 (2011).
- Sefat et al. (2008) A. S. Sefat, R. Jin, M. A. McGuire, B. C. Sales, D. J. Singh, and D. Mandrus, Physical Review Letters 101, 117004 (2008).
- Rotter et al. (2008) M. Rotter, M. Tegel, and D. Johrendt, Physical Review Letters 101, 107006 (2008).
- Wang et al. (2016) L. Wang, F. Hardy, A. E. Böhmer, T. Wolf, P. Schweiss, and C. Meingast, Physical Review B 93, 014514 (2016).
- Yi et al. (2018) M. Yi, A. Frano, D. H. Lu, Y. He, M. Wang, B. A. Frandsen, A. F. Kemper, R. Yu, Q. Si, L. Wang, M. He, F. Hardy, P. Schweiss, P. Adelmann, T. Wolf, M. Hashimoto, S.-K. Mo, Z. Hussain, M. Le Tacon, A. E. Böhmer, D.-H. Lee, Z.-X. Shen, C. Meingast, and R. J. Birgeneau, Physical Review Letters 121, 127001 (2018).
- Pratt et al. (2009) D. K. Pratt, W. Tian, A. Kreyssig, J. L. Zarestky, S. Nandi, N. Ni, S. L. Bud’ko, P. C. Canfield, A. I. Goldman, and R. J. McQueeney, Physical Review Letters 103, 087001 (2009).
- Marsik et al. (2010) P. Marsik, K. W. Kim, A. Dubroka, M. Rössle, V. K. Malik, L. Schulz, C. N. Wang, C. Niedermayer, A. J. Drew, M. Willis, T. Wolf, and C. Bernhard, Physical Review Letters 105, 057001 (2010).
- Yi et al. (2014) M. Yi, Y. Zhang, Z.-K. Liu, X. Ding, J.-H. Chu, A. Kemper, N. Plonka, B. Moritz, M. Hashimoto, S.-K. Mo, Z. Hussain, T. Devereaux, I. Fisher, H. Wen, Z.-X. Shen, and D. Lu, Nature Communications 5, 3711 (2014).
- Kim et al. (2014) H. Kim, M. A. Tanatar, W. E. Straszheim, K. Cho, J. Murphy, N. Spyrison, J.-P. Reid, B. Shen, H.-H. Wen, R. M. Fernandes, and R. Prozorov, Physical Review B 90, 014517 (2014).
- Storey et al. (2013) J. G. Storey, J. W. Loram, J. R. Cooper, Z. Bukowski, and J. Karpinski, Physical Review B 88, 144502 (2013).
- Hardy et al. (2016) F. Hardy, A. E. Böhmer, L. de’ Medici, M. Capone, G. Giovannetti, R. Eder, L. Wang, M. He, T. Wolf, P. Schweiss, R. Heid, A. Herbig, P. Adelmann, R. A. Fisher, and C. Meingast, Physical Review B 94, 205113 (2016).
- Saito et al. (2011) T. Saito, S. Onari, and H. Kontani, Physical Review B 83, 140512 (2011).
- Fernandes et al. (2014) R. M. Fernandes, A. V. Chubukov, and J. Schmalian, Nature Physics 10, 97 (2014).
- Yndurain and Soler (2009) F. Yndurain and J. M. Soler, Physical Review B 79, 134506 (2009).
- Xu et al. (2019) B. Xu, E. Cappelluti, L. Benfatto, B. P. P. Mallett, P. Marsik, E. Sheveleva, F. Lyzwa, T. Wolf, R. Yang, X. G. Qiu, Y. M. Dai, H. H. Wen, R. P. S. M. Lobo, and C. Bernhard, Physical Review Letters 122, 217002 (2019).
- Boeri et al. (2010) L. Boeri, M. Calandra, I. I. Mazin, O. V. Dolgov, and F. Mauri, Physical Review B 82, 020506 (2010).
- Egami et al. (2010) T. Egami, B. V. Fine, D. Parshall, A. Subedi, and D. J. Singh, Advances in Condensed Matter Physics 2010, 1 (2010).
- Coh et al. (2016) S. Coh, M. L. Cohen, and S. G. Louie, Physical Review B 94, 104505 (2016).
- de la Cruz et al. (2008) C. de la Cruz, Q. Huang, J. W. Lynn, J. Li, W. R. II, J. L. Zarestky, H. A. Mook, G. F. Chen, J. L. Luo, N. L. Wang, and P. Dai, Nature 453, 899 (2008).
- Pratt et al. (2011) D. K. Pratt, M. G. Kim, A. Kreyssig, Y. B. Lee, G. S. Tucker, A. Thaler, W. Tian, J. L. Zarestky, S. L. Bud’ko, P. C. Canfield, B. N. Harmon, A. I. Goldman, and R. J. McQueeney, Physical Review Letters 106, 257001 (2011).
- Avci et al. (2014) S. Avci, O. Chmaissem, J. Allred, S. Rosenkranz, I. Eremin, A. Chubukov, D. Bugaris, D. Chung, M. Kanatzidis, J.-P. Castellan, J. Schlueter, H. Claus, D. Khalyavin, P. Manuel, A. Daoud-Aladine, and R. Osborn, Nature Communications 5, 3845 (2014).
- Waßer et al. (2015) F. Waßer, A. Schneidewind, Y. Sidis, S. Wurmehl, S. Aswartham, B. Büchner, and M. Braden, Physical Review B 91, 060505 (2015).
- Böhmer et al. (2015) A. E. Böhmer, F. Hardy, L. Wang, T. Wolf, P. Schweiss, and C. Meingast, Nature Communications 6, 7911 (2015).
- Allred et al. (2015) J. M. Allred, S. Avci, D. Y. Chung, H. Claus, D. D. Khalyavin, P. Manuel, K. M. Taddei, M. G. Kanatzidis, S. Rosenkranz, R. Osborn, and O. Chmaissem, Physical Review B 92, 094515 (2015).
- Mallett et al. (2015a) B. P. P. Mallett, P. Marsik, M. Yazdi-Rizi, T. Wolf, A. E. Böhmer, F. Hardy, C. Meingast, D. Munzar, and C. Bernhard, Physical Review Letters 115, 027003 (2015a).
- Mallett et al. (2015b) B. P. P. Mallett, Y. G. Pashkevich, A. Gusev, T. Wolf, and C. Bernhard, EPL (Europhysics Letters) 111, 57001 (2015b).
- Allred et al. (2016) J. M. Allred, K. M. Taddei, D. E. Bugaris, M. J. Krogstad, S. H. Lapidus, D. Y. Chung, H. Claus, M. G. Kanatzidis, D. E. Brown, J. Kang, R. M. Fernandes, I. Eremin, S. Rosenkranz, O. Chmaissem, and R. Osborn, Nature Physics 12, 493 (2016).
- Lorenzana et al. (2008) J. Lorenzana, G. Seibold, C. Ortix, and M. Grilli, Physical Review Letters 101, 186402 (2008).
- Khalyavin et al. (2014) D. D. Khalyavin, S. W. Lovesey, P. Manuel, F. Krüger, S. Rosenkranz, J. M. Allred, O. Chmaissem, and R. Osborn, Physical Review B 90, 174511 (2014).
- Kang et al. (2015) J. Kang, X. Wang, A. V. Chubukov, and R. M. Fernandes, Physical Review B 91, 121104 (2015).
- Fernandes et al. (2016) R. M. Fernandes, S. A. Kivelson, and E. Berg, Physical Review B 93, 014511 (2016).
- Christensen et al. (2015) M. H. Christensen, J. Kang, B. M. Andersen, I. Eremin, and R. M. Fernandes, Physical Review B 92, 214509 (2015).
- Hoyer et al. (2016) M. Hoyer, R. M. Fernandes, A. Levchenko, and J. Schmalian, Physical Review B 93, 144414 (2016).
- Meier et al. (2018) W. R. Meier, Q.-P. Ding, A. Kreyssig, S. L. Bud’ko, A. Sapkota, K. Kothapalli, V. Borisov, R. Valentí, C. D. Batista, P. P. Orth, R. M. Fernandes, A. I. Goldman, Y. Furukawa, A. E. Böhmer, and P. C. Canfield, npj Quantum Materials 3, 5 (2018).
- Ding et al. (2018) Q.-P. Ding, W. R. Meier, J. Cui, M. Xu, A. E. Böhmer, S. L. Bud’ko, P. C. Canfield, and Y. Furukawa, Physical Review Letters 121, 137204 (2018).
- Schenck (1985) A. Schenck, Muon Spin Rotation Spectroscopy: Principles and Applications in Solid State Physics (Adam Hilger Ltd., Bristol-Boston, 1985).
- Lee et al. (1999) S. L. Lee, R. Cywinski, and S. H. Kilcoyne, Muon Science: Proceedings of the 51st Scottish Universities Summer School in Physics: NATO Advanced Study Institute on Muon Science, 17–28 August, 1998 (Institute of Physics, Bristol, UK, 1999).
- Brewer (1994) J. H. Brewer, Muon spin rotation/relaxation/resonance in Encyclopedia of Applied Physics, edited by G. L. Trigg, Vol. 11, p. 23 (VCH, New York, 1994).
- Homes et al. (1993) C. C. Homes, M. Reedyk, D. A. Cradles, and T. Timusk, Applied Optics 32, 2976 (1993).
- Dressel and Grüner (2002) M. Dressel and G. Grüner, Electrodynamics of Solids (Cambridge University press, 2002).
- Wang et al. (2019) L. Wang, M. He, D. D. Scherer, F. Hardy, P. Schweiss, T. Wolf, M. Merz, B. M. Andersen, and C. Meingast, Journal of the Physical Society of Japan 88, 104710 (2019).
- Bernhard et al. (2012) C. Bernhard, C. N. Wang, L. Nuccio, L. Schulz, O. Zaharko, J. Larsen, C. Aristizabal, M. Willis, A. J. Drew, G. D. Varma, T. Wolf, and C. Niedermayer, Physical Review B 86, 184509 (2012).
- Aczel et al. (2008) A. A. Aczel, E. Baggio-Saitovitch, S. L. Budko, P. C. Canfield, J. P. Carlo, G. F. Chen, P. Dai, T. Goko, W. Z. Hu, G. M. Luke, J. L. Luo, N. Ni, D. R. Sanchez-Candela, F. F. Tafti, N. L. Wang, T. J. Williams, W. Yu, and Y. J. Uemura, Physical Review B 78, 214503 (2008).
- Pümpin et al. (1990) B. Pümpin, H. Keller, W. Kündig, W. Odermatt, I. M. Savić, J. W. Schneider, H. Simmler, P. Zimmermann, E. Kaldis, S. Rusiecki, Y. Maeno, and C. Rossel, Physical Review B 42, 8019 (1990).
- Bernhard et al. (1995) C. Bernhard, C. Niedermayer, U. Binninger, A. Hofer, C. Wenger, J. L. Tallon, G. V. M. Williams, E. J. Ansaldo, J. I. Budnick, C. E. Stronach, D. R. Noakes, and M. A. Blankson-Mills, Physical Review B 52, 10488 (1995).
- Marsik et al. (2013) P. Marsik, C. N. Wang, M. Rössle, M. Yazdi-Rizi, R. Schuster, K. W. Kim, A. Dubroka, D. Munzar, T. Wolf, X. H. Chen, and C. Bernhard, Physical Review B 88, 180508 (2013).
- Akrap et al. (2009) A. Akrap, J. J. Tu, L. J. Li, G. H. Cao, Z. A. Xu, and C. C. Homes, Physical Review B 80, 180502 (2009).
- Wu et al. (2009) D. Wu, N. Barišić, N. Drichko, S. Kaiser, A. Faridian, M. Dressel, S. Jiang, Z. Ren, L. J. Li, G. H. Cao, Z. A. Xu, H. S. Jeevan, and P. Gegenwart, Physical Review B 79, 155103 (2009).
- Barišić et al. (2010) N. Barišić, D. Wu, M. Dressel, L. J. Li, G. H. Cao, and Z. A. Xu, Physical Review B 82, 054518 (2010).
- Kim et al. (2010) K. W. Kim, M. Rössle, A. Dubroka, V. K. Malik, T. Wolf, and C. Bernhard, Physical Review B 81, 214508 (2010).
- van Heumen et al. (2010) E. van Heumen, Y. Huang, S. de Jong, A. B. Kuzmenko, M. S. Golden, and D. van der Marel, EPL (Europhysics Letters) 90, 37005 (2010).
- Dai et al. (2013) Y. M. Dai, B. Xu, B. Shen, H. Xiao, H. H. Wen, X. G. Qiu, C. C. Homes, and R. P. S. M. Lobo, Physical Review Letters 111, 117001 (2013).
- Xu et al. (2017) B. Xu, Y. M. Dai, H. Xiao, B. Shen, H. H. Wen, X. G. Qiu, and R. P. S. M. Lobo, Physical Review B 96, 115125 (2017).
- Mallett et al. (2017) B. P. P. Mallett, C. N. Wang, P. Marsik, E. Sheveleva, M. Yazdi-Rizi, J. L. Tallon, P. Adelmann, T. Wolf, and C. Bernhard, Physical Review B 95, 054512 (2017).
- Muschler et al. (2009) B. Muschler, W. Prestel, R. Hackl, T. P. Devereaux, J. G. Analytis, J.-H. Chu, and I. R. Fisher, Physical Review B 80, 180510 (2009).
- Dai et al. (2016) Y. M. Dai, A. Akrap, S. L. Bud’ko, P. C. Canfield, and C. C. Homes, Physical Review B 94, 195142 (2016).
- Yang et al. (2019) R. Yang, J. W. Huang, N. Zaki, I. Pletikosić, Y. M. Dai, H. Xiao, T. Valla, P. D. Johnson, X. J. Zhou, X. G. Qiu, and C. C. Homes, Physical Review B 100, 235132 (2019).
- Xu et al. (2016) B. Xu, Y. M. Dai, H. Xiao, B. Shen, Z. R. Ye, A. Forget, D. Colson, D. L. Feng, H. H. Wen, X. G. Qiu, and R. P. S. M. Lobo, Physical Review B 94, 085147 (2016).
- Charnukha et al. (2011a) A. Charnukha, P. Popovich, Y. Matiks, D. L. Sun, C. T. Lin, A. N. Yaresko, B. Keimer, and A. V. Boris, Nature Communications 2, 219 (2011a).
- Charnukha et al. (2011b) A. Charnukha, O. V. Dolgov, A. A. Golubov, Y. Matiks, D. L. Sun, C. T. Lin, B. Keimer, and A. V. Boris, Physical Review B 84, 174511 (2011b).
- Yang et al. (2017) R. Yang, Y. Dai, B. Xu, W. Zhang, Z. Qiu, Q. Sui, C. C. Homes, and X. Qiu, Physical Review B 95, 064506 (2017).
- Dordevic et al. (2002) S. V. Dordevic, E. J. Singley, D. N. Basov, S. Komiya, Y. Ando, E. Bucher, C. C. Homes, and M. Strongin, Physical Review B 65, 134511 (2002).
- Zimmers et al. (2004) A. Zimmers, R. Lobo, N. Bontemps, C. Homes, M. Barr, Y. Dagan, and R. Greene, Physical Review B 70, 132502 (2004).
- Reznik et al. (1995) I. M. Reznik, F. G. Vagizov, and R. Troć, Physical Review B 51, 3013 (1995).
- Elk (2009) “Elk code,” (2009).
- Perdew and Wang (1992) J. P. Perdew and Y. Wang, Physical Review B 45, 13244 (1992).
- Perdew et al. (2008) J. P. Perdew, A. Ruzsinszky, G. I. Csonka, O. A. Vydrov, G. E. Scuseria, L. A. Constantin, X. Zhou, and K. Burke, Physical Review Letters 100, 136406 (2008).
- Bertaut (1971) E. F. Bertaut, Le Journal de Physique Colloques 32, C1 (1971).
- Opechowski and Dreyfus (1971) W. Opechowski and T. Dreyfus, Acta Crystallographica Section A 27, 470 (1971).
- Izyumov et al. (1991) Y. A. Izyumov, V. E. Naish, and R. P. Ozerov, Neutron Diffraction of Magnetic Materials Consultants Bureau (Plenum Publishing Corporation, New York, 1991).