Modelling the role of media induced fear conditioning in mitigating post-lockdown COVID-19 pandemic: perspectives on India
Abstract
Abstract Several countries that have been successful in constraining the severity of COVID-19 pandemic via “lockdown” are now considering to slowly end it, mainly because of enormous socio-economic side-effects. An abrupt ending of lockdown can increase the basic reproductive number and undo everything; therefore, carefully designed exit strategies are needed to sustain its benefits post upliftment. To study the role of fear conditioning on mitigating the spread of COVID-19 in post-lockdown phase, in this work, we propose an age and social contact structures dependent Susceptible, Feared, Exposed, Infected and Recovered (SFEIR) model. Simulating the SFEIR model on Indian population with fear conditioning via mass media (like, television, community radio, internet and print media) along with positive reinforcement, it is found that increase in fraction of feared people results in significant decrease in the growth of infected population. The present study suggests that, during post-lockdown phase, media induced fear conditioning in conjunction with closure of schools for about one more year can serve as an important non-pharmaceutical intervention to substantially mitigate this pandemic in India. The proposed SFEIR model, by quantifying the influence of media in inducing fear conditioning, underlies the importance of community driven changes in country specific mitigation of COVID-19 spread in post-lockdown phase.
I Introduction
Originating in the Wuhan city of China with its first case reported in December 2019 whocovid19 , the recently emerged pandemic COVID-19 due to novel severe acute respiratory syndrome coronavirus 2 (SARS-CoV-2) virus has claimed more than 340,000 human lives worldwide as of May, 2020 coronavirus . By now, this pandemic has severely affected various countries across the globe forcing more than one-third of the world population into a condition of lockdown, i.e. suppression of people gatherings in any form that includes shutting down of schools, workplaces and public transports etc.. Although, lockdown is playing a very important role in controlling the number of infections and mitigating the epidemic, it is not an economically viable solution, and therefore can not be sustained for long. Designing of strategies about the implementable exit scenarios and developing a blueprint of the social life in post-lockdown phase, until vaccine or treatment becomes available, is the utmost need of the hour zhigljavsky2020comparison ; gilbert2020preparing .
Human behaviour is thought to play an important role in spread of a pandemic funk2009spread ; del2005effects . One of the important factors that affect behavior is fear riva2014pandemic . Modelling studies has shown that fear has significant effect on reducing the severity of a pandemic poletti2011effect ; perra2011towards ; epstein2008coupled . Fear has been shown to directly correlate with increase in social distancing behaviour as well as taking more precautions kim2015public ; cowling2010community . It is reported that both social interactions and anxiety levels are controlled by projections from basolateral amygdala to medial prefrontal cortex felix2016bidirectional . Inhibition of this projection via opto-genetics is found to decrease anxiety levels and increase social interactions in mice. Thus, information based fear conditioning can serve as an important method in conjunction with other methods that can increase social distancing and precautionary behaviour. Fear conditioning, a subtype of classical conditioning pavlov2010conditioned , is defined as a relationship developed between aversive events and an environmental stimuli by an individual maren2001neurobiology ; davis1992role . For example, in case of COVID-19, an individual can be considered fear conditioned if he establishes relationship between illness and touching of surfaces in public place. Thus, he starts considering exposure to surfaces in public place as an exposure to virus itself. For fear conditioning to happen, an unconditional stimuli (exposure to virus in the current example) is to be paired with a conditional stimuli (touching surfaces in public space). Once this learning has taken place, conditional stimuli (surfaces in public place) will also elicit the same response in an individual even in the absence of unconditional stimuli. If the individual is subjected to conditional stimuli without unconditional stimuli for long time, the learned behavior starts diminishing. Therefore, a term “fear-time” is defined as the time it takes for behaviour due to fear conditioning to get extinct. Operant conditioning is defined as a kind of learning in which a behavior is enhanced or reduced by methods of punishment or reinforcement. Positive reinforcement happens when a person is rewarded for a certain behavior and is thereby encouraged to repeat the same behavior skinner2019behavior . For example, in case of COVID-19, if an individual having a belief that ‘touching surfaces in public places’ is wrong is rewarded can increase the fear-time.
In this work, we propose a model to examine the role of fear in managing the COVID-19 spread in post-lockdown phase, with media induced fear conditioning in conjunction with operant conditioning as one such prospective method. Fear, in the present work, is defined as learning of relationship between COVID-19 (aversive event) and the various ways through which it can spread (stimuli). Fear can be learned by individuals through various means, like, seeing a person who is suffering from COVID-19, but the fastest way for such conditional learning to spread across population is through mass media towers2015mass . Media influence plays a significant role in spreading useful information through various sources, like, television, community radio, internet and print media (such as, newspapers, magazines) etc., resulting in changed behaviour of a community wakefield2010use , thereby influencing the progression of a pandemic collinson2014modelling ; collinson2015effects . It has been showed that if media publicity is focussed on guiding people’s behaviour, it can have significant effect on spread of pandemic yan2016media . Individuals who interact quite frequently have stronger connection to influence others, and pass on the similar information among them bakshy2012role . Therefore, the model developed in this paper examines the media induced fear on epidemic progression by hypothesizing that inducing fear conditioning and increasing its fear time by operant conditioning via mass media (television, community radio, internet and print media) will have a negative effect on progression of COVID-19. As we are only considering positive reinforcement; three terms, operant conditioning, reward, and positive reinforcement have been used interchangeably throughout this paper.
Rest of the paper is organized as follows: in the Methods section, we detail the design principles of proposed age- and contact-structure dependent SFEIR (Susceptible, Feared, Exposed, Infected and Recovered) model and discuss about the data sources, assumptions made as well as the simulation protocol. In the Results section, simulation outcomes of the developed SFEIR model incorporating fear conditioning via mass media in Indian population are presented and their implications are elaborated. We first compare the simulations of SFEIR model with the classical SEIR models (not having fear conditioning) with or without lockdown, and then study the effect of varying the impact of fear conditioning and reward parameters. We then study the effect of school closure and increased fear conditioning. Finally, we conclude with the discussions and potential policy perspectives of the present work on the influence of media on collective psychology of a community to counter COVID-19 progression in the post-lockdown phase.
II Methods
II.1 Construction of SFEIR model
To study the effects of fear conditioning mass media in countering post-lockdown spread of COVID-19 infections, we have developed an age- and contact-structured Susceptible Feared Exposed Infected Recovered (SFEIR) model shown in Fig. 1. A susceptible person can be exposed to infection either directly or after moving into the fear compartment epstein2008coupled . Feared individuals are less social felix2016bidirectional and take more precautions, and therefore will have lower probability of transmission () as compared to individuals in susceptible group (). Feared individuals recover from fear with fear recovery rate and move back into susceptible compartment. is inversely proportional to fear time . Once exposed, the rate of getting infected by pathogen is and the rate of recovery is .
While formulating the SFEIR model, age- and social contact-structures are incorporated as detailed in prem2017projecting ; singh2020age . In the age-structured population, first group consists of individuals of age years, second group is of age years, and so on, till group that consists of individuals of age years. It is considered that susceptible individuals can develop fear through various media platforms, like, television, community radio, internet, print media etc. in the post-lockdown phase. Considering , , , and as the variables representing the number of individuals belonging to age group in Susceptible, Feared, Exposed, Infected and Recovered compartments, respectively, the generalized age- and social contact-structured SFEIR model is given as:
| (1) | ||||
where,
The rate of fear conditioning in age group , , is considered as a product of following three terms,
-
(i)
: fraction of people who are fear conditioned by media in age group out of people who trust media in age group .
-
(ii)
: fraction of people who trust media in age group out of people who are exposed to media in age group .
-
(iii)
: fraction of people who are exposed to media in age group per day out of total population in age group .
and is given as,
| (2) |
where, represents the type of mass media (i.e. television, community radio, internet or print media) and represents the number of mass media types. Since in this work four types of mass media are considered, so =4. Under condition = 0, i.e. if rate of fear conditioning is zero, for every group , SFEIR will get reduced to an age- and contact-structured SEIR model which will be a variant of classical SIR model prem2017projecting ; kermack1927contribution . In this scenario, variables and will have no effect on the resulting dynamics.
Susceptible person in group can move into exposed group after coming in contact with infected individual with probability of transmission and contact matrix defined as per prem2017projecting . Fearful individual in group will be exposed with a reduced probability of transmission . Probability of transmission of feared individual to the exposed group is taken as time-dependent along the lines of tang2020updated ; eikenberry2020mask , as it shall decrease with the increase in the number of individuals in fear group. Hence, rate of decrease in probability of transmission () should be proportional to the rate of fear conditioning (). We model the as,
| (3) |
where,
is a constant, having value between 0 and 1, which converts the minimum probability of transmission from fear group to exposed group in terms of . For example, if = 0.1, it means that minimum probability of transmission from fear group is 10% to that from susceptible group.
Fear time is defined as the average time-interval an individual spends being fear conditioned i.e. the average time from induction of fear conditioning to its extinction. Reinforcement is known to modulate conditioned behaviour skinner2019behavior , and therefore it is considered that if fear beliefs are rewarded, fear time will increase. Fear time () is the sum of following two components:
-
(i)
A constant term, in the absence of any reinforcement, (), and,
-
(ii)
A variable term, depending on the positive reinforcement through reward of beliefs, ().
| (4) |
Rewards can increase the frequency of a desired behavior as well as prohibit it from getting extinct, and are quantified by a reward (utility) function schultz2006behavioral . A reward (utility) function, , maps the effect of reward on the behavior of an individual in a physical world to the real numbers (). In this work, behavioral response is quantified using fear time (), which has two parts: and . Fear time of individuals will be directly proportional to the rewards associated with their beliefs e.g. a praise from social, religious or political leaders for maintaining social distancing. We define a reward function, , that has the capability to modulate reinforced fear time, . In its general formulation, a reward function will be time-dependent function because effect of rewards are also dependent on several factors, like, when it is given, how it is given, expectation of reward, etc. schultz2006behavioral ; humphreys1939effect ; skinner2019behavior . However, for simplicity, the reward function is used as a time-independent constant parameter in the SFEIR model and is termed as a reward parameter . As no particular method of reinforcement is used in this paper, the reward parameter is treated as an abstract quantity that can modulate in following three ways:
-
(i)
Reinforced fear time () increases if is present, therefore the change in is considered to be directly proportional to .
-
(ii)
Even if is present for indefinite time, cannot continuously keep on increasing and must saturate at some level.
-
(iii)
If reward parameter becomes zero at time , should start decreasing from time onwards with time constant .
Therefore, is modelled using the following differential equation:
| (5) |
Solving the above equation returns the following expression of ,
| (6) |
And, the rate of recovery from fear conditioning, , becomes:
| (7) |
Partitioning the social contacts of individuals into home, workplace, school and other categories prem2017projecting , following contact matrices are used in the SFEIR model (eq 1):
-
•
= Contact matrices between age groups and for Home
-
•
= Contact matrices between age groups and for Workplace
-
•
= Contact matrices between age groups and for Schools
-
•
= Contact matrices between age groups and for Others
During lockdown, work and schools are closed, thus, = is equal to 0. remains the same as before lockdown. is assumed to decrease as a function of time after lockdown begins. Therefore, to fit to data (number of active cases), during lockdown is modelled as:
| (8) |
where, is the rate of decrease of probability of transmission and is the time at which lockdown starts. is probability of transmission at for .
| Parameter | Value | References |
|---|---|---|
| for = television | 0.631 | televisionmedia |
| for = community radio | 0.29 | communityradiomedia |
| for = internet | 0.234 | internetmedia |
| for = print media | 0.148 | newspapermedia |
| for = television | 0.41 | trustmedia |
| for = community radio | 0.41 | trustmedia |
| for = internet | 0.34 | trustmedia |
| for = print media | 0.55 | trustmedia |
| 2 days | Assumed | |
| 2 days | Assumed | |
| Fitted | ||
| Fitted | ||
| Fitted | ||
| 5.2 days | kucharski2020early | |
| 7 days | tang2020updated |
II.2 Assumptions used for simulation of SFEIR model
-
1.
across all age groups is taken to be equal to average for total population due to non-availabilty of data. Similarly, across all age groups is also taken equal to average for total population, for same reasons. To get the effect of fear conditioning because of inter group contacts, was varied to simulate the model as detailed in Results section 3.5.
-
2.
and are taken independent of time to reduce the complexity of model.
II.3 Simulating SFEIR model on India specific COVID-19 data
First case of COVID-19 in India was reported on January, 2020. Number of cases increased to 3 by February, all of them were recovered by February. There was no new case of infection till March, after which number of cases started increasing rapidly. Therefore, day in SFEIR model is taken as March, 2020.
Time series for active cases was taken from covid19 . Model was fitted to data using non-linear square fit method. Differential equations were solved using RK4 method singh2015modelling for time period of 500 days with step size of 0.05. Age structure population data was taken from population . Values of and were taken from references mentioned in Table 1. All simulations were performed in python programming language.
III Results
III.1 Comparing the three variants of SFEIR model
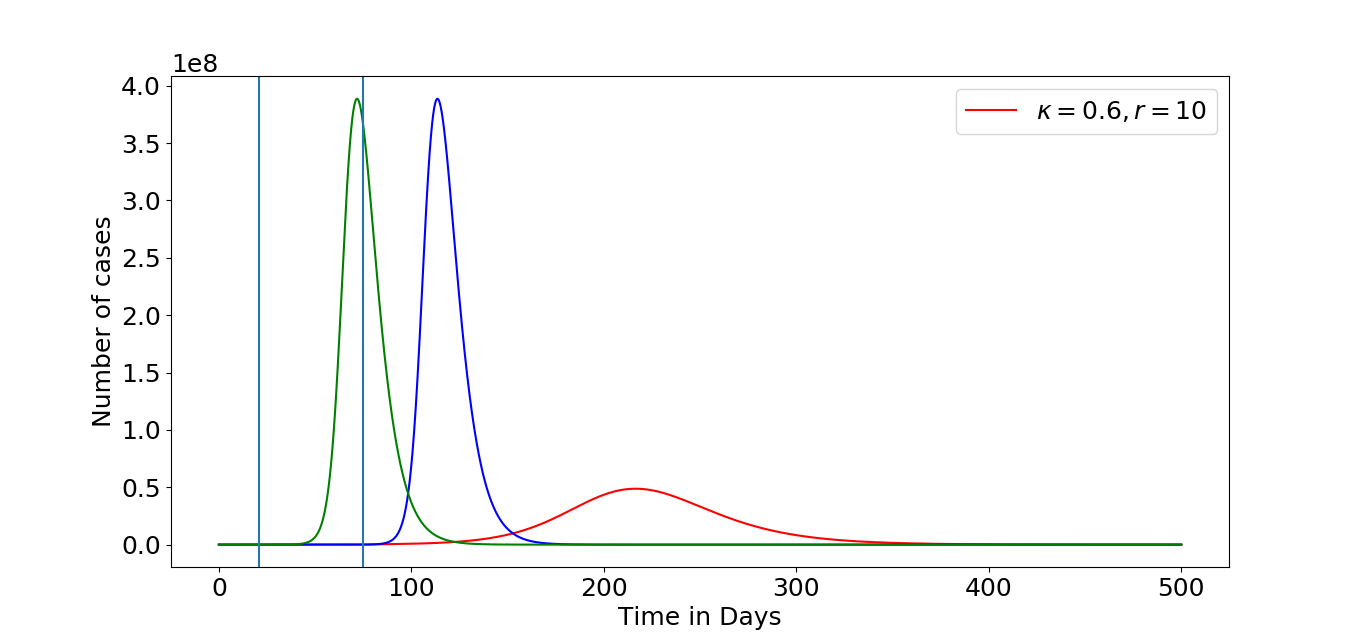
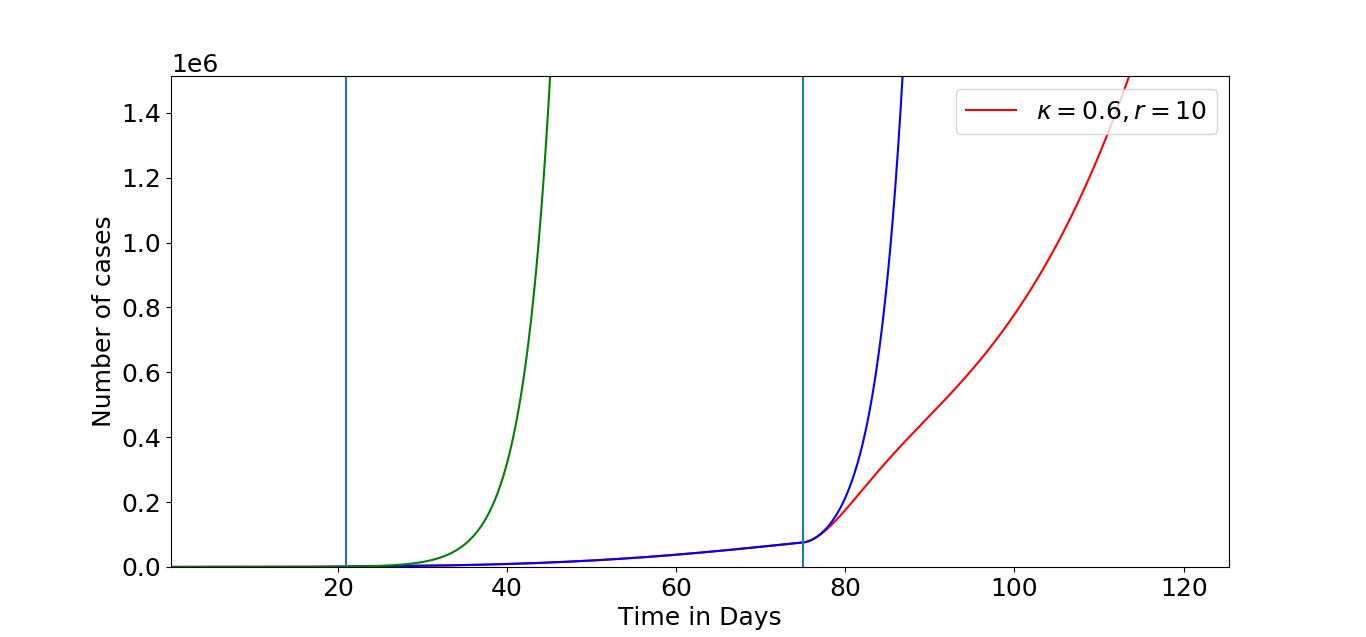
As discussed in the Methods section, whole population of India was divided into 16 classes of different age groups. Simulations were performed for three cases, namely;
(I) without lockdown and without fear,
(II) with lockdown (for fixed number of days) but without fear, and,
(III) with lockdown (for fixed number of days) and with fear.
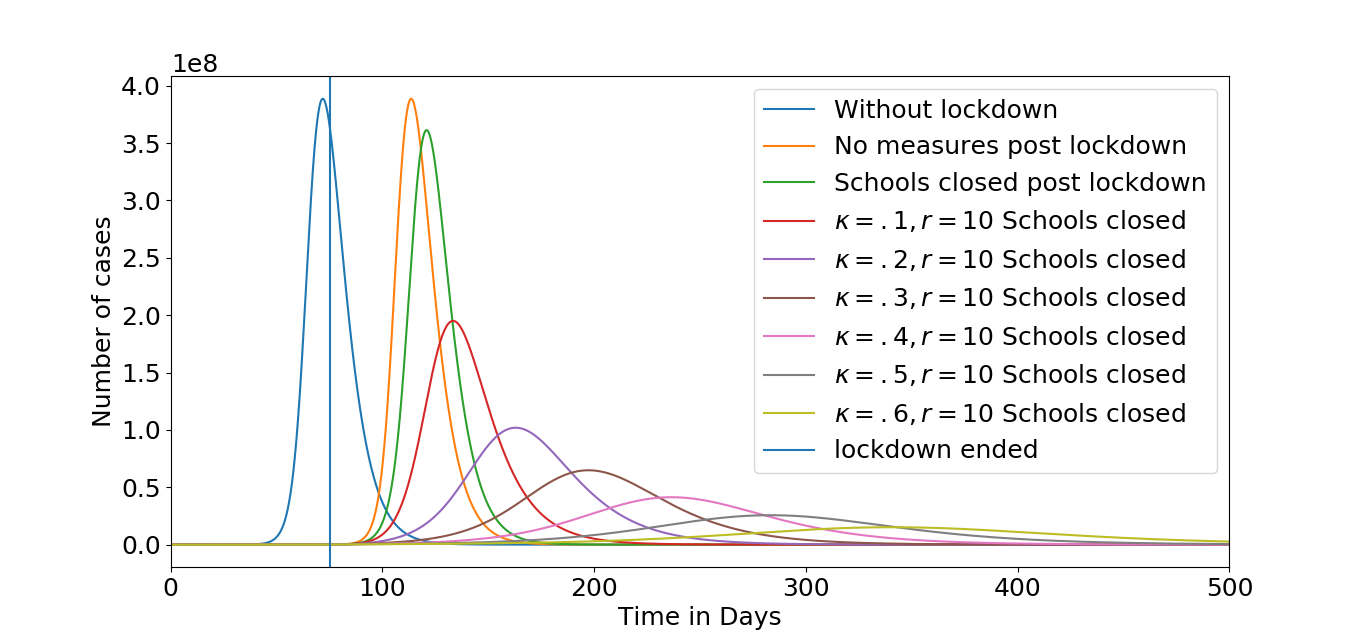
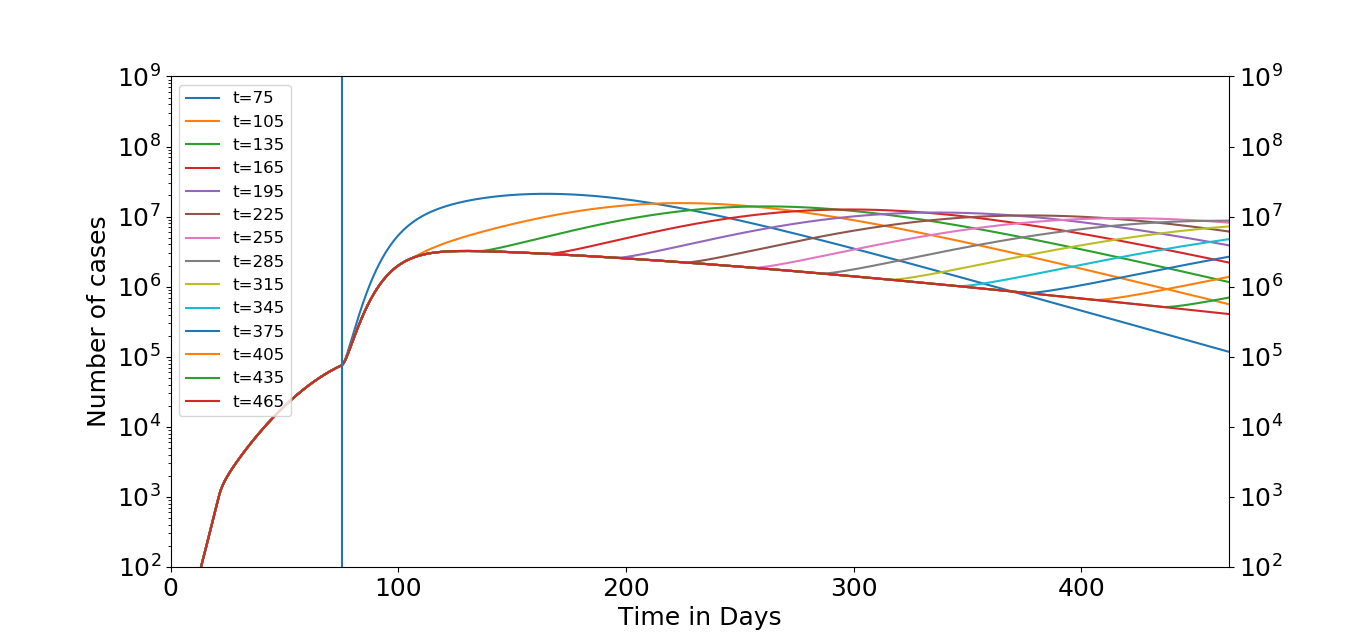
Case I is represented by green curve showing simulation results in the absence of lockdown. Case II is represented by blue curve, and shows the results of lockdown intervention starting from day (March ) and continuing till day ( May, 2020), after which contact matrix was set to as it was before. Case III is represented by red curve, in which lockdown is implemented from day to day along with SFEIR model implementation starting from day. The simulation was done for 500 days. A comparison among these cases indicates that lockdown has reduced the number of new infections substantially, but there is an abrupt rise in number of infectious cases if lockdown is lifted at one go. By implementing the SFEIR model from day, the curve flattens considerably resulting in further decrease of number of infections and its peak shifts to about day. Results are summarized in Fig. 2.
III.2 Variation of parameters
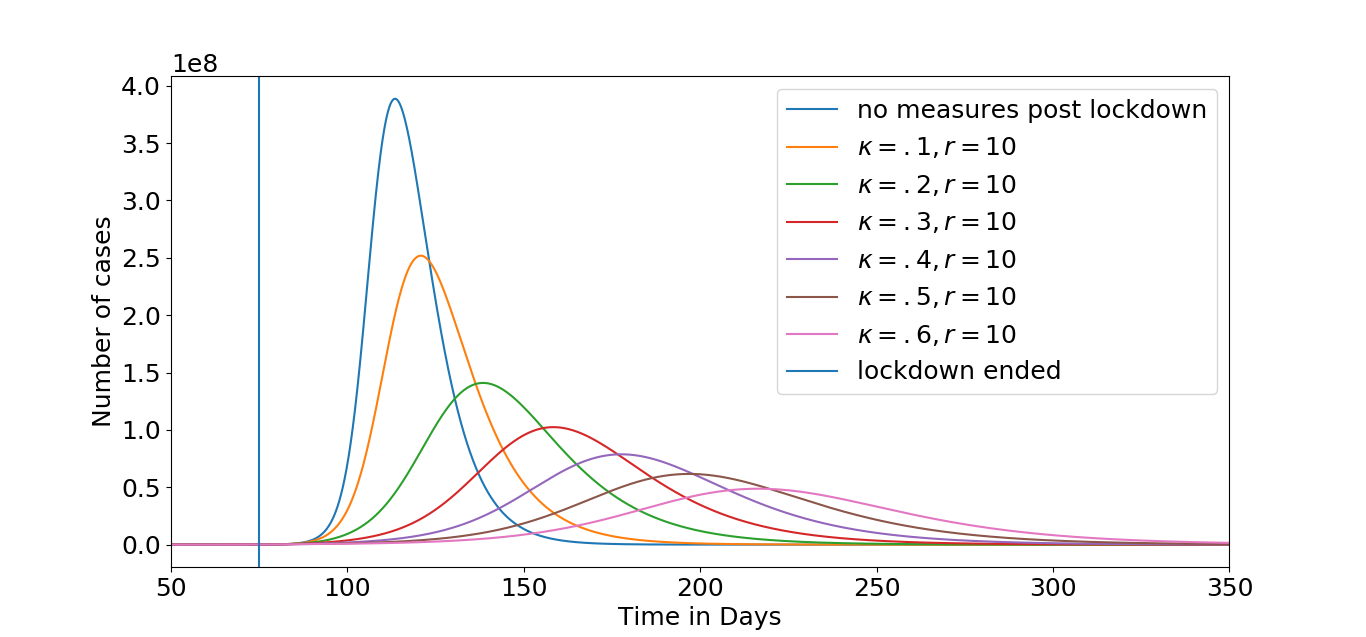
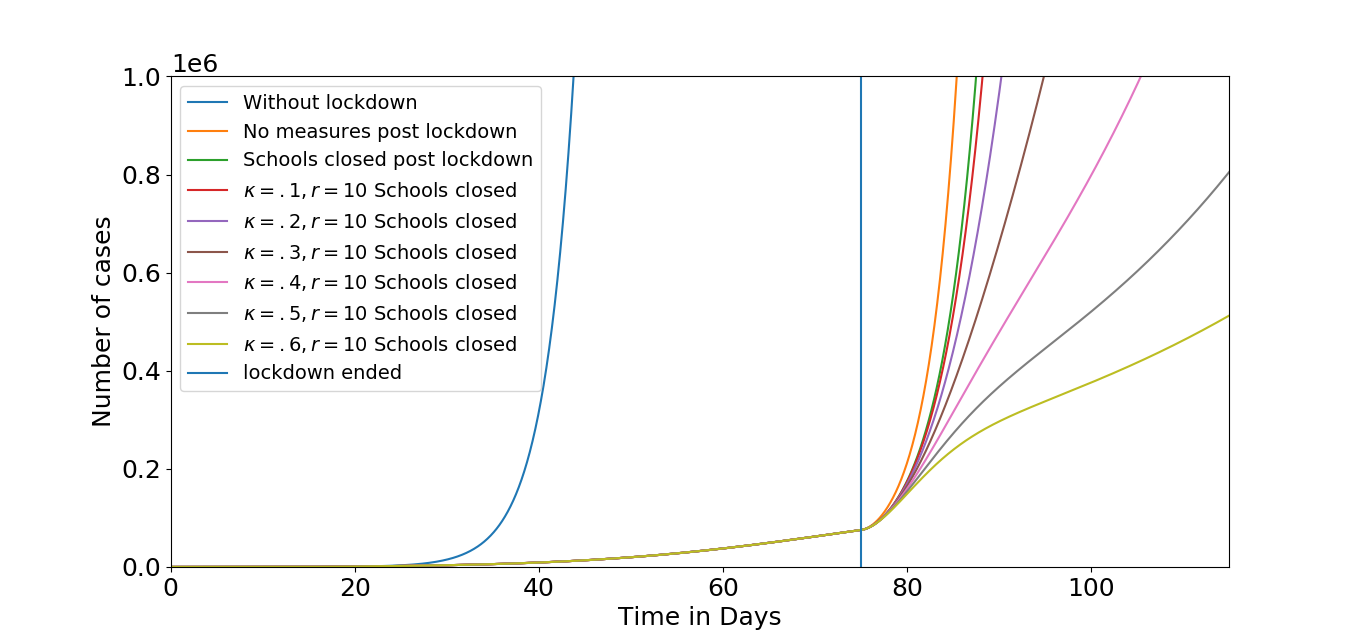
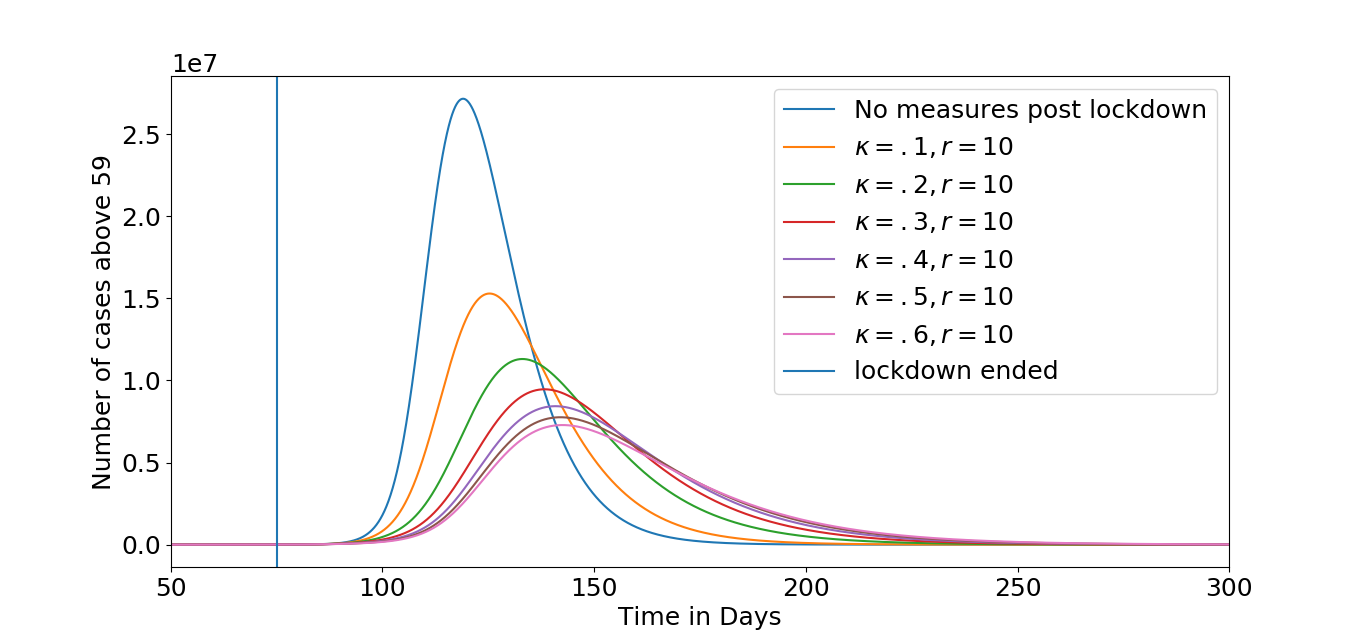
Effect of varying and
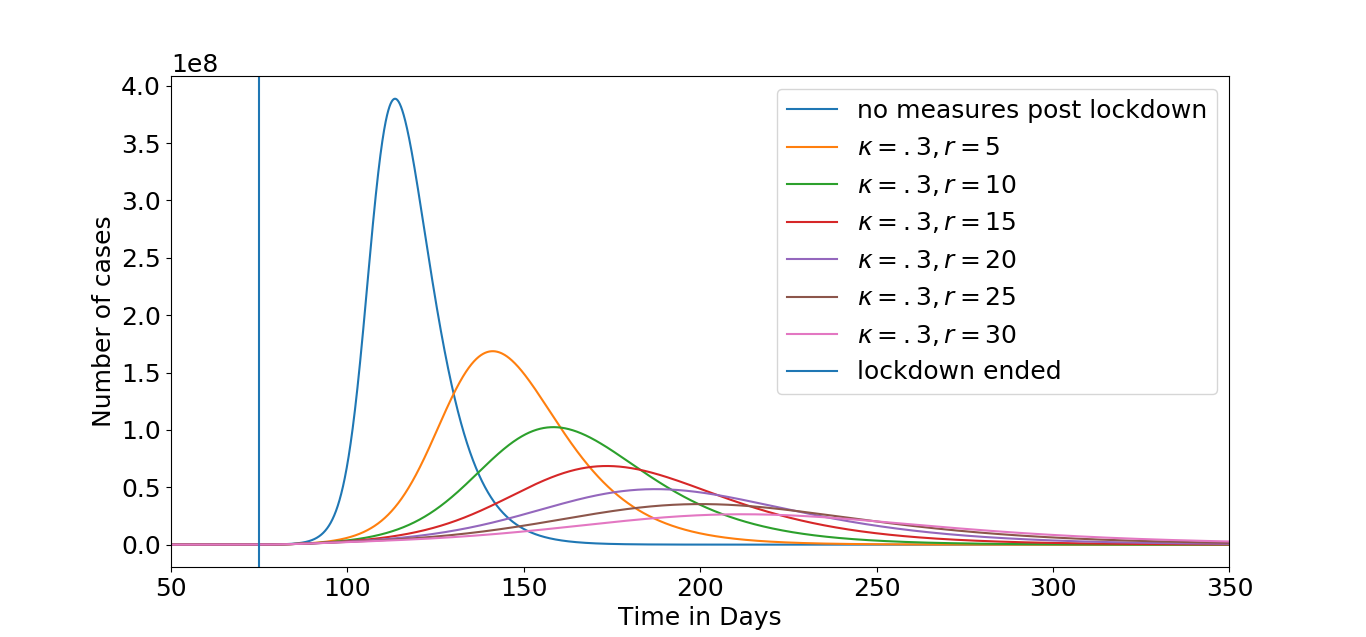
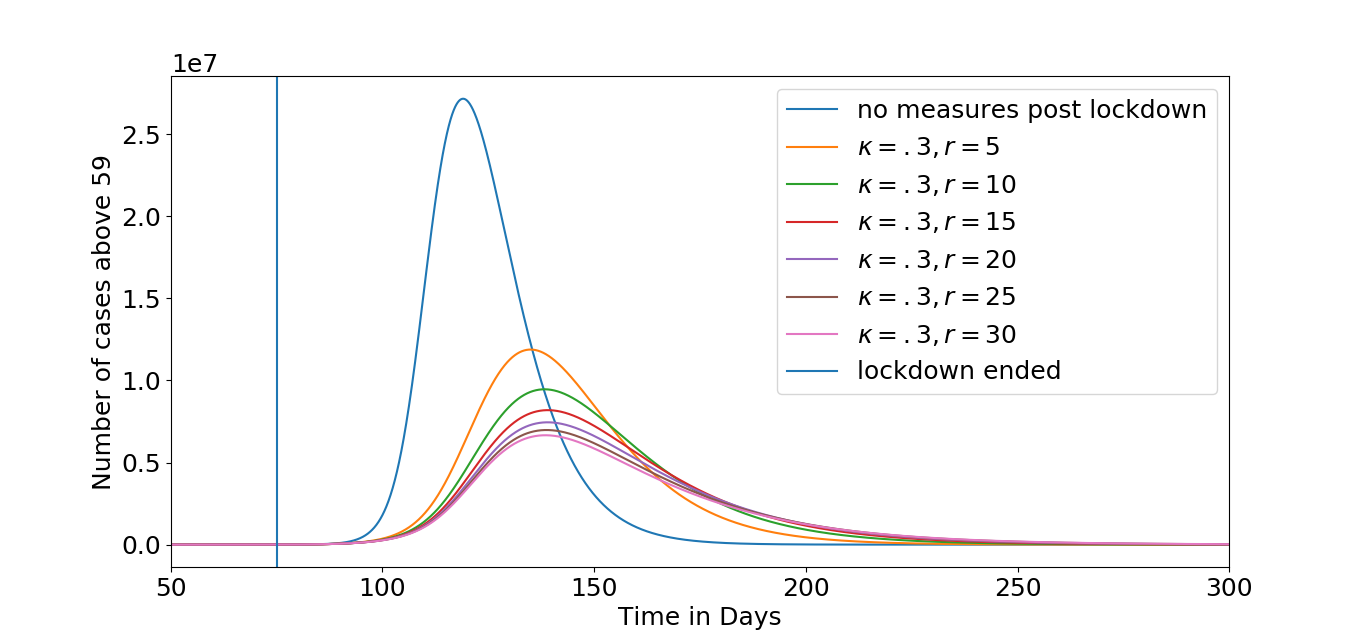
Here, we have analysed the role of (fraction of people who are fear conditioned by media) and (reward parameter) on the number of infected individuals. For this, we varied from 0.1 to 0.6 with the step size of 0.1 and the value of was fixed at 10. Values of all other parameters were kept constant as described in Table 1. Decrease in peak height and flattening of curve is observed as shown in Fig. 3(a) and 3(b). This shift in peak arises mainly due to the fact that feared population becomes infected with lesser probability than the unfeared susceptible population. Along with , different values of were also varied and analysed. We varied the value of from 5 to 30 with the step size of 5 and keeping the value of constant at 0.3. Flattening and profound shifting of curve is again observed with the increase in values that happens mainly because increase in reward increases the time of stay in fear compartment. These results are shown in Fig. 3(b).
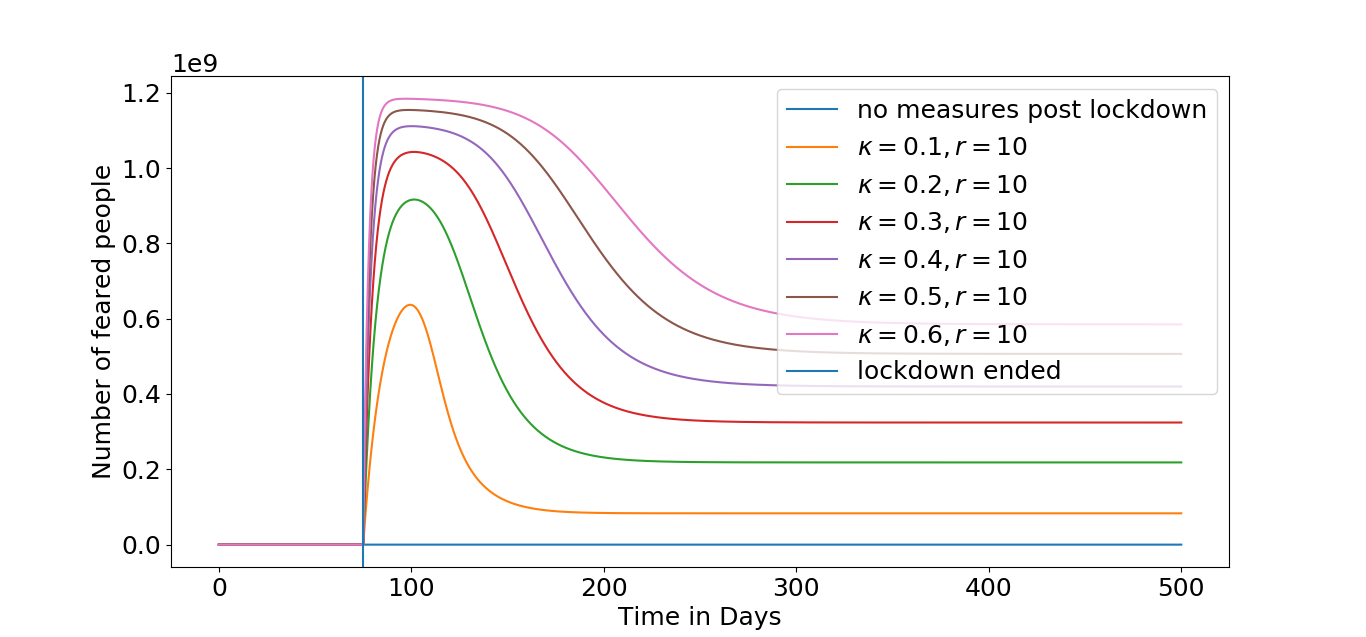
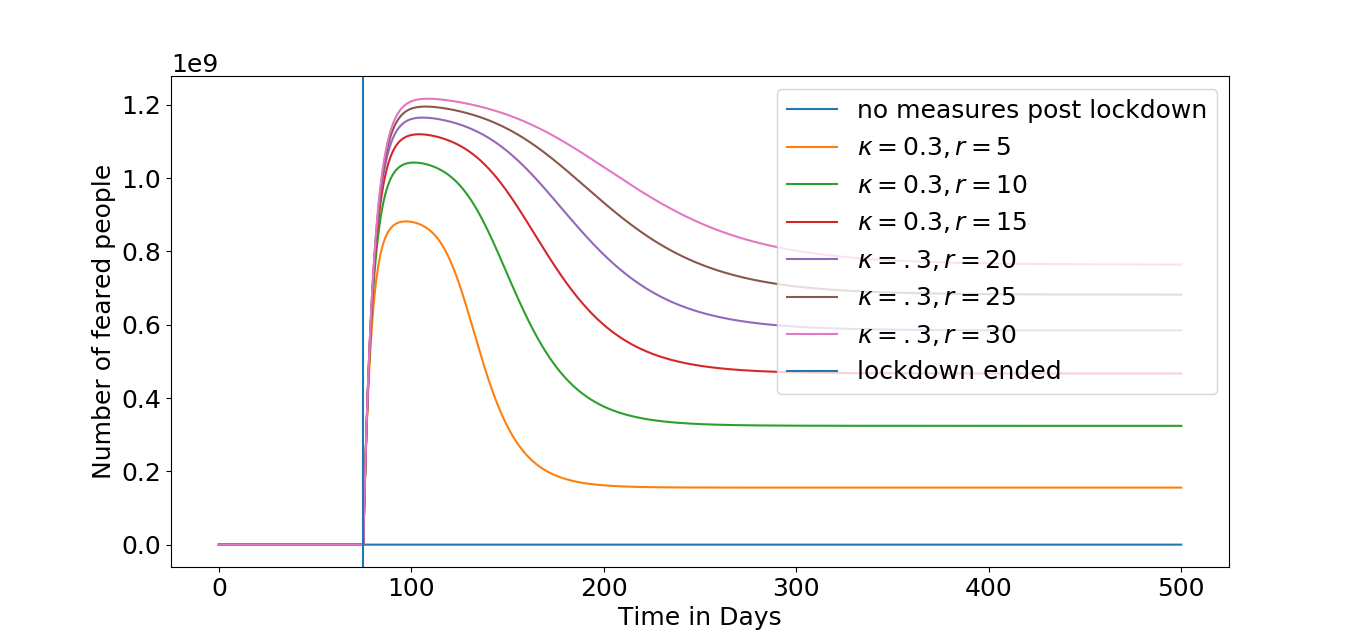
Effects of varying the parameters and on feared population are shown in the Fig. 3(c) and 3(d), respectively. An increase in values of and , increases the fraction of people in feared compartment during post-lockdown phase, thereby, reducing the number of infections.
Phase space:
To quantify the effect of simultaneously varying , and on infection dynamics, two phase diagrams corresponding to variables and are plotted as shown in Fig. 4(a) and Fig. 4(b), respectively. Variables and are defined as,
| (9) | ||||
and values were varied from 0.01 to 1 in the steps of 0.05, and values were varied from 1 to 100 in the steps of 5. By looking at plots, it can be seen that divides the phase space into 3 parts: Region I, II and III. Region II corresponds to the large values of variable represented as yellow-green spheres in Fig. 4(a). For the corresponding values of , and in Fig. 4(b), variable has moderate values.
On both sides of region II in Fig. 4(a), variable has small values. In the left side part of region II in Fig. 4(a), variable has small values and for the corresponding values of , and in Fig. 4(b), variable is also small. This part of phase space is termed as Region I. While in the right side part of region II in Fig. 4(a), variable has small values and for the corresponding values of , and in Fig. 4(b), variable is high. This part of phase space is termed as Region III.
Thus, the three regions (Region I, II and III) are defined on the basis of values of and as follows:
Region I: Small , small
Region II: Large , moderate
Region III: Small , large
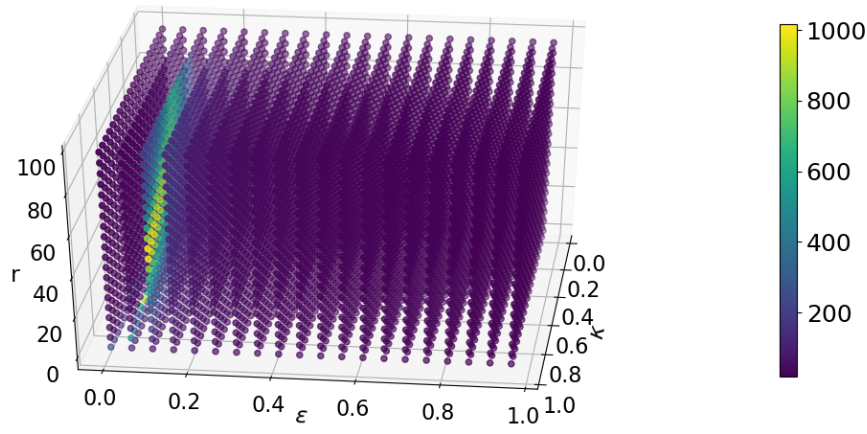
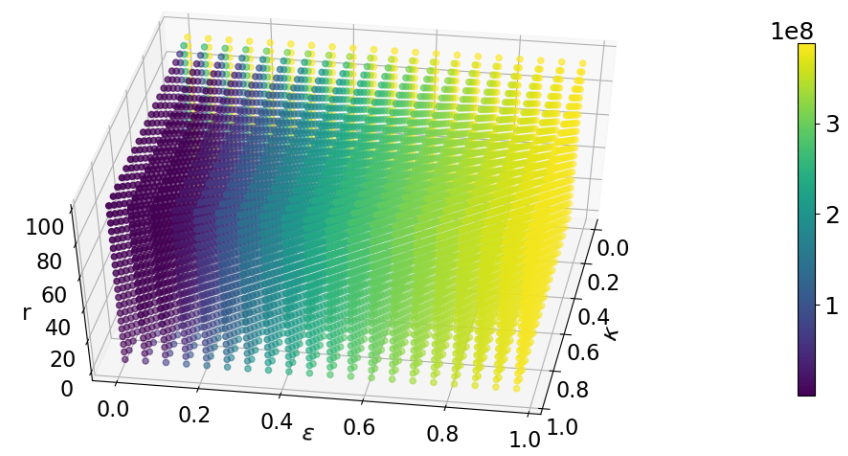
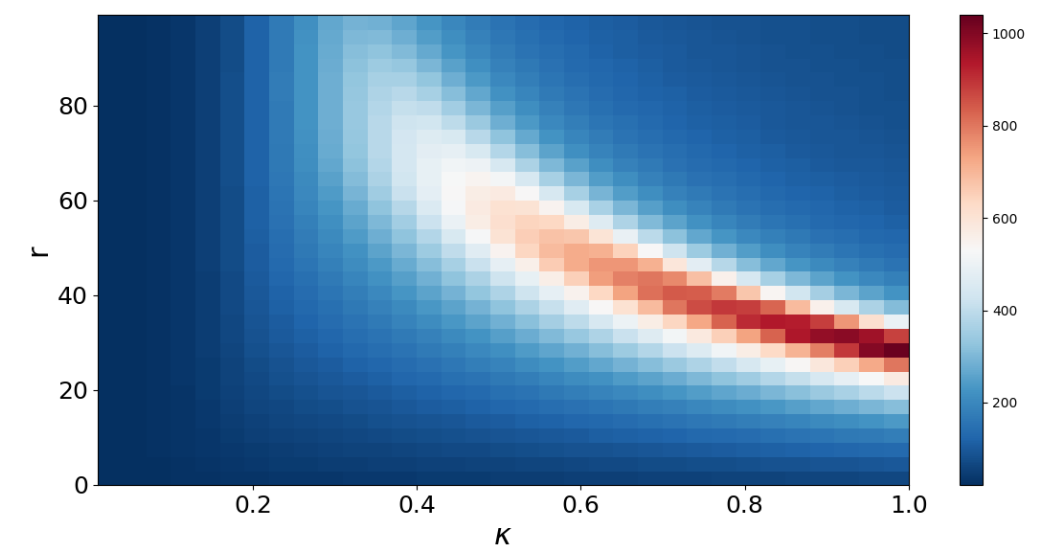
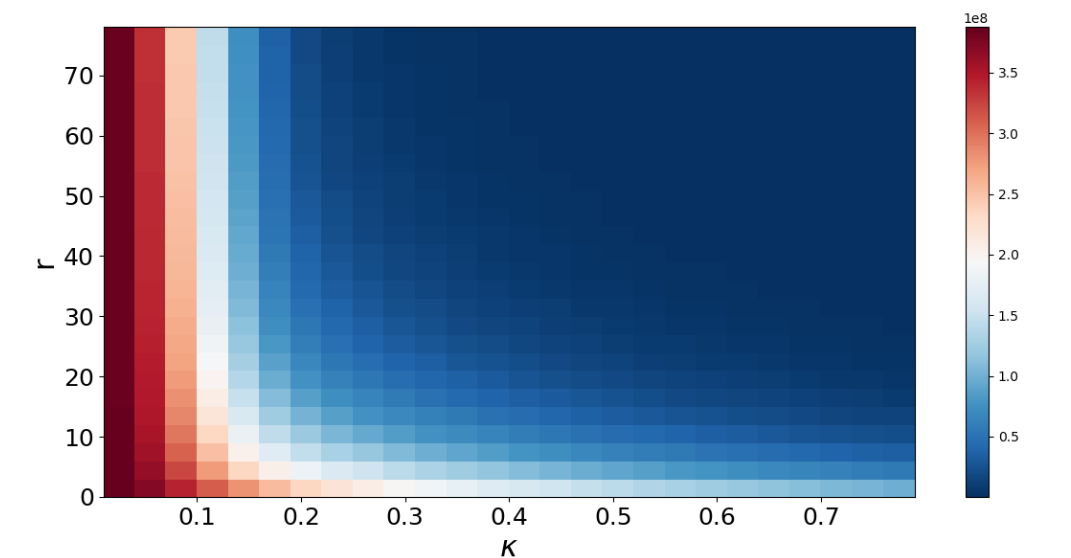
Region I (small values, small values) corresponds to conditions in which number of infections are very less and pandemic ends swiftly. Region II corresponds to conditions under which rise in number of cases is slow (curve is flat), but it takes more time for pandemic to mitigate. Region III corresponds to high severity of pandemic. Although, Region I looks desirable but it can not be reached as it corresponds to very less number of infections (in the range of only) in India. One has to focus on developing strategies to avoid reaching into the Region III, and to remain particularly in Region II.
As region II corresponds to value of in range 0.05 to 0.15. For the rest of study, was fixed to 0.1. To ascertain the effect of and on infection dynamics, 2-D version of Fig. 4(a) and 4(b) are plotted in Fig. 4(c) and 4(d), respectively. The three regions can be clearly seen in Fig. 4(c). The red-white curve has large values and corresponds to region II, the upper-right blue quadrant corresponds to region I and lower-left blue quadrant corresponds to region III of Fig. 4(a).
III.3 Effect of keeping schools closed in post-lockdown phase
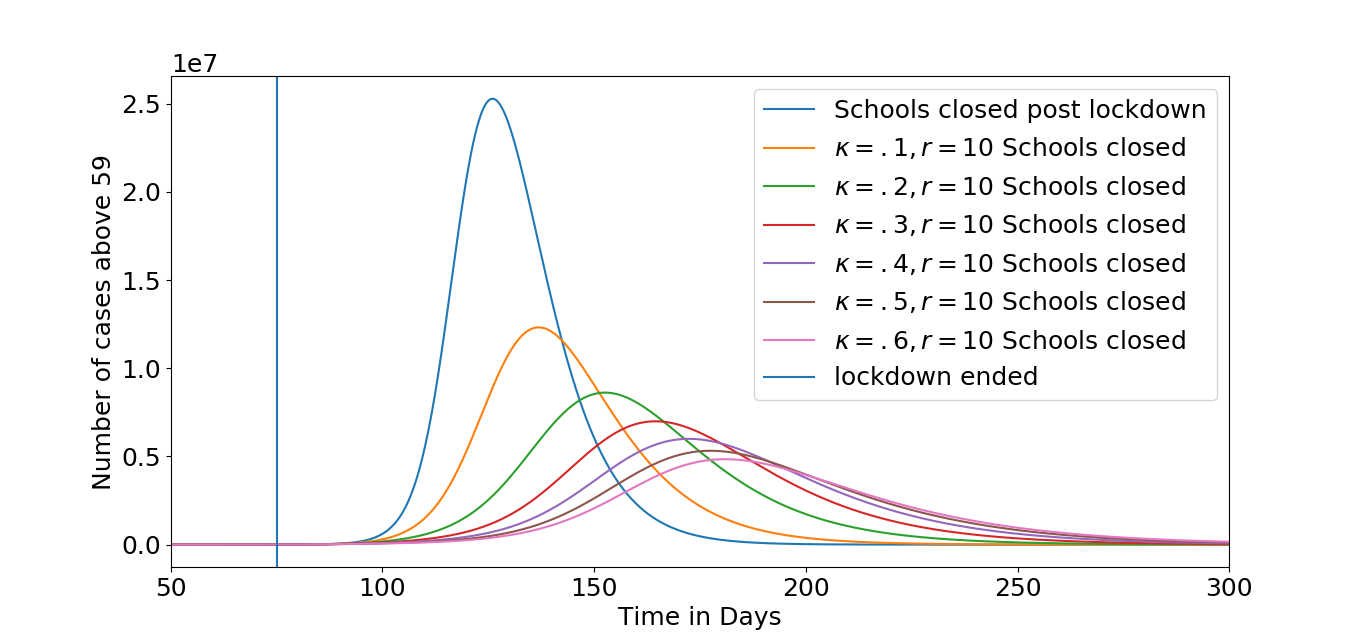
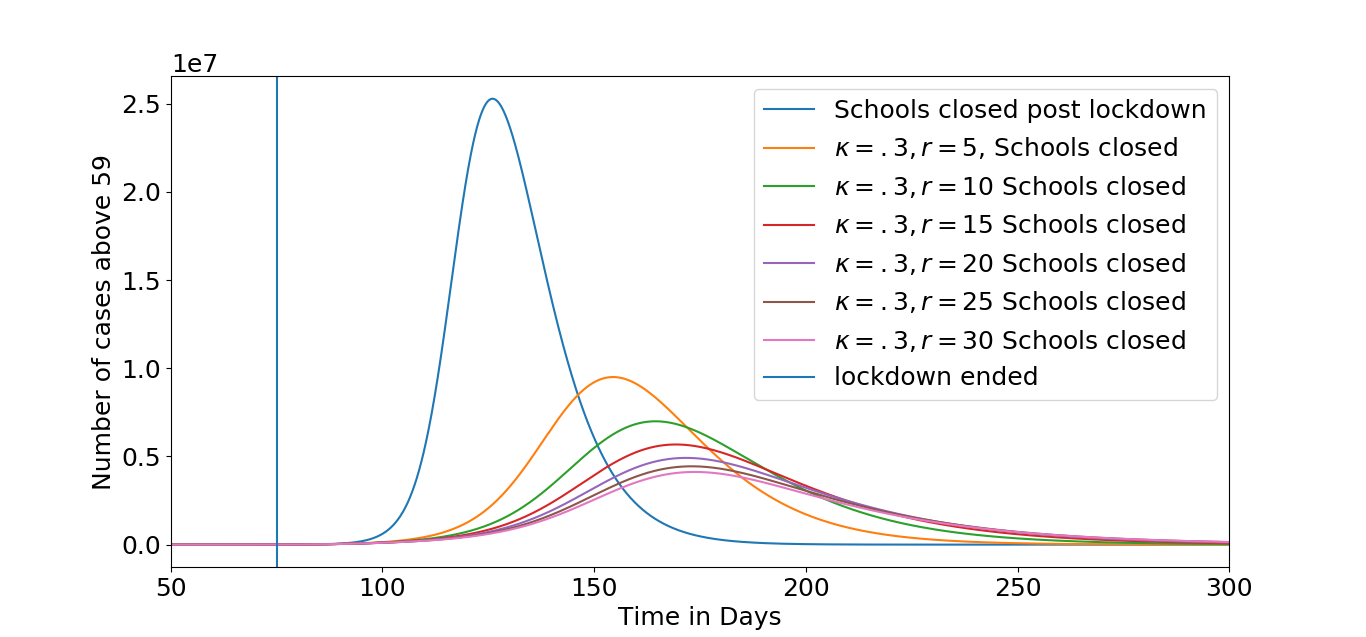
Closure of schools is one of the most often considered non-pharmaceutical intervention to control a pandemic cauchemez2008estimating . In this section, we first analyse the effect of keeping schools closed after the lockdown is over i.e. on day ( May in present scenario), in the absence of fear. This is done by keeping the values of contact matrix of school, . As seen in Fig. 5(a), this step, while shifting the peak of the curve, reduces the height of peak very little ascompared to original curve. Hence, it may be concluded that by just keeping schools closed and opening all other places after the lockdown will not have substantial effect on the containment of epidemic.
In order to decipher the effect of media induced fear, we simulated the effect of closing schools in the proposed SFEIR model and observed a drastic reduction in number of infected individuals. The curve becomes considerably flat.
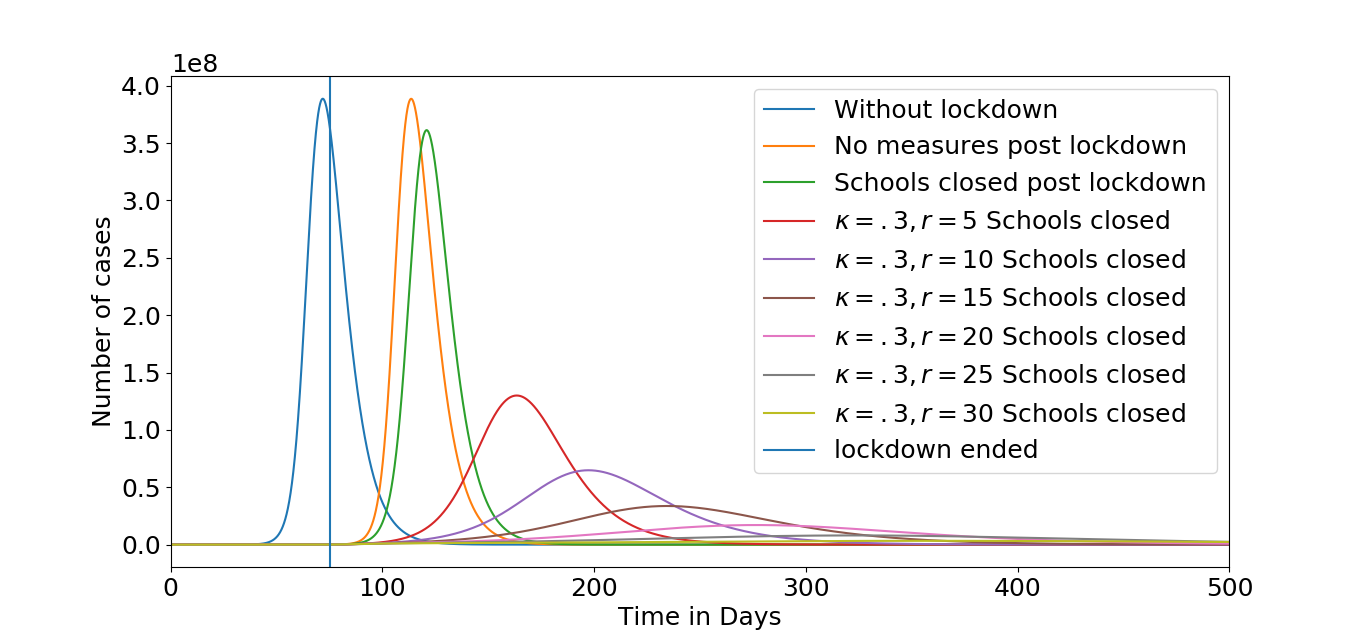
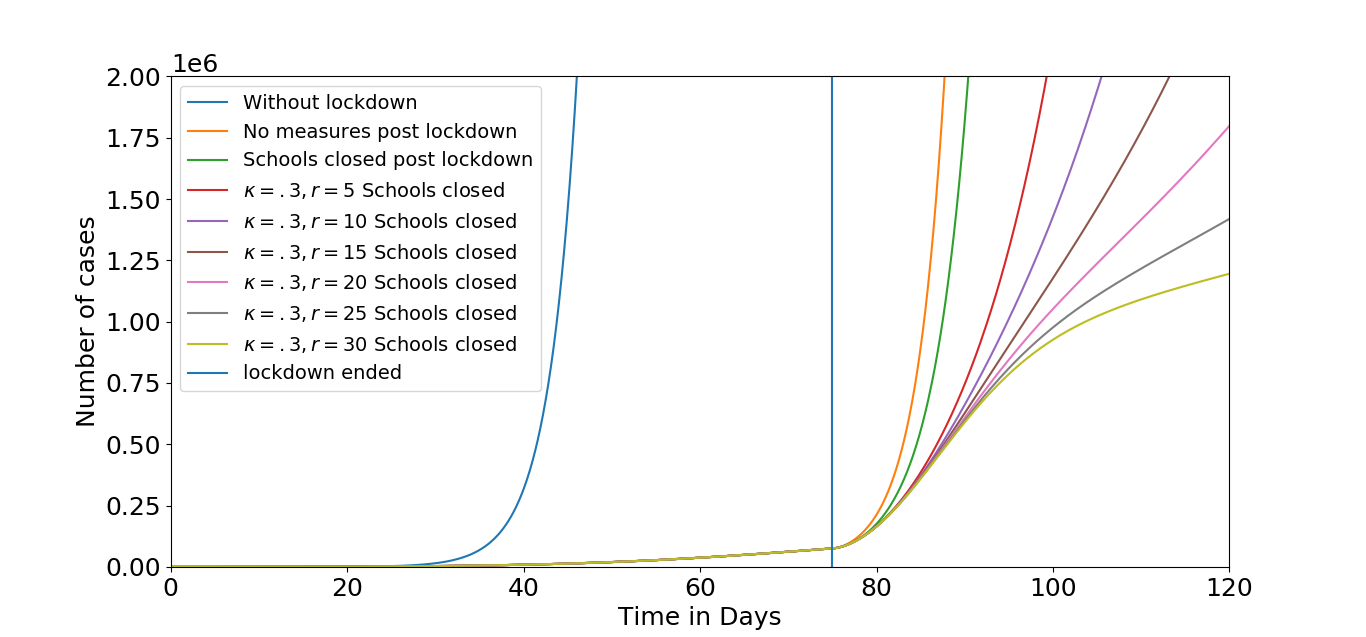
Variation of
We tried to analyse the effect of varying while keeping the schools closed. We first kept fixed at value of 10 and varied from 0.1 to 0.6 with step size of 0.1. As the value of increases, curve almost becomes flat with curve peak height at around 175 days for =0.2 (shown in Fig. 5(a)). The peak height of curve shifts further to around 200 days with further flattening as increases to 0.3. Thus, keeping schools closed in post-lockdown simultaneously with the fear induced conditional learning can have drastic effect in reducing the number of infected individuals. Fig. 5(c) shows the smaller time frame of Fig. 5(a), in which it can be clearly seen that the slope of curve decreases sharply as the value of increases.
Variation of
To see the effect of in conjunction with keeping schools closed, we kept at a constant value of 0.3 and varied from 5 to 30 with the step size of 5. The curve peak for = 5 shifts to day and raising to 10 further shifts the peak to around day as well as flattens it significantly as shown in Fig. 5(b). In smaller time frame, in Fig. 5(d), it can be easily seen that as increases, slope of the curve decreases.
III.4 Comparative analysis of fear conditioning with schools closure for different time periods
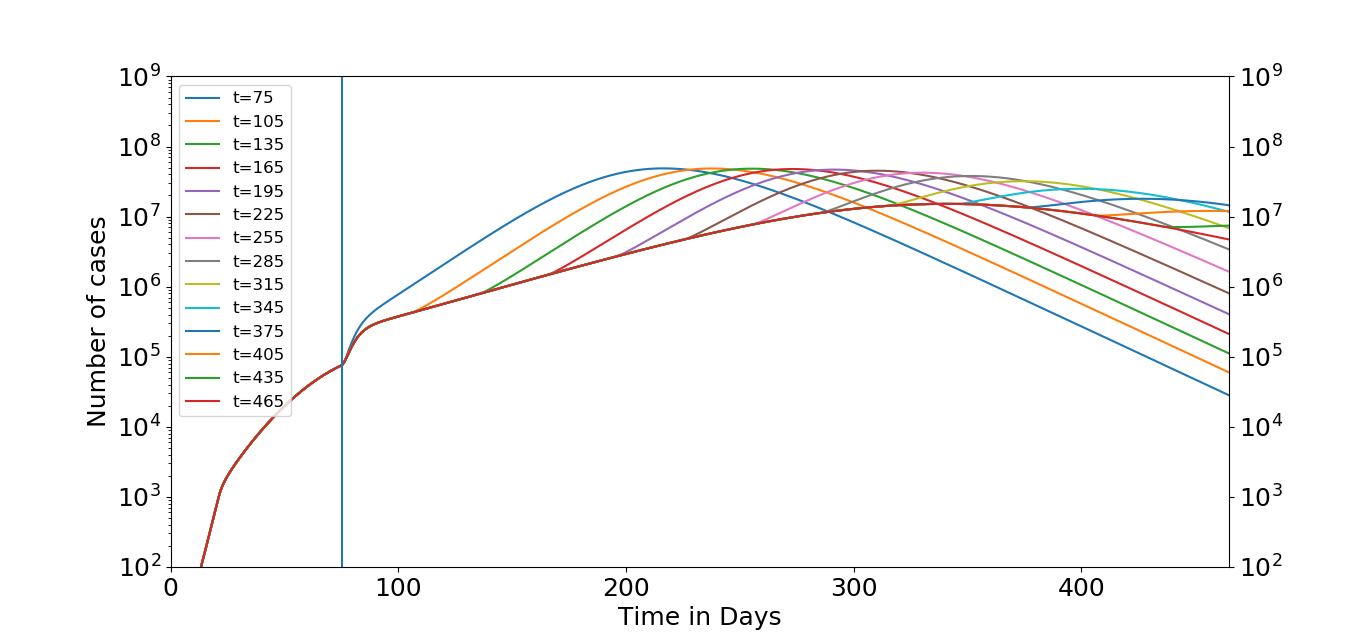
Here, we have analysed the time needed to keep schools closed along with the intensity of fear conditioning (characterized by and ) required for controlling the COVID-19 pandemic in post-lockdown phase in India. We chose two set of values of and from Fig. 3(c) and 3(d) one belonging to high peak region and and the other belonging to low peak region. was kept fixed to 0.1. Thus, four cases were designed:
Case I (Fig. 6(a)) : (high peak region) = 0.2 and (high peak region) = 10
Case II (Fig. 6(b)) : (low peak region) = 0.6 and (high peak region) = 10
Case III (Fig. 6(c)) : (high peak region) = 0.2 and (low peak region) = 60
Case IV (Fig. 6(d)) : (low peak region) = 0.6 and (low peak region) = 60
For each case, different time periods of keeping schools closed were plotted starting from 75 days (i.e. May, in present scenario) to 465 days with step size of 30 days. In case I, severity of pandemic is still substantial and schools closure does not have much effect. In cases II and III, if schools are kept closed, exponential increase in number of infections is halted. This will constraint the growth of pandemic but as soon as schools are repopened, number of infections will spike upward. Therefore, schools need to be kept closed for very long period of time, which is not at all practical. However, this combination can control the epidemic spread till the vaccines and medicines are available. Results are summarized in Fig. 6(b) and 6(c) . In case IV, as shown in Fig. 6(d), the curve has a negative slope if schools are kept closed. The number of cases reduces to less than 100 if schools are opened after about 420 days from March, 2020. Therefore, and values both in low peak region can have a significant effect in constraining the pandemic.

III.5 Effect on infections due to fear conditioning on specific age-groups
Effect of varying among young and middle age population on old age population
Across the world, critical care admission and mortality rate have been highest in people with age greater than 60 onder2020case ; cdc ; who ; dowd2020demographic . Hence, we checked what will be the effect of increasing fear conditioning among young and middle aged people on the infections in old individuals. For this, we divided the number of infected individuals into three groups: , 0- 9 years old; , 10-59 years old; , 60-79 years old.
To realise the same, we fixed the values of to for and for the , and varied for keeping the reward equal to for group (as is zero for this group, it doesn’t matter what value of is used) and for other two groups.
In Fig. 7(a), it can be seen that increasing the in reduces the number of infections in . If schools are also kept closed, infection numbers reduced further as shown in 7(b). Thus, keeping schools closed and inducing information based fear conditioning among young and middle-age group population can significantly reduce the infections among older population in post-lockdown period. Reduction in peak height and flattening of curve expound the effect of fear.
Effect of varying among young and middle age population on old age population
Lastly, effect of varying reward among young and middle age group was evaluated on infections among old age people. for was kept at 0, for at 0.1 and for at 0.3. Reward parameter was kept 0 for , 10 for and was varied from 5 to 30 in steps of 5 for . Number of infectious individuals among members of reduces as seen in Fig. 7(c) and 7(d). When supplemented with keeping schools closed in post lock-down phase, number of infections among were observed to be further reduced, as shown in Fig. 7(d).
IV Discussion
Fear is an emotion that plays an important role in the survival of an individual. Mass media (like, television, community radio, internet and print media etc.), having ability to disseminate the information to a lot of people even in remote areas, can also very easily propagate the fear about a disease among masses. Thus, its proper usage can affect the course of progression of COVID-19 as was observed during polio vaccination programs obregon2009achieving . To highlight the importance of media in order to make community driven changes rather than forced interventions from government, in this work, we modelled the media induced fear conditioning supplemented by positive reinforcement in the Indian population. Reward parameter , quantifying the effect of positive reinforcement via various media platforms, was used as an abstract parameter that can represent various methods of positive reinforcement, like, praise for having certain beliefs that may be accorded by the social, religious and political leaders. The simulation results show that if more people become fearful, the number of COVID-19 infections will decrease significantly. This manifests mainly because fearful people will socialize less felix2016bidirectional , and will take more precautions in their daily life. Excessive fear conditioning can result in abnormal behaviours, like, specific phobias stein2006specific and obsessive compulsive disorder milad2013deficits . Therefore, care must be taken while developing practical methods of implementing fear conditioning so as to minimize the risk of such abnormal behaviors.
The SFEIR model also predicted that only keeping schools closed in post-lockdown phase while opening everything else will not substantially reduce the total number of infections, a finding that has also been reported in viner2020school . However, SFIER model suggests that if paired with moderately high fear conditioning, schools closure can have a significant effect on mitigating COVID-19 spread. This can be explained by the fact that keeping the schools closed decreases the number of contacts significantly for younger generation aged 0-30 prem2017projecting but does not alter the probability of infection. Fear conditioning on the other hand works by reducing the probability of transmission as well as the number of contacts. Therefore, when two of these are used simultaneously, probability of infection transmission decreases significantly.
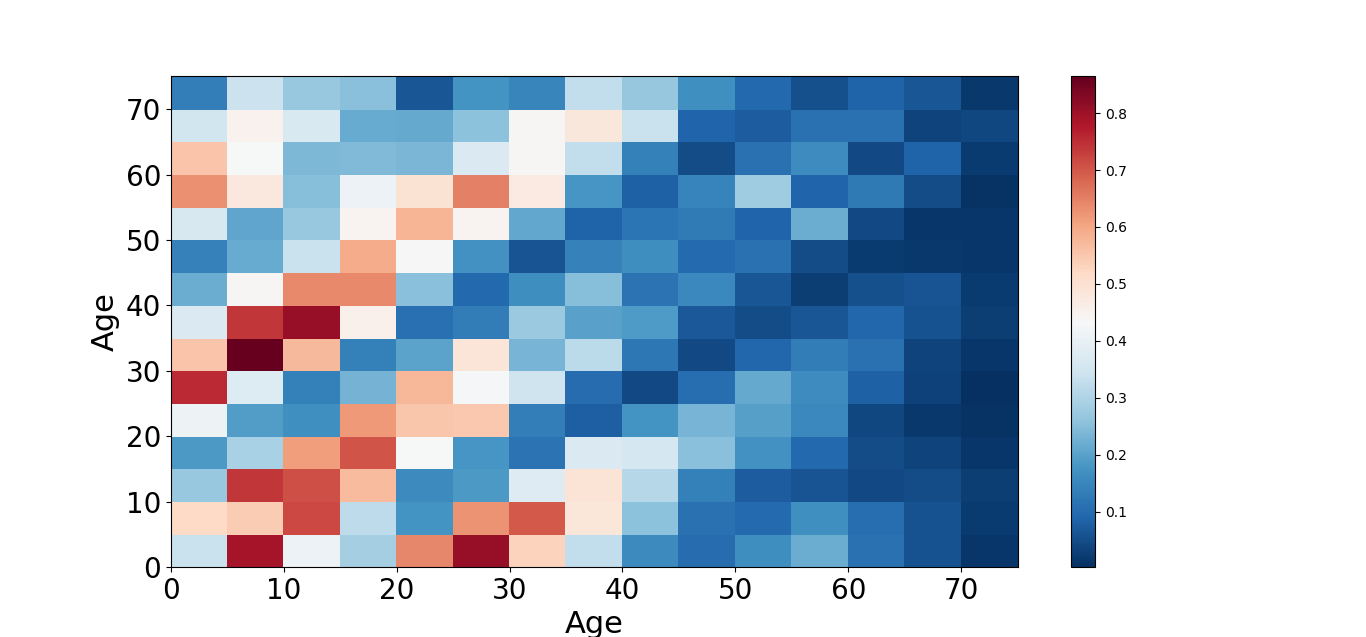
Against COVID-19 pandemic, people in the age group have been found to have the highest propensity of being admitted to ICUs and also have the highest mortality rate onder2020case . One of the important predictions of the model is that if people in age-group 10-59 () are fearful, this will have a substantial effect on number of infections in age group 60-79 (). In India, people of all the generations interact with each other within home (as depicted in Fig. 8). So, if people in age group (10-59) are sufficiently fear conditioned, the probability of maintaining physical distance among these two groups will increase leading to effectively decreasing the number of infections in older generation even if older generation is not highly fear conditioned. In conjunction to this, keeping the schools closed in the post-lockdown phase can further reduce the number of infections among group . This can be explained by the fact that India has higher probability of contact between people in age group 0-29 and age group 60-79 as seen for the contact data at home shown in Fig. 8 below.
Limitations of the present study:
First, lack of proper age-structured data on media consumption limits the scope of model simulation. Second, standard deviation in fear time can be huge as it is also dependent upon personality of an individual. Third, reward parameter, and fraction of people developing fear both should ideally be time dependent, but we have taken these as constant parameters.
V Conclusion and policy perspectives
To the best of our knowledge, the SFEIR model developed in this work is the first attempt to incorporate media induced fear conditioning in mitigating the COVID-19 pandemic. The model predicts that fear conditioning via mass media might be a helpful strategy in reducing the COVID-19 infections in post-lockdown phase. Increasing fraction of people in fear compartment by classical conditioning and increasing fear time by operant conditioning reduced the number of infections significantly. If used in conjunction with keeping schools closed in post-lockdown phase, substantial reduction in number of infections was observed. We also examined the differential fear conditioning on different age groups in controlling the infections in elderly people. If fear conditioning is increased on individuals of age 10-59 years (group ) and exempted on kids of age 0-9 years (group ), number of infections in senior citizens of age 60-79 (group ), known to have highest mortality and hospitalization rate, is found to be reduced significantly. This condition of media induced fear conditioning supplemented with closed schools in post-lockdown phase can further decrease the number of infections in elderly people.
We propose that the presented schema of media induced fear conditioning augmented with closing of schools (including colleges and universities) in post-lockdown phase can serve as an important non-pharmaceutical intervention to prevent healthcare system from getting overburdened.
At the same time, along the lines of dhar2020critique , we would like to state that modelling results should not be interpreted as the policy guidelines too strictly. We would like to add one more precaution that, although, it is being proposed to keep the schools and universities closed for long time alongwith media induced fear conditioning, it should not be construed as proposing that other places of mass gatherings can be opened immediately. We would like to further state that our results may be treated as the guiding factor for making policy interventions but it does not mean to say that media should start showing COVID-19 news 24x7 hours. Of course, it will have a positive effect on smoothening the curve but maintaining a balance in media streaming is necessary so as to not induce fear psychosis in the citizens. Social, religious as well as political leaders have the capability and responsibility to supplement positive reinforcement for this media induced fear.
VI Declaration of Competing Interest
The authors declared that there is no conflict of interest.
References
- (1) WHO. World health organization. https://www.who.int/news-room/detail/08-04-2020-who-timeline---covid-19, 2020. Accessed: 2020-05-14.
- (2) Worldometer. Covid-19 coronavirus pandemic. https://www.worldometers.info/coronavirus/, 2020. Accessed: 2020-05-25.
- (3) A. Zhigljavsky et al. Comparison of different exit scenarios from the lock-down for covid-19 epidemic in the uk and assessing uncertainty of the predictions. arXiv preprint arXiv:2004.04583, 2020.
- (4) M. Gilbert et al. Preparing for a responsible lockdown exit strategy. Nature Medicine, pp. 1–2, 2020.
- (5) S. Funk et al. The spread of awareness and its impact on epidemic outbreaks. Proceedings of the National Academy of Sciences, 106(16):6872–6877, 2009.
- (6) S. Del Valle et al. Effects of behavioral changes in a smallpox attack model. Mathematical biosciences, 195(2):228–251, 2005.
- (7) M. A. Riva et al. Pandemic fear and literature: observations from jack london’s the scarlet plague. Emerging infectious diseases, 20(10):1753, 2014.
- (8) P. Poletti et al. The effect of risk perception on the 2009 h1n1 pandemic influenza dynamics. PloS one, 6(2), 2011.
- (9) N. Perra et al. Towards a characterization of behavior-disease models. PloS one, 6(8), 2011.
- (10) J. M. Epstein et al. Coupled contagion dynamics of fear and disease: mathematical and computational explorations. PLoS One, 3(12), 2008.
- (11) Y. Kim et al. Public risk perceptions and preventive behaviors during the 2009 h1n1 influenza pandemic. Disaster medicine and public health preparedness, 9(2):145–154, 2015.
- (12) B. J. Cowling et al. Community psychological and behavioral responses through the first wave of the 2009 influenza a (h1n1) pandemic in hong kong. The Journal of infectious diseases, 202(6):867–876, 2010.
- (13) A. C. Felix-Ortiz et al. Bidirectional modulation of anxiety-related and social behaviors by amygdala projections to the medial prefrontal cortex. Neuroscience, 321:197–209, 2016.
- (14) P. I. Pavlov. Conditioned reflexes: an investigation of the physiological activity of the cerebral cortex. Annals of neurosciences, 17(3):136, 2010.
- (15) S. Maren. Neurobiology of pavlovian fear conditioning. Annual review of neuroscience, 24(1):897–931, 2001.
- (16) M. Davis. The role of the amygdala in fear and anxiety. Annual review of neuroscience, 15(1):353–375, 1992.
- (17) B. F. Skinner. The behavior of organisms: An experimental analysis. BF Skinner Foundation, 2019.
- (18) S. Towers et al. Mass media and the contagion of fear: the case of ebola in america. PloS one, 10(6), 2015.
- (19) M. A. Wakefield et al. Use of mass media campaigns to change health behaviour. The Lancet, 376(9748):1261–1271, 2010.
- (20) S. Collinson and J. M. Heffernan. Modelling the effects of media during an influenza epidemic. BMC public health, 14(1):376, 2014.
- (21) S. Collinson et al. The effects of media reports on disease spread and important public health measurements. PloS one, 10(11), 2015.
- (22) Q. Yan et al. Media coverage and hospital notifications: Correlation analysis and optimal media impact duration to manage a pandemic. Journal of theoretical biology, 390:1–13, 2016.
- (23) E. Bakshy et al. The role of social networks in information diffusion. In Proceedings of the 21st international conference on World Wide Web, pp. 519–528, 2012.
- (24) K. Prem et al. Projecting social contact matrices in 152 countries using contact surveys and demographic data. PLoS computational biology, 13(9):e1005697, 2017.
- (25) R. Singh and R. Adhikari. Age-structured impact of social distancing on the covid-19 epidemic in india. arXiv preprint arXiv:2003.12055, 2020.
- (26) W. O. Kermack and A. G. McKendrick. A contribution to the mathematical theory of epidemics. Proceedings of the royal society of london. Series A, Containing papers of a mathematical and physical character, 115(772):700–721, 1927.
- (27) B. Tang et al. An updated estimation of the risk of transmission of the novel coronavirus (2019-ncov). Infectious disease modelling, 5:248–255, 2020.
- (28) S. E. Eikenberry et al. To mask or not to mask: Modeling the potential for face mask use by the general public to curtail the covid-19 pandemic. Infectious Disease Modelling, 2020.
- (29) W. Schultz. Behavioral theories and the neurophysiology of reward. Annu. Rev. Psychol., 57:87–115, 2006.
- (30) L. G. Humphreys. The effect of random alternation of reinforcement on the acquisition and extinction of conditioned eyelid reactions. Journal of Experimental Psychology, 25(2):141, 1939.
- (31) BARC. Broadcast audience research council india. https://www.barcindia.co.in/resources/pdf/BARC%20India%20Universe%20Update%20-%202018.pdf, 2018. Accessed: 2020-05-14.
- (32) AMS. Study on listenership, reach and effectiveness of community radio stations in india. https://mib.gov.in/sites/default/files/AMS%20Report%20on%20CRS.pdf, 2018. Accessed: 2020-05-13.
- (33) IAMAI. India internet 2019. https://cms.iamai.in/Content/ResearchPapers/d3654bcc-002f-4fc7-ab39-e1fbeb00005d.pdf, 2019. Accessed: 2020-05-13.
- (34) MRUC. Indian readership survey. https://mruc.net/uploads/posts/195a27e70e0ddae2aa3601970e191531.pdf, 2019. Accessed: 2020-05-12.
- (35) IPSOS. Trust in the media. https://www.ipsos.com/sites/default/files/ct/news/documents/2019-06/global-advisor-trust-in-media-2019.pdf, 2019. Accessed: 2020-05-13.
- (36) A. J. Kucharski et al. Early dynamics of transmission and control of covid-19: a mathematical modelling study. The lancet infectious diseases, 2020.
- (37) COVID-19. Covid-19 india. www.covid19india.org, 2020. Accessed: 2020-05-14.
- (38) V. Singh. Modelling methodologies for systems biology. In Systems and Synthetic Biology, pp. 43–62. Springer, Dordrecht, 2015.
- (39) PopulationPyramid. Population pyramids of the world from 1950 to 2100. https://www.populationpyramid.net/india/2019/, 2019. Accessed: 2020-05-13.
- (40) S. Cauchemez et al. Estimating the impact of school closure on influenza transmission from sentinel data. Nature, 452(7188):750–754, 2008.
- (41) G. Onder et al. Case-fatality rate and characteristics of patients dying in relation to covid-19 in italy. Jama, 2020.
- (42) CDC. Centers for disease control and prevention. https://www.cdc.gov/nchs/nvss/vsrr/covid19/index.htm, 2020. Accessed: 2020-05-14.
- (43) WHO. World health organisation. https://www.who.int/publications-detail/report-of-the-who-china-joint-mission-on-coronavirus-disease-2019-(covid-19), 2020. Accessed: 2020-05-14.
- (44) J. B. Dowd et al. Demographic science aids in understanding the spread and fatality rates of covid-19. Proceedings of the National Academy of Sciences, 117(18):9696–9698, 2020.
- (45) R. Obregón et al. Achieving polio eradication: a review of health communication evidence and lessons learned in india and pakistan. Bulletin of the World Health Organization, 87:624–630, 2009.
- (46) D. J. Stein and H. Matsunaga. Specific phobia: a disorder of fear conditioning and extinction. CNS spectrums, 11(4):248–251, 2006.
- (47) M. R. Milad et al. Deficits in conditioned fear extinction in obsessive-compulsive disorder and neurobiological changes in the fear circuit. JAMA psychiatry, 70(6):608–618, 2013.
- (48) R. M. Viner et al. School closure and management practices during coronavirus outbreaks including covid-19: a rapid systematic review. The Lancet Child & Adolescent Health, 2020.
- (49) A. Dhar. A critique of the covid-19 analysis for india by singh and adhikari. arXiv preprint arXiv:2004.05373, 2020.