CERN-EP-2020-031 \AtlasTitlePerformance of the ATLAS muon triggers in Run 2 \AtlasJournalJINST \AtlasJournalRefJINST 15 (2020) P09015 \AtlasDOI10.1088/1748-0221/15/09/p09015 \AtlasAbstract The performance of the ATLAS muon trigger system is evaluated with proton–proton () and heavy-ion (HI) collision data collected in Run 2 during 2015–2018 at the Large Hadron Collider. It is primarily evaluated using events containing a pair of muons from the decay of bosons to cover the intermediate momentum range between 26 GeV and 100 GeV. Overall, the efficiency of the single-muon triggers is about 68% in the barrel region and 85% in the endcap region. The range for efficiency determination is extended by using muons from decays of mesons, bosons, and top quarks. The performance in HI collision data is measured and shows good agreement with the results obtained in collisions. The muon trigger shows uniform and stable performance in good agreement with the prediction of a detailed simulation. Dedicated multi-muon triggers with kinematic selections provide the backbone to beauty, quarkonia, and low-mass physics studies. The design, evolution and performance of these triggers are discussed in detail. \AtlasRefCodeTRIG-2018-01
1 Introduction
The presence of prompt muons in the final state is a distinctive signature for many physics processes studied in collisions at the Large Hadron Collider (LHC). These studies include measurements of properties of the Higgs boson and Standard Model processes, searches for new phenomena, and a B-physics and Light States (BLS) programme. A high-performance muon trigger is crucial for recording a high-quality data set serving the various physics analyses. In parallel, a good simulation of the trigger performance is necessary.
The ATLAS muon trigger system identifies muons produced in proton–proton () or heavy-ion (HI) interactions. It is designed to do so with high efficiency and low muon transverse momentum () thresholds. The system employs a two-level, multi-pronged strategy with
-
1.
fast custom trigger electronics at Level-1 (L1);
-
2.
dedicated algorithms to reconstruct muons and estimate their parameters at the High-Level Trigger (HLT).
In order to address a wide variety of physics topologies, ATLAS has developed a suite of triggers designed to select muons. A single-muon trigger with a threshold of 26 GeV is used by many physics analyses. In addition, muon triggers in combination with electrons, -leptons, jets and missing transverse momentum, as well as multi-muon triggers with lower muon thresholds, increase the sensitivity for various physics phenomena which benefit from a lower threshold. For the BLS programme studying beauty, quarkonia, and low-mass physics, various low- multi-muon triggers are used with a special configuration that allows a high trigger efficiency for non-prompt muons.111Non-prompt muons are muons which originate from the decay of a secondary particle and are displaced from the primary interaction vertex.
During the LHC Run 2 (2015–2018), the ATLAS experiment collected collision data at a centre-of-mass energy of 13 TeV with a maximum instantaneous luminosity of . The average number of interactions occurring in the same bunch crossing, , was 13 on average in 2015 and increased during the data-taking period to 25 in 2016, 38 in 2017, and 36 in 2018. Such interactions beyond the interaction of interest, as well as interactions from neighbouring bunch crossings, are called pile-up interactions. To cope with such harsh conditions, several improvements, on both the hardware side and software side, were deployed before the start of Run 2 and during the data-taking campaign. In this paper, the performance of the ATLAS muon trigger is evaluated, primarily using samples containing muon pairs from boson decays. The performance of the low- muon triggers ( GeV) is evaluated with samples containing a pair of muons from the decay of mesons. The performance of the high- muon triggers ( GeV) is evaluated using events containing top quarks or bosons, where a boson decays into a muon and neutrino.
2 The ATLAS detector
The ATLAS experiment is a multipurpose particle detector with a forward–backward cylindrically symmetric geometry and almost 4 coverage in solid angle,222ATLAS uses a right-handed coordinate system with its origin at the nominal interaction point (IP) in the centre of the detector and the -axis along the beam pipe. The -axis points from the IP to the centre of the LHC ring, and the -axis points upward. Cylindrical coordinates (, ) are used in the transverse plane, being the azimuthal angle around the beam pipe. The pseudorapidity is defined in terms of the polar angle as . Angular distance is measured in units of . and is composed of four major sub-detectors: an inner tracking detector (ID), a calorimetry system subdivided into an electromagnetic calorimeter and a hadronic calorimeter, and a muon spectrometer (MS). A detailed description of the ATLAS detector can be found in Ref. [PERF-2007-01, ATLAS-TDR-2010-19, PIX-2018-001]. Muons are measured independently in the ID and in the MS. The ID consists of a silicon pixel detector, a silicon microstrip detector and a transition radiation straw tube tracker, and is embedded in a solenoid, providing a magnetic field of 2 T. The ID measures charged-particle tracks up to .
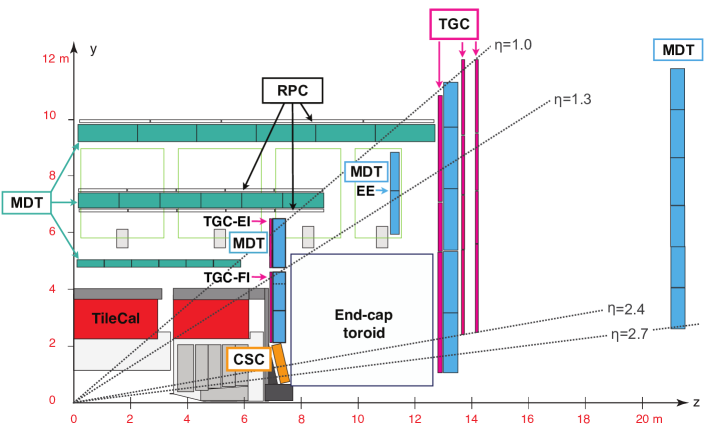
The MS is based on three large air-core superconducting toroidal magnet systems (two endcaps and one barrel) with eight coils each, providing a field integral between 2.0 Tm and 6.0 Tm across most of the detector acceptance. Figure 1 shows a quarter-section of the muon system in a plane containing the beam axis. In the central region, the detectors compose a barrel that is arranged in three concentric cylindrical shells around the beam axis. In the endcap region, the muon chambers form large wheels, perpendicular to the -axis. Several detector technologies are utilised to provide both precision tracking and triggering. The deflection of the muon trajectory in the magnetic field is detected using hits in three layers of precision monitored drift tube (MDT) chambers for < 2. In the region 2.0 < < 2.7, two layers of MDT chambers in combination with one layer of cathode strip chambers (CSC) are used. Three layers of resistive plate chambers (RPC) in the barrel region ( < 1.05), and three layers of thin gap chambers (TGC) in the endcap regions (1.05 < < 2.4) provide the L1 muon trigger and the read-out of the coordinate in the – projection.
3 Data and simulation samples
Several data samples collected by the ATLAS detector are used to measure the muon trigger efficiency. In the following, the data samples used in the analysis are summarised. The data used in the measurements to derive the collisions trigger performance rates and efficiencies were collected during Run 2 in 2015–2018 with collisions at a centre-of-mass energy of 13 TeV, amounting to a total integrated luminosity of 139 fb-1 [ATLAS-CONF-2019-021, LUCID2]. Only data recorded with stable beams and with all relevant sub-detector systems fully operational are considered and accounted for in the integrated luminosity calculation. The trigger performance measured in collision data is compared with predictions of Monte Carlo (MC) simulation. Generated samples were processed by the detector simulation of the ATLAS experiment based on [Agostinelli:2002hh].
The intermediate- (low-) analysis uses ( ) samples for the performance measurements. Samples of prompt decays were generated using Pythia 8.186 [Sjostrand:2007gs] complemented with Photos++ (v3.52) [Golonka:2005pn, Davidson:2010ew] to simulate the effects of final-state radiation. A requirement on the minimum transverse momentum of each muon ( GeV) was applied at the generator level. The Powheg-Box v1 MC generator [Nason:2004rx, Frixione:2007vw, Alioli:2010xd, Alioli:2008gx] was used for the simulation of the hard-scattering processes of boson production and decay in the muon channel. It was interfaced to Pythia 8.186 for the modelling of the parton shower, hadronisation, and underlying event, with parameter values set according to the AZNLO tune [STDM-2012-23]. The CT10 parton distribution function (PDF) set [Lai:2010vv] was used for the hard-scattering processes, whereas the CTEQ6L1 PDF set [Pumplin:2002vw] was used for the parton shower. The effect of quantum electrodynamics final-state radiation was simulated with Photos++ (v3.52). The EvtGen v1.2.0 program [EvtGen] was used to decay bottom and charm hadrons.
The high- analysis focuses on two event topologies: events with muons from top-quark pair production (), and events containing a leptonically decaying boson and jets (). Events from jets production ( or ) and diboson processes were simulated with the Sherpa v2.2 [Bothmann:2019yzt] generator at next-to-leading order (NLO) in QCD. Samples were generated using the NNPDF3.0NNLO PDF set [Ball:2014uwa], along with the dedicated set of tuned parton shower parameters developed by the Sherpa authors. The production of events was modelled using the Powheg-Box v2 [Frixione:2007nw] generator at NLO in QCD. Background processes are also estimated from simulation, using several generation set-ups depending on the process. Single-top production in the - and -channels was simulated with the same set-up using Powheg-Box v2 [Alioli:2009je, Frederix:2012dh] at NLO in QCD. The process was modelled using the Powheg-Box v2 [Re:2010bp, Nason:2004rx, Frixione:2007vw, Alioli:2010xd] generator at NLO in QCD in the five-flavour scheme. The process was modelled with MadGraph5_aMC@NLO at leading order in QCD. The production of , , and events was modelled using the MadGraph5_aMC@NLO v2.3.3 [Alwall:2014hca] generator at NLO in QCD. All top-quark samples were produced with the NNPDF3.0 PDF set and were interfaced with Pythia 8 [Sjostrand:2014zea] using the A14 tune [ATL-PHYS-PUB-2014-021] and the NNPDF2.3LO PDF set [Ball:2012cx].
In addition, the trigger efficiencies are also derived for data from low-pile-up collisions with an average pile-up of 1.1 at a centre-of-mass energy of 5.02 TeV. This data set was collected in November 2015, and amounts to a total integrated luminosity of 25 pb-1. The corresponding sample of simulated events was produced with a set-up similar to the one described above.
Trigger efficiency measurements for HI collisions described in this document are based on the data collected during Run 2 for ,0,0,,,