A new signature for strong light-matter coupling using spectroscopic ellipsometry
Abstract
Light-matter interactions can occur when an ensemble of molecular resonators is placed in a confined electromagnetic field. In the strong coupling regime the rapid exchange of energy between the molecules and the electromagnetic field results in the emergence of hybrid light-matter states called polaritons. Multiple criteria exist to define the strong coupling regime, usually by comparing the splitting of the polariton bands with the linewidths of the uncoupled modes. Here we highlight the limitations of these criteria and study strong coupling using spectroscopic ellipsometry, a commonly used optical characterisation technique. We identify a new signature of strong coupling in ellipsometric phase spectra. Combining ellipsometric amplitude and phase spectra yields a distinct topological feature that we suggest could serve as a new criterion for strong coupling. Our results introduce the idea of ellipsometric topology and could provide further insight into the transition from the weak to strong coupling regime.
Keywords
strong coupling, ellipsometry, polaritons, optical microcavities, optical phase response, Rabi splitting
1 Introduction
Light-matter interactions can occur when an ensemble of molecular resonators is placed in a confined electromagnetic field. If the field and resonators have similar excitation energies and the coupling strength between them exceeds the mean of their decay rates, the energy levels of the confined field mode and the resonator can be modified: they are strongly coupled1, 2. The characteristic feature of strong coupling is the formation of two hybrid states known as the upper and lower polariton bands3. Confined electromagnetic fields can be generated by optical microcavities4, 5, 6 or surface plasmons7, 8; resonances can be provided by organic molecules5, 7, 8, 6, 9, 10. The potential of strong coupling to control light-matter interactions is far ranging, with applications identified in the areas of quantum information11, 12, polaritonic chemistry13 and lasing14, among others.
Strongly coupled systems are usually characterised by an intensity measurement (such as reflectivity5, extinction8, transmission6 or luminescence7) which is used to create a dispersion plot (energy versus incident angle of light or wavevector , where is wavelength of incident light; see figure 1a for an example). The signature of strong coupling observed in these plots is an anticrossing of the confined electromagnetic mode and the material resonance. The Rabi splitting, , is the minimum energy difference between the two modes. Multiple criteria for strong coupling exist and are usually defined by comparing the linewidths of the uncoupled resonances with 2. These criteria predict the transition from weak to strong coupling at very different values of .
The combined study of the amplitude and phase response of an optical system can provide insight that is not possible from intensity measurements alone. By analysing the amplitude and phase response of plasmon antenna array etalons, Berkhout and Koenderink15 showed that points of perfect absorption in such structures are topologically protected. Kravets et al.16 showed that the phase response of plasmonic nanostructures around points of perfect absorption can be used in single molecule detection. To the best of our knowledge no experiments have studied the phase response in molecular strong coupling.
In this work we use spectroscopic ellipsometry to study the combined amplitude and phase response of strongly coupled resonances. We characterise the strong coupling of optical microcavities with organic molecules and that of surface lattice resonances with waveguide modes. We observe the transition from weak to strong coupling using the ellipsometric phase shift and identify a candidate signature of strong coupling. Combining amplitude and phase data shows that the optical response of the system undergoes a change in topology during the transition from weak to strong coupling. We compare this transition point with the existing criteria for strong coupling. Our results suggest a new criterion for strong coupling, free of the limitations of existing strong coupling criteria, and reveal a new way to study the topology of optical systems.
2 Results
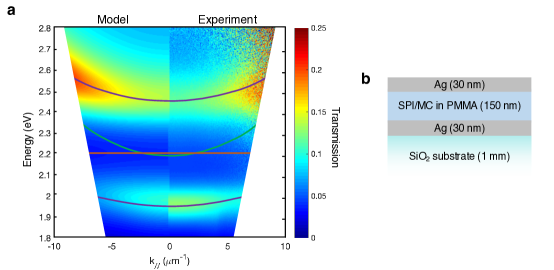
We studied strong coupling between organic molecular resonances and optical cavity modes. (See Supplementary Information for fabrication details.) The microcavity design is illustrated in figure 1b: it consisted of two silver mirrors (each of thickness 30 nm) separated by a PMMA (polymethyl methacrylate) dielectric spacer layer (thickness 150 nm). Embedded in the PMMA layer are spyropyran (SPI) molecules (1’,3’-dihydro-1’,3’,3’-trimethyl-6-nitrospiro[2H-1-benzopyran-2, 2’-(2H)-indole]). SPI is a transparent photochromic molecule: after exposure to ultraviolet radiation it undergoes photoisomerisation and is converted to merocyanine (MC)17 with an optical transition at 2.2 eV (Supplementary Figure S2). The cavity thickness was chosen so that the first-order cavity resonance occurred at 2.2 eV for light incident at . Exposing the cavity to ultraviolet radiation converts SPI to MC and the first-order cavity mode couples to the molecular resonance of MC. This allows for observation of the transition from weak to strong coupling6.
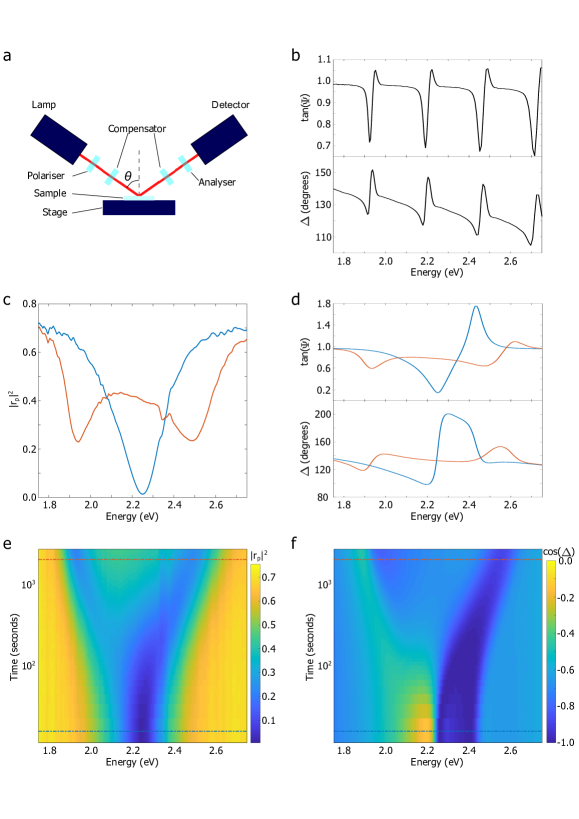
All samples were characterised using spectroscopic ellipsometry (figure 2a), which measures the complex reflection ratio in terms of the parameters and :
| (1) |
and are the Fresnel reflection (amplitude) coefficients for p- and s-polarised light, respectively; is the amplitude of and provides the ratio of and ; whilst is the difference in the phase shifts undergone by p- and s-polarised light upon reflection. (Further details in Supplementary Information.) The dominant use of spectroscopic ellipsometry is in determining the thickness and optical constants of thin films18, 19.
The ellipsometric response of a multimode Ag/PMMA/Ag microcavity (thickness µm) at is shown in figure 2b. Since these measurements were made at an oblique incident angle, the cavity resonances occur at different energies for p- and s-polarised light. In , a resonance occurs when () and also when (). is the difference between the phase change experienced by p- and s-polarised light: a cavity resonance will cause a characteristic modulation in .
We exposed the SPI microcavity to UV irradiation and measured the change in (figure 3), and its derived values (, and ; figure 2), as SPI underwent conversion to MC. All measurements were taken at .
Figure 2c shows the spectrum before and after the SPI microcavity was exposed to ultraviolet radiation. The MC resonance at 2.21 eV couples to the cavity mode at 2.24 eV; the maximum Rabi splitting observed was meV.
Figure 2e shows the time evolution of spectra of the microcavity as SPI is converted to MC. The high time resolution of our measurements (one scan every 11 seconds over a total acquisition time of 45 minutes) demonstrates a clear transition of the reflection spectrum from an uncoupled to a coupled state. After the first hundred seconds of ultraviolet exposure the cavity resonance splits into two and the rate of splitting slows down exponentially. As is directly proportional to (where is the number of MC molecules in the cavity and is the cavity volume)2, this implies that the conversion of SPI to MC molecules follows an exponential relationship with time.
We plot in figure 2d (initial and final state) and 2f (change with time; cos() has been plotted to improve contrast). In figure 2c () the upper and lower polariton bands are, like the original cavity mode, approximately Lorentzian in form. In contrast, the phase signatures of the upper and lower polariton bands in figure 2d,f have different forms, as if a point of inflection has been added to the centre of the original phase response. This differs from the phase response of the multimode cavity in figure 2b which shows closely spaced but uncoupled cavity modes. Since the MC molecular resonance does not change with and is not polarisation-dependent, the splitting of the asymmetric response of the microcavity shows that the properties of the original cavity mode have been inherited by the upper and lower polariton bands. This suggests that phase measurements can distinguish between coupled resonances and uncoupled but closely spaced resonances in a way which is not possible using intensity measurements.
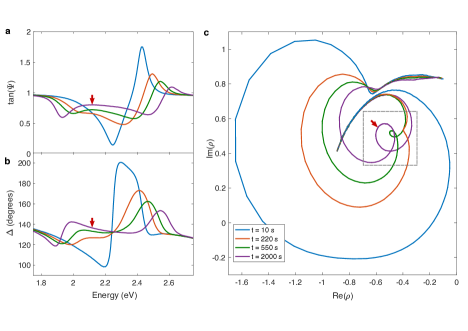
The parameters and are plotted in figures 3a-b.Four datasets are plotted in these figures: the initial SPI microcavity (blue lines, s); an intermediate point where some SPI has been converted to MC but not sufficiently for strong coupling (orange lines, s); a point at which the resonance is split in both and (green line, s); and the final strongly coupled MC microcavity (purple line, s). These datasets are used to plot in the complex plane as a function of energy (from 1.1 eV - 3.5 eV) in figure 3c. For a simple silver surface (Supplementary Figure S3a-b) traces out an arc from eV, to eV, . This arc, present in all curves in figure 3c, results from the optical response of Ag as it changes from a mirror-like response at lower energies (perfect reflection occurs at ) towards interband transitions at around 3.9 eV20.
The changes in both and associated with a cavity resonance observed at combine to add a loop that breaks the Ag arc in . This loop, representing the first-order microcavity resonance, appears along the Ag arc at (see Supplementary Figure S3c-d).
The changes in both and associated with the first-order cavity resonance combine to add a loop that appears along the Ag arc at (see Supplementary Figure S3c-d).
As SPI is converted into MC the area enclosed by the cavity resonance in reduces, corresponding to a decrease in the strength of the cavity resonance. As MC is created a “kink” appears at and grows on the side of the cavity loop (orange curves). Figure 3a shows this is a change from a single resonance to two resonances that are not yet fully distinct. Between the orange and green curves two resonances become observable in and the point of inflection in evolves into the local minimum observed in figure 2d,f. In figure 3c this corresponds to the dimple evolving into a secondary loop inside the original resonance loop (a change in ellipsometric topology). The point of maximum between the two polariton minima in the final dataset is indicated by red arrows, showing that here the secondary loop lies between the positions of the two polaritons on the primary loop. In contrast, plotting uncoupled resonances in gives one independent loop per uncoupled resonance. These loops can overlap but do not form secondary loops; see plotted for a multimode cavity in Supplementary Figure S3e-f.
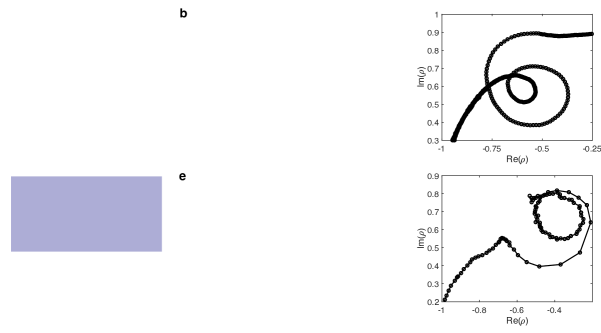
Secondary loops in are not unique to MC microcavities. Figures 4a-c show strong coupling between an optical microcavity mode and the excitonic resonance (2.1 eV) in the J-aggregate TDBC21 (see figure 4a for sample design and Supplementary Information for fabrication details). Figure 4b shows a splitting of the phase response of the initial cavity mode. Figure 4c shows a secondary loop in , similar to the one shown in figure 3c.
Figures 4d-f show strong coupling between plasmonic surface lattice resonances and optical waveguide modes. The structure (figure 4d) is a one-dimensional gold grating (period 1.55 µm, grating element width 450 nm and height 70 nm) on a 65 nm thick gold sublayer all covered by a 400 nm thick layer of hafnium(IV) oxide (see Supplementary Information for fabrication details). The grating structure supports plasmonic surface lattice resonances and the hafnium(IV) oxide layer supports guided modes which can become strongly coupled to the plasmonic surface lattice resonance at around 0.8 eV22. The parameter for such a system is plotted in figure 4f, which also shows a secondary loop. The secondary loop varies in size as the incident angle changes (see Supplementary Figure S4). The innermost points of the secondary loops and their associated values of and are indicated by red arrows. In the SPI/MC microcavity (figure 3), where the polariton bands have roughly equal amplitude, the innermost point of the secondary loop corresponded to a point between the two polariton bands. For the TDBC/cavity and SLR/waveguide (figure 4), where the polariton bands have very different amplitudes, the innermost points of both secondary loops correspond to the minima of the weaker polariton band.
3 Discussion
The existing criteria for strong coupling depend variously on the coupling strength , the Rabi splitting , the losses of the confined mode of the electric field and molecular resonator ( and , respectively) and the energy of the uncoupled cavity mode and molecular excitation . (For strong coupling .) These criteria are summarised in table 1 and discussed in detail in the Supplementary Information. Here we apply these criteria to our results and compare them with the formation of the secondary loop in figure 3.
While we cannot directly compare the coupling strength with the losses , we can compare the experimentally measurable Rabi splitting with the full-width-half-maxima (FWHM) of the uncoupled resonances of the cavity and the MC molecular transition . We modelled the SPI/MC microcavity using a Fresnel model (see Supplementary Information for details). The MC resonance was modelled using a single Lorentz oscillator:
is a dimensionless strength, and the energy of the molecular resonance. The increase in MC molecules was modelled by increasing . On average the calculated differed from the experimentally observed by , which is a good level of agreement for such a simple model. In figure 5 we plot as a function of . It is possible to measure and FWHMs in two ways: one is to use a fixed- spectrum (figure 5a: this is how all data in figures 2-4 were acquired); the other is to use a fixed- spectrum (figure 5b). We plot calculated fixed- in figure 5c and calculated fixed- in figure 5d.
| Name |
|
|
||||
|---|---|---|---|---|---|---|
| Sparrow’s23 |
|
|||||
| Savona et al.24 | ||||||
| PT-symmetric Savona et al.24, 25 | ||||||
| Ultrastrong coupling26 | ||||||
The shaded regions in figures 5c and 5d show the limits of the various strong coupling criteria described above: Sparrow’s criterion (grey), the Savona et al. criterion (red), the PT-symmetric Savona et al. criterion (green) and the ultrastrong coupling criterion (purple). We have also plotted the region (shaded blue) in which the secondary loop shown in figure 3 appears. The differences between the two plots can be explained by the difference in (and to a lesser extent by the difference in FWHM) measured in the two configurations.
The relationships between and in figures 5c and 5d are described well by a linear-log plot. For figure 5c:
and for figure 5d:
In the fixed- case the scan line in figure 5a intersects each polariton band at different , giving a larger and a larger rate of splitting with increasing . This explains why the fixed- gradient is higher than the fixed- gradient and the difference in y-intercept between the two fits, which is almost identical to the increase in when moving from fixed- to fixed- (on average ).
The higher values of in fixed- plots affect the points at which the various criteria for strong coupling are satisfied. The ultrastrong coupling criterion depends solely on , so it requires a lower value of to be fulfilled in fixed- plots. The Savona et al. and PT-symmetric criteria depend on and . As the change in is much larger than the changes in when moving from fixed- to fixed-, the Savona et al. and PT-symmetric criteria are also fulfilled at slightly lower and . The higher value in the fixed- case is sufficiently large that the Savona et al. criterion is fulfilled at the same point as Sparrow’s criterion (that is, when two resonances are first resolved). Overall, these differences are relatively small, and the relative stringencies of the criteria are largely unchanged when moving from fixed- to fixed- spectra. A fixed- spectrum can thus provide a similar level of information to that obtained from a fixed- spectrum in the analysis of strong coupling experiments.
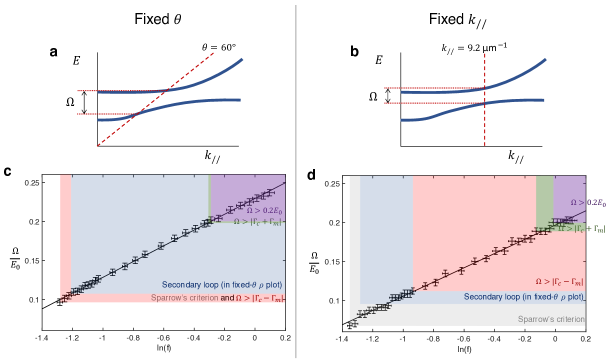
The most commonly-used criterion (the PT-symmetric Savona et al. criterion) is much more stringent, in our case being comparable with the ultrastrong coupling criterion. The variant of this criterion used in experimental analysis2 () only approximately matches the originally derived criteria since it utilises and , not and . For this reason we suggest that the PT-symmetric Savona et al. criterion is consistently too conservative in defining the transition from weak to strong coupling.
Indeed, using FWHMs in a strong coupling criterion is generally problematic. In disordered organic molecules such as MC the FWHM can be an unreliable estimate of lifetime. The FWHM of the absorption peak is often predominantly defined by the vibrational modes within the molecule which split the excitation into many closely spaced modes5, 27, 28. Furthermore, a criterion for strong coupling that uses FWHMs will be dependent upon the measurement apparatus, not just the system under interrogation. For oblique angles of incidence the measured FWHMs of modes differ depending upon whether spectra are fixed- or fixed- (compare figures 5a,b: the measured value of FWHM will depend on how the red line corresponding to the measured spectrum intersects any resonances). Additionally, it is sometimes simply not possible to characterise the uncoupled modes of a system29. It seems that the most commonplace criteria for strong coupling are somewhat limited since they rely on comparisons of FWHMs and Rabi splitting.
How else can we characterise the transition from weak to strong coupling? Ideally, a criterion for strong coupling should not be dependent upon the measurement technique. If a system is in the strong coupling regime this should clearly be apparent in multiple measuring techniques. Spectroscopic ellipsometry allows one to observe signatures of strong coupling in both amplitude and phase measurements. The formation of the secondary loop in figure 3 corresponds to the point at which the amplitude and phase signatures of strong coupling are both observed. In figure 3c the difference between required for the Savona et al. criterion and secondary loop formation is . This is less than the difference () between the experimental and calculated values of at the point of secondary loop formation, suggesting that the two criteria have a similar level of stringency. The secondary loop criterion has two advantages over the Savona et al. criterion: first, it is not dependent upon the approximation that losses can be equated with FWHM; second, whilst it can be impossible to determine if the Savona et al. criterion has been fulfilled in high-loss systems, observing the secondary loop in ellipsometry (a very low-noise technique) is straightforward. Furthermore, verifying the existence of a secondary loop in spectroscopic ellipsometry requires one to take just one measurement at a single angle. For these reasons, we suggest that studying the ellipsometric topology of a system and observing a secondary loop in could perhaps provide an alternative and useful criterion for strong coupling.
4 Conclusions
We have studied the transition from the weak to strong coupling regime in a MC microcavity using spectroscopic ellipsometry and observed a signature for strong coupling in the ellipsometric phase response. Combining amplitude and phase data produces a topologically distinct feature that we associate with strong coupling. The observation of this feature for strong coupling of both molecular/microcavity and surface lattice resonance/guided mode structures suggests it is a more general signature of strong coupling. We have compared the emergence of this change in ellipsometric topology with existing criteria for strong coupling and suggest that ellipsometric topology could provide an alternative and useful criterion for strong coupling. In summary, our results suggest a new criterion for strong coupling that does not suffer from the limitations of existing strong coupling criteria. More widely, our results suggest that spectroscopic ellipsometry may provide a powerful probe with which to explore strong coupling.
Supporting Information
Fourier transmission spectroscopy schematic; MC transmittance spectrum; ellipsometry of uncoupled systems; strong coupling of surface lattice resonances and waveguide modes; review of strong coupling criteria. This material is available free of charge via the internet at https://pubs.acs.org/
Competing interests
The authors declare no competing interests.
References
- 1 Khitrova, G., Gibbs, H. M., Kira, M., Koch, S. W. & Scherer, A. Vacuum Rabi splitting in semiconductors. Nat. Phys. 2, 81 (2006).
- 2 Törmä, P. & Barnes, W. L. Strong coupling between surface plasmon polaritons and emitters: a review. Rep. Prog. Phys. 78, 013901 (2014).
- 3 Tame, M. S. et al. Quantum plasmonics. Nat. Phys. 9, 329 (2013).
- 4 Weisbuch, C., Nishioka, M., Ishikawa, A. & Arakawa, Y. Observation of the coupled exciton-photon mode splitting in a semiconductor quantum microcavity. Phys. Rev. Lett. 69, 3314 (1992).
- 5 Lidzey, D. G. et al. Strong exciton–photon coupling in an organic semiconductor microcavity. Nature 395, 53 (1998).
- 6 Schwartz, T., Hutchison, J. A., Genet, C. & Ebbesen, T. W. Reversible switching of ultrastrong light-molecule coupling. Phys. Rev. Lett. 106, 196405 (2011).
- 7 Bellessa, J., Bonnand, C., Plenet, J. C. & Mugnier, J. Strong coupling between surface plasmons and excitons in an organic semiconductor. Phys. Rev. Lett. 93, 036404 (2004).
- 8 Fofang, N. T. et al. Plexcitonic nanoparticles: plasmon- exciton coupling in nanoshell- J-aggregate complexes. Nano Lett. 8 3481–3487 (2008).
- 9 Shalabney, A. et al. Coherent coupling of molecular resonators with a microcavity mode. Nat. Commun. 6, 1–6 (2015).
- 10 Long, J. P. & Simpkins, B. S. Coherent coupling between a molecular vibration and Fabry–Perot optical cavity to give hybridized states in the strong coupling limit. ACS Photonics, 2, 130–136 (2015).
- 11 Romero, G., Ballester, D., Wang, Y. M., Scarani, V. & Solano, E. Ultrafast quantum gates in circuit QED. Phys. Rev. Lett. 108, 120501 (2012).
- 12 Stassi, R. & Nori, F. Long-lasting quantum memories: Extending the coherence time of superconducting artificial atoms in the ultrastrong-coupling regime. Phys. Rev. A. 97, 033823 (2018).
- 13 Feist, J., Galego, J. & Garcia-Vidal, F. J. Polaritonic chemistry with organic molecules. ACS Photonics 5, 205–216 (2017).
- 14 Christopoulos, S. et al. Room-temperature polariton lasing in semiconductor microcavities. Phys. Rev. Lett. 98 126405 (2007).
- 15 Berkhout, A. & Koenderink, A. F. Perfect absorption and phase singularities in plasmon antenna array etalons. ACS Photonics, 6, 2917–2925 (2019).
- 16 Kravets, V. G. et al. Singular phase nano-optics in plasmonic metamaterials for label-free single-molecule detection. Nat. Mater. 12, 304 (2013).
- 17 Berkovic, G., Krongauz, V. & Weiss, V. Spiropyrans and spirooxazines for memories and switches. Chem. Rev. 100, 1741–1754 (2000).
- 18 Tompkins, H. & Irene, E. A. Handbook of ellipsometry. (William Andrew Publishing, 2005).
- 19 Greef, R. & Wind, M. M. Polar representation of ellipsometric data. Appl. Opt. 25, 1627–1629 (1986).
- 20 Ehrenreich, H. & Philipp, H. R. Optical properties of Ag and Cu. Phys. Rev. 128, 1622 (1962).
- 21 Dovzhenko, D. S., Ryabchuk, S. V., Rakovich, Y. P. & Nabiev, I. R. Light–matter interaction in the strong coupling regime: configurations, conditions, and applications. Nanoscale 10, 3589–3605 (2018).
- 22 Thomas, P. A., Auton, G. H., Kundys, D., Grigorenko, A. N. & Kravets, V. G. Strong coupling of diffraction coupled plasmons and optical waveguide modes in gold stripe-dielectric nanostructures at telecom wavelengths. Sci. Rep. 7, 45196 (2017).
- 23 Sparrow, C. M. On spectroscopic resolving power. Astrophys. J. 44, 76 (1916).
- 24 Savona, V., Andreani, L.C., Schwendimann, P. & Quattropani, A. Quantum well excitons in semiconductor microcavities: Unified treatment of weak and strong coupling regimes. Solid State Commun. 9, 733–739 (1995).
- 25 Bender, C. M. & Boettcher, S. Real Spectra in Non-Hermitian Hamiltonians Having PT Symmetry. Phys. Rev. Lett. 24 5243–5246 (1998).
- 26 Kockum, A. F., Miranowicz, A., De Liberato, S., Savasta, S. & Nori, F. Ultrastrong coupling between light and matter. Nat. Rev. Phys. 1 19 (2019).
- 27 Houdré, R., Stanley, R. P. & Ilegems, M. Vacuum-field Rabi splitting in the presence of inhomogeneous broadening: Resolution of a homogeneous linewidth in an inhomogeneously broadened system. Phys. Rev. A 53 2711–2715 (1995).
- 28 Fidder, H., Knoester, J. & Wiersma, D. A. Optical properties of disordered molecular aggregates: A numerical study. J. Chem. Phys. 95, 7880–7890 (1991).
- 29 Brimont, C. et al. Strong coupling of exciton-polaritons in a bulk GaN planar waveguide: quantifying the Rabi splitting. 2020, 2002.05066. arXiv. https://arxiv.org/abs/2002.05066 (accessed July 22, 2020).