MOSEL: Strong [Oiii]5007Å Emitting Galaxies at from the ZFOURGE Survey
Abstract
To understand how strong emission line galaxies (ELGs) contribute to the overall growth of galaxies and star formation history of the universe, we target Strong ELGs (SELGs) from the ZFOURGE imaging survey that have blended H+[Oiii] rest-frame equivalent widths of Å and . Using Keck/MOSFIRE, we measure 49 redshifts for galaxies brighter than mag as part of our Multi-Object Spectroscopic Emission Line (MOSEL) survey. Our spectroscopic success rate is % and uncertainty is =. We confirm 31 ELGs at and show that Strong ELGs have spectroscopic rest-frame [Oiii]5007Å equivalent widths of Å and tend to be lower mass systems [] compared to more typical star-forming galaxies. The Strong ELGs lie dex above the star-forming main-sequence at and have high inferred gas fractions of %, i.e. the inferred gas masses can easily fuel a starburst to double stellar masses within Myr. Combined with recent results using ZFOURGE, our analysis indicates that 1) strong [Oiii]5007Å emission signals an early episode of intense stellar growth in low mass [MM⋆] galaxies and 2) many, if not most, galaxies at go through this starburst phase. If true, low-mass galaxies with strong [Oiii]5007Å emission (EWrestÅ) may be an increasingly important source of ionizing UV radiation at .
1 Introduction
Hierarchical formation predicts that massive galaxies like our own Milky Way grow through the merger and accretion of smaller systems (Peebles, 1970), thus low-mass galaxies that are chemically pristine can provide insight into the early stages of galaxy formation. Although low-mass galaxies are abundant, identifying the ones that are the least chemically evolved via emission lines is difficult due to their rare nature in the local universe. In the past decade, dwarf galaxies with strong [Oiii]5007Å emission at (Cardamone et al., 2009; Izotov et al., 2011) have been identified using optical imaging where the large equivalent width of the emission line increases the broadband flux. Valuable insight is gained by measuring, e.g. star formation conditions and ionizing escape fractions (Amorín et al., 2012; Jaskot & Oey, 2013; Izotov et al., 2016; Bian et al., 2016; Lofthouse et al., 2017; Izotov et al., 2018), in these local “green pea” galaxies. For example, studies find that strong H+[Oiii]5007Å emission are ubiquitous in Lyman-break galaxies at (Smit et al., 2014).
A number of studies have now identifed dwarf galaxies () at with strong [Oiii]5007Å emission that may bridge local “green peas” to primeval galaxies at . Slit-less near-infrared spectroscopy with the Hubble Space Telescope has revealed a population of dwarf galaxies up to with rest-frame [Oiii]5007Å equivalent widths of EWrestÅ (e.g. Straughn et al., 2009; van der Wel et al., 2011; Atek et al., 2011). Dedicated ground-based spectroscopic surveys also have identifed Strong Emission Line Galaxies (SELGs) up to (Amorín et al., 2015). These studies suggest that the number density of SELGs increases with redshift (e.g. Maseda et al., 2018). However, quantifying the evolving number density of strong [Oiii]5007Å emitting galaxies at requires near-infrared spectroscopy (m), thus only a handful of systems have been confirmed at (de Barros et al., 2016; Nakajima et al., 2016; Amorín et al., 2017).
Once identified, the natural question then is how these strong [Oiii]5007Å emitting galaxies fit into our existing picture of galaxy formation. The increasing number of Strong ELGs combined with the brief duration of this intense starburst phase ( Myr; Guo et al., 2016; Ceverino et al., 2018) supports a model where galaxies grow through multiple intense starbursts. For starburst systems at with low metallicities, such an episode can signal the initial major growth spurt, i.e. the ELGs with the highest equivalent widths (EWrestÅ) are “first burst” systems (Cohn et al., 2018). In combination with studies of, Lyman-break galaxies at with strong H+[Oiii]5007Å emission (Roberts-Borsani et al., 2016), we can use SELGs to test current galaxy formation models that capture the intricate interplay of physics on the sub-kpc scale with the integrated galaxy properties that can be measured at (Krumholz et al., 2017).
An increasing population of Strong ELGs with redshift also has important implications for cosmic reionization. These vigorously star-forming galaxies have steep UV slopes () and low metallicities (; Forrest et al., 2018; Cohn et al., 2018), i.e. the SELGs may be a tremendous source of UV photons. By identifying the strong [Oiii]5007Å emitting galaxies, we can then measure their Lyman-Continuum emission and escape fractions to infer if SELGs at can generate the UV photons needed to reionize the universe (Ouchi et al., 2009; Mitra et al., 2013; Robertson et al., 2015). Ideally we would track SELGs from to the first galaxies at . However, current near-infrared instruments place a redshift limit of for identifying [Oiii]5007Å emitters which are the focus of our study.
An effective method to identify galaxies with strong [Oiii]5007Å emission (EWrestÅ) at is to first use deep multi-band photometry to select candidates and then confirm with near-IR spectroscopy. The ELGs with the strongest [Oiii]5007Å emission tend to be low-mass (; e.g. Maseda et al., 2013, 2014) systems, thus sensitive multi-wavelength imaging is needed to push down in stellar mass to select candidates. Precise photometric redshifts at also are essential for identifying strong emission line features in the Spectral Energy Distributions (SEDs), and this requires medium-band near-IR imaging. Lastly, only with deep near-IR spectroscopy can the extreme [Oiii]5007Å nature of these systems be confirmed.
With the advent of deep near-IR imaging surveys and sensitive near-IR spectrographs, we are now able to identify these strong [Oiii]5007Å emitting galaxies at . Our method is similar to studies that couple near-IR imaging and near-IR spectroscopy to identify galaxies with strong equivalent widths at , e.g. 3D-HST (Maseda et al., 2013, 2014, 2018). First we use the ZFOURGE survey that measures precise photometric redshifts to objects by combining deep imaging with medium-band near-IR filters and public multi-wavelength observations (redshift uncertainties of %; Straatman et al., 2016). At , the ZFOURGE survey is 80% mass-complete to and measures star formation rates down to yr-1 (Tomczak et al., 2016).
With photometry spanning observed UV to mid/far-IR, we then construct composite SEDs that are defined by the underlying galaxy populations (Kriek et al., 2011; Forrest et al., 2016). In our analysis of ZFOURGE galaxies at , we discovered a population of galaxies with blended rest-frame H+[Oiii] equivalent widths in excess of Å (Forrest et al., 2017). In comparison, there are only galaxies with such extreme H+[Oiii] at (Forrest et al., 2018). The rapid increase in the number density of the extreme H+[Oiii] emitting galaxies from to suggests potentially explosive growth at higher redshift (see also van der Wel et al., 2011).
To spectroscopically confirm the H+[Oiii] emitting galaxies identified in ZFOURGE, we introduce our Multi-Object Spectroscopic Emission Line (MOSEL111Mosel is also one of the 13 official German wine regions (Weinbaugebiete) and known for Riesling and Pinot Noir.) survey. In this paper, we focus on Emission Line Galaxies (ELGs) at to measure their redshifts and rest-frame [Oiii]5007Å equivalent widths and line-widths. We combine our spectroscopic measurements with physical properties obtained from deep multi-band imaging to infer gas fractions and virial masses, and test disk formation models.
By identifying Strong ELGs up to (Forrest et al., 2017, 2018), MOSEL complements existing emission line searches conducted with the Hubble Space Telescope. Due to the wavelength ranges of the WFC3 and ACS grisms, blind spectroscopic surveys such as 3D-HST (Momcheva et al., 2016), WISP (Atek et al., 2011), and PEARS (Straughn et al., 2008) are limited to SELGs at . Our medium-band NIR imaging from ZFOURGE combined with public legacy datasets enables us to reach comparable stellar masses as the blind spectroscopic surveys ( at ; Straatman et al., 2016). At , we also span comparable ranges in rest-frame equivalent width (Å) and spectral line flux (erg s-1 cm-2 Å-1) as the lower redshift studies.
In our analysis, we use AB magnitudes and the galaxy parameters measured by Forrest et al. (2017, 2018) for the ZFOURGE data-set. FAST (Kriek et al., 2009) is used to fit the SEDs assuming a Chabrier Initial Mass Function and an SED library with 1/5 solar metallicity and emission lines (see Salmon et al., 2015; Forrest et al., 2018). We assume , =0.7, km s-1 Mpc-1, and a flat Universe; the corresponding angular scale at is 7.7 kpc per arcsec.
2 Data & Methods
2.1 Selecting Emission Line Galaxies
The following summarizes the ZFOURGE observations we used to measure photometric redshifts and galaxy properties as well as to generate the composite SEDs. For complete descriptions of the data products used here, we refer the reader to the ZFOURGE survey paper by Straatman et al. (2016) and analysis of star formation rates by Tomczak et al. (2016).
2.1.1 ZFOURGE Imaging Catalogs
We use the deep near-IR imaging from the FourStar Galaxy Evolution survey (ZFOURGE; Straatman et al., 2016) obtained with the FourStar imager (Persson et al., 2013) on the Magellan Telescope of three legacy fields: CDFS (Giacconi et al., 2002), COSMOS (Scoville et al., 2007), and UDS (Lawrence et al., 2007). ZFOURGE divides the J-band filter into , , and and the H-band filter into and ; ZFOURGE also obtains deep imaging that is used as the detection image. In combination with existing multi-wavelength observations, ZFOURGE provides high precision photometric redshifts with (Straatman et al., 2016) for over 70,000 objects; the redshift precision is confirmed by the ZFIRE spectroscopic survey (Nanayakkara et al., 2016).
We incorporate HST imaging from CANDELS (Grogin et al., 2011; Koekemoer et al., 2011) spanning 0.3m to 1.6m to measure photometry and galaxy properties. We also use Spitzer/IRAC (all four channels) and MIPS data (m) for the CDFS, COSMOS, and UDS fields (GOODS-S: PI Dickinson, COSMOS: PI Scoville, UDS: PI Dunlop), and 100 and 160m for CDFS. For CDFS only, we include public Herschel/PACS data (Elbaz et al., 2011). Total star formation rates are calculated by combining the UV and IR contributions; see Tomczak et al. (2016, §2) for a detailed description.
2.1.2 Candidate Emission Line Galaxies at
ZFOURGE is particularly sensitive to emission line galaxies at because H+[Oiii] emission falls in the deep imaging. To identify galaxies with the strongest emission lines, we use the composite SEDs generated by Forrest et al. (2017). From testing multiple fitting methods, Forrest et al. (2018, §4.5) show that restframe equivalent widths down to Å can be recovered from the composite SEDs; in the case of H+[Oiii], the detection threshold applies to the blended EWrest.
To summarize, we iteratively select the primary galaxies with the largest number of analog galaxies based on the similarity of 22 rest-frame UVOIR colors (, from Kriek et al., 2011; Forrest et al., 2016) to collectively form separate composite groups. Observed photometry from analog galaxies in each composite group are then de-redshifted, normalized to a common flux scale, and combined to build a composite SED, essentially a low resolution () spectrum.
We focus on the two composite SEDs from Forrest et al. (2017, 2018) with the steepest UV slope and strongest blended H+[Oiii] emission. We adopt an admittedly arbitrary definition and refer to these emission line galaxies as Strong (SELG). In our analysis, we refer to the following types of galaxies:
-
•
Star-Forming Galaxy (SFG): composite SEDs with rest-frame H+[Oiii] equivalent widths of Å
-
•
Strong Emission Line Galaxy (SELG): the combined sample of 278 galaxies in S1ELG and S2ELG.
-
•
S1ELG: the 60 galaxies grouped in the the composite SED with rest-frame H+[Oiii] equivalent width of Å
-
•
S2ELG: the 218 galaxies grouped in the the composite SED with rest-frameH+[Oiii] equivalent width of Å
Across the three ZFOURGE fields, we identify a total of 278 candidate Strong ELGs from the ZFOURGE composite SEDs, the majority of which are in CDF-S (Forrest et al., 2017). Except where noted, we use the combined sample of SELGs=(S1ELG+S2ELG) . We exclude Active Galactic Nuclei (AGN) identified by Cowley et al. (2016) using multi-wavelength diagnostics; we discuss this in more detail in §3.7.
2.2 Keck/MOSFIRE Spectroscopy
2.2.1 Observations
We used MOSFIRE (McLean et al., 2012) on Keck I (project code Z245, PI Kewley) on 12 and 13 February 2017. We observed 5 masks in COSMOS and 1 mask in CDFS. To measure H+[Oiii] at , we used the K-band with wavelength range of m and spectral dispersion of 2.17 Å/pixel. We used an AB dither pattern with arcsecond nod and integrated each mask for a total on-sky time of 96 minutes (110 minutes clock time); seeing ranged from arcsec.
In the six MOSFIRE masks, we targeted a total of 105 galaxies at where the highest priority targets were the 38 Strong ELGs candidates at . The remaining targets (67) primarily were star-forming galaxies at . Each mask included a flux monitor star to anchor the spectro-photometric calibrations. We follow the same reduction pipeline as in our ZFIRE survey (Tran et al., 2015; Nanayakkara et al., 2016; Tran et al., 2017) and estimate a line-flux limit in the MOSFIRE K-band of erg s-1 cm-2. Note that the angular sizes of the galaxies are comparable to or smaller than the slit-width of (Fig. 7), there should be no significant systematic error such as slit-loss due to the spectro-photometric calibration.
2.2.2 Spectroscopic Redshifts
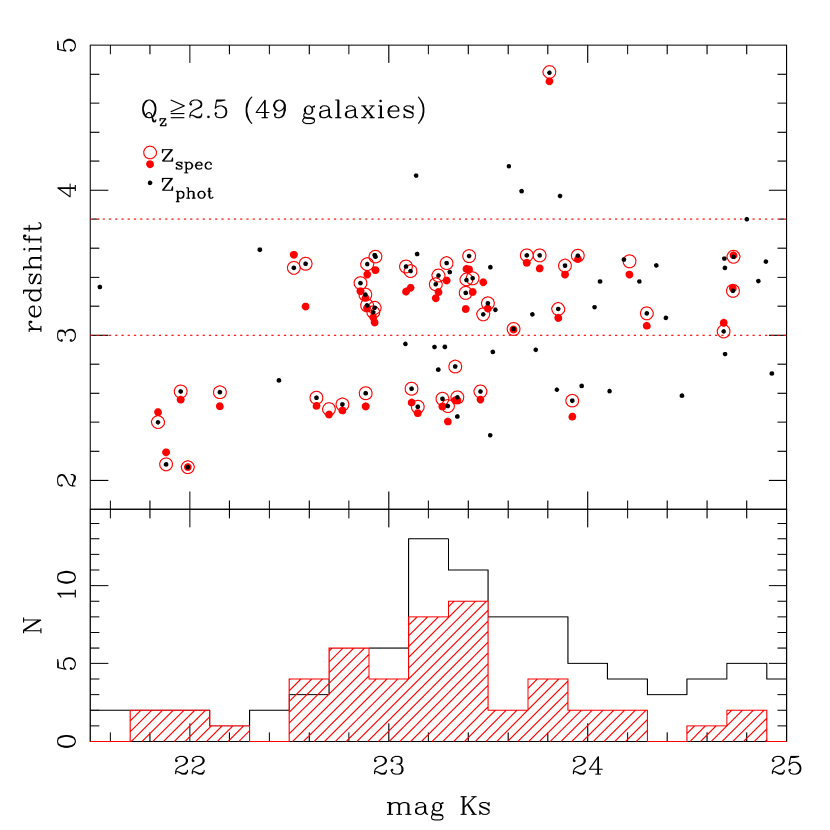
Of the 105 galaxies targeted with MOSFIRE, we measure spectroscopic redshifts for 49 (; Fig. 1). Considering only the 89 targeted galaxies with photometric redshifts in the same range, i.e. galaxies where [Oiii] and H fall in the K-band, our success rate is %. The 49 galaxies with spectroscopic redshifts have magnitudes brighter than and quality flag of . In our analysis, means that the spectral line emission matches the ZFOURGE photometric redshift or there are two spectral lines with the same redshift (for all definitions of , see Nanayakkara et al., 2016).
On average, is higher than (Fig. 1) and the corresponding uncertainty is =. The largest outliers have and . A two-sample Kolmogrov-Smirnov test shows the probability that the spectroscopically confirmed sample and the targeted sample are drawn from the same parent distribution to be 3.6%, the two distributions are different at the level. The spectroscopically confirmed sample also is magnitudes brighter with a K-S probability of being drawn from the same parent distribution as the targeted sample of 15%.
Of the 13 targeted S1ELG that were grouped in the composite SED with the highest H+[Oiii] emission (EWrestÅ), two were lost due to mechanical problems with configuring the mask and two had no measured redshift. The median redshift of the 9 confirmed ELGs is =3.189 compared to their median =3.207. The corresponding uncertainty of =0.42% is even lower than that of our ZFIRE survey which targeted a broader selection of galaxies at (Tran et al., 2015; Nanayakkara et al., 2016). Note also that the largest outliers are which is a factor of three smaller compared to the SFGs (). In our analysis, we focus on the 8 ELGs at and exclude the ELG at (ID 4791).
Of the 25 targeted S2ELG that were grouped in the composite SED with the second highest H+[Oiii] emission (EWrestÅ), 13 were spectroscopically confirmed with a median redshift of =3.327 compared to their median =3.41. The corresponding uncertainty of =1.9% for the S2ELG is larger than that of the S1ELG and more typical of the ZFOURGE survey as a whole (Straatman et al., 2016; Nanayakkara et al., 2016). All 13 have redshifts of .
Of the remaining 67 galaxies targeted with MOSFIRE, 28 have spectroscopic redshifts (Fig. 1) with a median redshift of =2.551 compared to their median =2.612. In our analysis, we focus on the 10 SFGs at , i.e. we exclude the 17 galaxies at and the one galaxy at . We note that due to decreasing throughput of the near-IR arrays at m, the redshift cut-off is effectively except for objects with the strongest [Oiii]5007Å emission.
2.2.3 Measuring [Oiii]5007Å Spectral Line Emission
Following Alcorn et al. (2016, 2018), we first extract a 1D spectrum from an aperture defined by the Gaussian width of the [Oiii]5007Å emission line along the spatial direction (Fig. 2). To determine the [OIII]5007Å line flux, we integrate the best-fit Gaussian centered on the line emission along the wavelength direction using the range; all line-fits are visually inspected for quality control. We subtract in quadrature the instrumental broadening from the measured line-width and then convert to an integrated velocity dispersion () using the galaxy’s measured redshift. Errors in are estimated by adding sky noise to the observed spectrum and refitting 1000 times.
2.2.4 Determining [Oiii]5007Å Equivalent Width
To measure [Oiii]5007Å equivalent widths, we require both line and continuum flux. However, most of the ELGs are too faint to directly measure their continua from the MOSFIRE spectroscopy. We use the method described in Nanayakkara et al. (2017) that combines our spectro-photometrically calibrated [Oiii]5007Å line fluxes with the deep continuum photometry from ZFOURGE (Straatman et al., 2016). Because the ZFOURGE photometry provides a better measurement of the faint continuum relative to the spectroscopy, the primary source of uncertainty is thus due to systematic error of the spectro-photometric calibration, and this uncertainty is of order % for continuum-detected galaxies (Nanayakkara et al., 2016). Note that given the galaxy sizes are comparable to or smaller than the slit-width of (Fig. 7), the systematic error due to the spectro-photometric calibration is not significant.
To determine the continuum for each ELG, we use the FAST fits (Kriek et al., 2009) from Forrest et al. (2017, 2018) that include a template library with strong emission lines. As we show in both Cohn et al. (2018) and Forrest et al. (2018), the stellar masses for low-mass galaxies () can be overestimated by dex if strong emission lines are not included in the SED modeling. The emission lines are from Salmon et al. (2015) who couple the photoionization code Cloudy (Ferland et al., 2013) with BC03 simple stellar populations (Bruzual & Charlot, 2003) as the ionizing source to generate nebular emission models.
Because both star formation rate and stellar mass depend on the adopted stellar metallicity, SED fits are generated for solar () and subsolar () values. The strong emission lines indicate the ELGs have gas metallicities lower than solar, thus we use the subsolar stellar metallicity fits (; see also Cohn et al., 2018). However, we stress that the value adopted for the metallicity does not change the measured value for the continuum nor the measured EWrest, only how we interpret the measurements.
We calculate the observed frame continuum on the blue and red side of the H+[Oiii] lines by using tophat filters (width of 150Å) centered at 4675Å and 5200Å on the best-fit FAST SED. We then divide the observed [Oiii]5007Å line flux by the average observed continuum and the galaxy redshift.
| (1) |
For a line flux of erg s-1 cm-2 and continuum flux of erg s-1 cm-2 Å-1 (approximately magnitude of 24.0), the observed equivalent width is 60Å; for a galaxy at =3.0, the corresponding rest-frame equivalent width is EWrestÅ. For comparison, the lowest values we measure for the spectral rest-frame equivalent widths using MOSFIRE are Å (Table 2). We note that Forrest et al. (2018, §4.5) estimated rest-frame EWrest down to Å can be measured from the composite SEDs.
For reference, the 3D-HST survey quotes a emission line flux limit for point sources of erg s-1 cm-2 (Momcheva et al., 2016). Assuming the same continuum flux level, their limit corresponds to an observed equivalent width of 300Å, i.e. approximately five times higher than MOSEL.
3 Results
In our analysis, we focus on the 31 galaxies that are spectroscopically confirmed to be at (Fig. 1). We measure the [Oiii]5007Å emission for these galaxies with our K-band spectroscopy (Fig. 2). We combine our spectral measurements with deep photometry from ZFOURGE to measure continuum properties and use galaxy sizes from van der Wel et al. (2012). Although the LUV+IR-based SF rates from Tomczak et al. (2016) based on solar metallicity models are robust to significant flux from line emission, the stellar masses can be overestimated by as much as a factor of (e.g. Forrest et al., 2018; Cohn et al., 2018). For these galaxies, we use stellar masses determined using updated FAST fits that include an SED template with strong emission lines and 1/5 solar metallicity (; Forrest et al., 2018).
3.1 Strong [Oiii]5007Å Emission
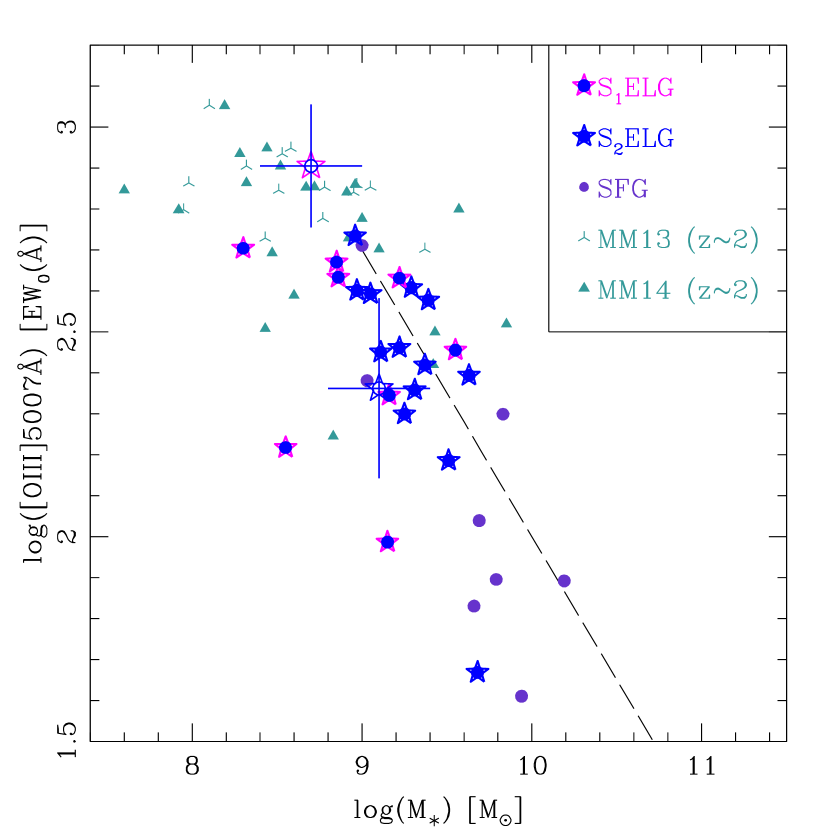
With our MOSFIRE spectroscopy and deep multi-band imaging, we estimate rest-frame [Oiii]5007Å equivalent widths using the hybrid method described in §2.2.4. Our spectroscopically confirmed Strong ELGs span similar ranges with [Oiii]5007Å EWrestÅ (Fig. 3). These ranges are consistent with the large blended H+[Oiii] equivalent widths (EWrestÅ) measured from their composite SEDs (Forrest et al., 2017, 2018).
The Strong ELGs at show a trend of decreasing [Oiii]5007Å equivalent width with increasing stellar mass that is also observed in SELGs at (Fig. 3; Maseda et al., 2014). The significant overlap between S1ELG and S2ELG indicates that the two are not distinctly different populations. Note that the SELGs at include systems with while our SELGs have due to sensitivity limits.
The more typical star-forming galaxies (H+[Oiii]Å) at have larger stellar masses () and lower rest-frame [Oiii]5007Å equivalent widths (EWrestÅ; Fig. 3). This reflects the larger contribution of stellar continuum light, i.e. for two galaxies with the same [Oiii]5007Å line-flux, the galaxy with the brighter continuum will have a lower equivalent width. Our results confirm that selecting Strong ELGs from the ZFOURGE photometry is effective at identifying galaxies with the largest [Oiii]5007Å equivalent widths.
For the S1ELG, the [Oiii]5007Å EWrest values determined using the line fluxes obtained with MOSFIRE (see §2.2.4) tend to be lower than the EWrest value estimated from the composite SED (Fig. 3). The offset is likely driven by how the continuum and emission lines are combined to generate the template used to fit the composite SEDs. For example, underestimating the continuum will increase the inferred EW. We refer the reader to Forrest et al. (2017) who test three fitting methods on the composite SEDs of the strongest ELGs.
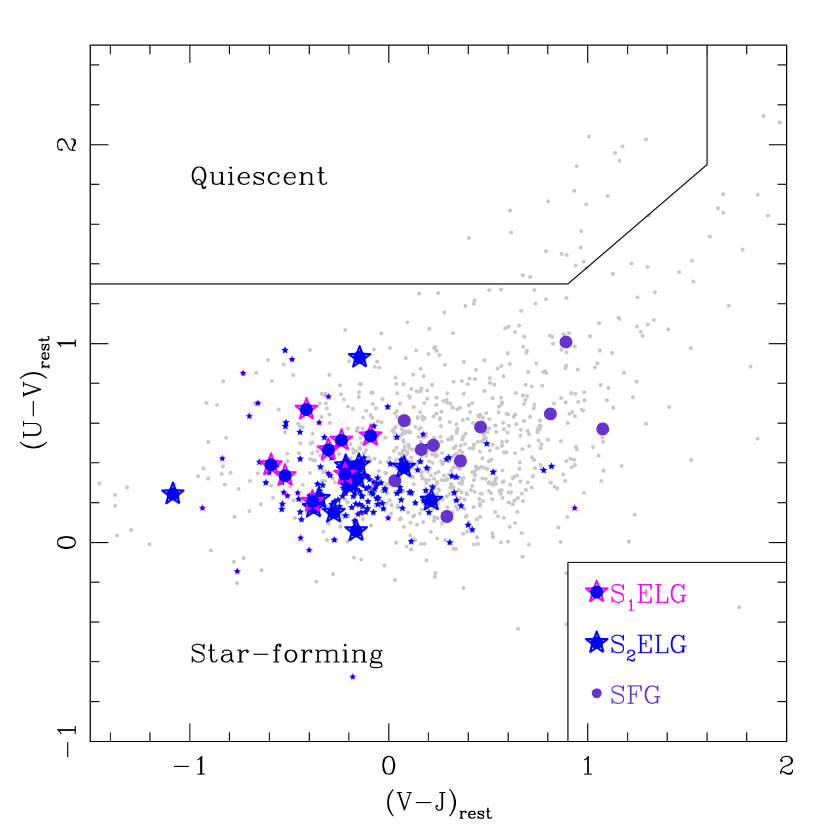
3.2 Rest-frame Colors
With the ZFOURGE rest-frame wavelength coverage of m for each galaxy, we measure continuum properties including rest-frame colors from the individual SEDs (Tomczak et al., 2014; Straatman et al., 2016). ZFOURGE galaxies at span the range in colors (Fig. 4) to include dusty and quiescent systems, but most lie in the star-forming region of the diagram (see also Straatman et al., 2016). The “typical” star-forming galaxies in our spectroscopic sample have that are values consistent with low amounts of reddening (AV; Forrest et al., 2016). None of the spectroscopically confirmed galaxies are dusty as defined using the criterion from Spitler et al. (2014) of .
In contrast, the Strong ELGs are offset towards bluer colors (Fig. 4). Their strong H+[Oiii] emission significantly boosts their -band fluxes to produce rest-frame values of ; this is particularly striking for the S1ELG where virtually all have . Such blue colors and non-detections in the far-IR indicate that these ELGs are essentially dust-free systems. The relative distributions of the S1ELG and S2ELG in the diagram suggests a continuum of phases where age and dust content increases from the Strong ELGs to the more typical star-forming galaxies, e.g. Lyman-Break Galaxies.
3.3 Star-Formation Rate vs. Stellar Mass
The Strong ELGs tend to be lower mass systems [] compared to more typical star-forming galaxies (Fig. 3). At , the (M⋆) for the stellar luminosity function from ZFOURGE is (Tomczak et al., 2014). In comparison, the SELGs have stellar masses of only M M⋆.
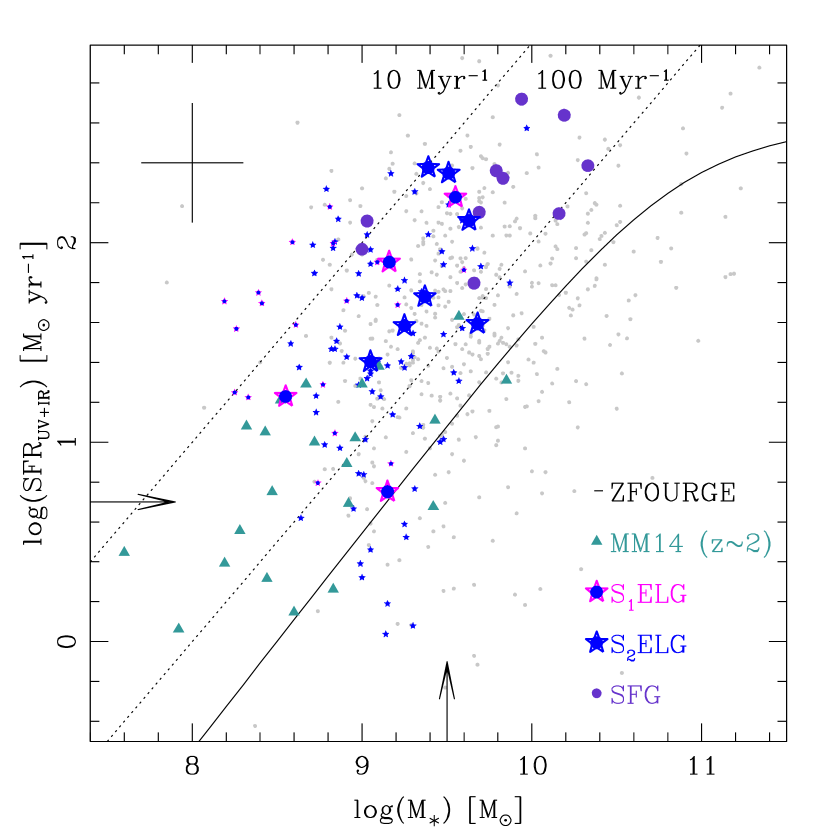
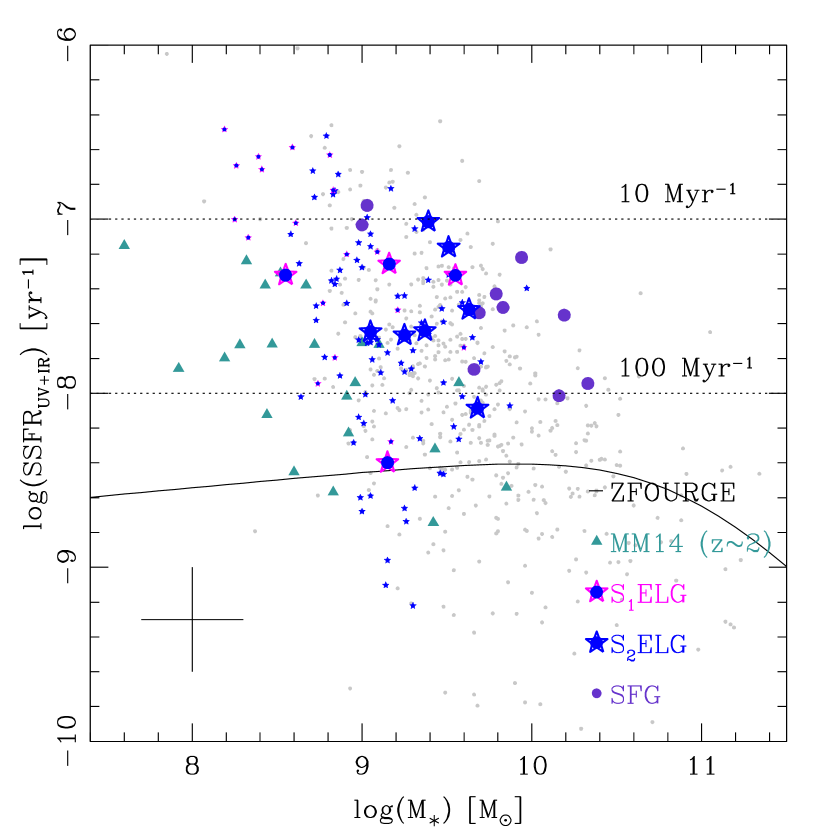
Figure 5 shows the star formation rate to stellar mass (SFR-) for the galaxies in our sample with measured (UV+IR) star formation rates from ZFOURGE (Tomczak et al., 2016). Although all of our galaxies have measured UV fluxes, many have negative IR fluxes due to the SED fitting method (see §2.5 of Tomczak et al., 2016) and thus 13 of the 31 galaxies have negative (unphysical) total SFRs and are excluded from the SFR- analysis. Also, note that our line-flux limit in the MOSFIRE K-band is erg s-1 cm-2 (see also Tran et al., 2017).
Of the 18 ELGs with positive (UV+IR) SFRs, all lie above the relation between star formation and stellar mass commonly referred to as the Star-Forming Main Sequence (SFMS; Figs. 5 & 6); we confirm this is true even if we include UV only SFRs. The ELGs tend to lie dex above the SFMS at as measured by Tomczak et al. (2016) from stacked SFRs based on (UV+IR) fluxes from ZFOURGE. The overall distribution of the spectroscopically confirmed Strong ELGs mirrors that of the photometrically selected sample at this epoch, most of the SELGs lie above the SFMS.
With stellar mass-doubling time-scales of only Myr, virtually all of the Strong ELGs are starbursts (Figs. 5 & 6). Our results are consistent with Amorín et al. (2017) and Maseda et al. (2014) who find that Strong ELGs at have elevated SFRs for their given stellar mass. At stellar masses of where the two redshift samples overlap, our SELGs at have higher SFRs compared to the SELGs. However, we note that for low mass galaxies (), the observed scatter in -SFR increases with increasing redshift (Tomczak et al., 2016).
A possible concern is that our (UV+IR) based SFRs are near or below the nominal IR detection limit at (Tomczak et al., 2016). However, the very lack of IR emission is consistent with SELGs having little to no dust. We find additional support for the elevated SFRs and specific SFRs for the SELGs in Cohn et al. (2018): using the SED fitting code Prospector (Conroy et al., 2009; Leja et al., 2017), Cohn et al. (2018) show that the Strong ELGs with H+[Oiii] EWrestÅ (S1ELG) are dominated by the current starburst and have rising star formation rates.
3.4 Galaxy Size vs. Stellar Mass
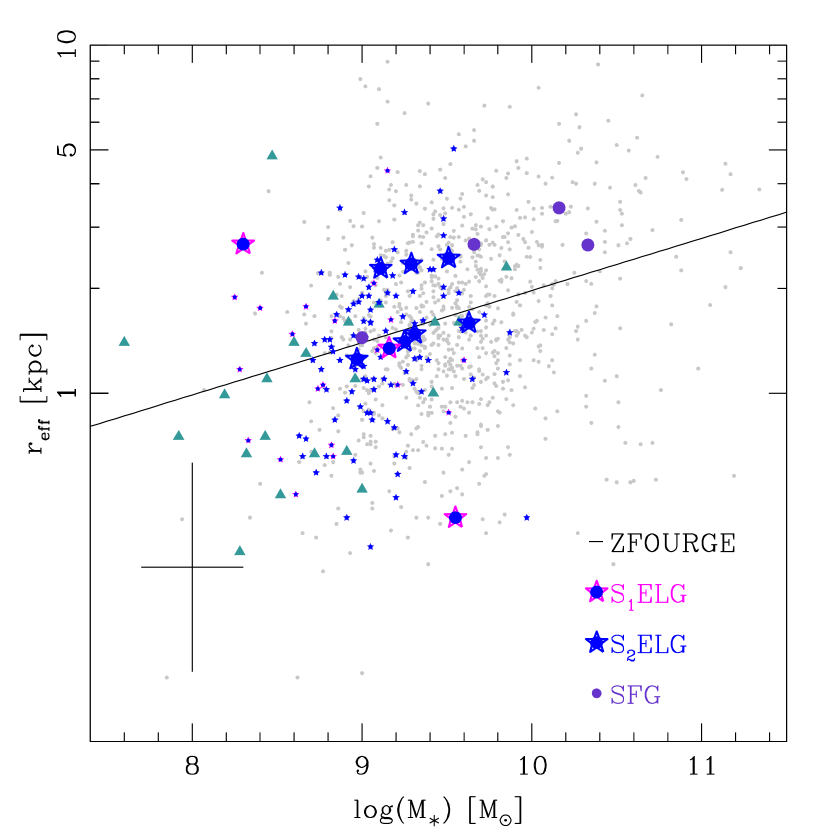
Our Emission Line Galaxies lie on the galaxy size-mass (reff-) relation measured by Allen et al. (2017) using ZFOURGE galaxies at (Fig. 7). Here we use the effective radii (galaxy size) measured by van der Wel et al. (2012) with the WFC3/F160W imaging and consider only galaxies with goodness of fit flag of 0. These criteria further reduce our ELG sample to 13 galaxies. We note that relaxing the goodness of fit flag to include all ELGs with measured reff (28) increases the scatter in the galaxy size-mass relation but does not change the overall result.
Although they are virtually all starbursts (Figs. 5 & 6), our ELGs at follow the same reff- relation as the general population. The Strong ELGs at (Maseda et al., 2014) are also consistent with the same size-mass relation except for the lowest mass systems () which tend to lie below this relation, i.e. they are more compact at a given stellar mass. Combining both redshift samples suggests that the Strong ELGs are an early phase in the continuum of stellar growth.
3.5 Inferred Gas Fractions
With UV+IR luminosities from ZFOURGE and reff from the HST/F160W imaging (van der Wel et al., 2012), we use the Schmidt-Kennicutt Relation (SKR; Schmidt, 1959; Kennicutt, 1998, Eq. 7) to estimate the gas surface density for individual galaxies:
| (2) |
Assuming that half of the gas mass is within reff, we use to estimate the total gas mass:
| (3) |
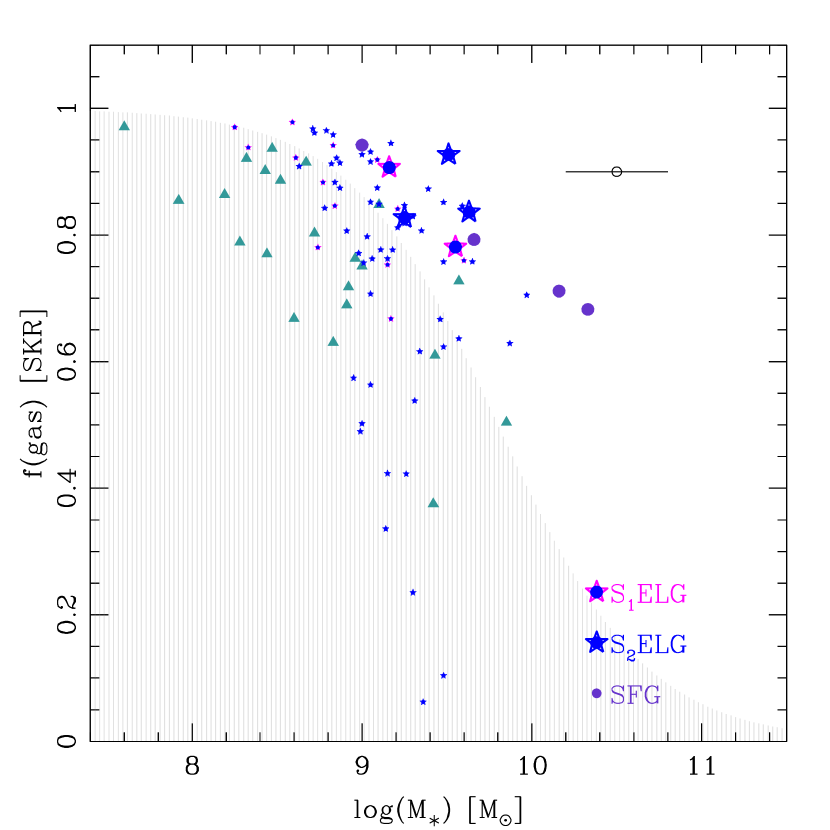
where reff is measured in kpc, in , and LUV+IR in ; see also Papovich et al. (2015). We use reff defined by the stellar light; note that studies using CO (Tacconi et al., 2013) and H (Förster Schreiber et al., 2011) find reff from gas and stars are consistent. Assuming an observational detection limit of LUV+IR and typical galaxy size of reff kpc (Tran et al., 2017), the corresponding gas mass limit is (/). Gas fractions are defined to be /(+).
All of our spectroscopically confirmed ELGS have inferred gas fractions of % (Fig. 8) which is not surprising given the ELGs’ high specific star formation rates and our detection limits. The high gas masses are consistent with high accretion rates that may be driving the star formation (Kacprzak et al., 2016). Our inferred gas fractions combined with measurements of Strong ELGs at (Maseda et al., 2014) suggests that % for ELGs with stellar masses of . However, direct measurements of gas masses for the ELGs at with stellar masses of will be difficult given current observational limitations.
3.6 Kinematics
The integrated velocity dispersions () based on [Oiii]5007Å line-widths is km s-1 for most of the ELGs with only one ELG having km s-1 (see Tables 1 & 2). Combining and effective radii from vdW12, we follow Alcorn et al. (2016) and estimate virial masses:
| (4) |
where for consistency with Maseda et al. (2013, 2014), we adopt the virial factor which is typically used for disk galaxies.
The dynamical masses for our ELGs at are dex larger than their stellar masses (Fig. 9); the handful of galaxies with is consistent with scatter due to errors in the measurements. The offset between virial and stellar mass is consistent with measurements of Strong ELGs at (Maseda et al., 2013, 2014) and continues the same trend to higher masses. Within our limited sample at , there is no obvious difference in the - relation for Strong ELGs compared to higher mass () star-forming galaxies.
When comparing the total baryonic mass (sum of the stellar and estimated gas mass) to dynamical mass, we find that the MOSEL galaxies are closer to parity (Fig. 9, left). However, given the scatter and low number statistics, we hesitate to draw any stronger conclusions regarding the ratio of dark to baryonic mass for the MOSEL galaxies.
3.7 Star Formation or Active Galactic Nuclei?
Our analysis assumes that the strong [Oiii]5007Å emission is driven by star formation and not Active Galactic Nuclei (AGN). We have used the ZFOURGE catalog by Cowley et al. (2016) to remove AGN but recognize that at , the multi-wavelength AGN diagnostics may not be reliable especially given the uneven coverage across these fields. However, the [Oiii]5007Å line-widths are consistent with star formation: most of the ELGs have km s-1 with only one ELG having km s-1 (see Tables 1 & 2). Also, our recent results using Prospector to construct the star formation histories of the strong ELGs confirms that they are dominated by starbursts spanning the most recent Myr (Cohn et al., 2018). Lastly, we note that AGN contamination is rare in low-mass galaxies (e.g., Ho et al., 1997; Trump et al., 2015).
Unlike the ZFOURGE composite SEDs where H and [Oiii]5007Å are blended (Forrest et al., 2017), the MOSFIRE spectroscopy easily resolves these spectral features for individual ELGs. Thus we also can identify potential AGN by combining the ratio of [Oiii]5007Å to H with stellar mass (Juneau et al., 2011), although we note this method is contested at (Trump et al., 2013). The median [Oiii]5007/H value for our sample of ELGs is which is consistent with values reported by (Holden et al., 2016) for Lyman-Break Galaxies at . Following a similar line of analysis, Maseda et al. (2014) also excluded AGN from their sample of strong ELGs at .
H is weaker than [Oiii]5007Å and given our line-flux limit of erg s-1 cm-2 (), we can only place upper limits on the ratio of [Oiii]5007/H for many of the ELGs. A more careful treatment of the H line-fluxes, e.g. by stacking the spectra, can be used to constrain ISM conditions. Further analysis that includes H, e.g. by combining [Oiii]5007/H with stellar masses and star formation histories, will be presented in a future MOSEL paper.
4 Discussion
With deep multi-band photometry from ZFOURGE, we identified Emission Line Galaxies at that have blended rest-frame H+[Oiii] equivalent widths of Å (Forrest et al., 2017, 2018). We consider the combined sample of Strong ELGs grouped in the two composite SEDs with the largest H+[Oiii] equivalent widths (EWrestÅ; see §2.1.2). The rarity of ELGs with EWrest([Oiii]5007)Å in the local Universe ( “green peas” per square degree; Cardamone et al., 2009) raises the question of whether this Strong emission line phase is the exception or the norm at high redshifts. In our MOSEL survey, we build on recent studies to further explore how galaxies at with strong [Oiii]5007Å emission fit into our current understanding of how star-forming galaxies grow by combining Keck/MOSFIRE K-band spectroscopy with our existing multi-band photometry from ZFOURGE.
4.1 Strong [Oiii]5007Å Emission May Be Common in Early Galaxy Formation
We spectroscopically confirm 31 galaxies at with stellar masses of and rest-frame [Oiii]5007Å equivalent widths up to Å (Figs. 1 & 3). The properties of the spectroscopically confirmed Strong ELGs mirror that of the larger photometrically selected sample (e.g. Figs. 4 & 5). Most of the SELGs have blue colors of while the more typical star-forming galaxies have (Fig. 4). The overlapping ranges in their rest-frame colors suggest that the Strong ELGs transition into more massive star-forming galaxies, e.g. Lyman-Break Galaxies.
In the stellar mass range where we overlap with MOSDEF galaxies at (Reddy et al., 2018), we find a similar relationship between [Oiii]5007Å EWrest and stellar mass (Fig. 3). Reddy et al. (2018) suggest that the increasing [Oiii]5007Å EWrest with decreasing stellar mass can be explained by either rapid enrichment of elements or metallicities of for galaxies with . Both scenarios are consistent with our interpretation that the SELGs are young and have sub-solar metallicities.
In combination with Cohn et al. (2018) who show that SELGs at have low gas-phase metallicites () and higher specific star formation rates relative to SFGs (4.6 Gyr vs 1.1 Gyr), our spectroscopic measurements support a scenario where strong [Oiii]5007Å emission signals the earliest episodes of intense star formation (see also Amorín et al., 2017). As the SELGs grow in stellar mass, the growing amount of continuum light means that even during subsequent episodes of bursty star formation, the [Oiii]5007Å equivalent widths will not be as large as during the first major burst of star formation. With star formation rates of yr-1 (Fig. 5) and mass-doubling times of Myr (Figs. 5 & 6), the intense [Oiii]5007Å emission phase is brief as these same galaxies quickly transition into more typical star-forming galaxies with H+[Oiii] EWrestÅ.
We find further support for a picture where strong [Oiii]5007Å emission signals the earliest stages of stellar growth in galaxies by comparing relations between stellar mass (), galaxy size (reff), and virial mass (). Our SELGs follow the same general -reff relation as that of star-forming galaxies at (Fig. 7), although we note the large scatter for all galaxies at this epoch. The SELGs also continue the same trend between - as measured for SELGs at (Fig. 9). The SELGs have virial masses that are larger by dex relative to their stellar masses which is consistent with their inferred gas mass fractions of % (Fig. 8).
In a recent paper (Cohn et al., 2018), we derived galaxy properties from the ZFOURGE photometry using the SED-fitting code Prospector (Leja et al., 2017) and the Flexible Stellar Population Synthesis package (FSPS; Conroy et al., 2009). The Prospector code finds the best fit model and estimates uncertainties by sampling the posterior probability distributions of all the free parameters. By calculating nonparametric star formation histories, Prospector can distinguish between rising, falling, and bursty star formation histories.
Using Prospector, Cohn et al. (2018) show that ELGs with extreme emission (S1ELG; H+[Oiii] EWrestÅ) are “first burst” systems and likely to have rising star formation rates. These same galaxies have low gas-phase metallicities of and higher specific star formation rates compared to star-forming galaxies: Gyr-1 vs. Gyr-1. Cohn et al. (2018) inferred that many, if not most, star-forming galaxies at have Extreme H+[Oiii] emission-line phases early in their formation histories. As these “first burst” systems continue to form stars and chemically enrich to evolve into more typical SFGs, they move diagonally from the upper left to the bottom right in Figs. 6 & 8.
4.2 A Potential Source of Ionizing UV Photons
A growing number of studies indicate that galaxies rather than AGN generated the UV photons needed to ionize the universe, but there are not enough massive galaxies at to generate the required UV photons (Robertson et al., 2013, 2015). With several low-mass () systems now identified at that have strong EWrest([Oiii]5007)Å and escape fractions of % (Nakajima et al., 2016; de Barros et al., 2016), the most viable source of UV photons are these low-mass, star-bursting galaxies. However, the stellar mass function at must be steeper than observed at lower redshifts for there to be enough of these dwarf galaxies to generate the required UV photons.
Another potential source of UV photons are the galaxies in our study with EWrest([Oiii]5007)Å, e.g galaxies in a strong emission line phase. The inferred gas fractions of % (Fig. 8) and high specific star formation rates (Fig. 6) imply that the ELGs with the strongest [Oiii]5007Å easily increase their stellar masses by factors in less than Myr, i.e. these Strong ELGs signal the earliest stages of stellar growth in galaxies (see also Cohn et al., 2018).
If the [Oiii]5007Å emitters also have large [Oiii]5007/[Oii]3727 ratios (O32), studies indicate they may leak more Lyman-Continuum photons due to their harder ionizing spectrum (Izotov et al., 2016; Nakajima & Ouchi, 2014; Nakajima et al., 2016). Tang et al. (2019) find that in the most intense line emitters at , the ionizing photon efficiency scales with [Oiii]5007Å emission. However, recent results by Bassett et al. (2019) of galaxies at suggest that the correlation between large [Oiii]5007/[Oii]3727 ratios and more Ly-C photons is weak at best, and Naidu et al. (2018) constrain the average escape fractions for SELGs to be %.
Only with spectroscopy can we measure fluxes of oxygen lines for individual galaxies to measure their ratios and determine what drives the strong [Oiii]5007 emission, e.g. shocks or massive binary stars (Strom et al., 2017). By obtaining at the ratio of [Oiii]5007 to well-studied emission lines such as [Oii]3727, H, and Ly (e.g. Tang et al., 2019; Bassett et al., 2019), we can better track how the ionizing photon efficiency evolves from the first galaxies to . We plan to measure [Oii]3727Å emission for our ELGs to characterize their ionization conditions and constrain their production of Lyman-Continuum photons.
5 Conclusions
Our Multi-Object Spectroscopic Emission Line (MOSEL) survey focuses on galaxies with strong [Oiii]5007Å emission identified using deep broad-band photometry from the ZFOURGE survey (Forrest et al., 2017, 2018). We use Keck/MOSFIRE K-band spectroscopy and measure redshifts of 49 galaxies at . Our spectroscopic success rate is % and uncertainty is = (§2.2.2, Fig. 1; see also Straatman et al., 2016; Nanayakkara et al., 2016).
Of the 49 spectroscopically confirmed galaxies at , we measure [Oiii]5007Å line fluxes for 31 galaxies at (Fig. 2). By dividing the line-flux as measured with MOSFIRE by the continuum flux from ZFOURGE, we estimate rest-frame [Oiii]5007Å equivalent widths of Å where EWrest increases with decreasing stellar mass (Fig. 3). Our analysis focuses on the Strong Emission Line Galaxies (SELGs) grouped in the two composite SEDs with the strongest H+[Oiii] emission (EWrestÅ) from Forrest et al. (2018).
We explore the properties of SELGs at to connect them to our current picture of star-forming galaxies. The physical properties of the spectroscopically confirmed [Oiii]5007Å Strong Emission Line Galaxies (SELGs) mirror that of the larger photometrically selected sample. For example, the SELGs tend to have bluer colors of compared to more typical star-forming galaxies with (Fig. 4).
The Strong H+[Oiii] emitting galaxies in our study have stellar masses of (Fig. 5). The same galaxies lie dex above the star-forming main sequence at and have high specific star-formation rates with mass-doubling timescales of Myr (Fig. 6). The inferred gas fractions of % (Fig. 8) can easily fuel a burst that increases stellar mass by . In terms of stellar and virial mass, (UV+IR) star formation rate, and galaxy size, our H+[Oiii] emitting galaxies bridge relations measured for Strong ELGs at (; van der Wel et al., 2011; Maseda et al., 2014) to star-forming galaxies at (see Figs. 5, 6, & 7).
Taken as a whole, our analysis suggests that strong [Oiii]5007Å emission (EWrest) signals an early episode of intense star formation in low-mass (M M⋆) galaxies at . The ELGs with the strongest [Oiii]5007Å are a rapidly evolving population of galaxies both in number density and stellar growth (Forrest et al., 2017; Cohn et al., 2018). The [Oiii]5007Å ELGs are likely to evolve into more massive and older star-forming galaxies with stable disks and bulges, e.g. Lyman-Break Galaxies.
In a recent paper (Cohn et al., 2018), we estimated that many, if not most, star-forming galaxies at are strong [Oiii]5007Å emitters early in their formation history. If strong [Oiii]5007Å emission is a common phase in early galaxy formation, this brief episode may generate a significant number of ionizing UV photons. In a future paper, we will explore additional line diagnostics, e.g. the ratio of [Oiii]5007Å to H, to characterize ionization conditions and constrain the production of Lyman-Continuum photons in galaxies with the strongest [Oiii]5007Å emission.
| Field | ZFOURGEbbGalaxy identification numbers, observed ZFOURGE K-band magnitudes, photometric redshifts, and rest-frame are from ZFOURGE (Straatman et al., 2016). Uncertainties on the magnitudes and colors are . | RA bbGalaxy identification numbers, observed ZFOURGE K-band magnitudes, photometric redshifts, and rest-frame are from ZFOURGE (Straatman et al., 2016). Uncertainties on the magnitudes and colors are . | Dec bbGalaxy identification numbers, observed ZFOURGE K-band magnitudes, photometric redshifts, and rest-frame are from ZFOURGE (Straatman et al., 2016). Uncertainties on the magnitudes and colors are . | bbGalaxy identification numbers, observed ZFOURGE K-band magnitudes, photometric redshifts, and rest-frame are from ZFOURGE (Straatman et al., 2016). Uncertainties on the magnitudes and colors are . | bbGalaxy identification numbers, observed ZFOURGE K-band magnitudes, photometric redshifts, and rest-frame are from ZFOURGE (Straatman et al., 2016). Uncertainties on the magnitudes and colors are . | bbGalaxy identification numbers, observed ZFOURGE K-band magnitudes, photometric redshifts, and rest-frame are from ZFOURGE (Straatman et al., 2016). Uncertainties on the magnitudes and colors are . | bbGalaxy identification numbers, observed ZFOURGE K-band magnitudes, photometric redshifts, and rest-frame are from ZFOURGE (Straatman et al., 2016). Uncertainties on the magnitudes and colors are . | ccWe use the stellar masses from Forrest et al. (2018) and the combined UV+IR star formation rates from Tomczak et al. (2016). We recommend the reader consider a typical uncertainty of dex for both parameters. | (SFR) ccWe use the stellar masses from Forrest et al. (2018) and the combined UV+IR star formation rates from Tomczak et al. (2016). We recommend the reader consider a typical uncertainty of dex for both parameters. | reffddEffective radii are from van der Wel et al. (2012) and measured using the WFC3/F160W imaging. Here we take the sizes reported in arcsec and convert to kpc using the angular diameter distance. | ||
|---|---|---|---|---|---|---|---|---|---|---|---|---|
| ID | J2000 | J2000 | mag | mag | mag | yr-1 | kpc | |||||
| COSMOS | 1877 | 150.170425 | 2.199359 | 3.1230 | 3.16 | 22.92 | 0.58 | 0.46 | 10.2 | 2.1 | 3.4 | |
| COSMOS | 4214 | 150.177109 | 2.221284 | 3.4578 | 3.38 | 23.39 | 1.01 | 0.89 | 10.3 | 2.4 | 2.7 | |
| COSMOS | 7239 | 150.202240 | 2.254340 | 3.1198 | 3.18 | 23.85 | 0.24 | -1.08 | 9.0 | 0.7 | ||
| COSMOS | 9884 | 150.072495 | 2.282637 | 3.2982 | 3.39 | 23.42 | 0.93 | -0.15 | 9.1 | 1.4 | 1.4 | |
| COSMOS | 11063 | 150.146133 | 2.297038 | 3.0393 | 3.04 | 23.63 | 0.34 | -0.22 | 8.9 | 1.8 | ||
| COSMOS | 11284 | 150.136337 | 2.298915 | 3.3016 | 3.47 | 23.09 | 0.32 | -0.16 | 9.4 | 1.7 | 2.4 | |
| COSMOS | 11544 | 150.147446 | 2.301592 | 3.3038 | 3.36 | 22.86 | 0.29 | -0.20 | 9.5 | 2.3 | 2.4 | |
| COSMOS | 12000 | 150.070665 | 2.305136 | 3.2578 | 3.28 | 22.88 | 0.65 | 0.81 | 10.2 | 2.6 | ||
| COSMOS | 12105 | 150.138840 | 2.306907 | 3.2976 | 3.41 | 23.25 | 0.54 | -0.09 | 9.2 | 1.9 | 1.3 | |
| COSMOS | 12273 | 150.147030 | 2.309289 | 3.1809 | 3.29 | 23.39 | 0.31 | 0.03 | 9.8 | 2.4 | ||
| COSMOS | 12776 | 150.121275 | 2.315327 | 3.4993 | 3.55 | 23.69 | 0.57 | 1.08 | 9.8 | 2.3 | ||
| COSMOS | 12922 | 150.069214 | 2.315987 | 3.2556 | 3.35 | 23.24 | 0.47 | 0.16 | 9.7 | 1.8 | 2.7 | |
| COSMOS | 14984 | 150.060333 | 2.338560 | 3.3777 | 3.50 | 23.29 | 0.18 | -0.38 | 9.3 | 1.5 | ||
| COSMOS | 15625 | 150.139206 | 2.345322 | 3.1841 | 3.22 | 23.50 | 0.36 | -0.20 | 9.2 | 1.6 | 1.4 | |
| COSMOS | 15636 | 150.065445 | 2.345667 | 3.4188 | 3.51 | 24.21 | 0.13 | 0.29 | 9.0 | 2.0 | 1.4 | |
| COSMOS | 16067 | 150.200134 | 2.349396 | 3.1885 | 3.21 | 22.89 | 0.47 | -0.30 | 9.2 | 1.4 | ||
| COSMOS | 16325 | 150.203055 | 2.352349 | 3.4538 | 3.55 | 23.40 | 0.49 | 0.22 | 9.7 | 2.2 | ||
| COSMOS | 16513 | 150.066735 | 2.353337 | 3.4188 | 3.49 | 22.89 | 0.22 | -0.35 | 9.2 | |||
| COSMOS | 16518 | 150.211500 | 2.354372 | 3.3653 | 3.14 | 23.47 | 0.41 | 0.36 | 9.9 | 2.7 | ||
| COSMOS | 16984 | 150.083664 | 2.358806 | 3.3273 | 3.44 | 23.11 | 0.38 | 0.08 | 9.3 | 2.3 | ||
| COSMOS | 17008 | 150.168793 | 2.358994 | 3.4608 | 3.55 | 23.76 | 0.21 | 0.21 | 9.0 | 1.3 | ||
| COSMOS | 17423 | 150.115402 | 2.363473 | 3.5259 | 3.55 | 23.95 | 0.51 | -0.24 | 9.6 | 2.2 | 0.4 | |
| COSMOS | 17909 | 150.094330 | 2.370171 | 3.1977 | 3.49 | 22.58 | 0.39 | -0.15 | 9.6 | 2.1 | 1.6 | |
| COSMOS | 18022 | 150.079529 | 2.367794 | 3.4188 | 3.48 | 23.89 | 0.15 | -0.28 | 9.1 | 2.3 | ||
| COSMOS | 20001 | 150.214305 | 2.378608 | 3.4488 | 3.54 | 22.93 | 0.39 | -0.22 | 9.4 | 2.4 | ||
| CDFS | 22136 | 53.152866 | -27.749243 | 3.0883 | 3.19 | 22.93 | 0.34 | -0.52 | 9.2 | 0.8 | 1.6 | |
| CDFS | 15782 | 53.174133 | -27.800318 | 3.0651 | 3.15 | 24.30 | 0.61 | 0.08 | 9.0 | 2.1 | 0.2 | |
| CDFS | 18053 | 53.195736 | -27.782713 | 3.3239 | 3.31 | 24.73 | 0.21 | -0.38 | 8.6 | 1.2 | 0.4 | |
| CDFS | 17189 | 53.198280 | -27.789150 | 3.5506 | 3.54 | 24.73 | 0.39 | -0.59 | 8.3 | 2.7 | ||
| CDFS | 14864 | 53.204610 | -27.806757 | 3.5552 | 3.47 | 22.52 | 0.06 | -0.16 | 9.7 | 1.6 | ||
| CDFS | 15561 | 53.219540 | -27.802586 | 3.0865 | 3.03 | 24.68 | 0.67 | -0.41 | 8.9 | 0.4 |
| Field | ZFOURGEaaGalaxy identification numbers are from ZFOURGE (Straatman et al., 2016). | Å)bb[Oiii]5007Å line-flux, line-width (), and the corresponding integrated velocity dispersion () are measured by fitting a Gaussian to the MOSFIRE spectra (see §2.2.3). | bb[Oiii]5007Å line-flux, line-width (), and the corresponding integrated velocity dispersion () are measured by fitting a Gaussian to the MOSFIRE spectra (see §2.2.3). | bb[Oiii]5007Å line-flux, line-width (), and the corresponding integrated velocity dispersion () are measured by fitting a Gaussian to the MOSFIRE spectra (see §2.2.3). | EWrestcc[Oiii]5007Å rest-frame equivalent widths are determined using the line flux measured with MOSFIRE spectroscopy and continuum flux from the best-fit FAST SED (see §2.2.4). |
|---|---|---|---|---|---|
| ID | erg s-1 cm-2 | Å | km s-1 | Å | |
| COSMOS | 1877 | 2.2 0.6 | 10.5 | 151 | 23.3 |
| COSMOS | 4214 | 1.4 1.1 | 3.0 | 39 | 23.0 |
| COSMOS | 7239 | 10.1 0.3 | 4.3 | 62 | 542 |
| COSMOS | 9884 | 10.5 0.6 | 9.0 | 124 | 392 |
| COSMOS | 11063 | 17.3 0.4 | 4.1 | 60 | 468 |
| COSMOS | 11284 | 16.8 0.9 | 4.9 | 68 | 262 |
| COSMOS | 11544 | 12.3 0.6 | 6.0 | 83 | 153 |
| COSMOS | 12000 | 8.3 0.4 | 8.5 | 119 | 78.0 |
| COSMOS | 12105 | 9.6 0.7 | 4.9 | 67 | 221 |
| COSMOS | 12273 | 8.0 0.5 | 7.7 | 110 | 78.6 |
| COSMOS | 12776 | 11.5 1.6 | 8.7 | 116 | 199 |
| COSMOS | 12922 | 4.9 1.1 | 10.0 | 141 | 67.6 |
| COSMOS | 14984 | 8.1 0.2 | 5.1 | 70 | 228 |
| COSMOS | 15625 | 8.7 0.3 | 4.1 | 58 | 199 |
| COSMOS | 15636 | 4.8 0.5 | 11.4 | 154 | 514 |
| COSMOS | 16067 | 24.8 0.4 | 6.3 | 90 | 428 |
| COSMOS | 16325 | 6.7 1.3 | 7.8 | 105 | 109 |
| COSMOS | 16513 | 13.0 0.6 | 4.3 | 58 | 289 |
| COSMOS | 16518 | 4.3 1.0 | 8.3 | 113 | 40.8 |
| COSMOS | 16984 | 14.7 0.3 | 4.4 | 60 | 405 |
| COSMOS | 17008 | 10.6 0.8 | 6.3 | 84 | 399 |
| COSMOS | 17423 | 12.3 1.1 | 6.9 | 90 | 285 |
| COSMOS | 17909 | 22.5 0.7 | 8.8 | 125 | 248 |
| COSMOS | 18022 | 6.5 0.4 | 6.2 | 83 | 282 |
| COSMOS | 20001 | 22.0 0.5 | 7.3 | 97 | 378 |
| CDFS | 22136 | 2.8 0.7 | 14.3 | 208 | 97.0 |
| CDFS | 15782 | 2.6 0.5 | 6.6 | 96 | 240 |
| CDFS | 18053 | 1.0 0.6 | 3.6 | 49 | 165 |
| CDFS | 17189 | 2.3 0.4 | 8.0 | 105 | 506 |
| CDFS | 14864 | 2.7 0.3 | 10.8 | 142 | 46.6 |
| CDFS | 15561 | 3.2 0.2 | 2.8 | 41 | 430 |
References
- Alcorn et al. (2016) Alcorn, L. Y., Tran, K.-V. H., Kacprzak, G. G., et al. 2016, ApJ, 825, L2
- Alcorn et al. (2018) Alcorn, L. Y., Tran, K.-V., Glazebrook, K., et al. 2018, ApJ, 858, 47
- Allen et al. (2017) Allen, R. J., Kacprzak, G. G., Glazebrook, K., et al. 2017, ApJ, 834, L11
- Amorín et al. (2017) Amorín, R., Fontana, A., Pérez-Montero, E., et al. 2017, Nature Astronomy, 1, 0052
- Amorín et al. (2015) Amorín, R., Pérez-Montero, E., Contini, T., et al. 2015, A&A, 578, A105
- Amorín et al. (2012) Amorín, R., Pérez-Montero, E., Vílchez, J. M., & Papaderos, P. 2012, ApJ, 749, 185
- Atek et al. (2011) Atek, H., Siana, B., Scarlata, C., et al. 2011, The Astrophysical Journal, 743, 121
- Bassett et al. (2019) Bassett, R., Ryan-Weber, E. V., Cooke, J., et al. 2019, MNRAS, 483, 5223
- Bian et al. (2016) Bian, F., Kewley, L. J., Dopita, M. A., & Juneau, S. 2016, ApJ, 822, 62
- Bruzual & Charlot (2003) Bruzual, G., & Charlot, S. 2003, MNRAS, 344, 1000
- Cardamone et al. (2009) Cardamone, C., Schawinski, K., Sarzi, M., et al. 2009, Monthly Notices of the Royal Astronomical Society, 399, 1191
- Ceverino et al. (2018) Ceverino, D., Klessen, R., & Glover, S. 2018, ArXiv e-prints, arXiv:1801.10382
- Cohn et al. (2018) Cohn, J. H., Leja, J., Tran, K.-V. H., et al. 2018, ApJ, 869, 141
- Conroy et al. (2009) Conroy, C., Gunn, J. E., & White, M. 2009, ApJ, 699, 486
- Cowley et al. (2016) Cowley, M. J., Spitler, L. R., Tran, K.-V. H., et al. 2016, MNRAS, 457, 629
- de Barros et al. (2016) de Barros, S., Vanzella, E., Amorín, R., et al. 2016, A&A, 585, A51
- Elbaz et al. (2011) Elbaz, D., Dickinson, M., Hwang, H. S., et al. 2011, A&A, 533, A119
- Ferland et al. (2013) Ferland, G. J., Porter, R. L., van Hoof, P. A. M. andWilliams, R. J. R., et al. 2013, Rev. Mexicana Astron. Astrofis., 49, 137
- Forrest et al. (2017) Forrest, B., Tran, K.-V. H., Broussard, A., Allen, R. J., & et al. 2017, ApJ, 838, L12
- Forrest et al. (2018) Forrest, B., Tran, K.-V. H., Broussard, A., et al. 2018, ApJ, 863, 131
- Forrest et al. (2016) Forrest, B., Tran, K.-V. H., Tomczak, A. R., et al. 2016, ApJ, 818, L26
- Förster Schreiber et al. (2011) Förster Schreiber, N. M., Shapley, A. E., Erb, D. K., et al. 2011, ApJ, 731, 65
- Giacconi et al. (2002) Giacconi, R., Zirm, A., Wang, J., et al. 2002, The Astrophysical Journal Supplement Series, 139, 369
- Grogin et al. (2011) Grogin, N. A., Kocevski, D. D., Faber, S. M., et al. 2011, ApJS, 197, 35
- Guo et al. (2016) Guo, Y., Rafelski, M., Faber, S. M., et al. 2016, ApJ, 833, 37
- Ho et al. (1997) Ho, L. C., Filippenko, A. V., & Sargent, W. L. W. 1997, ApJ, 487, 568
- Holden et al. (2016) Holden, B. P., Oesch, P. A., González, V. G., et al. 2016, The Astrophysical Journal, 820, 73
- Izotov et al. (2016) Izotov, Y. I., Guseva, N. G., Fricke, K. J., & Henkel, C. 2016, MNRAS, 462, 4427
- Izotov et al. (2011) Izotov, Y. I., Guseva, N. G., & Thuan, T. X. 2011, The Astrophysical Journal, 728, 161
- Izotov et al. (2018) Izotov, Y. I., Schaerer, D., Worseck, G., et al. 2018, MNRAS, 474, 4514
- Jaskot & Oey (2013) Jaskot, A. E., & Oey, M. S. 2013, ApJ, 766, 91
- Juneau et al. (2011) Juneau, S., Dickinson, M., Alexander, D. M., & Salim, S. 2011, ApJ, 736, 104
- Kacprzak et al. (2016) Kacprzak, G. G., van de Voort, F., Glazebrook, K., et al. 2016, ApJ, 826, L11
- Kennicutt (1998) Kennicutt, R. C. 1998, ARA&A, 36, 189
- Koekemoer et al. (2011) Koekemoer, A. M., Faber, S. M., Ferguson, H. C., et al. 2011, ApJS, 197, 36
- Kriek et al. (2009) Kriek, M., van Dokkum, P. G., Labbé, I., et al. 2009, ApJ, 700, 221
- Kriek et al. (2011) Kriek, M., van Dokkum, P. G., Whitaker, K. E., et al. 2011, ApJ, 743, 168
- Krumholz et al. (2017) Krumholz, M. R., Burkhart, B., Forbes, J. C., & Crocker, R. M. 2017, ArXiv e-prints, arXiv:1706.00106
- Lawrence et al. (2007) Lawrence, A., Warren, S. J., Almaini, O., et al. 2007, MNRAS, 379, 1599
- Leja et al. (2017) Leja, J., Johnson, B. D., Conroy, C., van Dokkum, P. G., & Byler, N. 2017, ApJ, 837, 170
- Lofthouse et al. (2017) Lofthouse, E. K., Houghton, R. C. W., & Kaviraj, S. 2017, MNRAS, 471, 2311
- Maseda et al. (2013) Maseda, M. V., van der Wel, A., da Cunha, E., et al. 2013, The Astrophysical Journal, 778, L22
- Maseda et al. (2018) Maseda, M. V., van der Wel, A., Rix, H.-W., Momcheva, I., & et al. 2018, ApJ, 854, 29
- Maseda et al. (2014) Maseda, M. V., van der Wel, A., Rix, H.-W., et al. 2014, ApJ, 791, 17
- McLean et al. (2012) McLean, I. S., Steidel, C. C., Epps, H. W., Konidaris, N., & et al. 2012, in Society of Photo-Optical Instrumentation Engineers (SPIE) Conference Series, Vol. 8446, Society of Photo-Optical Instrumentation Engineers (SPIE) Conference Series
- Mitra et al. (2013) Mitra, S., Ferrara, A., & Choudhury, T. R. 2013, MNRAS, 428, L1
- Momcheva et al. (2016) Momcheva, I. G., Brammer, G. B., van Dokkum, P. G., et al. 2016, ApJS, 225, 27
- Naidu et al. (2018) Naidu, R. P., Forrest, B., Oesch, P. A., Tran, K.-V. H., & Holden, B. P. 2018, MNRAS, 478, 791
- Nakajima et al. (2016) Nakajima, K., Ellis, R. S., Iwata, I., et al. 2016, ApJ, 831, L9
- Nakajima & Ouchi (2014) Nakajima, K., & Ouchi, M. 2014, MNRAS, 442, 900
- Nanayakkara et al. (2016) Nanayakkara, T., Glazebrook, K., Kacprzak, G. G., et al. 2016, ApJ, 828, 21
- Nanayakkara et al. (2017) —. 2017, MNRAS, 468, 3071
- Ouchi et al. (2009) Ouchi, M., Mobasher, B., Shimasaku, K., et al. 2009, The Astrophysical Journal, 706, 1136
- Papovich et al. (2015) Papovich, C., Labbé, I., Quadri, R., et al. 2015, ApJ, 803, 26
- Peebles (1970) Peebles, P. J. E. 1970, AJ, 75, 13
- Persson et al. (2013) Persson, S. E., Murphy, D. C., Smee, S., et al. 2013, PASP, 125, 654
- Reddy et al. (2018) Reddy, N. A., Shapley, A. E., Sanders, R. L., et al. 2018, ApJ, 869, 92
- Roberts-Borsani et al. (2016) Roberts-Borsani, G. W., Bouwens, R. J., Oesch, P. A., et al. 2016, ApJ, 823, 143
- Robertson et al. (2015) Robertson, B. E., Ellis, R. S., Furlanetto, S. R., & Dunlop, J. S. 2015, The Astrophysical Journal, 802, L19
- Robertson et al. (2013) Robertson, B. E., Furlanetto, S. R., Schneider, E., et al. 2013, ApJ, 768, 71
- Salmon et al. (2015) Salmon, B., Papovich, C., Finkelstein, S. L., et al. 2015, ApJ, 799, 183
- Schmidt (1959) Schmidt, M. 1959, ApJ, 129, 243
- Scoville et al. (2007) Scoville, N., Aussel, H., Brusa, M., et al. 2007, ApJS, 172, 1
- Smit et al. (2014) Smit, R., Bouwens, R. J., Labbé, I., et al. 2014, ApJ, 784, 58
- Spitler et al. (2014) Spitler, L. R., Straatman, C. M. S., Labbé, I., et al. 2014, The Astrophysical Journal, 787, L36
- Straatman et al. (2016) Straatman, C. M. S., Spitler, L. R., Quadri, R. F., et al. 2016, ApJ, 830, 51
- Straughn et al. (2008) Straughn, A. N., Meurer, G. R., Pirzkal, N., et al. 2008, AJ, 135, 1624
- Straughn et al. (2009) Straughn, A. N., Pirzkal, N., Meurer, G. R., et al. 2009, AJ, 138, 1022
- Strom et al. (2017) Strom, A. L., Steidel, C. C., Rudie, G. C., et al. 2017, ApJ, 836, 164
- Tacconi et al. (2013) Tacconi, L. J., Neri, R., Genzel, R., et al. 2013, ApJ, 768, 74
- Tang et al. (2019) Tang, M., Stark, D. P., Chevallard, J., & Charlot, S. 2019, MNRAS, 489, 2572
- Tomczak et al. (2016) Tomczak, A. R., Quadri, R. F., Tran, K.-V. H., et al. 2016, ApJ, 817, 118
- Tomczak et al. (2014) —. 2014, ApJ, 783, 85
- Tran et al. (2017) Tran, K.-V. H., Alcorn, L. Y., Kacprzak, G. G., et al. 2017, ApJ, 834, 101
- Tran et al. (2015) Tran, K.-V. H., Nanayakkara, T., Yuan, T., et al. 2015, ApJ, 811, 28
- Trump et al. (2015) Trump, J. R., Sun, M., Zeimann, G. R., et al. 2015, ApJ, 811, 26
- Trump et al. (2013) Trump, J. R., Konidaris, N. P., Barro, G., et al. 2013, ApJ, 763, L6
- van der Wel et al. (2012) van der Wel, A., Bell, E. F., Häussler, B., et al. 2012, ApJS, 203, 24
- van der Wel et al. (2011) van der Wel, A., Straughn, A. N., Rix, H.-W., et al. 2011, ApJ, 742, 111